1. Introduction
With the growing demand for parts precision, quality control is integrated throughout the product development process, from design to inspection. As the final step of product development, measurement and inspection are significant to the performance of the complex assembly. After the emergence of intelligent workshops, most of the workshop technicians were assigned to work in quality inspection positions. For the development of intelligence in manufacturing, many engineers and researchers have conducted related research to solve the slow-speed and low-accuracy problems due to long hours of manual inspection of products [
1,
2,
3,
4,
5,
6]. At present, intelligent measurement is mainly employed in the fields of industry, machinery, medical treatment and digitization of cultural relics, and the measurement methods for products are divided into contact and non-contact measurements. In contact measurement, many scholars use coordinate measuring machines (CMM) for product measurement. This highly accurate method can accomplish some measurements with high requirements for specific tolerances. However, the measurement process using this method relies on manual intervention. Nowadays, with the development of measurement technology, researchers conducted the non-contacted measurement method to overcome the disadvantages of the contacted measurement method, and the non-contact measurement method has gradually been widely used in industry applications. Reconstruction and measurement via optical methods have become popular methods recently. The popular categories of optical measurement methods include laser-based measurement systems, photogrammetry, and fringe projection [
7,
8]. Many scholars have used optical measurement methods for object two-dimensional (2D) defect detection [
9]. Wang et al. combined the laser infrared thermography method with deep learning to detect the defect shape and size of carbon fiber-reinforced polymer [
10]. It used a novel method to determine the defect depth via the long-short-term memory recurrent neural network (LSTM-RNN) model. Still, this method cannot obtain an accurate measurement result compared with the traditional measurement method and does not obtain the width and length information. Cao et al. reconstructed the 3D surface of the rail by using the structured light system and analyzed the defect of the reconstruction data [
11]. This study proposed using the line laser scanning method to realize the rail surface defect inspection, but it only obtains the 2D defect area information. Tao et al. used the grating structured light for the 3D reconstruction of objects with a six-step phase unwrapping algorithm [
12]. This study used a cost-effective solution for 3D measurement. However, the photoelastic fringes are influenced by the polycarbonate disk. Because the disk may be deformed after loading, resulting in unwanted fringes. Its reconstruction speed and accuracy are not ideal. The accuracy reached 60–80 mm. Li et al. used the mobile laser scanning method to estimate and calculate the total leaf area [
13]. This study solved the accuracy problem by controlling the moving speed. Although the accuracy has been improved, the moving distance of this study is too large, which is suitable for measuring large objects but not for high-precision workpiece measurement.
In the defect detection and measurement research area, Chen et al. proposed a method to identify and classify robotic weld joints by using line laser scanning light and deep learning [
14]. Xiao et al. classified welded joints as discontinuous and continuous by using deep learning and point cloud data obtained from the line laser scanning method [
15]. Due to exceeding the qualified height of the avalanche photodiode chips, the transistor outline optical devices are always discarded. Liu et al. used the line laser scanning approach to detect overflow silver from avalanche photodiode chips. They designed and implemented an optical 3D slice intelligent measurement system utilizing the line laser scanning method [
16]. Although most of them can complete the 3D reconstruction and 3D measurement of the object, a common problem is that the measurement process is highly reflective due to the light intensity caused by the object measurement material, which brings complex noise and the accuracy of the measurement results of these studies is greatly affected [
17,
18].
To deal with the problem of high reflection during the measurement process, some related research has also been performed in recent years. He et al. reconstructed the object by using a dual monocular structured light system to obtain different angle object images and performed a fusion of images to compensate for the reflective area [
19]. Zhu proposed a method based on enhanced polarization and Gray-Code fringe structured light to reconstruct high dynamic range objects [
20]. Karami et al. proposed a fusion method to replace the low spatial frequencies of photometric stereo with the corresponding photogrammetric frequencies to correct the low frequencies based on the Fourier domain [
21]. These studies captured lots of images and used the image fusion method to deal with the reflective problem and realize the 3D reconstruction and measurement. However, this method needs to capture many images and spend time fusing the images captured in different conditions. Pei et al. proposed a hybrid approach to reconstructing objects via fringe projection profilometry and photometric stereo technology to obtain the data used in the deep neural network to estimate the normal map of the object surface to obtain the full intact point cloud [
22]. This study can obtain submillimeter-level measurement results, but it needs to perform the phase unwrapping, which is time-consuming. He proposed a laser tracking frame-to-frame method to solve the reflective problem and reconstruct the transparent object [
23]. Wu used the grating fringe structured light to encode the unsaturated luminance of the pre-projected multiple grating fringe patterns, so that each position of the measured object and the image pixel position are guaranteed to be unsaturated grayscale values, and it can avoid the object reflection phenomenon during the measurement process [
24]. The above studies determined which pixel points to keep by setting the threshold with the help of the camera model and the parameters of the specific camera pixel size or generating different luminance of the projected images. Although these methods are feasible, they rely on a priori values to determine the threshold range, and the threshold range can influence the measurement accuracy. Li et al. proposed a post-processing-based approach to reconstruct three-dimensional shapes [
25]. They obtained a complete reconstruction of the object by projecting the grating fringe patterns which do not overlap onto the surface of the measured object, ignored part of the reflective region, processed only the non-reflective region, and then performed a 3D point cloud matching after the rough reconstruction of the object contour by the moiré profilometry. So, this measurement loses shape detail in the reflective areas.
Based on the above current state of research, the methods in the field of dealing with the reflection problem can be summarized in the following three categories: (1) adjusting the luminance to ensure the grey values of the pixel points in the acquired image are not overexposed; (2) acquiring images from different angles and then performing multi-angle reconstruction of the object shape; and (3) adjusting the exposure for multiple exposures and then subjecting the images to a fusion operation to obtain an image that is not overexposed for reconstruction. These methods require capturing multiple images or adjusting the luminance and light intake. The process is cumbersome and time-consuming, and it cannot satisfy the real industrial assembly line that only captures images once. So, this study proposed an image segmentation method based on deep learning to solve the reflection effects during the measurement process of one image instead of multiple images.
Also, many scholars have conducted research in the field of flatness detection. The standard method to measure flatness is to obtain every point on the measured object with the help of mechanical precision instruments. Vanrusselt [
26] and Pathak [
27] majorly reviewed contact flatness measurement methods, and they thought the flatness results via contact measurement are always affected by the used artefact error. The contact measurement has another disadvantage. It is not only slow but also requires manual assistance to complete the measurement. Xiao et al. [
28] analyzed and performed compensations for the thin-walled valve body parts’ surface flatness by using the contact measurement with the help of the wireless touch-trigger probe installed on the three-axis vertical machine. Wang [
29] proposed a way to obtain the circular saw flatness by using the point laser displacement sensor. Although it can extract the point cloud of the measured object via the non-contact measurement method, the efficiency of the measurement is slow, and he just compared the experiment results with the contact measurement result. Liu et al. [
30] proposed a flatness error evaluation method using the Marine predator algorithm, which aimed to reduce the calculation time effectively, and he compared it with the particle swarm optimization algorithm and other common plane fitting methods. However, this method cannot be applied to parts with complex surface texture. This study proposed using point cloud registration to obtain the measured workpiece flatness error to determine whether the workpiece manufacturing qualified according to the specific tolerance. Generally, the average measurement accuracy can reach 70–130 microns above these studies.
To better fit the actual measurement scenario and obtain faster and higher accuracy measurement results, this study focused on the reflection of the object and the overall flatness error assessment according to the designed computer-aided design (CAD) model by using the line laser scanning reconstruction system.
The rest of this paper is organized as follows.
Section 2 constructs the principle of line laser 3D reconstruction.
Section 3 describes the calibration process of the line laser system and proposes a method to reduce the time spent in the step motor sliding system calibration process.
Section 4 constructs the approach to solve the reflective scattering region on the specific reflective material objects with the line laser turned on. It also compares the image difference method with the proposed deep learning-based image segmentation approach, hence improving the structure of the neural network to obtain more accurate laser region segmentation results.
Section 5 constructs an overall flatness error assessment method. At the end of the paper, the proposed and improved method is verified through experiments in
Section 6, and, finally, the conclusions are given through the experimental results in
Section 7.
3. The Process of the System Calibration and Light Plane Fitting
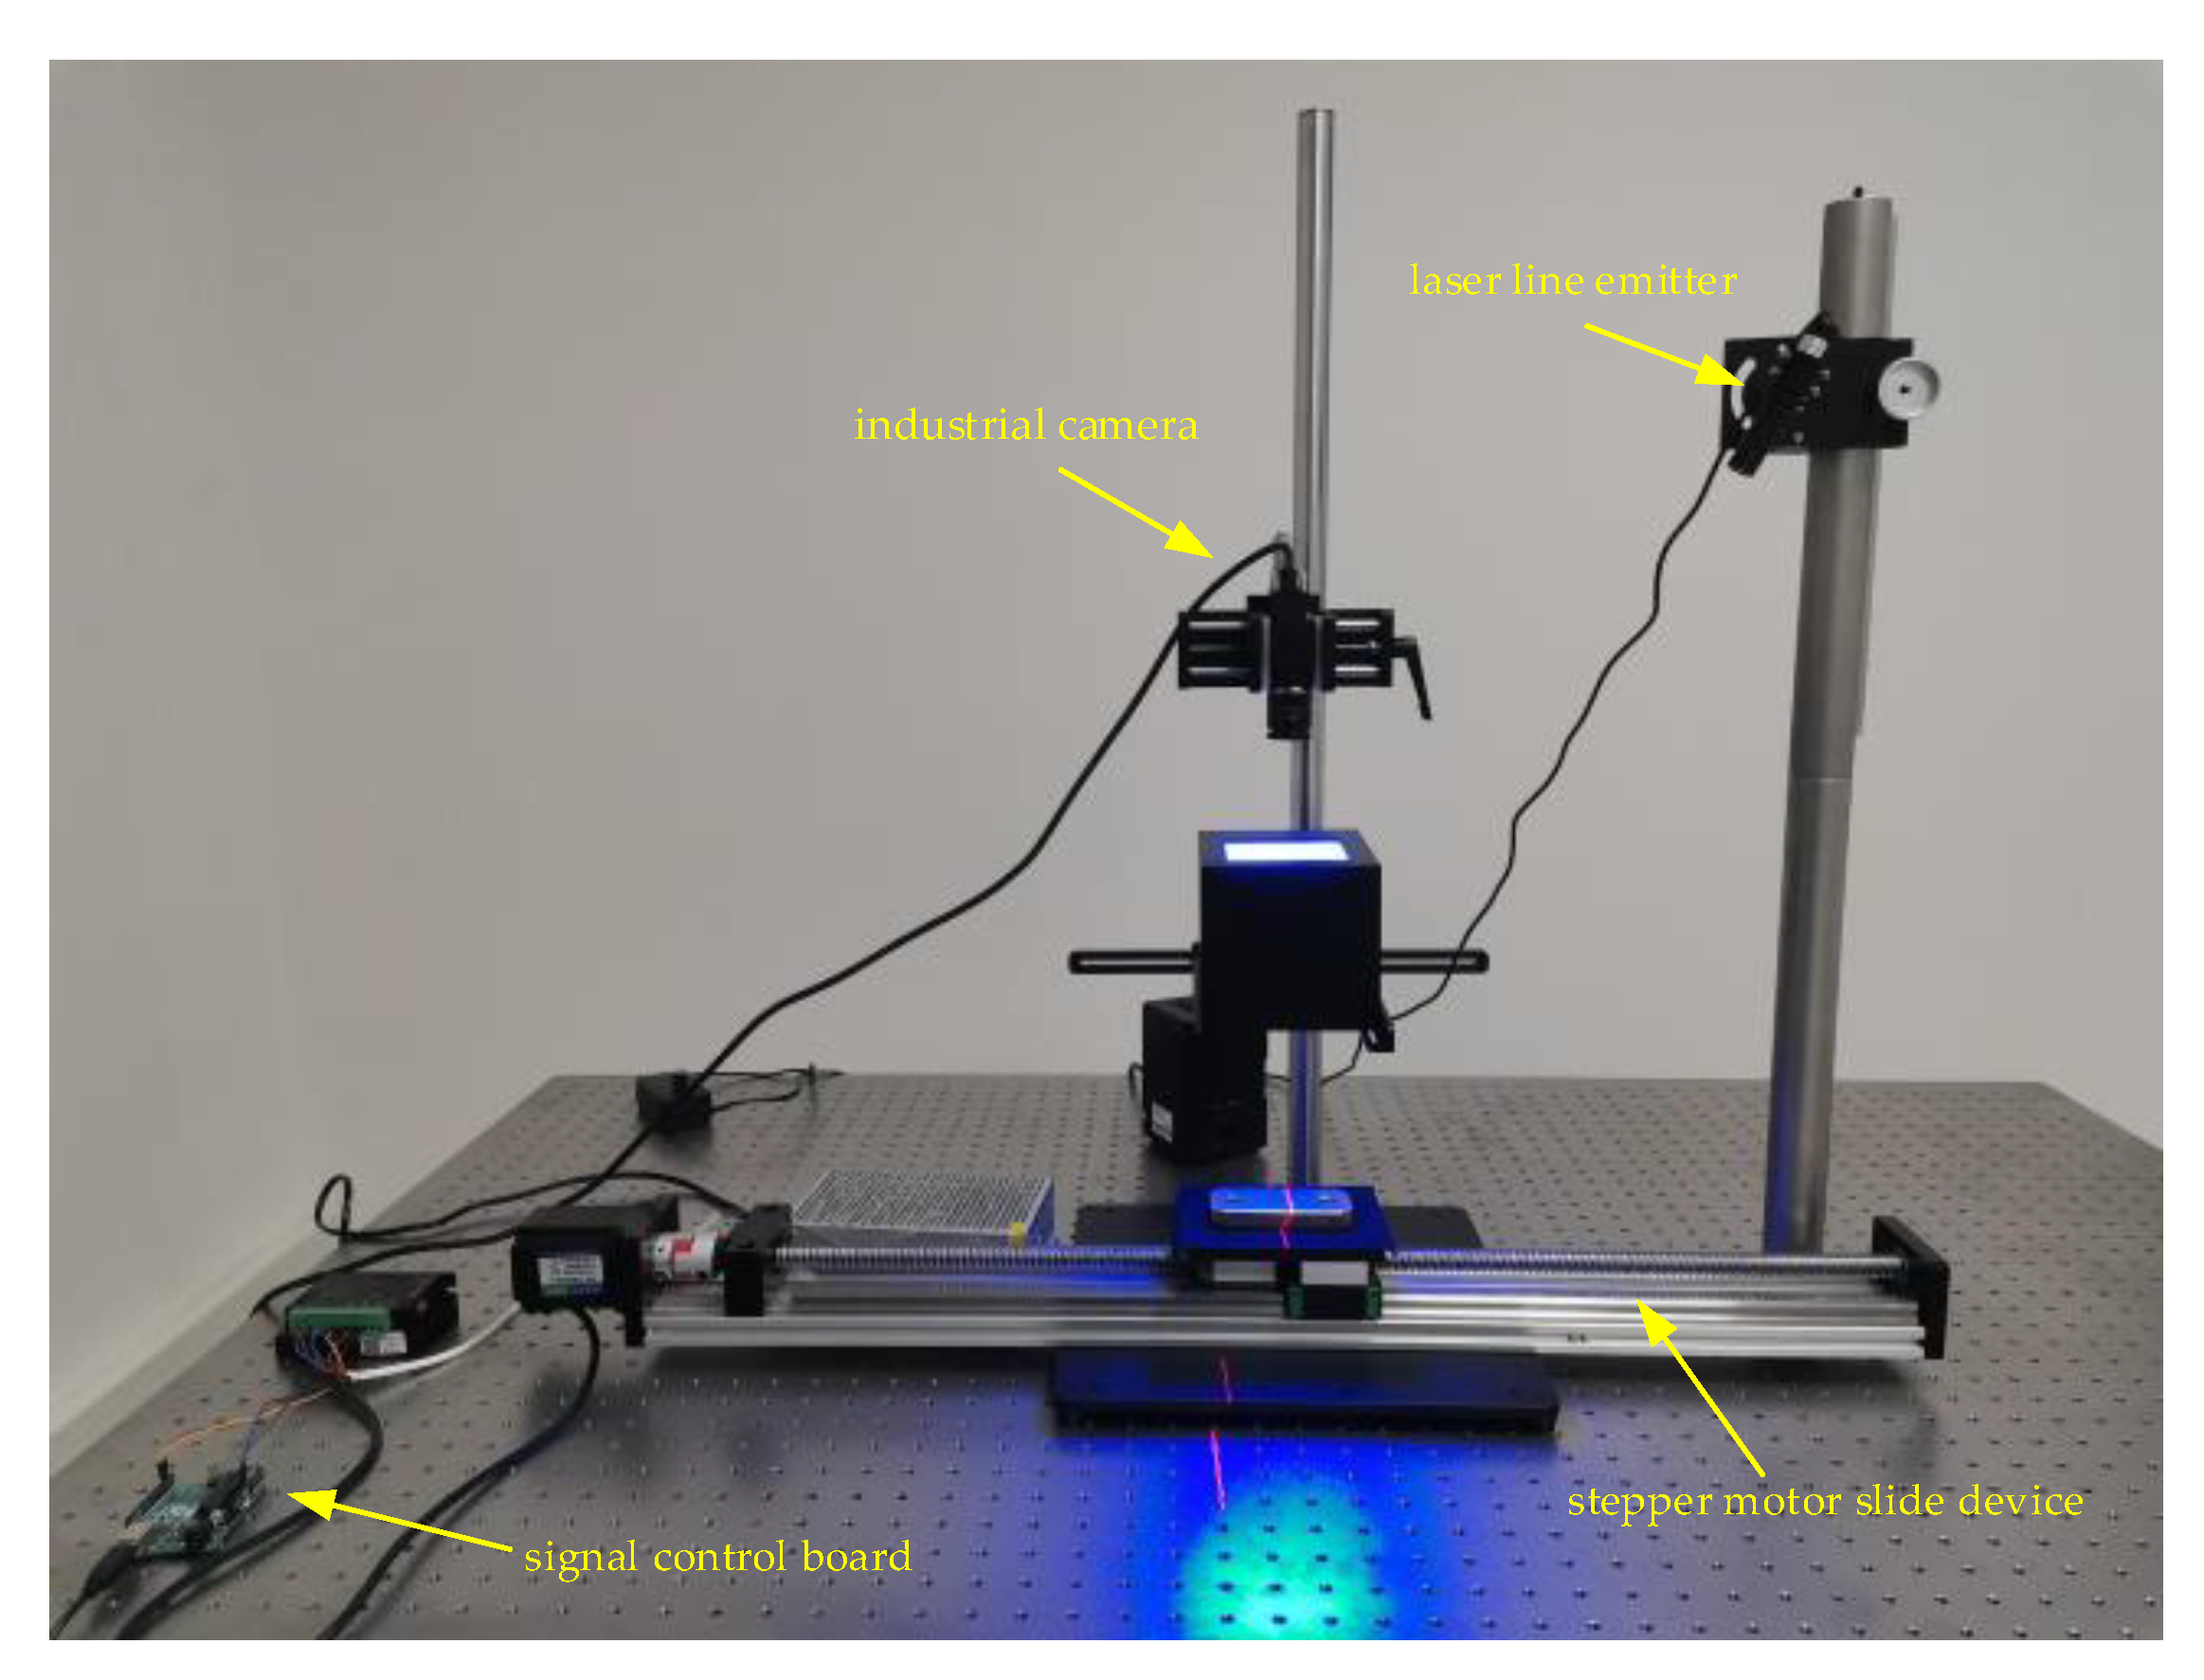
There are three steps in the line laser scanning system calibration process, i.e., industrial camera calibration, stepper motor slide device calibration and line laser plane fitting.
3.1. Industrial Camera Calibration
Four coordinate systems are involved with the following mapping relationship in
Figure 3 between the camera imaging and real-world position. Due to the unavoidable errors in the processing and assembly of the industrial camera optical lens and CMOS sensor, the imaging of the camera will be aberrated due to these factors, leading to the deviation of its actual imaging point and the theoretical corresponding imaging point position. Therefore, the aberrations need to be eliminated by utilizing camera calibration. At the same time, the parameters of the camera imaging model are obtained, which reveal the mapping relationship between the real object and the pixel coordinate system. Then, the 3D coordinate conversion can be completed using the calibration parameters.
In
Figure 3, The world coordinate system (
Ow-
XwYwZw) refers to the coordinate position of the object in real space. Each calibrated image has its coordinate system. The camera coordinate system (
Oc-
XcYcZc) takes the center of the optical lens as the origin, and it can complete the conversion between itself and the world coordinate system by rotation and translation. The image coordinate system (
Oxy-
xy) is a projection of the image onto the image plane in the camera coordinate system, and it only needs to establish two-dimensional imaging coordinates. The pixel coordinate system (
Ouv-
uv) is built on the pixel points on the captured image. The imaging sensor does not guarantee keeping the vertical installation with the camera’s optical axis, so it will produce the angular mapping relationship of coordinates, which needs to be realized by affine transformation. According to the camera image mapping, the relationship is expressed in Equation (1), where the parameters
Pi and
Po are the internal and external reference matrices obtained from the camera calibration, respectively.
However, the actual situation is that due to the design of the optical lens and non-linear factors such as industrial camera CMOS optical sensor position installation, it will lead to deviations in the imaging. The captured image produced the aberration phenomenon of internal concave and external convexity. To further improve the accuracy of calibration results, the elimination of radial distortion was researched [
31], and the true mapping relationship equation was obtained as the following equation:
where
(x,y) is the ideal coordinate,
(m,n) is the radial distortion coordinate,
k1,
k2, and
k3 are Taylor expansion coefficients, and
Odx and
Ody are the distortion center coordinates, respectively. The internal and external parameters of the camera can be obtained by identifying the feature points of the calibrated target object.
3.2. Improved Stepper Motor Slide Calibration
Since the line laser dynamic scanning can only acquire the reconstruction data of one laser stripe at a time, the motion device needs to be calibrated for direction and distance.
Most of the traditional motion platform calibration methods are performed with the help of high-precision standard 3D target objects with characteristic points. However, due to the high price of these targets, it is too expensive to use them only for calibration in the measurement process, which makes the budget too high, and the number of characteristic points is limited. Therefore, some scholars also performed the calibration task of motion stages using target feature points of 2D targets. They completed the calibration data of the motion platform by detecting the displacement distance of the upper left corner point or the center corner point of the checkerboard calibration board several times. This approach first requires multiple movements, which makes the calibration process complicated. Secondly, they are only calibrated based on a specific single corner point on the 2D targets, so the accuracy of the data obtained is not accurate enough.
This study proposed an improved calibration method based on motion vectors and mean values to address these problems. By detecting all the corner points of the 2D chessboard grid at once, this method ensures calibration accuracy and saves time by completing the calibration in one operation.
Figure 4 shows the improved stepper motor slide device calibration algorithm proposed in this study.
The motion vector-based calibration method detects the target feature points of the two sets of images. After judging their displacement differences, the pixel coordinates of the feature points at two different locations are converted to the same coordinate system according to the previous camera calibration parameters. Finally, the world coordinates of the two are differenced according to the three directional axes by Equation (3). The unit move distance calibration is calculated from the moving displacement and the camera frame rate according to Equation (4), where the parameter
(X0,
Y0,
Z0) is the world coordinates converted from feature points acquired before moving,
(Xm,
Ym,
Zm) is the world coordinates obtained from feature point conversion after moving, and
n represents the number of images acquired by the camera in one second, which is also the camera frame rate. The obtained calibration result provides the conditions for the subsequent point cloud splicing operation.
3.3. Light Plane Fitting
The light plane fitting has two purposes. The first is to determine the relative position relationship between the line laser emitter device and the industrial camera, and the second is to determine the reference plane for the 3D reconstruction of the object under measurement. That means the subsequent reconstruction is performed on the light plane equation obtained from the fitting.
The light plane fitting is a two-step operation. First, the centerline of the line laser stripe needs to be extracted. This is because the intensity of the light conforms to a Gaussian model distribution under the ideal condition, and the centerline is the brightest, contains the most information, and is the most accurate. The second step is to fit the line laser light plane equation according to the pixels extracted from the centerline of the line laser stripes projected on the calibration plate in different positions.
Figure 5 shows the schematic diagram of the light plane fitting.
The most commonly used line laser extraction methods include the extreme value method, the Steger algorithm based on normal vector calculation, the directional template algorithm and the grey centroid algorithm. The extreme value method and the grey centroid algorithm have the advantage of less computation time, but the centerline extraction accuracy is low. The Steger algorithm can yield high-accuracy extraction results, but it takes a long time to calculate due to the Hessian matrix, which consists of second derivatives. The directional template algorithm requires convolution of the pixel points with the template, which is also time-consuming.
Many scholars have conducted line laser centerline extraction algorithms in recent years. This study used a hybrid improved line laser centerline extraction algorithm proposed by Mao et al. [
32]. The algorithm combines the skeleton thinning algorithm and the grey centroid algorithm. It improved the speed of the thinning operation for the original skeleton thinning algorithm. A high-power weighted grey centroid method was enhanced based on the grey centroid algorithm to ensure accuracy. This algorithm is not as fast as the grey centroid algorithm, but it considers the speed and precision of line laser centerline extraction.
Figure 6 is the result of line laser centerline extraction.
Then, the light plane equation listed as the following Equation (5) is fitted by the least-squares method to find the light plane equation based on the results of the extracted line laser centerline with different positions and finally obtain the parameters of the light plane.
4. Removing the Reflection Affected by the Object Material
After the calibration of the system is completed, the calibration parameters of the camera and the light plane fitting parameters required for the 3D reconstruction are obtained. Then, according to these parameters, the next step is to scan and reconstruct the object. Although 3D reconstruction and measurement of objects can be accomplished on some dark plastic objects, on reflective objects of special materials such as metals, the line laser stripe is reflective and scattered, leading to inaccurate reconstruction of objects. Thus, this study was conducted to solve the problems caused by reflection and scattering.
4.1. Traditional Method
The image difference method is used in highlight image processing to make it easier to deal with overexposure problems and minimize the number of image acquisitions. This algorithm mainly calculates the corresponding grey value difference between the foreground image and the background image, as shown in the following Equation (6), where
Gfore is the grey value of the specific pixel in the foreground image,
Gback is the grey value of the particular pixel in the background image, and
Gdiff is the difference grey value of the corresponding pixel in the foreground image and the background image. The noise of the other light sources without the line laser stripe can be eliminated by highlighting the regional location of the line laser stripe using this algorithm.
This study also used the image difference method in the 3D measurement of objects made of glass. After the image difference operation, to speed up the line laser centerline extraction and avoid the pixel-by-pixel calculation of the whole image, the edge detection operator is applied to extract the edges of the line laser stripe.
Although the influence of other noise can be removed, there is still a scattering phenomenon at the edge of the obtained line laser stripe due to the color and material of the measured object surface, and the result is shown in
Figure 7, which also affects the reconstruction accuracy. Although this algorithm can reduce the number of images acquired compared to the multiple exposure method and the photometric stereo method, it still requires one acquisition for the foreground image and one for the background image (with the laser turned on and off, respectively). This does not meet the needs of a real assembly line for 3D measurement in one process.
4.2. A Novel Image Segmentation Method Based on Deep Learning
To further ensure that the speed and accuracy of the line laser centerline extraction is not affected by the reflection and scattering phenomenon, it is necessary to determine the real area of the line laser stripe. This study proposed a method based on deep learning image segmentation to determine the line laser centerline extraction region to reduce the effect of reflection and scattering and the time of centerline extraction.
Deep learning requires a certain amount of data to train the model. During the scanning of the measured object, many images were collected in this study.
Figure 8 shows the schematic diagram of the captured data.
Due to the specificity of the measured object and the collected data, no publicly available dataset can be applied in this study, so the data enhancement operation was performed on the collected image data. Common image enhancement methods such as the gamma transform method, the logarithmic transform algorithm, the global image histogram equalization method, the restricted contrast adaptive histogram equalization method and the Laplace enhancement method are performed to expand the dataset.
Figure 9 shows the schematic diagram of the data generated by different enhancement algorithms.
After the data enhancement was completed, the dataset was annotated. The annotation was divided into three categories: the real laser line, the reflective scattering artifact, and the ambient light. The schematic diagram of the labelled result is shown in
Figure 10 below.
Regarding selecting deep learning network models, the training model is currently divided into Vision Transformer models and convolutional neural networks. Vision Transformer models can learn image features well compared to the traditional convolutional neural network which divides the image into multiple patches to learn the features in the patches and the global features between the patches [
33,
34]. However, the Transformer models require a larger number of datasets than the convolutional neural network to obtain a good result of training parameters and models. Although image enhancement algorithms expand the dataset, this study used the convolutional neural network as the training model, considering the limited number of datasets.
The ConvNeXt [
35] model drew on the Swin-Transformer model’s network structure advantages. ConvNeXt adjusted the stacking block ratio to close to that of the Transformer model, adjusted the original ResNeXt [
36] convolutional kernel size, and then introduced the MobileNet [
37] depth-wise convolution to achieve the effect of Swin-Transformer self-attentive mechanism for interaction and fusion of feature information in spatial dimensions. In addition, ConvNeXt increased the size of the convolution kernel perceptual field according to the size of Swin-Transformer convolutional kernel size, and the inverse bottleneck structure of MobileNetV2 [
38] was introduced to reduce the computation. Due to the above improvements, the training result of ConvNeXt is beyond that of Transformer.
Figure 11 shows the comparison diagram schematic of ConvNeXt, Swin-Transformer and ResNeXt blocks.
During the experiment, further improvements were made to optimize the original ConvNeXt to improve the accuracy of the segmentation of the line laser stripe further. In this study, the projection area of the line laser stripe is placed in the middle of the field of view to make the industrial camera capture the field of view conform to the imaging range of objects of different heights. Then, the position of the line laser stripe has certain spatial information.
To make the convolutional neural network notice the spatial location feature information of the image, this study introduced the convolutional block attention module (CBAM) [
39] in the original ConvNeXt network. This module learns the features from the image channel and the image space, respectively, so that it can notice the color, brightness, position and other features of the image. Moreover, to enable the network model to learn the features of the image faster in as few iterative epochs as possible, this study introduced the dilated convolution kernel, which was proposed in DeepLab [
40], into the convolution kernel of ConvNeXt and CBAM. It can control the resolution of the response better when calculating the feature response by expanding the convolution kernel and expanding the perceptual field of the convolution kernel to integrate more feature information without increasing the number of parameters and computational effort.
Figure 12 shows the improved network structure model of this study.
5. An Overall Flatness Inspection of the Measured Object
After solving the reflection and scattering problem, the reconstruction of the measurement object by line laser scanning is improved. The flatness of the tolerance feature in the industrial manufacturing and assembly process determines whether the product conforms to the designed standard parts model and whether it is within the designed tolerance range.
Flatness error is the variation between the actual surface being measured and its ideal surface. When measuring flatness, two ideal planes must be determined, and these superior planes should be tangent to the high or low point of the measured surface. These two places are the locations where the two ideal planes are located, respectively.
Figure 13 represents the flatness error schematic, where the red color indicates the actual measurement plane, and the two upper and lower rectangles indicate the intersecting ideal position reference planes.
The existing flatness error measurement methods usually require high-precision optics and auxiliary equipment. However, there are shortcomings in the traditional flatness error measurement methods. First of all, the measurement needs to be completed with the help of high-precision manufacturing instruments, and the cost of measurement is high. Secondly, some methods measure points by contacting points or along the linear direction, so the speed and efficiency of measurement are very slow, and the operation is complicated. Also, the determination of flatness error by determining the farthest point of the actual measurement object surface through manual selection cannot guarantee the accuracy of the farthest point selection. Finally, the flatness error is judged by a few characteristic points, which makes the measurement accuracy inaccurate.
Therefore, this study proposed a method to register the scanned point cloud results of the measured object with the CAD model of the standard part designed by computer vision to complete the flatness error evaluation. Instead of determining the flatness error only by multiple feature points, this method takes into account the flatness error of the whole surface of the measured object.
The CAD model data are preprocessed in point cloud registration to extract geometric information. Then, sampling is performed to generate a dense point grid to obtain the point cloud data of the standard CAD model. The measured point cloud must be downsampled to retain its general features to match the standard CAD point cloud. The downsampling can further reduce the number of point cloud registration processes and improve the speed of point cloud registration. This study used the grid average downsampling algorithm to implement point cloud downsampling. This algorithm first divides point clouds into very small grids to contain some points. These points are averaged or weighted to obtain a point, replacing all the original grid points.
Figure 14 is the result after downsampling the schematic diagram.
During the registration process, this study chose the Fast Point Feature Histogram (FPFH) algorithm [
41] for rough registration to bring two far-apart point cloud data closer. FPFH is an algorithm used to describe features in point cloud data. Firstly, it finds the
k nearest neighbor points to the point in the point cloud. It calculates the normal directions of points in its neighborhood for each point and their relative positions to the center point. The normal direction and relative position are then converted into a histogram to represent the neighborhood’s points distribution. The histogram features of each point are merged with the features of other points in its neighborhood to describe the geometric structure information of the entire neighborhood comprehensively. The combined features are normalized to facilitate comparison and matching between different areas. Then, this study used the Iterative Closest Point (ICP) algorithm [
42] for point cloud registration. The principle of the ICP algorithm is to rigidly transform one piece of point cloud data to match another piece of point cloud in space by rotation and translation, which is more similar to the principle of industrial camera calibration to obtain the external parameters in this study. The transformation of the point cloud can be carried out by Equation (7),
where, the parameters
α,
β,
γ are the angle of rotation corresponding to the
X,
Y,
Z axis, respectively, and
tx,
ty,
tz are the translation distance corresponding to the
X,
Y,
Z axis,
(xi′, yi′, zi′) is the coordinate of the point cloud to be registered,
(xi, yi, zi) is the target point cloud coordinate.
The rotation parameters and translation parameters corresponding to each axis are estimated through iterations until the loss function reaches the minimum value, and the parameters corresponding to the minimum value are used as the transformation parameters for point cloud registration to complete the point cloud transformation and point cloud registration. After point cloud registration, a threshold value is set by the production flatness tolerance according to the measured object, and the measured object larger than the threshold value is designated as an unqualified object.

 ,
, 


