Extension of Fiber Bragg Grating Ultrasound Sensor Network by Adhesive Couplers


1
Department Mechanical and Aerospace Engineering, North Carolina State University, Raleigh, NC 27695, USA
2
Department of Civil, Construction and Environmental Engineering, North Carolina State University, Raleigh, NC 27695, USA
*
Author to whom correspondence should be addressed.
Photonics 2023, 10(12), 1366; https://doi.org/10.3390/photonics10121366
Submission received: 30 October 2023
/
Revised: 1 December 2023
/
Accepted: 8 December 2023
/
Published: 12 December 2023
(This article belongs to the Special Issue Advanced Photonic Sensing and Measurement II)
Abstract
:Previous studies demonstrated coupling of acoustic guided waves from one optical fiber to another through a simple adhesive bond coupler. This paper experimentally utilizes such an adhesive bond coupler to easily extend an already existing sensor network. We experimentally demonstrate this concept for detecting simulated cracks growing from circular holes in a thin aluminum plate. A single, remotely bonded FBG sensor is used to detect the original crack growth, followed by the addition of other optical fiber segments using adhesive couplers to detect new crack growth locations on the plate. A laser Doppler vibrometer is also used to measure the guided wave propagation through the plate to verify that the changes in the FBG sensor measurements are due to the growth of the cracks.
1. Introduction
Fiber Bragg grating (FBG) sensors are commonly applied to detect ultrasonic guided waves for structural health monitoring (SHM) applications [1]. FBG sensors are immune to electro-magnetic interference and therefore do not generate electrical cross-talk with common actuators, such as piezo-electric transducers (PZT) [2]. Large numbers of FBG sensors can also be written into a single optical fiber to cover large areas of a structure [3], or closely spaced together to provide high spatial resolution measurement of the guided waves [4]. This high-density spatial information can be used to decompose multiple, overlapped guided modes [4].
The major challenge to detecting guided modes in structures is their low-amplitude. Therefore, conventional peak wavelength tracking for FBG sensors is not sufficiently sensitive. The most popular alternative technique to measure the ultrasonic waveform with a FBG sensor is through edge-filtering, in which a narrowband lightwave is set to the midpoint of the rising or falling edge of the FBG spectrum [5,6,7,8]. The intensity reflected from the FBG is then measured using a photodetector. As the FBG spectrum shifts in wavelength due to the strain from the ultrasonic wave, the power reflected is modulated. Using a FBG with a steep spectral slope provides high sensitivity to strain amplitude modulation. Edge-filtering provides dynamic strain sensitivity of the order of a few pe/sqrt(Hz) [8].
However, edge-filtering provides its own challenge to multiplexing FBG sensor arrays. As the wavelength information is converted to intensity through the edge-filter, measurements must be taken one after another as the input wavelength is tuned, or each sensor requires its own photodetector, making multiplexing less compact than for peak wavelength tracking [9]. Tuning the input laser to monitor an array of FBG sensors works when the guided waves can be repeatedly generated by an actuator [4], but not for acoustic emission.
Recently, FBG sensors have been applied in the remote bonding configuration to increase the sensitivity of the sensor to guided waves [10,11,12,13]. In this configuration, the ultrasonic wave in the structure is coupled to the optical fiber and converted into a longitudinal guided wave propagating along the fiber [14]. The propagating wave is then measured with a FBG at a remote location along the fiber [13,15]. As the FBG sensor is more sensitive to the longitudinal mode in the optical fiber, the output intensity measured at the photodetector is higher than for the direct bonded case. This remote bonding configuration does not address the multiplexing challenge. Additionally, if multiple Lamb wave modes are to be captured, once they are converted into the longitudinal mode, they can no longer be separated by their velocity information [16]. However, for some SHM applications, the increased sensitivity can help capture high-fidelity ultrasonic waveforms.
Multiple researchers have also demonstrated that once the Lamb waves are converted into longitudinal ultrasonic waves they can also be coupled from one optical fiber to another through a bonded or fused segment of the optical fibers [17,18,19]. These acoustic couplers can therefore be potentially used to combine multiple ultrasonic signals collected by different optical fiber waveguides into a single optical fiber. Each of these signals could then be detected with a single FBG sensor and instrumentation channel, provided they are separated in time. Additionally, coupling can occur between other cylindrical waveguides and optical fibers, meaning that the waveguide attached to the structure does not need to be an optical fiber [18].
In this paper, we demonstrate that simple, adhesively bonded acoustic couplers can be used to attach new sensing waveguides to the original sensing fiber. This approach can be a low-cost, simple approach to multiplexing multiple FBG sensors for Lamb wave detection. One potential application would be when damage is identified during a routine inspection of the structure in a region where damage was not originally expected. For example, the unexpected leakage of saltwater into an area can create corrosion and corrosion induced cracking. That region of the structure may not have been properly instrumented for monitoring. Splicing a new sensing optical fiber to an existing optical fiber network is not always practical where the optical fibers are mounted to a structure [20]. Therefore, bonding a new optical fiber to an existing one is a simple and rapid method to add sensors in new regions of the structure. Since it is not necessary to transfer optical modes between the fibers, fusion splicing of the fibers is not required. Kim et al. [18,19] showed that the ultrasonic longitudinal mode waveform is preserved after passing through the adhesive bond coupler.
As a representative example, we demonstrate this concept for detecting simulated cracks growing from circular holes in a thin aluminum plate. A single, remotely bonded FBG sensor is used to detect the original crack growth, followed by the addition of other optical fiber segments to detect at new crack growth locations on the plate. The additional sensors are connected to the original remotely bonded FBG through an adhesive coupler. A high-resolution 3-dimensional laser Doppler vibrometer (LDV) (3D MSA, Polytec) is also used to measure the guided wave propagation through the plate to verify that the changes in the FBG sensor measurements are due to the growth of the cracks.
2. Experimental Setup
Figure 1a shows an overview of the experimental setup for a single optical fiber sensor. The 6061 aluminum plate dimensions are 30.48 cm × 30.48 cm with 0.8 mm thickness. A water jet was used to cut out three holes with 2.54 cm diameter, each 5.08 cm apart in the plate. Electrical discharge machining (EDM) was used to produce 2 mm long pre-cracks on both sides of each hole. A picture of the hole region in the plate is shown in Figure 2. The plate is mounted on a precision XY stage for position control of the scanning LDV measurements. Lamb waves were generated in the aluminum plate using a disc piezoelectric transducer (PZT), which primarily excites the S0 mode as a radially expanding wave in the plate. The PZT was excited with a Hanning windowed function of 5.5 cycles at 300 kHz. The PZT is driven by an arbitrary waveform generator (AWG) and amplifier. The PZT was bonded to the surface of the plate 5 cm away from the center hole and 9 cm away from the adjacent holes using cyanoacrylate (CA) adhesive, as shown in Figure 2. The plate boundaries were covered with an elastomeric damping material (Dynamat®) to minimize boundary reflections. Additional Lamb wave reflections will be present due to the machined holes; however, the goal of this paper is to show the ease of adding additional measurement points to a remotely bonded FBG sensor network using an adhesive coupler, rather than to analyze the wave propagation in this test case in detail.
A standard 125 μm single-mode polyimide-coated silica optical fiber is attached to the plate sample using a thin layer of 2 cm × 1 cm cyanoacrylate (CA) adhesive. The polyimide coating was chosen because it has a negligible effect on the attenuation of the ultrasonic L01 mode in the optical fiber [13]. For consistency and repeatability of the adhesive, a rectangular area of 2 cm × 1 cm was marked with Kapton® tape over the fiber on the plate, and a scraper was used to spread the adhesive over the area. The Kapton® tape was removed after curing the adhesive for 3 h. This same bonding procedure was used by the authors in previous experiments with remotely bonded FBGs [13]. The optical fiber is orientated such that the axial direction is aligned with the PZT. The S0 Lamb wave propagating in the plate is then converted into the L01 mode in the optical fiber at the bond location [13]. While a small A0 mode is also generated by the PZT, it is time separated by the time it reaches the bond; therefore it does not corrupt the S0 mode measurement.
The L01 mode is measured using a narrowband tunable laser (Tunics Plus CL, 100 MHz linewidth) whose output wavelength is set to the rising edge of the FBG reflected spectrum. The FBG spectrum had a maximum reflectivity of approximately 85% and a spectral bandwidth of approximately 0.25 nm. The FBG reflected power at this wavelength is passed through the circulator to the photodetector. As the FBG wavelength shifts due to the L01 mode axial strain, the resulting change in reflected power is converted into a change in voltage at the photodetector [13]. This commonly applied method permits the measurement of low-amplitude, high-frequency waves. The Lamb generation and the L01 mode measurement are synchronized by the oscilloscope trigger. The free end of the optical fiber was submerged in index matching gel to prevent back reflections of the optical and ultrasonic modes from the end of the fiber. Additionally, the propagating waves in the plate could be measured by scanning the LDV over the region of interest in the plate. Figure 1b,c show the modified experimental setups for later experiments, when two and three optical fibers were used to collect the Lamb wave signals. For these cases, the additional optical fibers were bonded to the plate using the same procedure as for the first fiber. All optical fibers were orientated in the direction of the PZT.
The additional fibers were connected to the original sensing fiber via an adhesive acoustic coupler. To fabricate the acoustic couplers (as previously demonstrated by the authors in [19]), the ends of optical fiber segments were cleaved and positioned in contact with the main fiber on a flat support. Then, a 3.175 mm length was masked using Kapton® tape, and CA adhesive was applied over the fibers. A schematic of the 2 × 1 and 3 × 1 acoustic couplers used are shown in Figure 3. When fabricating the 3 × 1 acoustic coupler, the 2 × 1 acoustic coupler was removed and 3 × 1 coupler was fabricated from scratch instead of adding a fiber to the 2 × 1 acoustic coupler. The adhesive was cured for 3 h. All L01 signals were then detected with the original FBG sensor.
Figure 4 shows the series of crack and sensing configurations tested in this paper. The cracks were driven manually in Mode I using a sharp straight razor. Initially, the sensor, a single crack, and the PZT are positioned in a straight line (Figure 4a). Then, a second crack is added, not between the PZT and the first sensor (Figure 4b). The conversion of the S0 Lamb wave to the L01 longitudinal mode in the optical fiber at the remote bond is highly directional [21]. Therefore, the first sensor would have a low sensitivity to the second crack, and a second sensor is added to the structure in line with the PZT (Figure 4b). Next, a third crack is added to the structure at another location, not aligned with the first two sensors and a third sensor is added to detect it (Figure 4c). The lengths of the three fiber segments between the plate and adhesive coupler were different, so the signals from each bond location arrived at the FBG time separated.
3. Single Damage Location Results
As shown in Figure 4a, the adhesive bond, the crack growth region, and the PZT were placed in a straight line for the first test. A razor blade was used to increase the pre-crack length in increments of 2 mm between each measurement. Figure 5 plots the FBG measurements for three different pre-crack lengths, averaging over 4096 data sets. The PZT generates both S0 and A0 modes in the plate at 300 kHz. The S0 mode travels faster in the plate than the A0 mode. The predicted arrival time of the S0 signal is based on the theoretical velocity of the S0 mode in the plate, over the distance between the PZT and the adhesive bond, followed by the theoretical velocity of the L01 mode in the optical fiber over the 30 cm from the bond to the FBG [13]. The same calculation is made for the A0 mode converted into the L01 mode. These theoretical arrival times are shown as red dashed lines in Figure 5. Based on the wave velocities in the plate and fiber, the wave that arrives at 90 µs is the L01 mode wave coupled from the S0 wave from the plate, and the wave that arrives at 120 µs is the L01 mode wave coupled from the A0 wave from the plate. Previous experiments have demonstrated that both the A0 and S0 couple into the L01 mode in the optical fiber [6].
For the first two measurements plotted at crack lengths of 2 mm (Figure 5a) and 10 mm (Figure 5b), the Hanning windowed S0 and A0 modes can be seen in the measured signal. There are additional wave packets present superimposed on the Hanning windowed signal, which are likely the signals reflected from the adjacent holes arriving with a delay. For the measurements at the final crack length of 20 mm plotted in Figure 5c, the signal is instead dominated by the interference with the reflected signals.
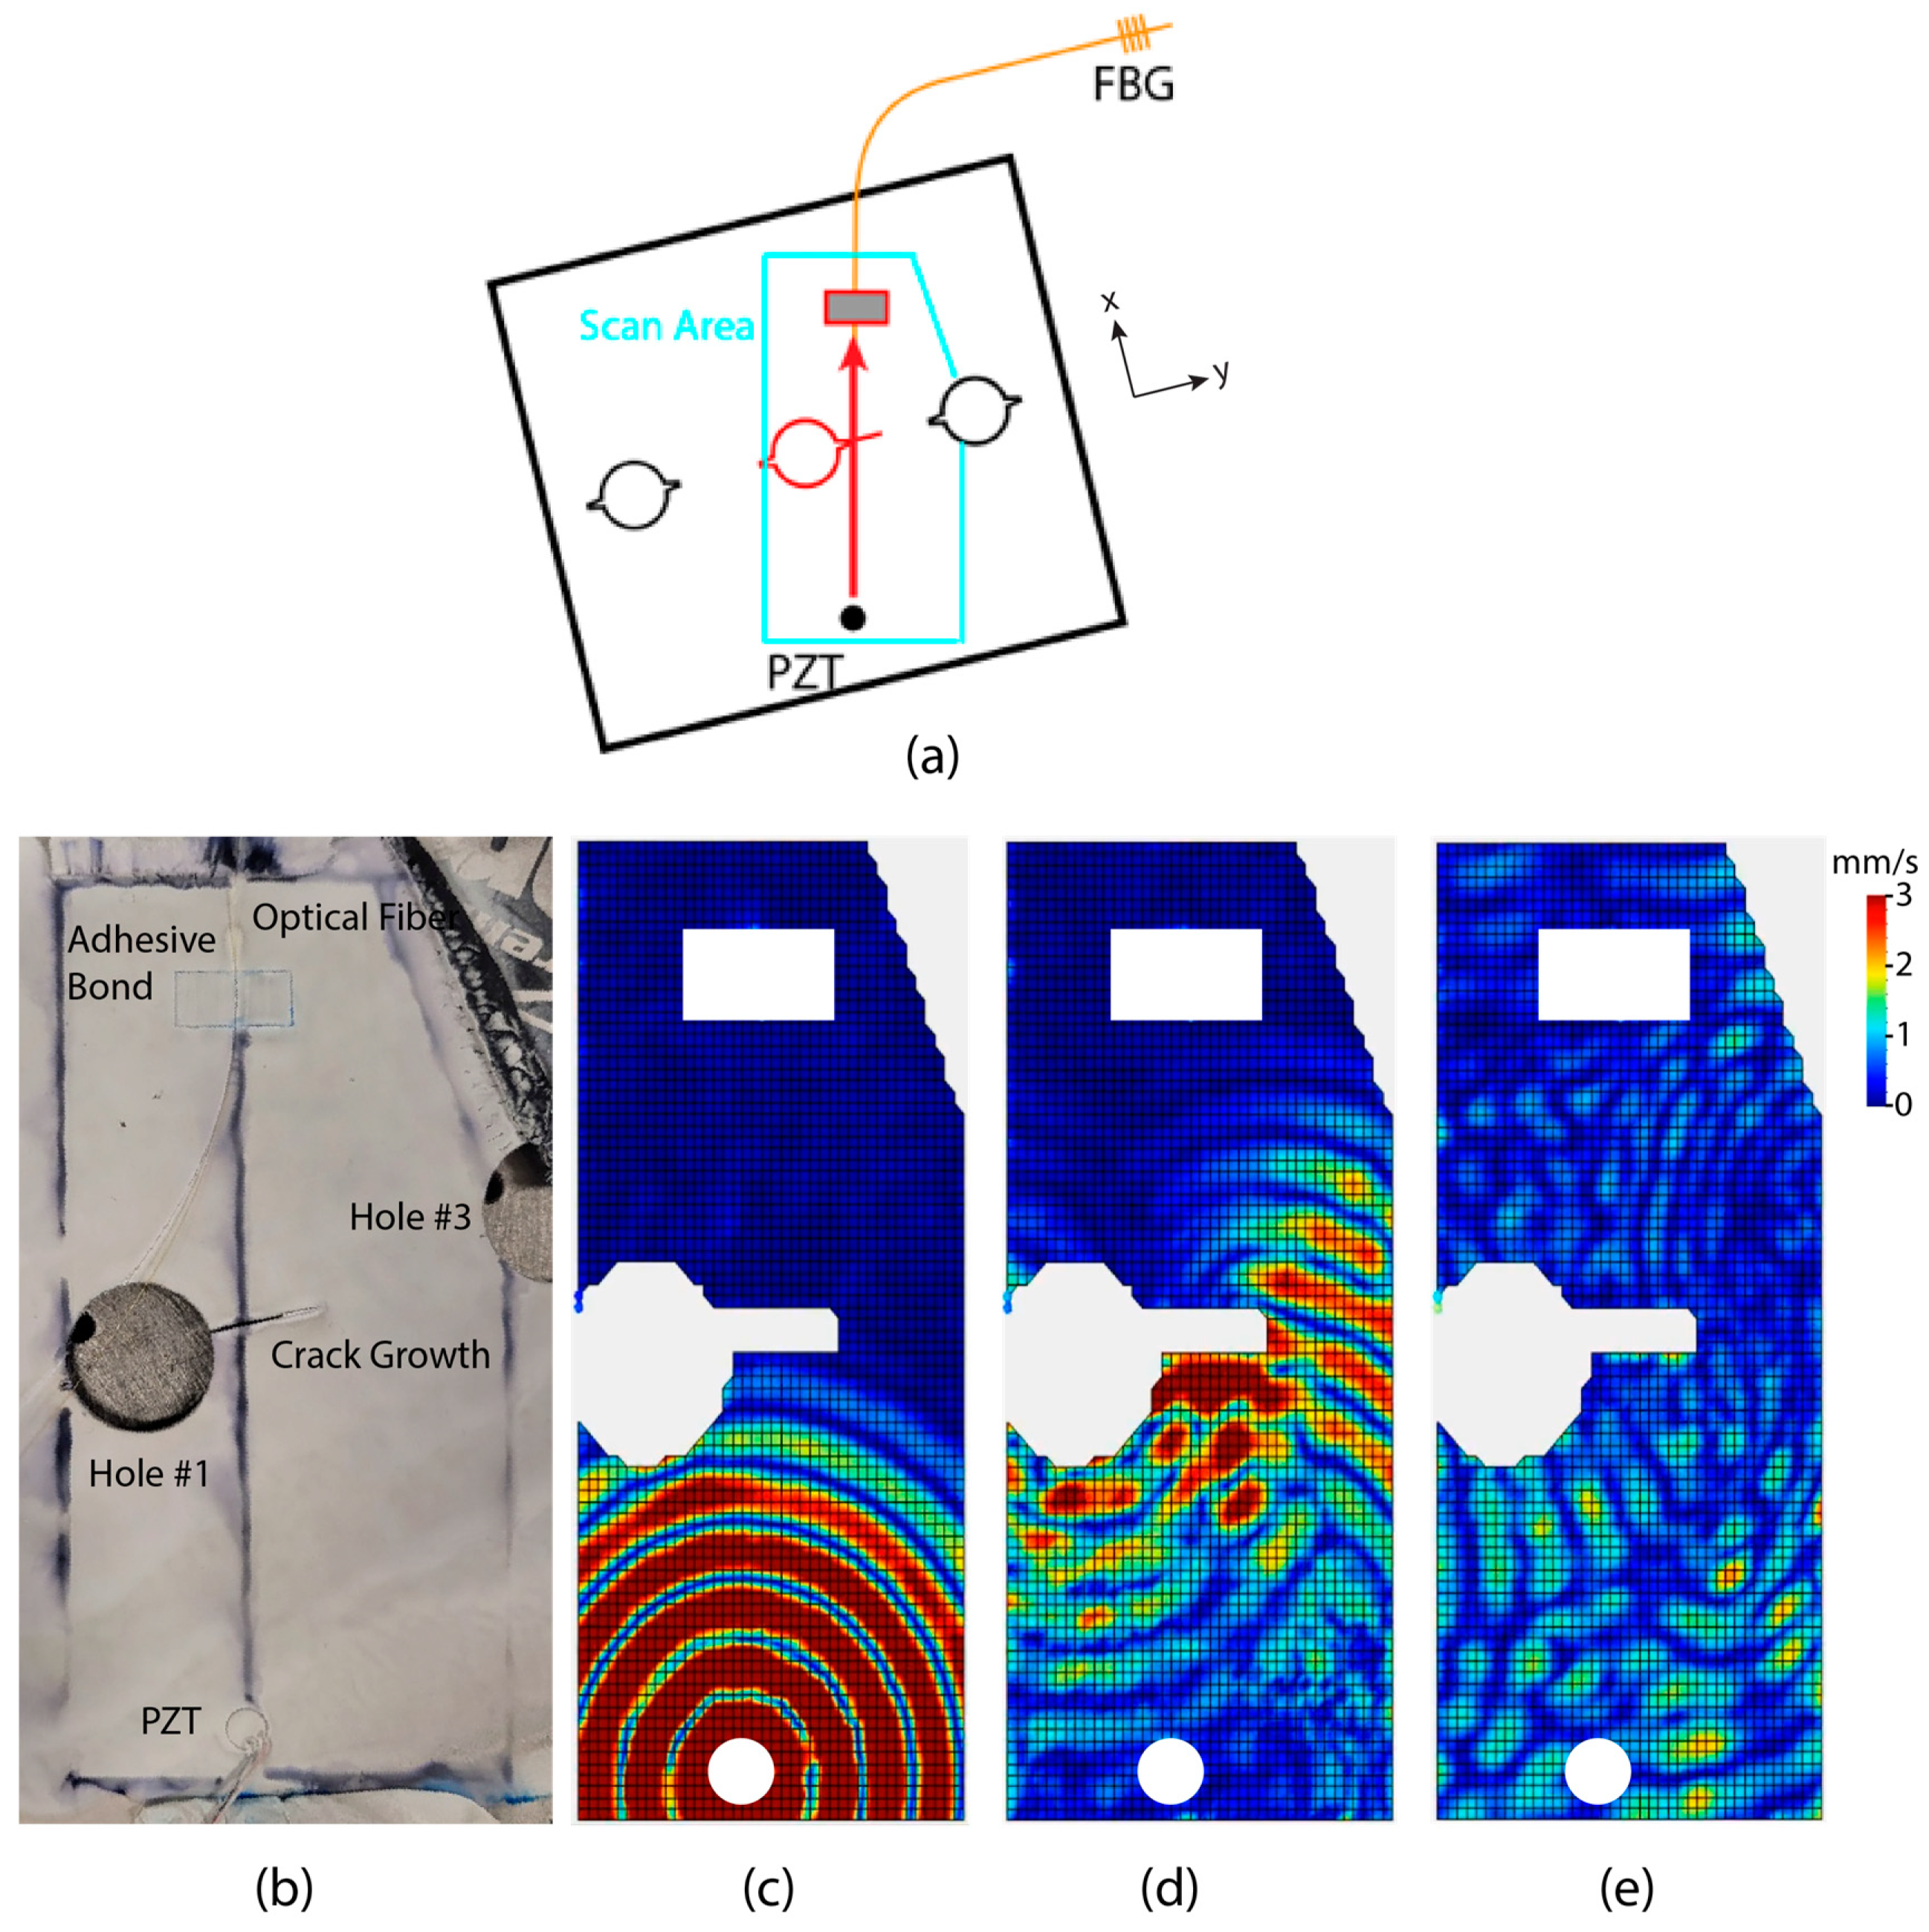
To better understand the change in FBG measurements with crack length, the 3D surface velocities were measured with the LDV over a region of the aluminum plate to map the propagation of the guided waves in the plate. Measurements were averaged over 1500 excitations at a sampling frequency of 6250 kHz. Figure 6a shows the scan region on the plate and Figure 6b shows a picture of the region marked with black ink. The scan region is coated with weld check spray to reduce reflections from the aluminum surface. The regions immediately around the PZT, hole, and optical fiber adhesive bond are not flat and are difficult to resolve with the 3D LDV; therefore, they were removed from the scan region.
Figure 6c–e plot the resulting in-plane (combined X and Y directions) LDV velocity measurements for a crack length of 20 mm. Figure 6c shows the propagation of circular S0 Lamb waves spreading out from the PZT in the structure, at 20 µs after excitation, as expected. Figure 6d, at 25 µs, shows that a fraction of the wave reflects backwards at the hole and pre-crack opening and a fraction of the waves go around the pre-crack. Figure 6e, at 70 µs, shows that the waves propagating around hole #1 to the right are reflected from the adjacent hole #3 and interfere with the waves propagating around hole #1 to the left at the adhesive bond region. These LDV measurements on Figure 6 confirm that the wave packets in the FBG measurements arriving after the A0 signal on Figure 5 are caused by the waves reflecting from and going around the adjacent holes. In addition, they explain the slight delay in arrival time of L01 mode coupled from the S0 mode in Figure 5c, compared to that from Figure 5a because the signal does not travel through the crack but around it, increasing the propagation distance.
4. Multiple Damage Location Results
Next, as shown in Figure 4b, a second crack was extended from the hole on the left. The signal collected from sensor #1 is not expected to be sensitive to the second crack, because the complex interference from other boundaries seen in Figure 6d would dominate the measurements. Therefore, we tested the concept of adding a new sensor at a different site using an adhesive bond to monitor crack #2. An optical fiber was bonded to the plate at a location (sensor #2) in line with the secondary crack region (crack #2), and one end of the fiber was coupled to the main sensing fiber using a 2 × 1 acoustic coupler (see Figure 3c). FBG measurements were taken while increasing the length of crack #2 every 2 mm.
Figure 7 plots the FBG measurements at 2 mm, 10 mm, and 20 mm crack lengths, respectively (crack #2). There are two signals present in the measurements: the signal from sensor #1, which arrives at around 150 µs, and the signal from sensor #2, which arrives at around 240 µs. The sensor signals were isolated in time by controlling the length of each optical fiber segment. Note that the wave packet starting at 150 µs is identical to the wave packet from Figure 5c because the second sensor was added after the first experiment. As the crack length increases, the L01 waveform measured by sensor #2 decreases, as observed in the previous case. For these measurements, the interference by boundary reflections was not significant, even at the crack length of 20 mm. The waveform measured by sensor #1 also changed, but it is too complex to isolate the effect of crack #2.
Next, the procedure was repeated, as shown in Figure 4d,e, as a third crack was propagated and a new optical fiber was bonded to the plate (sensor #3). This fiber was in-line with crack #3 and coupled to the main sensing fiber using the same acoustic coupler. Experiments were repeated while increasing the length of crack #3 by 2 mm, and representative results are plotted in Figure 8. As before, signals from each of the sensors arrived at the FBG, separated in time. The signal from sensor #3 shows the wave packets coupled from both the S0 and A0 modes. The wave packet amplitudes in both of these modes decreased with increasing crack length. As a final note, there is a significant decrease in the measured strain amplitude for the signals from the first two sensors plotted in Figure 8, as compared to the measurements in Figure 7c. As additional fibers were coupled to the original fiber, the adhesive created signal losses, and the change in acoustic impedance at the coupler compared to a single optical fiber created reflections. The signal loss was measured for a two-fiber coupler in Kim et al. [19] and is not negligible. While this was not a significant effect on the signal collection when the first fiber was added, it was for the three-fiber coupler. Therefore, it is likely that the number of additional sensors that could be added to the coupler is small. However, additional sensors could be coupled to the original fiber at new locations along the fiber.
Figure 9 shows the resulting in-plane (combined X and Y directions) LDV velocity measurements of the aluminum plate sample in the region around the PZT and sensors #1 and #3. Figure 9a,b show a sketch and picture of the sample with the scan region marked with black ink. Figure 9c,d plot the LDV measurements at 20 µs and 30 µs after the excitation, respectively. In Figure 9d, we see that a portion of the waves are reflected from the two holes and cracks, and a portion propagates through the opening of the two cracks. This narrow opening acts like a new wave source, and the wave that propagates through forms circular waves. This change in the propagation of wave compared to having only one crack contributed to the increase in the amplitude of wave captured in sensor #1 with increasing crack length.
5. Discussion
The multiple crack experiments in the previous section show that the adhesive coupler can be used to add additional sensing nodes to the existing sensing system. It should be noted that the losses through the coupler are significant and are most likely the limiting factor in the number of sensors that can be added to a given location. In comparison, fused optical couplers typically have losses of less than 3 dB. Considering the fact that the adhesive coupler is a low-cost, easily installed solution, it is not surprising that the insertion losses are significant.
The intention is not to compete with the conventional approach of adding additional optical fiber channels to the sensor network, which also have much lower losses [22,23]. However, splicing in the additional optical fibers requires a complex installation process and available instrumentation channels. Instead, the acoustic couplers could be used for rapid monitoring of a structure to identify regions that require further inspection.
The results of the measured waveforms also show the complexity of multiple waves in the specimen, due to the original waveform from the PZT actuator but also the reflections off the boundaries, holes and induced cracks. To interpret the measured ultrasound signals, it is important to fully visualize the waveform field in the structure and how it is affected by the presence of cracks or other defects. Using a full-field measurement system, such as the LDV, provides information that is more easily interpreted for structural health monitoring applications [24,25]. Unfortunately, LDV requires full visual access to the structure, so it is not possible for all applications. Additionally, it can be difficult to install near a structure in service.
6. Conclusions
This study experimentally demonstrates an easy method to extend an already installed FBG sensing system for ultrasonic waves by coupling optical fiber segments to the sensing fiber using an adhesive bond coupler. The use of the acoustic coupler is a simple technique to add sensors that could be rapidly implemented for field applications and provides additional sensing information about the structure. The test case chosen for these experiments is a small plate with multiple holes and boundaries; therefore, the waveforms after the first arrival of the S0 mode are complex. Detailed analyses of these waveforms and their relation to the crack growth were not performed, as the goal was to show the ability to couple new sensors using the adhesive bond. A full investigation of the crosstalk between the multiple sensors as multiple cracks grow at the same time is also necessary to fully characterize the adhesive coupling strategy. Similarly, the adhesive coupler itself was not optimized in terms of length, adhesive thickness, etc. to reduce the ultrasonic energy loss or reflections at the coupler.
Author Contributions
Conceptualization, J.-M.K. and K.P.; Data curation, J.-M.K.; Formal analysis, J.-M.K., S.A. and K.P.; Funding acquisition, K.P.; Investigation, J.-M.K. and S.A.; Methodology, J.-M.K. and K.P.; Project administration, K.P.; Validation, J.-M.K., S.A. and K.P.; Writing—original draft, J.-M.K.; Writing—review and editing, K.P. All authors have read and agreed to the published version of the manuscript.
Funding
This research was funded by the Office of Naval Research (ONR), grant numbers N00014-19-1-2053 and N00014-22-1-2365.
Institutional Review Board Statement
Not applicable.
Informed Consent Statement
Not applicable.
Data Availability Statement
The data presented in this study are available on request from the corresponding author. The data are not publicly available due to permission requirements from the funding sponsor.
Conflicts of Interest
The authors declare no conflict of interest.
References
- Wu, Q.; Okabe, Y.; Yu, F. Ultrasonic structural health monitoring using fiber Bragg grating. Sensors 2018, 18, 3395. [Google Scholar] [CrossRef] [PubMed]
- Culshaw, B.; Thursby, G.; Betz, D.; Sorazu, B. The detection of ultrasound using fiber-optic sensors. IEEE Sens. J. 2008, 8, 1360–1367. [Google Scholar] [CrossRef]
- Zhang, H.; Liu, T.; Lu, J.; Lin, R.; Chen, C.; He, Z.; Cui, S.; Liu, Z.; Wang, X.; Liu, B.; et al. Static and ultrasonic structural health monitoring of full-size aerospace multifunction capsule using FBG strain arrays and PSFBG acoustic emission sensors. Opt. Fiber Technol. 2023, 78, 103316. [Google Scholar] [CrossRef]
- Rajic, N.; Davis, C.; Thomson, A. Acoustic-wave-mode separation using a distributed Bragg grating sensor. Smart Mater. Struct. 2009, 18, 125005. [Google Scholar] [CrossRef]
- Lissak, B.; Arie, A.; Tur, M. Highly sensitive dynamic strain measurements by locking lasers to fiber Bragg gratings. Opt. Lett. 1998, 23, 1930–1932. [Google Scholar] [CrossRef] [PubMed]
- Perez, I.; Cui, H.L.; Udd, E. Acoustic emission detection using fiber Bragg gratings. In Proceedings of the SPIE’s 8th Annual International Symposium on Smart Structures and Materials, Newport Beach, CA, USA, 4–8 March 2001. [Google Scholar]
- Betz, D.C.; Thursby, G.; Culshaw, B.; Staszewski, W.J. Acousto-ultrasonic sensing using fiber Bragg gratings. Smart Mater. Struct. 2003, 12, 122–128. [Google Scholar] [CrossRef]
- Lee, J.R.; Tsuda, H. A novel fiber Bragg grating acoustic emission sensor head for mechanical tests. Scripta Materialia 2005, 53, 1181–1186. [Google Scholar] [CrossRef]
- Lee, J.R.; Lee, S.S.; Yoon, D.J. Simultaneous multipoint acoustic emission sensing using fibre acoustic wave grating sensors with identical spectrum. J. Opt. A 2008, 10, 085307. [Google Scholar] [CrossRef]
- Wu, Q.; Yu, F.; Okabe, T.; Kobayashi, S. Application of a novel optical fiber sensor to detection of acoustic emissions by various damages in CFRP laminates. Smart Mater. Struct. 2015, 24, 015011. [Google Scholar] [CrossRef]
- Tsuda, H.; Sato, E.; Nakajima, T.; Nakamura, H.; Arakawa, T.; Shiono, H.; Minato, M.; Kurabayashi, H.; Sato, A. Acoustic emission measurement using a strain-insensitive fiber Bragg grating sensor under varying load conditions. Opt. Lett. 2009, 34, 2942–2944. [Google Scholar] [CrossRef]
- Lee, J.; Tsuda, H. Fiber optic liquid leak detection technique with an ultrasonic actuator and a fiber Bragg grating. Opt. Lett. 2005, 30, 3293–3295. [Google Scholar] [CrossRef] [PubMed]
- Wee, J.; Wells, B.; Hackney, D.; Bradford, P.; Peters, K. Increasing signal amplitude in fiber Bragg grating detection of Lamb waves using remote bonding. Appl. Opt. 2016, 55, 5564–5569. [Google Scholar] [CrossRef] [PubMed]
- Wee, J.; Peters, K. Laser Doppler vibrometry measurements of conversion of surface guided waves to optical fiber modes. IEEE Photonics Technol. Lett. 2020, 32, 349–352. [Google Scholar] [CrossRef]
- Wee, J.; Hackney, D.; Bradford, P.; Peters, K. Simulating increased Lamb wave detection sensitivity of surface bonded fiber Bragg grating. Smart Mater. Struct. 2017, 26, 11–20. [Google Scholar] [CrossRef]
- Davis, C.; Rosalie, C.; Norman, P.; Rajic, N.; Habel, J.; Bernier, M. Remote sensing of Lamb waves using optical fibres—an investigation of modal composition. J. Light. Technol. 2018, 36, 2820–2826. [Google Scholar] [CrossRef]
- Leal, W.A.; Carneiro, M.B.R.; Freitas, T.A.M.G.; Marcondes, C.B.; Ribeiro, R.M. Low-frequency detection of acoustic signals using fiber as an ultrasonic guide with a distant in-fiber Bragg grating. Microw. Opt. Technol. Lett. 2018, 60, 813–817. [Google Scholar] [CrossRef]
- Kim, J.M.; Marashi, C.; Wee, J.; Peters, K. Acoustic wave coupling between optical fibers of different geometries. Appl. Opt. 2021, 60, 11042–11049. [Google Scholar] [CrossRef]
- Kim, J.M.; Wee, J.; Peters, K. Demonstration of coherent interference between acoustic waves using a fiber ring resonator. Sensors 2022, 22, 4163. [Google Scholar] [CrossRef]
- Hayle, S.T.; Manie, Y.C.; Dehnaw, A.M.; Hsu, Y.T.; Li, J.W.; Liang, H.C.; Peng, P.C. Reliable self-healing FBG sensor network for improvement of multipoint strain sensing. Opt. Commun. 2021, 499, 127286. [Google Scholar] [CrossRef]
- Wee, J.; Hackney, D.; Peters, K. Preferential directional coupling to ultrasonic sensor using adhesive tape. Opt. Eng. 2019, 58, 072003. [Google Scholar] [CrossRef]
- Amaya, A.; Sierra-Perez, J. Toward a structural health monitoring methodology for concrete structures under dynamic loads using embedded FBG sensors and strain mapping techniques. Sensors 2022, 22, 4569. [Google Scholar] [CrossRef] [PubMed]
- Wang, Y.; Hu, S.; Xiong, T.; Huang, Y.; Qiu, L. Recent progress in aircraft smart skin for structural health monitoring. Struct. Health Monit. 2021, 21, 2453–2480. [Google Scholar] [CrossRef]
- Kudela, P.; Wandowski, T.; Malinowski, P.; Ostachowicz, W. Application of scanning laser Doppler vibrometry for delamination detection in composite structures. Opt. Lasers Eng. 2017, 99, 46–57. [Google Scholar] [CrossRef]
- Nassif, H.H.; Gindy, M.; Davis, J. Comparison of laser Doppler vibrometer with contact sensors for monitoring bridge deflection and vibration. NDT E Int. 2005, 38, 213–218. [Google Scholar]
Figure 1.
Experimental setup (not to scale) for the damage detection with (a) one, (b) two and (c) three optical fibers. Blue arrows show propagation of ultrasonic waves in optical fibers.
Figure 1.
Experimental setup (not to scale) for the damage detection with (a) one, (b) two and (c) three optical fibers. Blue arrows show propagation of ultrasonic waves in optical fibers.


Figure 2.
Details of the aluminum plate sample.

Figure 3.
Sketch of the (a) 2 × 1 and (b) 3 × 1 acoustic coupler.

Figure 4.
Crack and sensing configurations tested in this paper. (a) 1 crack, 1 sensor; (b) 2 cracks, 2 sensors; (c) 3 cracks, 3 sensors.
Figure 4.
Crack and sensing configurations tested in this paper. (a) 1 crack, 1 sensor; (b) 2 cracks, 2 sensors; (c) 3 cracks, 3 sensors.

Figure 5.
FBG measurements for (a) 2 mm pre-crack, (b) 10 mm and (c) 20 mm crack for one damage location.
Figure 5.
FBG measurements for (a) 2 mm pre-crack, (b) 10 mm and (c) 20 mm crack for one damage location.

Figure 6.
(a) Scan region for LDV measurements; (b) picture of the scan region; (c) in-plane (combined X and Y directions) surface velocity measurement at 20 µs, (d) 25 µs, and (e) 70 µs.
Figure 6.
(a) Scan region for LDV measurements; (b) picture of the scan region; (c) in-plane (combined X and Y directions) surface velocity measurement at 20 µs, (d) 25 µs, and (e) 70 µs.

Figure 7.
(a) FBG measurements taken for 2 mm crack (crack #2), (b) 10 mm, and (c) 20 mm for two damage locations.
Figure 7.
(a) FBG measurements taken for 2 mm crack (crack #2), (b) 10 mm, and (c) 20 mm for two damage locations.

Figure 8.
(a) FBG measurements taken for 2 mm crack (crack #3), (b) 10 mm, and (c) 20 mm for three damage locations.
Figure 8.
(a) FBG measurements taken for 2 mm crack (crack #3), (b) 10 mm, and (c) 20 mm for three damage locations.

Figure 9.
(a) Scan region for LDV measurements; (b) picture of the scan region; (c) in-plane (combined X and Y directions) LDV velocity measurements at 20 µs and (d) 30 µs after excitation.
Figure 9.
(a) Scan region for LDV measurements; (b) picture of the scan region; (c) in-plane (combined X and Y directions) LDV velocity measurements at 20 µs and (d) 30 µs after excitation.

Disclaimer/Publisher’s Note: The statements, opinions and data contained in all publications are solely those of the individual author(s) and contributor(s) and not of MDPI and/or the editor(s). MDPI and/or the editor(s) disclaim responsibility for any injury to people or property resulting from any ideas, methods, instructions or products referred to in the content. |
© 2023 by the authors. Licensee MDPI, Basel, Switzerland. This article is an open access article distributed under the terms and conditions of the Creative Commons Attribution (CC BY) license (https://creativecommons.org/licenses/by/4.0/).
Share and Cite
MDPI and ACS Style
Kim, J.-M.; Aboubakr, S.; Peters, K. Extension of Fiber Bragg Grating Ultrasound Sensor Network by Adhesive Couplers. Photonics 2023, 10, 1366. https://doi.org/10.3390/photonics10121366
AMA Style
Kim J-M, Aboubakr S, Peters K. Extension of Fiber Bragg Grating Ultrasound Sensor Network by Adhesive Couplers. Photonics. 2023; 10(12):1366. https://doi.org/10.3390/photonics10121366
Chicago/Turabian StyleKim, Jee-Myung, Sherif Aboubakr, and Kara Peters. 2023. "Extension of Fiber Bragg Grating Ultrasound Sensor Network by Adhesive Couplers" Photonics 10, no. 12: 1366. https://doi.org/10.3390/photonics10121366
Note that from the first issue of 2016, this journal uses article numbers instead of page numbers. See further details here.