Design and Experimental Validation of an Optical Autofocusing System with Improved Accuracy


Department of Mechanical Engineering, National Cheng Kung University, Tainan 70101, Taiwan
*
Author to whom correspondence should be addressed.
Photonics 2023, 10(12), 1329; https://doi.org/10.3390/photonics10121329
Submission received: 20 October 2023
/
Revised: 18 November 2023
/
Accepted: 28 November 2023
/
Published: 30 November 2023
(This article belongs to the Special Issue Advanced Photonic Sensing and Measurement II)
Abstract
:This study proposes a modified optical design to improve the issue of autofocus accuracy in existing optical systems. The proposed system uses lens offset to convert incident light into non-parallel light, achieving a focus shift and avoiding severe deformation of the light spot near the focal point of the objective lens. Based on triangulation theory and optical focusing theories such as the centroid method, the proposed optical design improves the shortcomings of existing technology. Experimental results demonstrate that the proposed optical autofocusing system has better autofocus accuracy than traditional systems while also reducing the difficulty of image processing. In summary, the proposed optical system is not only an effective autofocusing technology but also a highly valuable optical inspection and industrial application technology. This system has broader application and development opportunities for future research and practice.
1. Introduction
The widespread application of optical measurement technology in areas such as automated engineering, quality control, and industrial inspection has become a crucial detection method [1,2,3,4,5]. In the process of optical inspection, high-precision measurement and analysis are indispensable, necessitating the use of highly precise optical systems. Particularly in non-contact optical inspection methods, automatic focusing becomes crucial as focusing drift during the image acquisition process can lead to blurry images, significantly affecting the efficiency and accuracy of defect analysis. While manual focusing is a viable solution, its inherent inaccuracy and time-consuming nature make automatic focusing a more practical alternative. Therefore, automatic focusing is regarded as a potential solution to enhance focusing accuracy and speed. To achieve this goal, the automation of autofocus has replaced manual efforts, becoming a significant research direction in the field of non-contact optical inspection. In this context, research on optical autofocus has gradually become a focal point for researchers and technology companies. Challenges include the optimization of hardware components and the application of advanced image processing techniques. Despite making significant progress, the issue of spot distortion in close-range shooting scenes remains a technical challenge. Even with advanced hardware and image processing techniques, the spots detected by light sensors in these scenes may still undergo severe deformation, thereby affecting the accuracy of automatic focusing. Autofocus systems, crucial in modern camera technology, display a dichotomy between image-based autofocus and optics-based autofocus. Image-based autofocus relies on the analysis of images captured by the camera’s CCD (charge coupled device) or CMOS (complementary metal-oxide semiconductor) sensors [6,7,8,9,10]. These sensors calculate essential information for image processing, encompassing parameters such as image sharpness and the spatial frequency function of the image. By employing intricate functions, these parameters are computed to derive the focus value, forming the foundation for automated autofocus determination. However, this autofocus method is characterized by a relatively slower speed due to the necessity of continuous adjustment of the focus distance until optimal focusing is achieved. Conversely, optics-based autofocus hinges on the shape of the light spot or variations in light intensity detected by photosensors to ascertain the optimal focus distance [11,12,13,14]. Remarkably, this method boasts faster response speeds and higher accuracy in autofocusing when compared to its image-based counterpart. Nevertheless, it’s crucial to acknowledge that the optics-based autofocus method might be susceptible to environmental factors that could potentially impact the accuracy of the focus, as indicated by some studies [15]. Currently, numerous researchers are dedicated to enhancing the accuracy of optical autofocus, whether through improving hardware components [16,17] or employing advanced image processing techniques [1,18,19,20,21,22]. Despite the beneficial aspects of various methods, it has been observed that, regardless of the means used to improve autofocus accuracy, the light spot detected by the light sensor may undergo significant distortion when the test object is near the focus point. Such distortions not only complicate image processing but also adversely affect autofocus precision, particularly in close proximity to the focus point. Therefore, the objective of this study is to refine the existing autofocus architecture to alleviate the issue of light spot distortion. This was validated through a series of experiments to assess the effectiveness of the proposed approach. The new method not only enhances the autofocus accuracy but also reduces the required image processing time, offering a more feasible solution for overall system performance improvement.
2. Traditional Optics-Based Autofocusing System with Centroid Method
2.1. Principle of Traditional Autofocusing System with Centroid Method
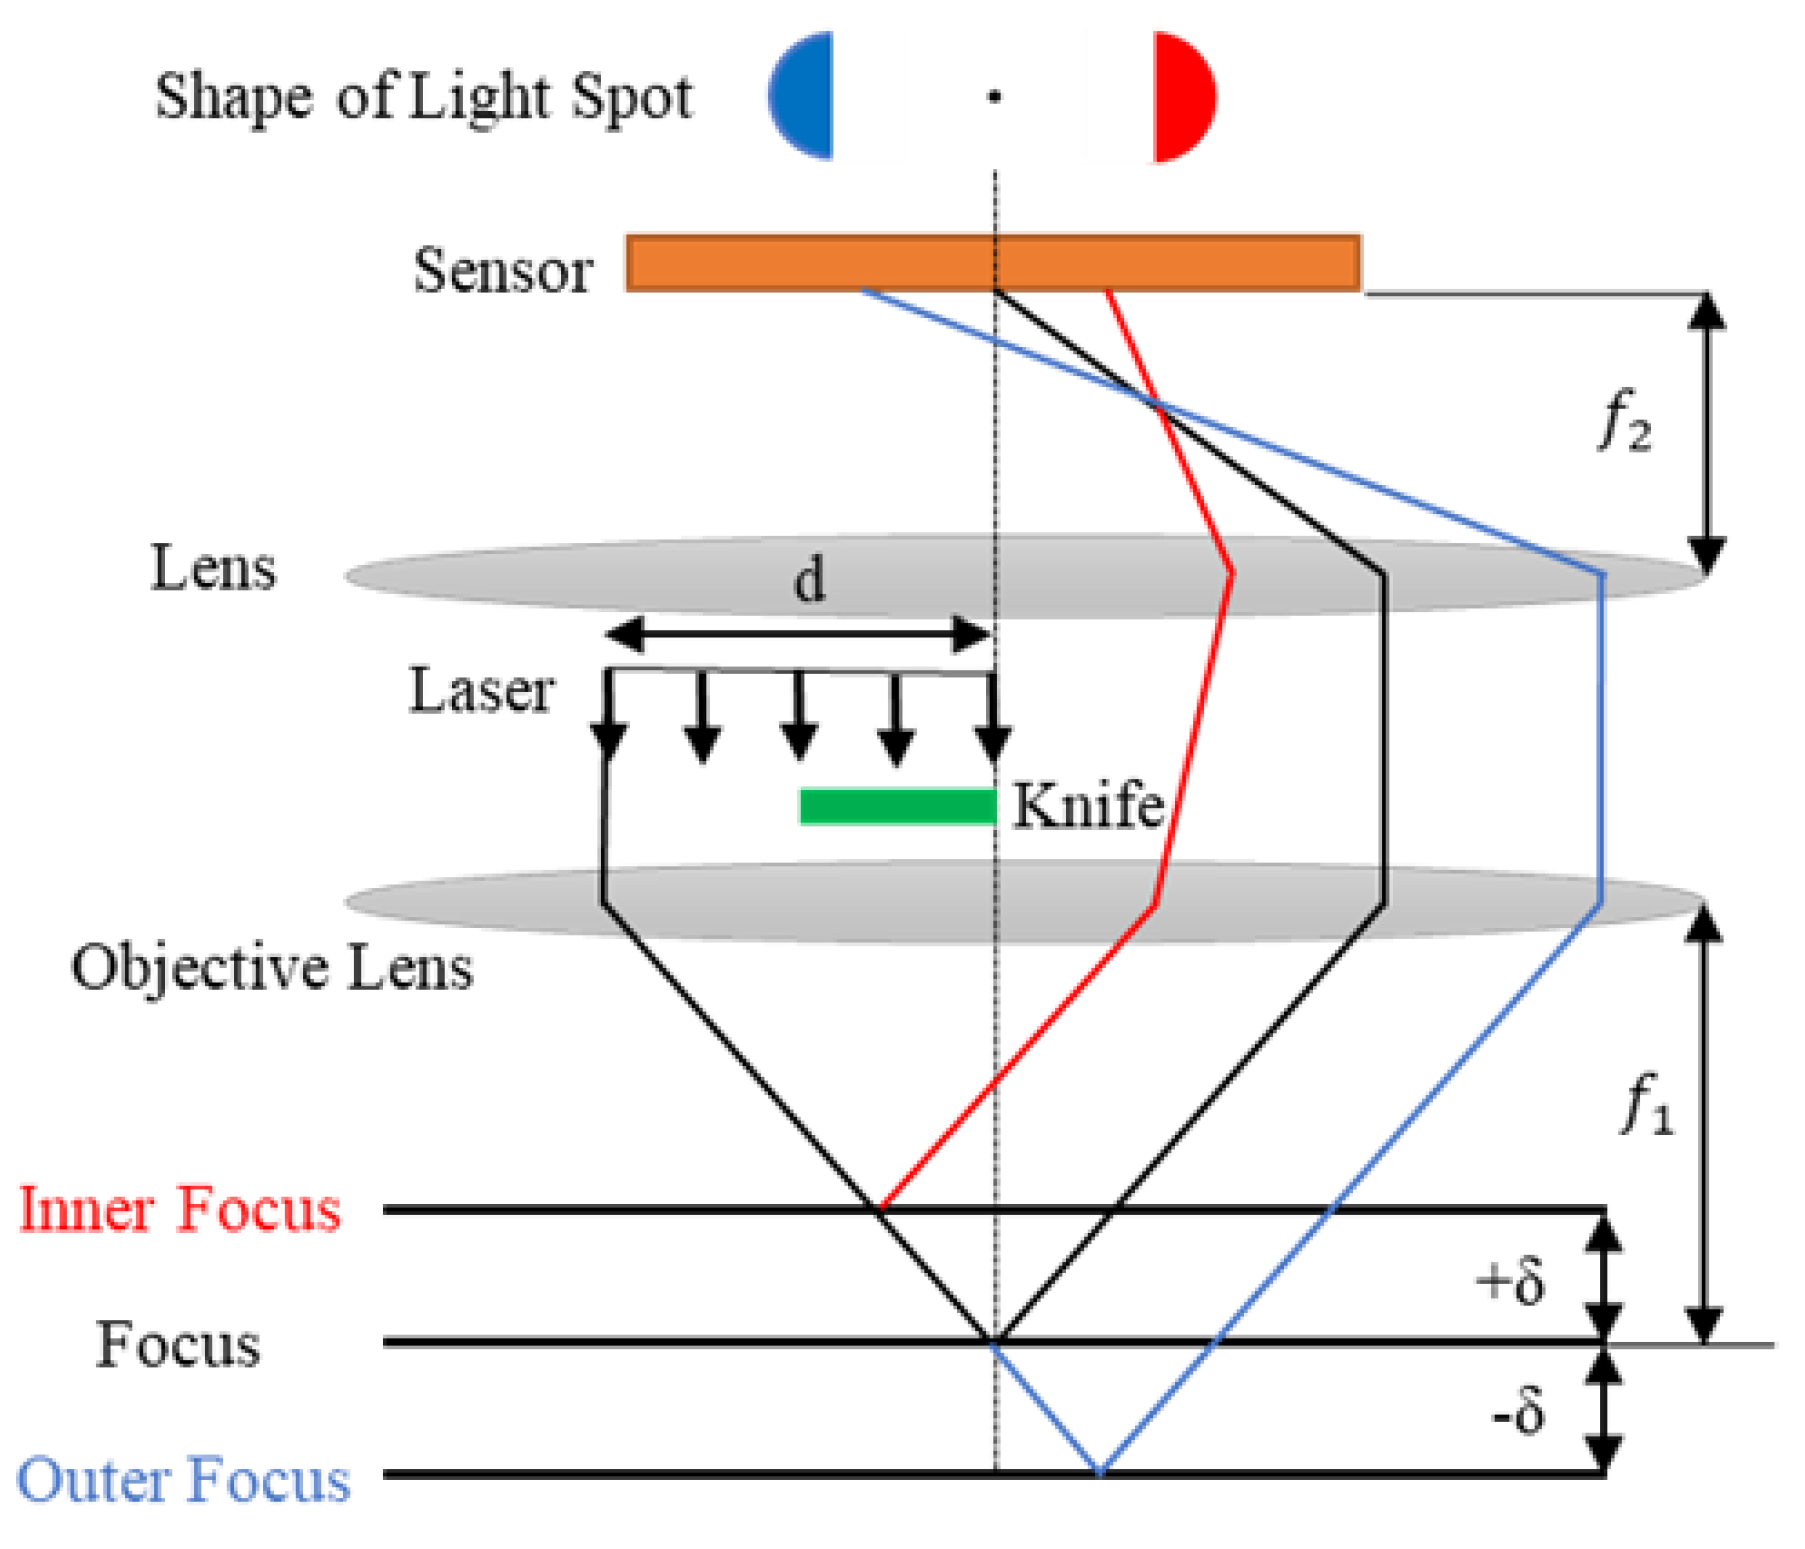
Figure 1 depicts a schematic of the light spots in a conventional optics-based autofocusing system utilizing the centroid method under different defocusing conditions. Here, d represents the diameter of the laser source, and δ represents the defocusing distance of the test object. First, a parallel laser beam passes through the knife, resulting in a semi-circular shaped light spot. The semi-circular incident beam then passes through a lens with a focal length of f1, and focuses on the surface of the test object. If the test sample is positioned at the focus point of the objective lens, the reflected light from the object passes through the lens and sensor, ultimately forming an ideally infinitesimal light spot on the sensor. However, if the test sample is not positioned at the focal point, defocusing occurs, and the light spot observed on the sensor will exhibit varying shapes based on the magnitude and direction of defocusing.
The position of the test sample affects the variation of the light spot reflected on the sensor. Specifically, whether it is located at the front focal point, focal point, or back focal point. When the test sample is positioned further away from the focal point, the semicircular light spot will increase in size, indicating that the center of the light spot is moving farther away from the baseline. Figure 2 shows that the light spots inside and outside the focal point are inverted and oriented in opposite directions. The displacement of the center of gravity of the light spot from the baseline, along with changes in its size and distance, can serve as a basis for determining the direction and distance of defocusing [23,24].
2.2. Structure of Traditional Autofocusing Method with Centroid Method
Figure 3 shows the optical path diagram of the traditional optics-based autofocusing structure with the centroid method [23,24]. A straight laser beam is directed downward, and a knife is placed on the optical axis of the system at a suitable distance, causing the sharp edge of the knife to produce a semi-circular beam. The semi-circular beam passes through a mirror and is directed towards the objective lens by a beam splitter, which focuses the beam onto the sample. The incident light will reflect or scatter depending on the surface material of the test object, and the reflected beam will follow the original path back. The beam splitter is used to redirect the reflected light 90° before focusing the semi-circular beam onto a sensor. The information about the reflected light spot received by the sensor is used to determine the focusing condition of the test object. However, environmental disturbances and unstable laser sources can cause the light beam’s shape to deviate from a perfect circle, resulting in an elliptical shape. As a result, when using the knife-edge centroid method to calculate the defocus distance near the focus, a greater amount of error may occur due to the significant distortion of the returned light beam.
3. Proposed Autofocusing Structure and Prototype Model
3.1. Structure of Proposed Autofocusing System
Figure 4 illustrates the basic autofocusing structure proposed in this study. As shown, the optical path architecture of the autofocus system utilizes a 658-nanometer laser diode (HL6501MG, Thorlabs, Newton, NJ, USA) as the light source for focus detection. The reason for choosing a laser diode is its compact and lightweight nature, along with the ability to change output power rapidly within a short timeframe, making them easy to control and adjust. An adjustable offset lens (A220TM, Thorlabs) is placed after the laser, enabling modification of the beam’s parallelism. The modified beam passes through a knife-edge positioned on the optical axis of the system, transforming the originally circular beam into a semi-circular shape. The semi-circular beam then passes through a beam splitter and is reflected off a 45° red reflective filter towards a focusing lens. Finally, the beam is focused onto the sample (PFR10-P01, Thorlabs, a smooth-surfaced silver mirror) through the objective lens (40×, Olympus, Westborough, MA, USA). It is important to note that in the diagram, f1 denotes the focus of the objective lens, while f2 represents the point where the beam is ultimately converged. Since the incident light entering the objective lens is not parallel, the light’s focus does not align with the focus of the objective lens. The reflected light retraces its path to the 45° red reflective filter and is reflected towards the beam splitter. The beam splitter then redirects the light 90° and passes it through a pair of convex lenses (LB1676-A, Thorlabs), which focus the semi-circular light spot onto CCD1 (acA5472-5gc, Basler, Ahrensburg, Germany). Ultimately, the out-of-focus position signal is fed back to the motor (UPL-120, PI, a step motor with axial motion range of 13 mm and 0.05 µm positioning repeatability, Massachusetts, USA) through image processing algorithm software, thereby completing the autofocus system. The purpose of the coaxial visual real-time imaging system is to capture an image of the test object and verify whether the system has achieved focus. It operates similarly to a microscope and consists of coaxial vision (1-60255, Navita, Sao Paulo, Brazil), an image sensor which is same as CCD1, and an objective lens. The objective lens is shared with the autofocusing optical path.
The conventional method of focusing involves aligning the coaxial vision with the focus point and adjusting the focus path to achieve the smallest spot size, which is more intuitive. However, this method has a drawback: the spot is accurate only at the focus point and becomes heavily distorted before and after the focus point, leading to challenges in image processing and calculation. In this study, we addressed this issue by modifying the conventional focusing method. Instead of aligning the coaxial vision with the focus point where the focus path has the smallest spot size, we selected a section of the spot that forms a clear and uniform half-circle, where changes in focus can be easily observed, as the reference for focusing, as shown in Figure 5.
In comparison to the conventional approach (Figure 3), the system proposed in this study (Figure 4) achieves the ability to shift the focus point and mitigate the issue of severe distortion during measurement or image processing through the adjustment of an offset lens. Furthermore, this adjustment enables us to attain a more distinctly visible semi-circular spot, which displays clear variations. This not only reduces the complexities of image processing but also enhances the overall system accuracy. Additionally, employing a coaxial vision system allows for real-time observation of the focusing condition of the sample, confirming whether the sample is properly focused or not. The light spots obtained by the CCD at the focus before (left side) and after shifting (right side) are shown in Figure 6. It is evident that the light spot after shifting exhibits a distinct semi-circular contour, providing further evidence that shifting can prevent severe distortion of the light spot. The RMS radii of the light spot before and after focus shifting are 4.37 µm and 127.53 µm, respectively, while the peak irradiances are 45.8 W/cm² and 0.23698 W/cm², respectively. The centroid distance will be presented in Section 4. It is important to note that changes in the light spot on the focal point indirectly result in a reduction of the focus range. This means that as the distance from the focal point increases, the light spot captured by the CCD will quickly exceed the CCD’s reception range. The method proposed in this study, despite sacrificing the focus range to some extent, significantly enhances the focusing accuracy near the focal point. Furthermore, as mentioned earlier, the proposed system is designed for measuring smooth surfaces and can be applied in both the industrial and medical fields.
3.2. Experimental Prototype and Procedure of Proposed Autofocusing System
Figure 7 shows a photo of the experimental prototype, while Figure 8 displays the spots obtained at various defocus distances before and after shifting the focus point. Based on Figure 8, it is apparent that the spots acquired before shifting the focus point lack a distinct shape, and the distortion of the spots close to the focus point is inconsistent. This leads to increased random error in the system. In contrast, the spots obtained after shifting the focus point exhibit a clear semi-circular shape with minimal variation and error across multiple experiments. These advantages decrease the preprocessing steps and simplify image processing, enabling a wider range of threshold values for binarization, thereby enhancing overall accuracy.
Conducted in a controlled laboratory environment, the experiment involves a systematic procedure. Initially, the sample (PFR10-P01—25 mm × 36 mm protected silver mirror) is placed on a movable platform. Utilizing coaxial vision, the platform is finely adjusted to ensure precise alignment with the focal point. Subsequently, the platform undergoes translation within a defocus range spanning from −600 μm to 600 μm, with each step set at 50 μm, resulting in a total of 25 data sets. To scrutinize the impact in the vicinity of the focal point, a more detailed experiment is conducted. This focused investigation specifically concentrates on a narrower defocus distance, ranging from −60 μm to 60 μm, with each step at 5 μm. This refined approach generates an additional 25 data sets. Following this, a corrective measure is introduced by shifting an offset lens by 1.5 mm. This strategic adjustment simultaneously redirects the focus away from the region of severe distortion while maintaining the spot size within the CCD sensor range. The preceding experimental steps are then meticulously replicated. Following the experimental replication, each spot image undergoes additional image processing. This includes operations such as dilation, erosion, opening operation, closing operation, binarization, and Gaussian filtering. This sequence of processing steps enhances precision, enabling the extraction of specific features and information with increased accuracy. Upon completing image processing, the defocusing distance value is derived by calculating the distance from the centroid of the spot to the semi-circular axis. The calculated results are promptly integrated into the experimental setup, providing real-time feedback to the platform. This feedback mechanism achieves the desired effect of automatic focusing, contributing to the overall efficiency and reliability of the experimental process. The entire experimental protocol is reiterated five times, resulting in a robust dataset comprising a total of 500 data sets. This iterative approach not only reinforces the consistency of the results but also facilitates statistical analyses, enhancing the scientific validity of the study.
4. Experimental Results of Proposed System
4.1. Experimental Results
To understand the effect of spot shift on accuracy, we conducted two sets of experiments under lab conditions using the traditional centroid method and the improved system proposed in this study. The distance between each defocus position was 50 μm, and we repeated the experiments five times. We obtained two sets of data, which are shown in Figure 9 and Figure 10. The horizontal axis represents the defocus distance, while the vertical axis represents the number of pixels on the CCD. The red line connects the average values obtained from each measurement point after five experiments, while the blue lines represent the error bars for each measurement point across the five experiments. Based on the principles of geometric optics and triangulation, the centroid distance of the spot, which is the distance between the centroid and the centerline, exhibits a linear relationship with the defocus distance [23,24]. From Figure 9 and Figure 10, it can be observed that there is minimal disparity in the trends of defocus distance and inter-center distance before and after the focus shift. The R-squared values for the two datasets are 0.99 and 1, indicating a high level of fit. The repeatability of focus positions before and after the focus shift are 3.4 pixels and 2.3 pixels, respectively, with the maximum repeatability error occurring at a defocus distance of 50 μm.
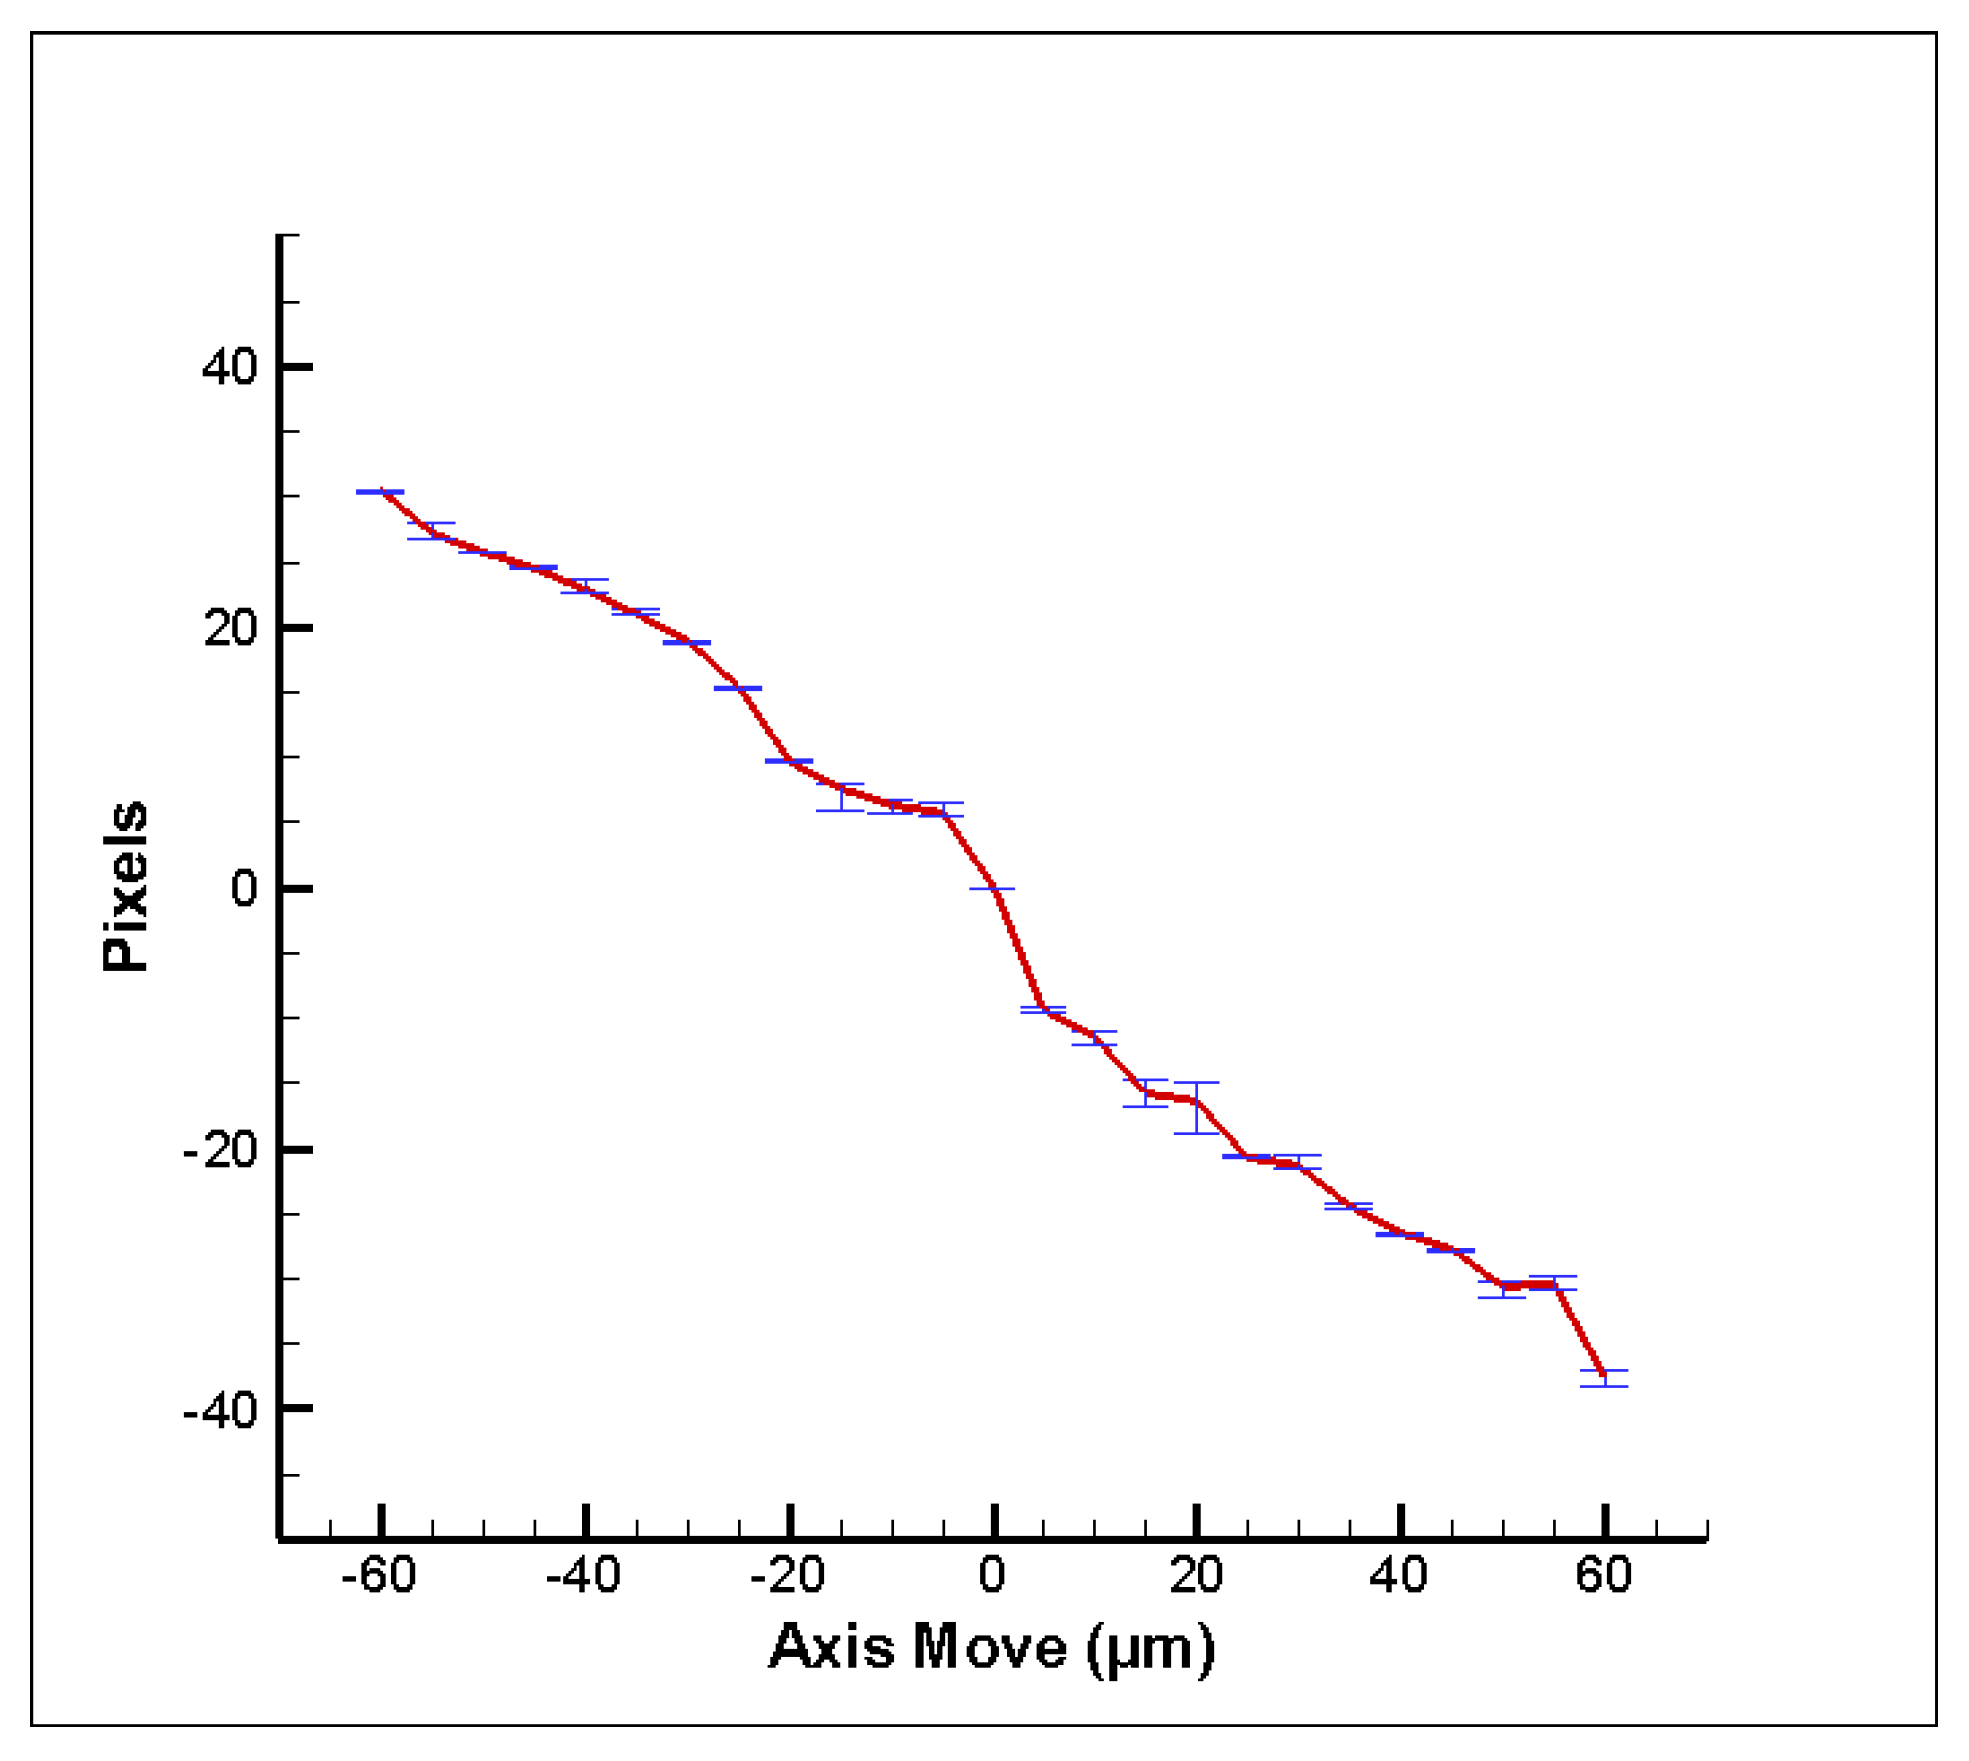
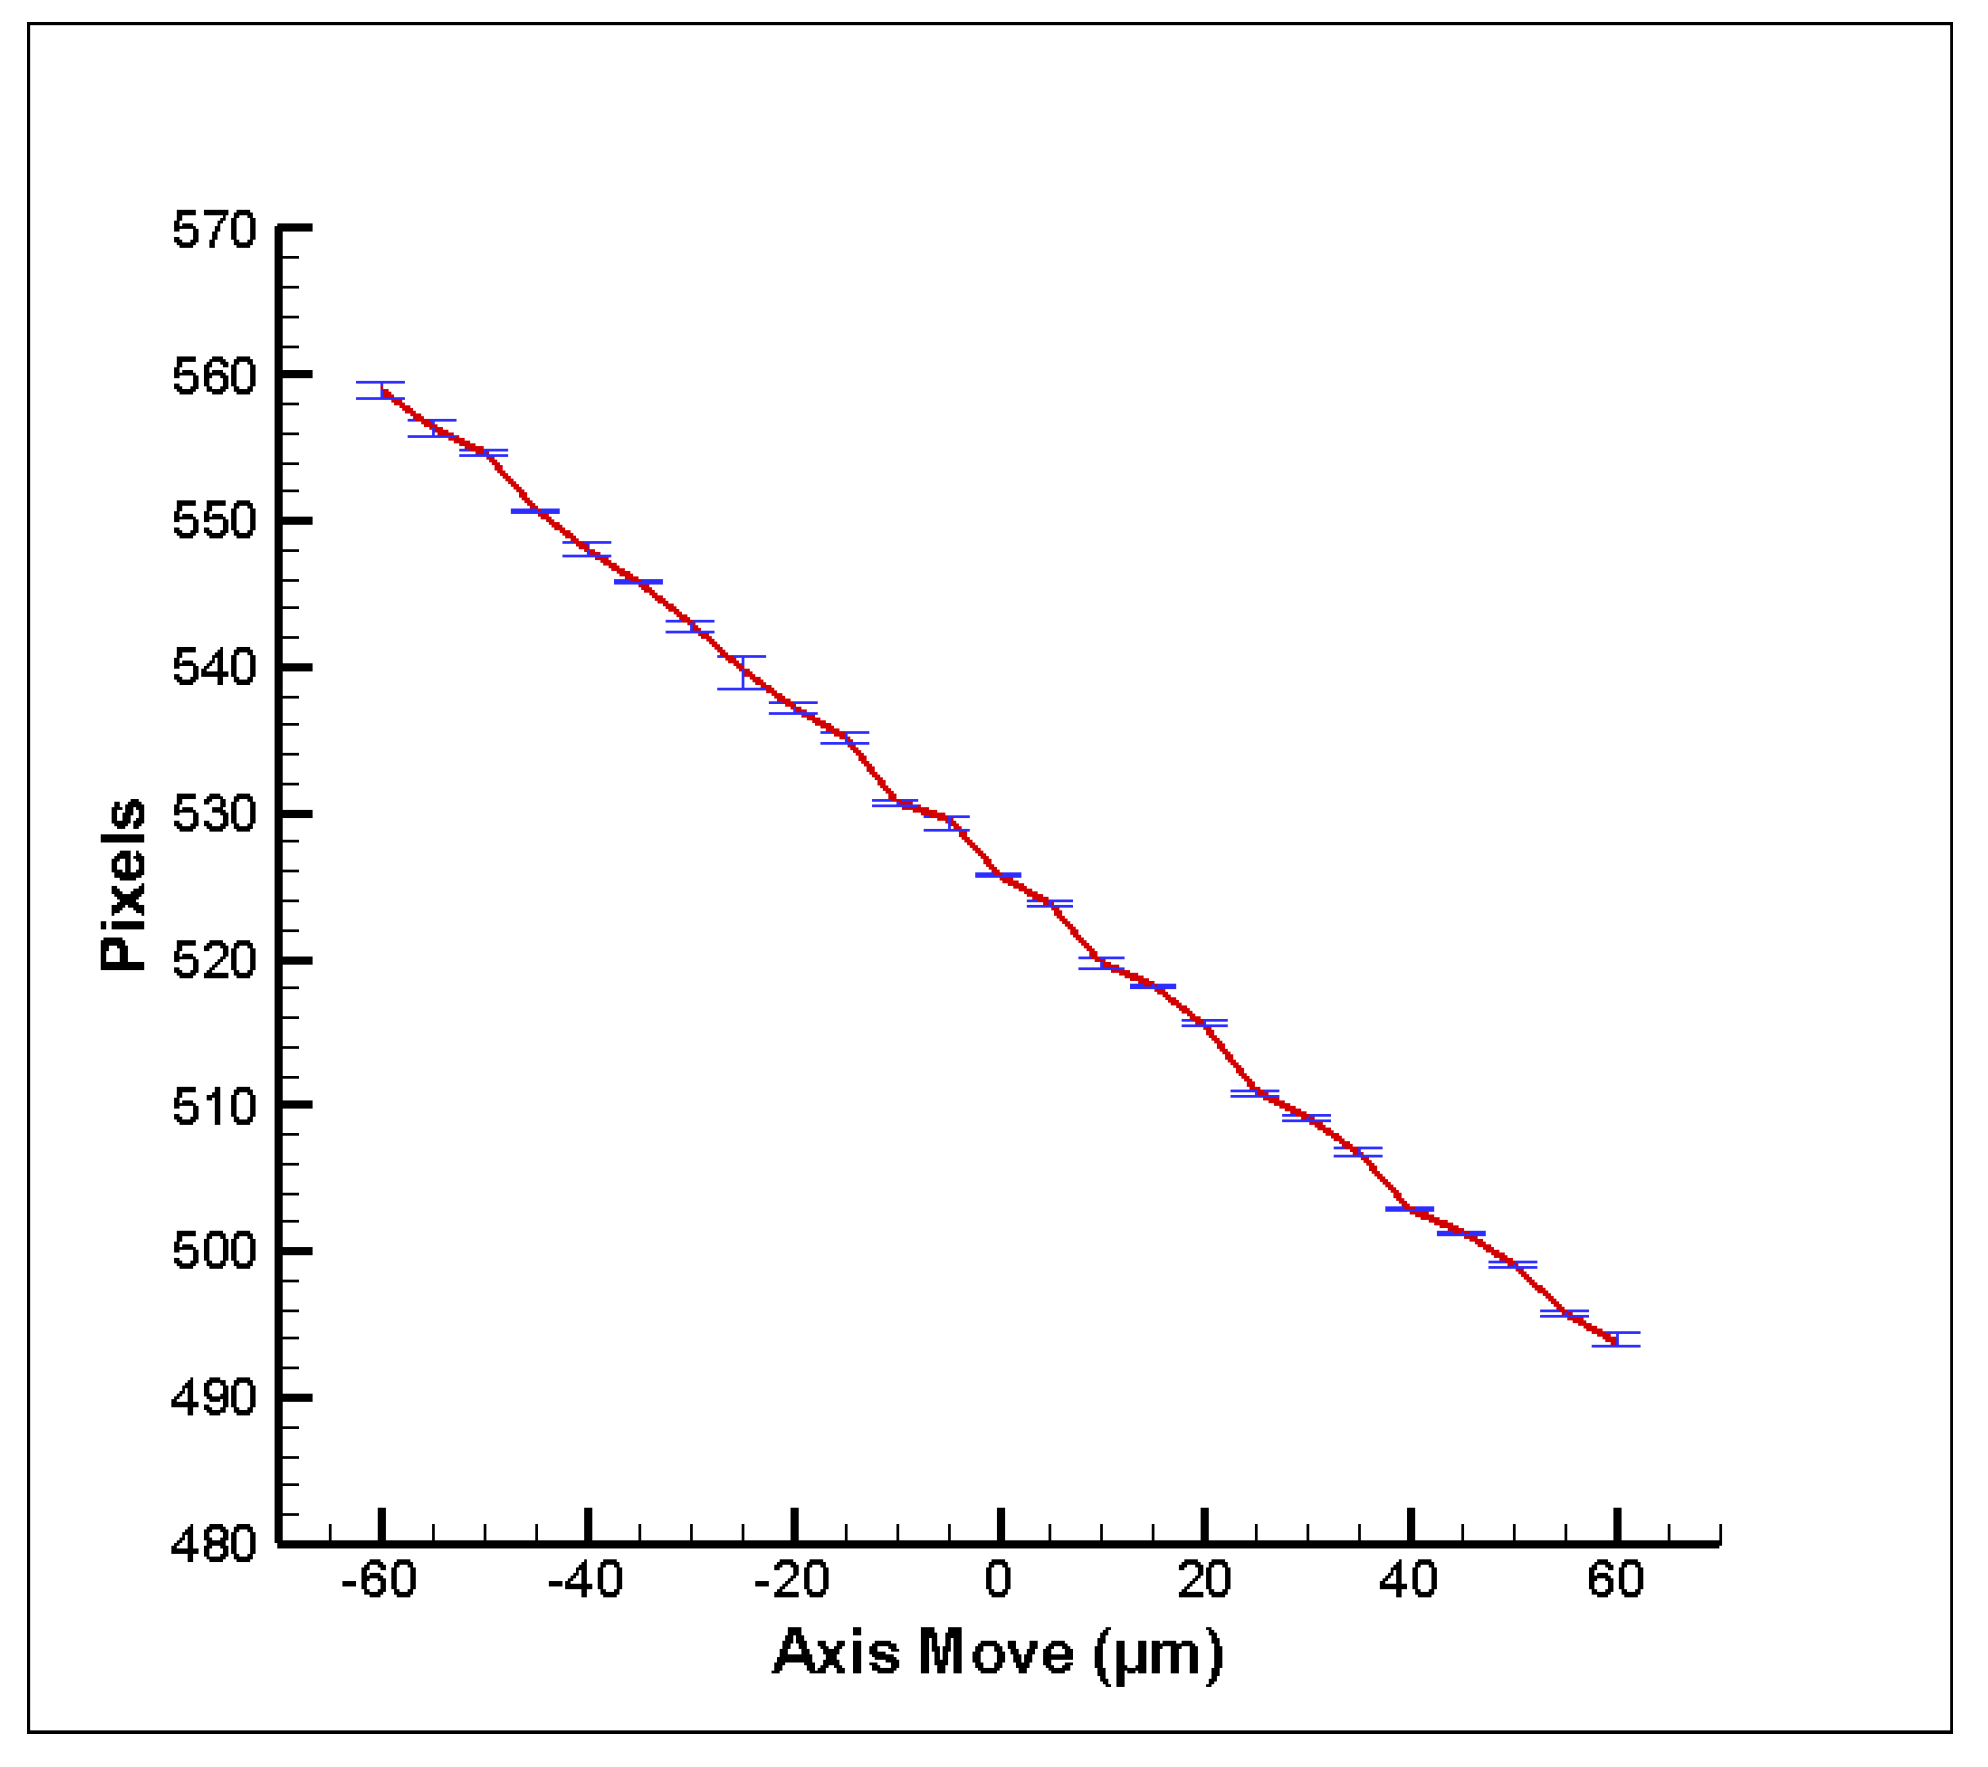
The aforementioned data confirm the experiment’s accuracy; however, they fall short of fully illustrating the impact of the severely deformed region near the focus on experimental errors. Therefore, we conducted a more detailed experimental study on the defocus area near the focus point. Figure 11 and Figure 12 present the data obtained using the traditional centroid method and the proposed improved system in this study, respectively. The horizontal and vertical axes represent the defocus distance and the number of pixel grids on the CCD, respectively. Similarly, the red line connects the average values obtained from each measurement point after five experiments, while the blue lines represent the error bars for each measurement point across the five experiments. It is important to note that, in this experiment, we adjusted the defocus interval to 5 μm, providing finer granularity compared to the previous experiment. This adjustment allowed us to observe enhanced accuracy, particularly in the vicinity of the focus point. The R-squared values for the two datasets are 0.984 and 0.999, with repeatability values of 3.92 pixels and 1.14 pixels, respectively. As anticipated, the data obtained before the focus shift did not exhibit significant variations. However, when we reduced the defocus interval and narrowed the defocus range, the impact of severe spot deformation became clearly observable. This further validates the effectiveness of the proposed improved system in addressing spot distortion, thereby enhancing the system’s reliability and precision.
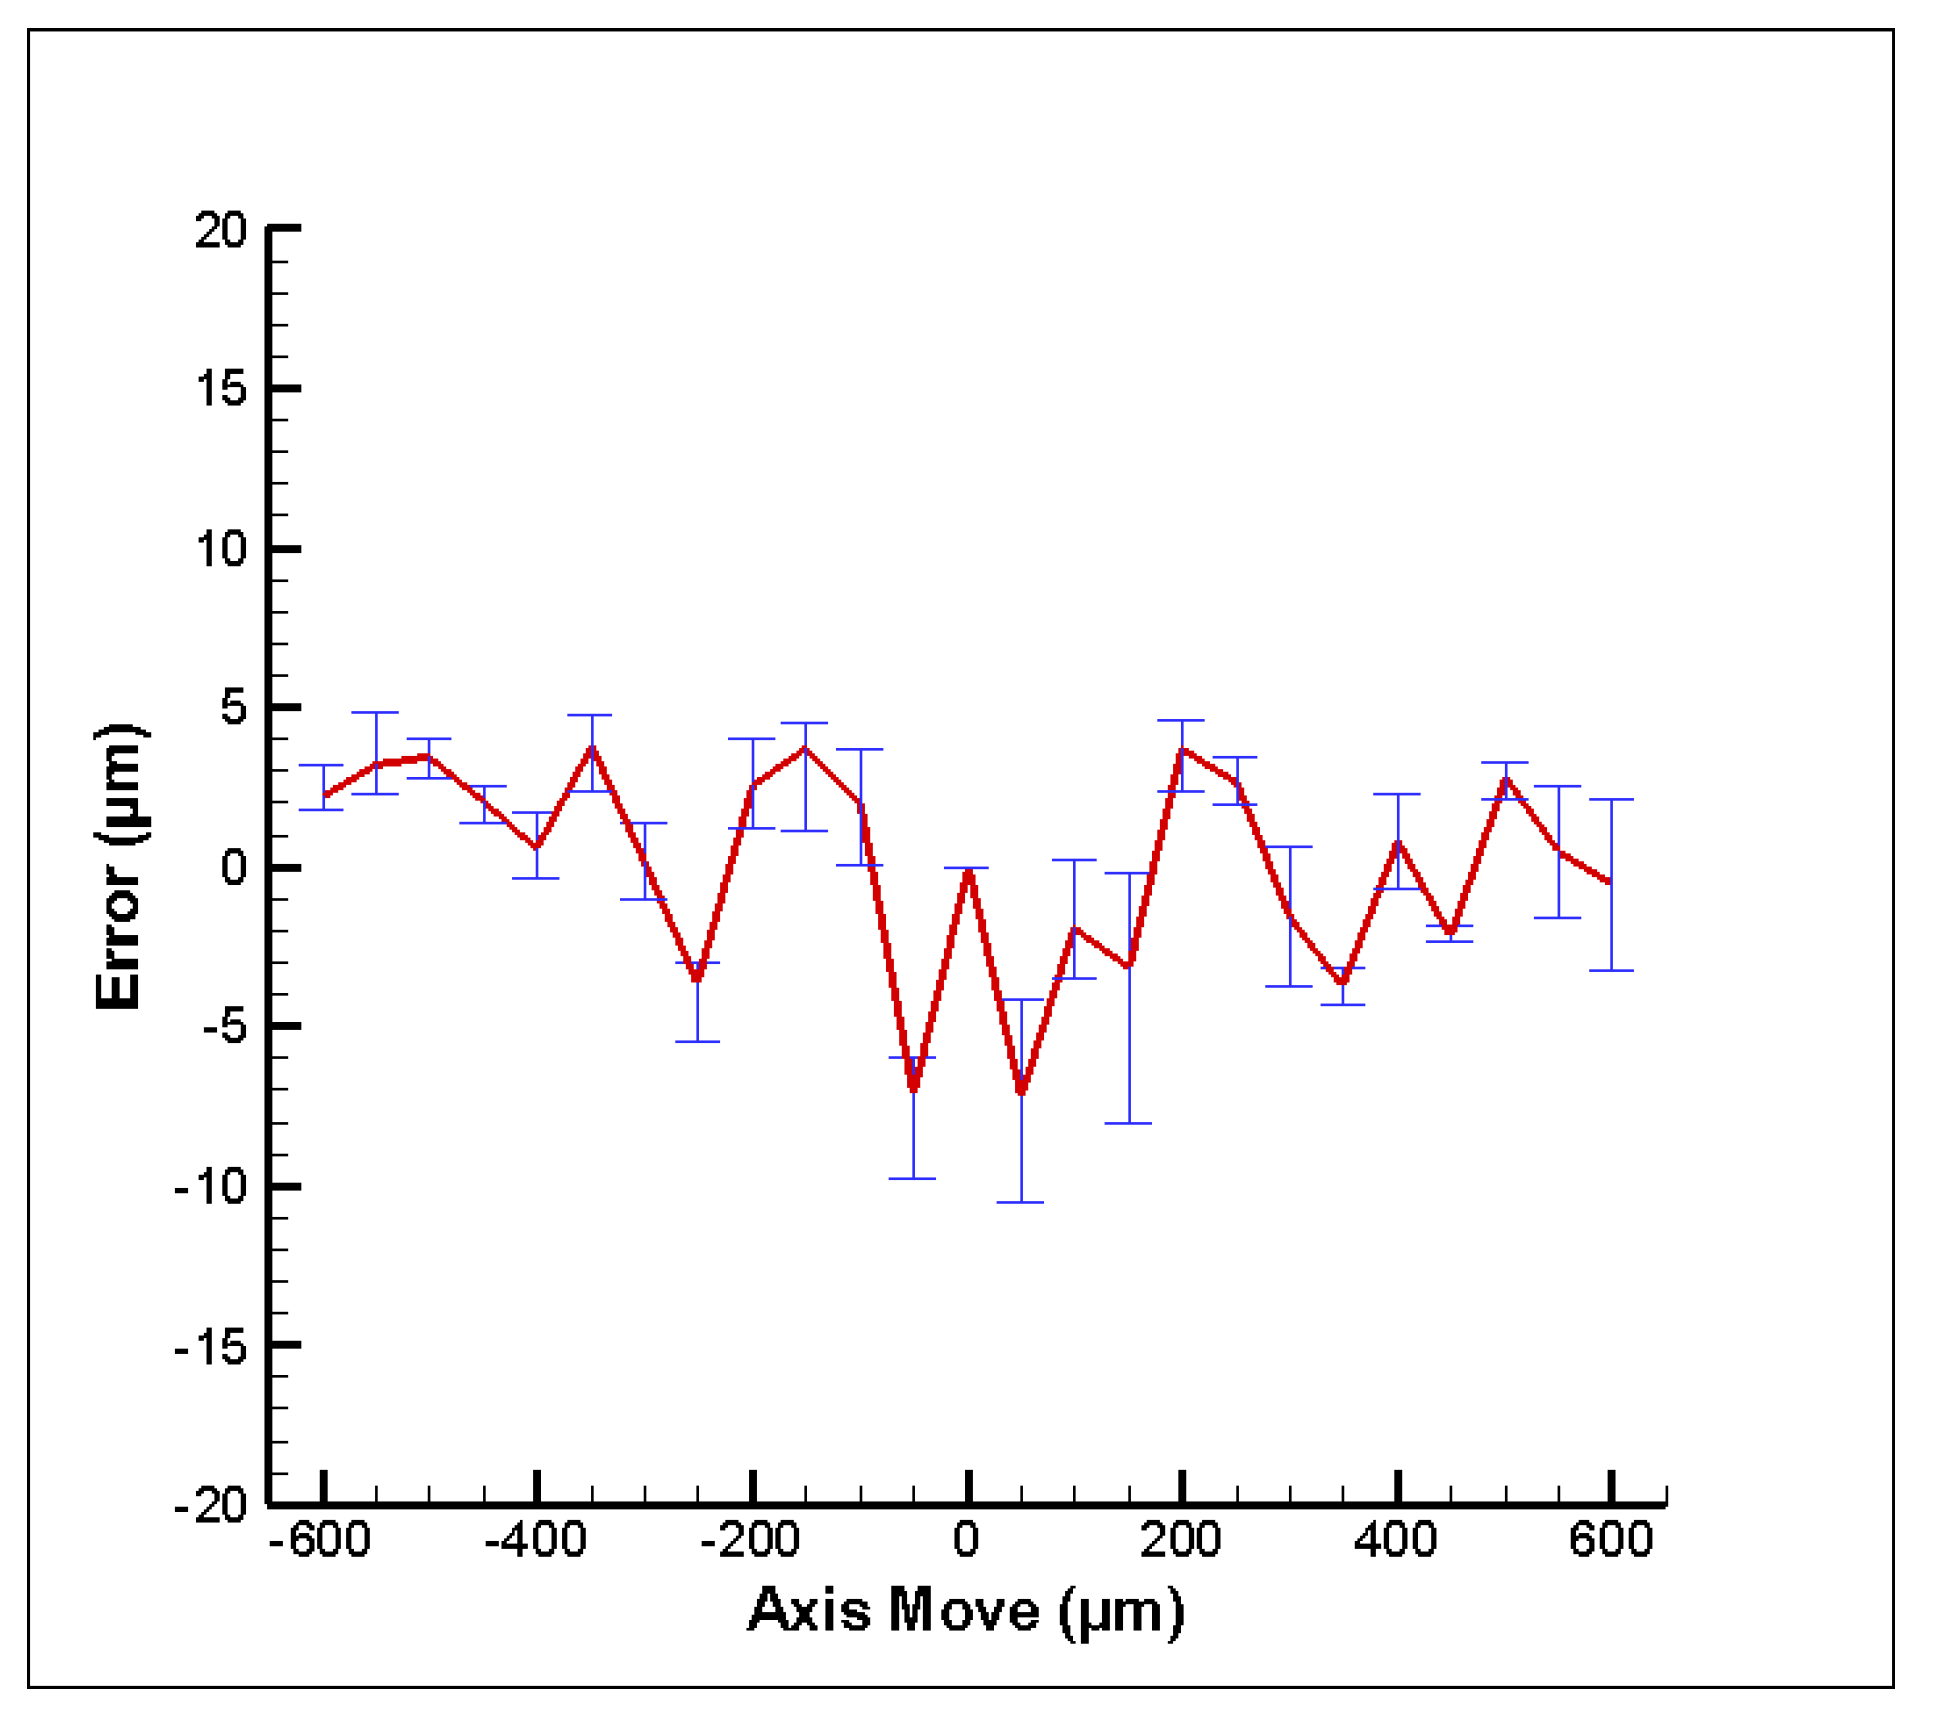
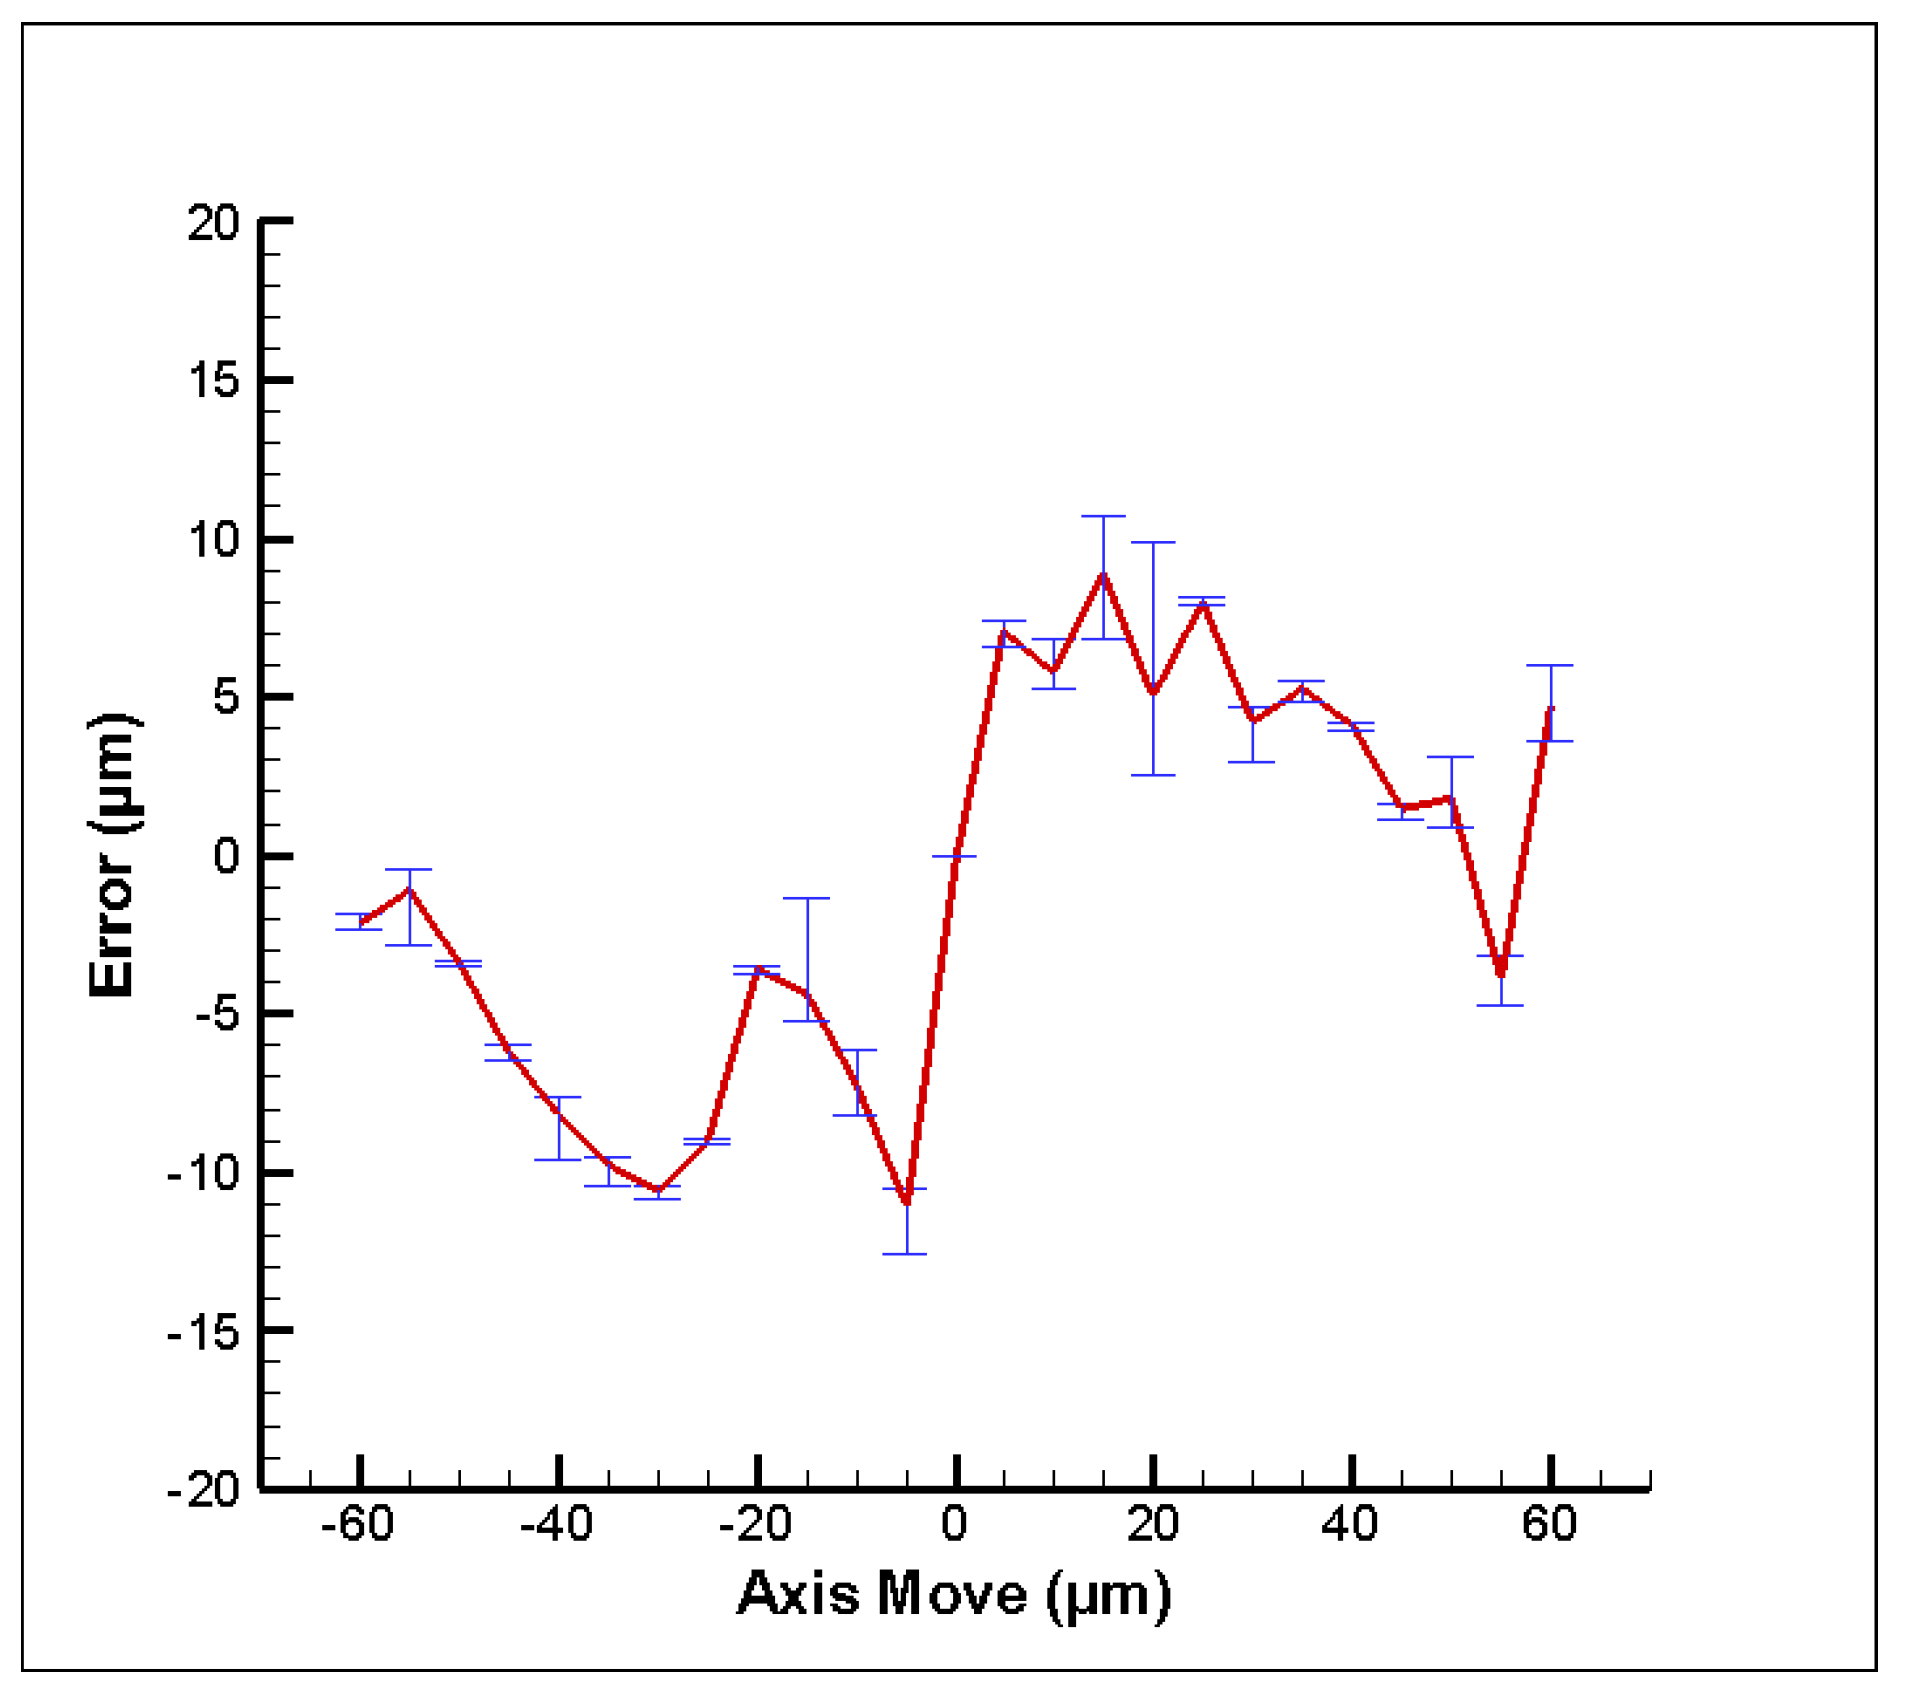
Figure 13, Figure 14, Figure 15 and Figure 16 show the autofocus accuracy before and after the focus shift at different defocus distances, with defocus intervals of 50 μm and 5 μm, respectively. Figure 13 and Figure 14 illustrate that, under consistent image processing techniques and in the presence of similar environmental disturbances, the maximum errors before and after the focus shift within the extended defocus range are approximately −7.1 μm to 3.7 μm and −3.7 μm to 3.7 μm, respectively. The corresponding repeatability values are 6.3 μm and 3.8 μm. Figure 15 and Figure 16 show the relationship between defocus distance and error within a shorter defocus range. The maximum errors for the two datasets are approximately −11.1 μm to 8.0 μm and −2.3 μm to 1.8 μm, with corresponding repeatability values of 7.3 μm and 3.8 μm, respectively. Consequently, the outcomes of this study carry both scholarly and practical importance. They not only hold academic value but also offer practical applicability in the realms of high-precision measurement and image processing. The uniqueness of our method lies in its relative simplicity compared to other precision improvement systems, as it only requires the use of an offset lens without the need for additional expensive equipment. To integrate our method into existing autofocus systems, you simply need to add the offset lens and employ a specially designed mechanism to secure the lens, ensuring it remains stable and unaffected by random movements or vibrations. However, the robustness of this mechanism is crucial for the reliability of the system. In practical applications, the reliability and stability of the mechanism often determine whether our autofocus system can provide high precision performance under various environmental conditions, ensuring that the lens is not disturbed by external factors such as vibration or impact. Such an integration method not only saves costs but also enables higher focusing precision in practical applications, which is a significant advantage of our approach.
The enhanced system proposed in this study introduces innovations with potential applications in various related industries, including the semiconductor industry, laser processing, and even automatic focusing in medical engineering. The extension of these application possibilities not only enhances the practicality of our method but also broadens its scope, making it more versatile. Firstly, the semiconductor industry is a critical field that demands highly precise optical systems to ensure the accuracy of manufacturing and inspection processes for semiconductor components. Our enhanced system can be applied to automatic focusing in semiconductor manufacturing, improving production efficiency and ensuring component quality. Secondly, laser processing is another field where high-precision automatic focusing is essential, encompassing various laser applications ranging from cutting to engraving. Our system can provide more accurate automatic focusing in these applications, ensuring optimal processing results and enabling more efficient laser processing in industrial settings. Furthermore, the field of medical engineering can also benefit from our system. Automatic focusing plays a pivotal role in medical imaging equipment and surgical robotics. Our method can enhance the precision of these devices, assisting medical professionals in achieving more accurate diagnoses and treatments, ultimately improving the quality of healthcare. In summary, the enhanced system proposed in our study offers a wide range of potential applications, spanning multiple industries, and brings innovation and benefits to various applications. The expansion of these potential application areas makes our method more relevant and versatile, opening up new possibilities across various sectors.
4.2. Discussion
The primary source of error before the focus shift arises from the severe deformation of the spot, making it challenging to discern the semi-elliptical characteristics of the spot. Figure 13 highlights that regions with larger error bars are predominantly located near the focus point. On the other hand, the error after the focus shift primarily emerges from the divergence of spot energy, resulting in increased interference from ambient light. Figure 14 indicates that areas with larger error bars are more prevalent when dealing with negative defocus distances, as these positions exhibit larger and more divergent spot characteristics. In comparison to Figure 13, Figure 15 reveals larger errors and more prominent error bars, reaffirming the impact of the deformed region near the focus point on the precision and repeatability of the autofocus system. Conversely, Figure 16 demonstrates that a significant improvement in error and repeatability occurs after the focus shift. These results validate that, when the defocus distance is close, the traditional structure presents higher errors, underscoring the challenge of reduced accuracy due to severe spot deformation near the focus point. Impressively, this challenge is effectively addressed through the use of a sole offset lens, achieving accuracy within 3 μm without the need for supplementary compensation systems or costly optics. Furthermore, compared to previous research [19], this system introduces improvements that specifically focus on the region near the focal point, utilizing a pre-established knife-edge centroid method. In prior studies, the issue of light spot deformation had not been addressed; however, in the course of our research, we further tackled this previously unmentioned concern. This can be seen as a significant step forward in our progress.
5. Conclusions
In conclusion, this research introduces a state-of-the-art autofocus system characterized by an innovative optical design aimed at achieving precise focus shift and minimizing spot deformation near the focal point. The experimental findings underscore the superiority of this system over conventional centroid methods, demonstrating a remarkable autofocus accuracy of 3 μm. Beyond its immediate application in autofocus technology, this advancement holds significant promise for enhancing optical inspection processes and finding valuable utility in diverse industrial applications. Moreover, the inherent versatility of this improved system allows seamless integration into existing setups, eliminating the need for expensive equipment, and rendering it a practical and efficient solution. The potential impact extends far beyond the realm of autofocus, offering tangible advantages to a spectrum of industries. The semiconductor sector stands to benefit from heightened precision, while laser processing could capitalize on the system’s enhanced capabilities. Even within the realm of medical engineering, automated focusing could experience notable improvements, further showcasing the breadth of applicability and innovation introduced by the proposed enhanced autofocus system. This research makes a substantial contribution to the advancement of diverse fields, driving technological progress and enhancing product quality and efficiency.
Author Contributions
Conceptualization, H.-D.T. and C.-S.L.; methodology, H.-D.T. and C.-S.L.; software, J.-H.H.; validation, J.-H.H. and W.-H.H.; formal analysis, J.-H.H. and W.-H.H.; investigation, J.-H.H., W.-H.H. and C.-S.L.; data curation, J.-H.H.; writing—original draft preparation, J.-H.H.; writing—review and editing, C.-S.L.; supervision, C.-S.L.; project administration, C.-S.L.; funding acquisition, C.-S.L. All authors have read and agreed to the published version of the manuscript.
Funding
This paper was funded by the Ministry of Science and Technology of Taiwan under Grant Nos. MOST 106-2628-E-006-010-MY3 and 110-2221-E-006-126-MY3.
Institutional Review Board Statement
Not applicable.
Informed Consent Statement
Not applicable.
Data Availability Statement
Data are contained within the article.
Acknowledgments
Ansys Inc. is thanked for providing the ANSYS academic partner program.
Conflicts of Interest
The authors declare no conflict of interest.
References
- Wang, F.; Cao, P.; Zhang, Y.; Hu, H.; Yang, Y. A machine vision method for correction of eccentric error based on adaptive enhancement algorithm. IEEE Trans. Instrum. Meas. 2020, 70, 5002311. [Google Scholar] [CrossRef]
- Shi, Q.; Xi, N.; Chen, Y. Development of an automatic optical measurement system for automotive part surface inspection. In Proceedings of the 2005 IEEE/ASME International Conference on Advanced Intelligent Mechatronics, Monterey, CA, USA, 24–28 July 2005; pp. 1557–1562. [Google Scholar]
- Abd Al Rahman, M.; Mousavi, A. A review and analysis of automatic optical inspection and quality monitoring methods in electronics industry. IEEE Access 2020, 8, 183192–183271. [Google Scholar]
- Shirazi, M.F.; Park, K.; Wijesinghe, R.E.; Jeong, H.; Han, S.; Kim, P.; Jeon, M.; Kim, J. Fast industrial inspection of optical thin film using optical coherence tomography. Sensors 2016, 16, 1598. [Google Scholar] [CrossRef] [PubMed]
- Agour, M.; Falldorf, C.; Bergmann, R.B. Spatial multiplexing and autofocus in holographic contouring for inspection of micro-parts. Opt. Express 2018, 26, 28576–28588. [Google Scholar] [CrossRef] [PubMed]
- Fuller, D.N.; Kellner, A.L.; Price, J.H. Exploiting chromatic aberration for image-based microscope autofocus. Appl. Opt. 2011, 50, 4967–4976. [Google Scholar] [CrossRef]
- Moscaritolo, M.; Jampel, H.; Knezevich, F.; Zeimer, R. An image based auto-focusing algorithm fordigital fundus photography. IEEE Trans. Med. Imaging 2009, 28, 1703–1707. [Google Scholar] [CrossRef]
- Burge, J. Accurate Image-Based Estimates of Focus Error in the Human Eye and in a Smartphone Camera. Inf. Disp. 2017, 33, 18–23. [Google Scholar] [CrossRef]
- Marrugo, A.G.; Millán, M.S.; Abril, H.C. Implementation of an image based focusing algorithm for non-mydriatic retinal imaging. In Proceedings of the 2014 III International Congress of Engineering Mechatronics and Automation (CIIMA), Cartagena, Colombia, 22–24 October 2014; pp. 1–3. [Google Scholar]
- Yang, C.; Chen, M.; Zhou, F.; Li, W.; Peng, Z. Accurate and rapid auto-focus methods based on image quality assessment for telescope observation. Appl. Sci. 2020, 10, 658. [Google Scholar] [CrossRef]
- Choi, H.; Ryu, J. Design of wide angle and large aperture optical system with inner focus for compact system camera applications. Appl. Sci. 2019, 10, 179. [Google Scholar] [CrossRef]
- Marks, D.L.; Oldenburg, A.L.; Reynolds, J.J.; Boppart, S.A. Autofocus algorithm for dispersion correction in optical coherence tomography. Appl. Opt. 2003, 42, 3038–3046. [Google Scholar] [CrossRef]
- Bathe-Peters, M.; Annibale, P.; Lohse, M. All-optical microscope autofocus based on an electrically tunable lens and a totally internally reflected IR laser. Opt. Express 2018, 26, 2359–2368. [Google Scholar] [CrossRef] [PubMed]
- Liang, Y.; Yan, M.; Tang, Z.; He, Z.; Liu, J. Learning to autofocus based on gradient boosting machine for optical microscopy. Optik 2019, 198, 163002. [Google Scholar] [CrossRef]
- Liu, C.-S.; Jiang, S.-H. A novel laser displacement sensor with improved robustness toward geometrical fluctuations of the laser beam. Meas. Sci. Technol. 2013, 24, 105101. [Google Scholar] [CrossRef]
- Du, J.; Sun, S.; Li, F.; Jiang, J.; Yan, W.; Wang, S.; Tian, P. Large range nano autofocus method based on differential centroid technique. Opt. Laser Technol. 2023, 159, 109015. [Google Scholar] [CrossRef]
- Gu, C.-C.; Cheng, H.; Wu, K.-J.; Zhang, L.-J.; Guan, X.-P. A high precision laser-based autofocus method using biased image plane for microscopy. J. Sens. 2018, 2018, 8542680. [Google Scholar] [CrossRef]
- Chen, R.; van Beek, P. Improving the accuracy and low-light performance of contrast-based autofocus using supervised machine learning. Pattern Recognit. Lett. 2015, 56, 30–37. [Google Scholar] [CrossRef]
- Liu, C.-S.; Tu, H.-D. Innovative image processing method to improve autofocusing accuracy. Sensors 2022, 22, 5058. [Google Scholar] [CrossRef]
- Fu, W.; Li, H. An Improved Phase Gradient Autofocus Algorithm For ISAR Phase Autofocus Problem. arXiv 2023. [Google Scholar] [CrossRef]
- Zhang, X.; Fan, F.; Gheisari, M.; Srivastava, G. A novel auto-focus method for image processing using laser triangulation. IEEE Access 2019, 7, 64837–64843. [Google Scholar] [CrossRef]
- Bueno-Ibarra, M.A.; A’lvarez-Borrego, J.; Acho, L.; Chávez-Sánchez, M.C. Fast autofocus algorithm for automated microscopes. Opt. Eng. 2005, 44, 063601–063601-063608. [Google Scholar]
- Liu, C.-S.; Hu, P.-H.; Lin, Y.-C. Design and experimental validation of novel optics-based autofocusing microscope. Appl. Phys. B 2012, 109, 259–268. [Google Scholar] [CrossRef]
- Liu, C.-S.; Jiang, S.-H. Design and experimental validation of novel enhanced-performance autofocusing microscope. Appl. Phys. B 2014, 117, 1161–1171. [Google Scholar] [CrossRef]
Figure 1.
Schematic illustration of the light spots and light path under different defocusing conditions.
Figure 1.
Schematic illustration of the light spots and light path under different defocusing conditions.

Figure 2.
Defocused light spots in centroid method.

Figure 3.
Optical path diagram of the traditional optics-based autofocusing structure with centroid method.
Figure 3.
Optical path diagram of the traditional optics-based autofocusing structure with centroid method.

Figure 4.
Structure of proposed autofocusing system.

Figure 5.
Spot patterns near the focus after focus shift.

Figure 6.
Light spots at the focus before and after shifting from left to right.

Figure 7.
Photograph of prototype model.

Figure 8.
Spots at various defocus distances before and after shifting the focus point.

Figure 9.
Data for each defocus interval of 50 μm before spot shift (traditional method). Red line represents the average values obtained from experiments and blue line represents the error bars.
Figure 9.
Data for each defocus interval of 50 μm before spot shift (traditional method). Red line represents the average values obtained from experiments and blue line represents the error bars.

Figure 10.
Data for each defocus interval of 50 μm after spot shift (proposed method). Red line represents the average values obtained from experiments and blue line represents the error bars.
Figure 10.
Data for each defocus interval of 50 μm after spot shift (proposed method). Red line represents the average values obtained from experiments and blue line represents the error bars.

Figure 11.
Data for each defocus interval of 5 μm before spot shift (traditional method). Red line represents the average values obtained from experiments and blue line represents the error bars.
Figure 11.
Data for each defocus interval of 5 μm before spot shift (traditional method). Red line represents the average values obtained from experiments and blue line represents the error bars.

Figure 12.
Data for each defocus interval of 5 μm after spot shift (proposed method). Red line represents the average values obtained from experiments and blue line represents the error bars.
Figure 12.
Data for each defocus interval of 5 μm after spot shift (proposed method). Red line represents the average values obtained from experiments and blue line represents the error bars.

Figure 13.
Error for each defocus interval of 50 μm before spot shift (traditional method). Red line represents the average values obtained from experiments and blue line represents the error bars.
Figure 13.
Error for each defocus interval of 50 μm before spot shift (traditional method). Red line represents the average values obtained from experiments and blue line represents the error bars.

Figure 14.
Error for each defocus interval of 50 μm after spot shift (proposed method). Red line represents the average values obtained from experiments and blue line represents the error bars.
Figure 14.
Error for each defocus interval of 50 μm after spot shift (proposed method). Red line represents the average values obtained from experiments and blue line represents the error bars.

Figure 15.
Error for each defocus interval of 5 μm before spot shift (traditional method). Red line represents the average values obtained from experiments and blue line represents the error bars.
Figure 15.
Error for each defocus interval of 5 μm before spot shift (traditional method). Red line represents the average values obtained from experiments and blue line represents the error bars.

Figure 16.
Error for each defocus interval of 5 μm after spot shift (proposed method). Red line represents the average values obtained from experiments and blue line represents the error bars.
Figure 16.
Error for each defocus interval of 5 μm after spot shift (proposed method). Red line represents the average values obtained from experiments and blue line represents the error bars.

Disclaimer/Publisher’s Note: The statements, opinions and data contained in all publications are solely those of the individual author(s) and contributor(s) and not of MDPI and/or the editor(s). MDPI and/or the editor(s) disclaim responsibility for any injury to people or property resulting from any ideas, methods, instructions or products referred to in the content. |
© 2023 by the authors. Licensee MDPI, Basel, Switzerland. This article is an open access article distributed under the terms and conditions of the Creative Commons Attribution (CC BY) license (https://creativecommons.org/licenses/by/4.0/).
Share and Cite
MDPI and ACS Style
Hung, J.-H.; Tu, H.-D.; Hsu, W.-H.; Liu, C.-S. Design and Experimental Validation of an Optical Autofocusing System with Improved Accuracy. Photonics 2023, 10, 1329. https://doi.org/10.3390/photonics10121329
AMA Style
Hung J-H, Tu H-D, Hsu W-H, Liu C-S. Design and Experimental Validation of an Optical Autofocusing System with Improved Accuracy. Photonics. 2023; 10(12):1329. https://doi.org/10.3390/photonics10121329
Chicago/Turabian StyleHung, Jui-Hsiang, Ho-Da Tu, Wen-Huai Hsu, and Chien-Sheng Liu. 2023. "Design and Experimental Validation of an Optical Autofocusing System with Improved Accuracy" Photonics 10, no. 12: 1329. https://doi.org/10.3390/photonics10121329
Note that from the first issue of 2016, this journal uses article numbers instead of page numbers. See further details here.