FP Interferometric Optic Fiber Humidity Sensor Based on Acrylate AB Adhesive Film
by
 , , and
Qiying Wang
1 ,
,
Fangfang Zhang
1,
Mengfan Zhang
1,
Kunpu Zhang
2,
Yaqian Zhang
1,*,
Guanjun Wang
1,*,
Zhuhua Hu
1 and
Qian Deng
1 1
School of Information and Communication Engineering, Hainan University, Haikou 570228, China
2
School of Materials and Chemical Engineering, Beijing University of Chemical Technology, Beijing 100029, China
*
Authors to whom correspondence should be addressed.
Photonics 2023, 10(8), 873; https://doi.org/10.3390/photonics10080873
Submission received: 1 June 2023
/
Revised: 19 July 2023
/
Accepted: 20 July 2023
/
Published: 27 July 2023
(This article belongs to the Special Issue Editorial Board Members’ Collection Series: Photonics Sensors)
Abstract
:In this paper, an optical fiber humidity sensor based on acrylate AB adhesive film is studied, and two methods—a bubbling method and a dual pressure assisted method—for preparing thin films are proposed. The forms will make the thin film lighter and make the sensor more sensitive. Using a glass tube to connect the acrylate AB adhesive film to the single mode optical fiber, the humidity sensor is obtained. Through humidity response experiments, the sensor’s sensitivity reaches 167.5 pm/% RH, and the response time reaches 4.8 s/% RH. At the same time, the experiments show that the sensor has good repeatability and stability. Finally, the influence of temperature on the working process is analyzed, and we provide a method for improvement through FBG.
1. Introduction
Relative humidity is a physical quantity that cannot be ignored in numerous areas of daily life and industrial production, such as human health [1], environmental monitoring [2], industrial production [3], structural health testing [4], electronic device manufacturing [5], and other fields. For a comfortable life and efficient production, it is necessary to effectively monitor relative humidity through sensing devices. Compared with traditional electronic humidity sensors, optical fiber humidity sensors have the advantages of compact structure, high sensitivity, anti-electromagnetic interference, and being able to work in harsh environments such as high temperature and flammability [6]. Currently, there has been a lot of research on optical fiber humidity sensors, including optical fiber interferometer [7], Fiber Bragg Grating [8], photonic crystal fiber [9], Resonators [10], refractive index sensitive fiber [11], etc. Among them, the interferometric fiber optic humidity sensors have attracted more attention due to their flexible design and wide measurement range. In particular, the Fabry–Pérot (FP) interferometric humidity sensors have a simple structure and are easy to implement, and they also show good performance in humidity detection. Changpeng Lang [12] et al. used the tensile curing method to fabricate an optic fiber FPI (Fabry–Pérot interferometer) of polymer microrods based on the end face of the fiber core. This humidity sensor has the advantages of simple fabrication process, low cost, high sensitivity, and fast response. Bo Wang [13] et al. proposed a highly sensitive humidity optical fiber sensor based on full agar FPI. The sensor is made by coating a thin layer of humidity sensitive agar on a single mode optical fiber using an end immersion method. The sensitivity is 4.20 nm/% RH, and the response time is shorter than 340 ms, with excellent characteristics.
In addition, with the development of optical fiber sensing technology, optical fibers can be combined with biochemical sensitive materials with different characteristics, such as agar [14], chitosan [15], SnO2 [16], graphene [17], and so on, to achieve the detection of more physical quantities, and this aspect has been widely reported. Kai Ni [18] et al. proposed a new type of humidity sensor based on the MZI (Mach–Zehnder interferometer) principle. The sensor is formed by fusing the waist expansion between two SMFs and is modified by depositing chitosan on the surface of the single mode optical fiber, possessing a sensitivity of 119.6 pm/% RH. Rang Chu [19] et al. spliced a section of dual core optical fiber with a standard single mode optical fiber to make the splice point smaller and produced a highly sensitive graphene oxide humidity sensor based on a side polished dual core optical fiber Michelson interferometer. Although the measurement range is small, it has ultra-high humidity sensitivity. Ruijie Tong [20] et al. designed a new type of MZI based on photonic crystal fibers coated with graphene quantum dots and polyvinyl alcohol film for relative humidity detection. As the relative humidity changes, the refractive index and volume of the film change, and films with different thicknesses have different sensitivity and spectral movement directions.
Acrylate AB adhesive has the advantages of low cost, simple operation, and good stability and is widely used in daily life as an adhesive [21]. Its molecules have hydrophilic groups [22]. The refractive index of the adhesive film changes after adsorbing water molecules, giving it a more sensitive humidity response. Aiming at the problems of complex fabrication and high process requirements in traditional optical fiber humidity sensors, this paper focuses on the principle of FP interference, combining optical fiber with acrylate AB film and fabricating an optical fiber humidity sensor. The proposed sensor has a simple manufacturing process, stable performance, and good performance in response time. As a humidity sensor, it has good application prospects and practical value.
2. Structure and Principle
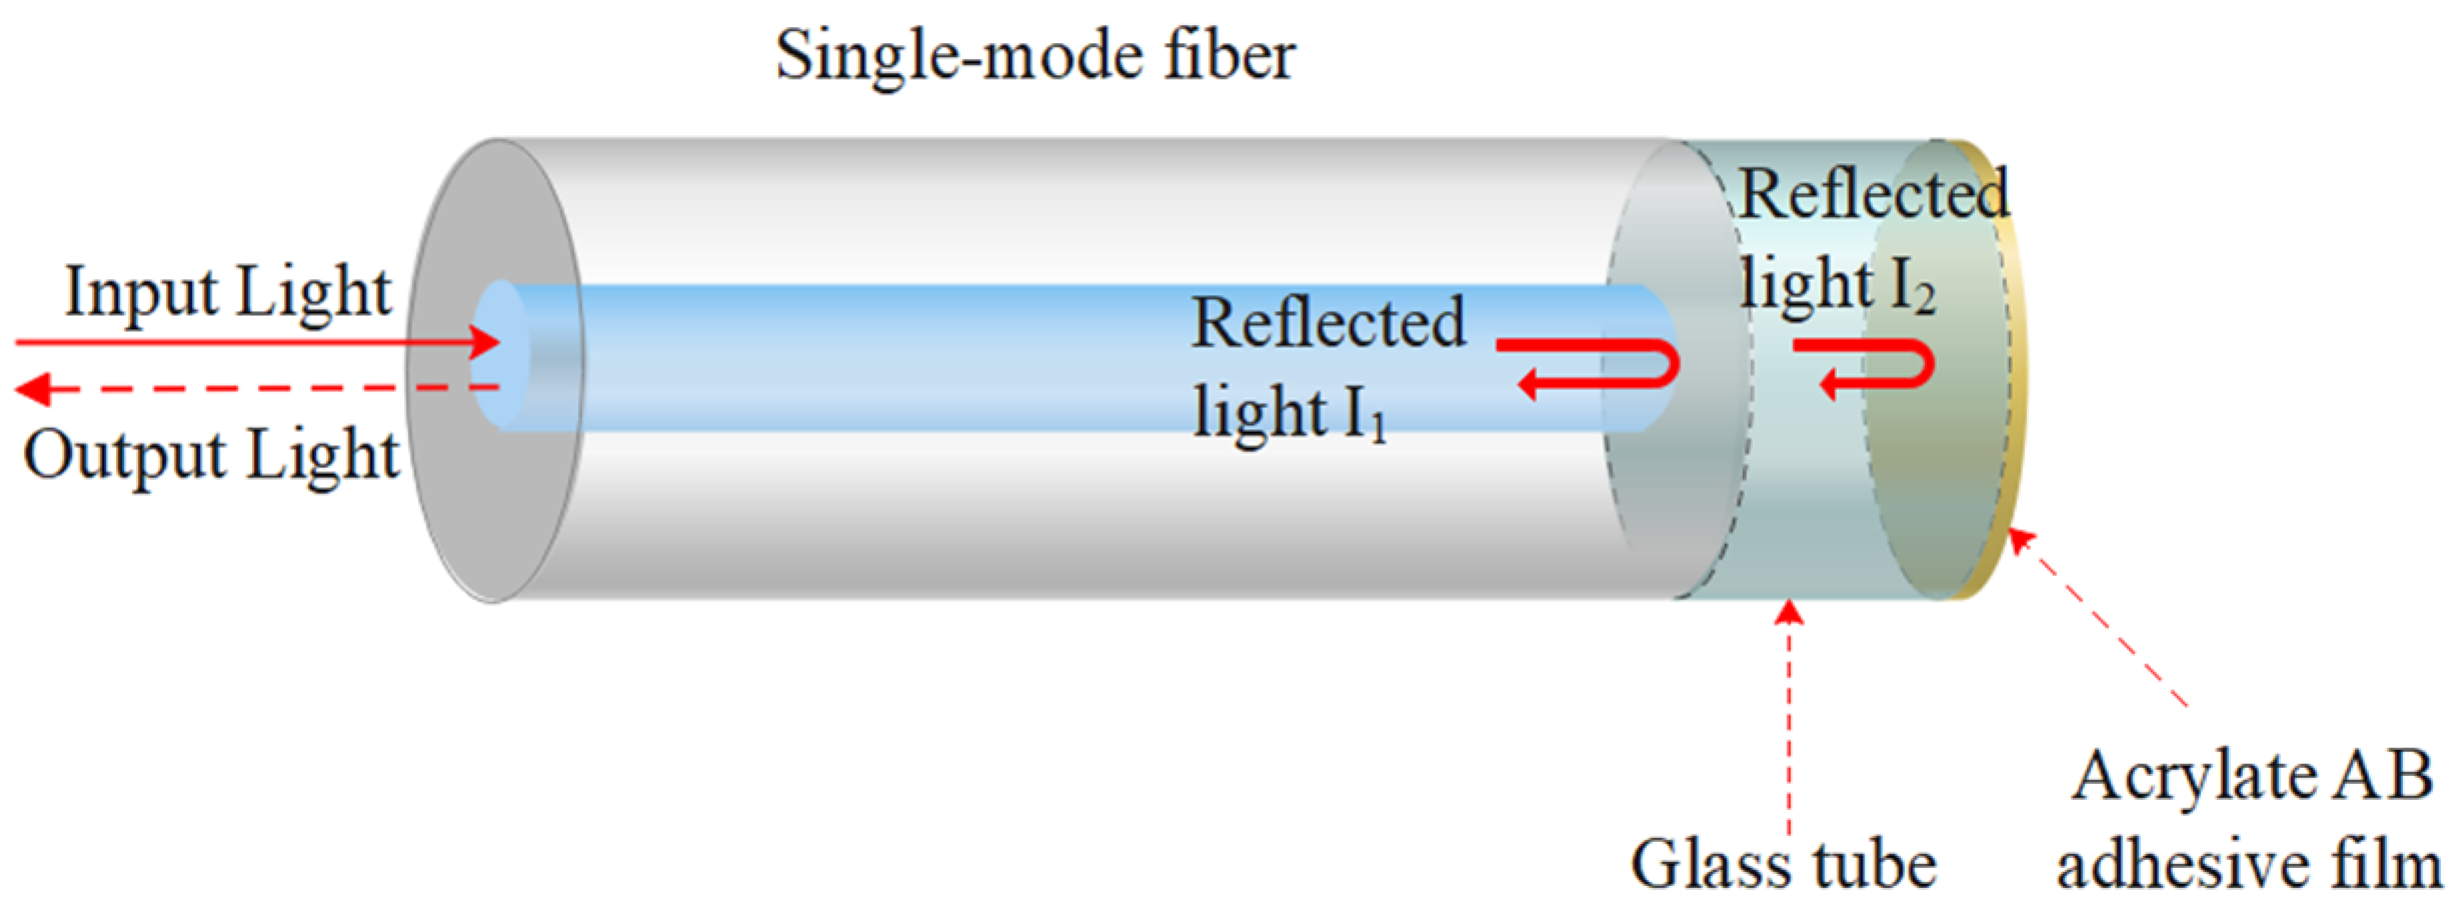
Considering the efficient measurement of optical fiber FPI and the adsorption characteristics of acrylate AB adhesive, a new type of optical fiber biochemical sensor can be developed by combining their advantages, and the connection method can be determined based on their physical characteristics. A FP interference optical fiber humidity sensor based on acrylate AB adhesive film is proposed, with its structural diagram shown in Figure 1.
A section of glass tube is welded at the end of a single mode fiber (SMF, Coring G.652. D), and an FP cavity is formed by covering the end of the glass tube with an acrylic AB adhesive film, forming the humidity sensor. Because the acrylate AB adhesive film is very thin, the three-beam interference can be approximated as two-beam interference. SMF/air is the first reflective surface, and air/thin film is the second reflective surface. The refractive index of the light transmission medium changes: , , are the refractive indices of the SMF fiber core, air and adhesive film, respectively. According to the Fresnel reflection effect, their reflectivity is [23]:
Part of the light emitted by the light source is reflected at to form a reflected light , and the light passing through reaches to form a reflected light . There is a phase difference between the two reflected lights, so the intensity of the interference light generated by mutual interference is [24]:
where is the refractive index of the FP cavity, is the distance between two reflective surfaces, is the wavelength of the incident light, and is the initial phase difference of the interference beam.
When the phase difference between and meets the phase matching condition, a cancellation interference spectrum is generated, and its peak is given by the following formula:
where is the wavelength of the mth-order peak. According to Equation (3), it can be obtained that:
As can be seen from Equation (4), is only affected by the refractive index of the sensor FP cavity and the distance between the two reflective surfaces . When the acrylate AB adhesive film absorbs water molecules, the thickness and refractive index of the film change, resulting in a shift in the interference spectrum.
3. Fabrication of Sensors
The sensor structure is fabricated from the platform shown in Figure 2.
The main body of the platform are two three-dimensional platforms that can be moved in the XYZ axis direction. The left of three-dimensional platform 1 is fixed with a precision electric drill bracket (AOBEN AB8101, Jinhua, China), and the right is fixed with an industrial microscope camera and a fiber optic cutting knife (Fujikura CT50, Shanghai, China).
The upper end of three-dimensional platform 2 is fixed with a display screen connected to an industrial microscope camera and an optical fiber fixing clip, which are adjusted by knobs on the two three-dimensional platforms to align the grooves of the optical fiber cutting knife with the grooves of the optical fiber fixing clip. The camera of the industrial microscope camera is adjusted to the position corresponding to the optical fiber cutter, and the length of the cutting optical fiber and glass tube can be observed on the display screen.
A desktop air pressure pump (ConST 162, Beijing, China) is placed on the left side of three-dimensional platform 1, a section of hollow plastic pipe with a length of about 40 cm is selected, one end of the pipe is connected to the air outlet of the pressure pump through solidified acrylic AB adhesive, and the handle of the desktop air pressure pump is pressed to generate air flow in the hollow plastic pipe.
Through this platform, it is easy to achieve the cutting of glass tubes and the preparation of acrylic AB adhesive films required for experiments, thus improving the production efficiency and success rate of sensors.
The fabrication of an optical fiber humidity sensor based on acrylate AB adhesive film can be divided into the following 5 steps, as shown in Figure 3.
Step 1: Select a suitable length of hollow glass tube (outer diameter and inner diameter are 125 μm and 75 μm, respectively) After burning off about 1 cm of the yellow coating, cut the end flat and place it on the right side of the optical fiber fusion splicer. Cut the end surface of the single mode optical fiber that has been stripped of the protective layer and wiped clean, and place it on the left side of the optical fiber fusion splicer. Select appropriate discharge parameters to fuse the glass tube and the single mode optical fiber together, as shown in Figure 3a.
Step 2: Place one end of the glass tube on the optical fiber cutting knife of the production platform, and place one end of the single mode optical fiber on the optical fiber fixing clip, and fix it. Adjust the length of the cut glass tube by adjusting the Y-axis of three-dimensional platform 2, as shown in Figure 3b.
Step 3: Fix the single mode optical fiber onto the precision electric drill bracket on three-dimensional platform 1. The end of the glass tube is vertically downward, about 5 cm from the platform surface, which can prevent accidental contact and facilitate timely contact during bubble blowing. Next, evenly mix adhesive A and adhesive B of the acrylate adhesive in a 1:1 ratio and place them directly below the single-mode optical fiber fused with a glass tube, as shown in Figure 3c.
Step 4: Insert a hollow plastic pipe into the acrylic adhesive and start a desktop air pressure pump to pressurize, and an acrylic AB adhesive bubble will be generated at the end of the plastic pipe. The generation process is shown in Figure 3d.
Step 5: Observe the generated acrylic AB glue bubbles. When the bubbles are large and relatively stable, press down on the handle of the precision electric drill bracket to drive the single mode optical fiber fused to the glass tube to tilt downward, so that the glass tube probe gently touches the acrylic AB glue bubbles, which can transfer the thinnest film on top of the bubble to the end of the glass tube. Due to intermolecular forces, a thin film will form on the surface of the glass tube probe, as shown in Figure 3e.
The acrylic AB adhesive bubbles generated by the bubbling method are shown in Figure 4. When the glue of a bubble comes into contact with the gas, due to intermolecular interactions, surface tension can be generated on the surface layer. The viscosity of the film controls the surface tension, which effectively slows down the breaking speed of the bubbles and helps ensure sufficient time for subsequent experimental operations.
The physical object of the fabricated optical fiber sensor structure based on acrylate AB adhesive film is shown in Figure 5.
In addition, a dual pressure assisted method can be used to more accurately control the production of acrylate AB adhesive films, with some steps different from the above.
First, the outer diameter and inner diameter of the glass tube selected by the dual pressure assistance method are 200 μm and 126 μm, respectively. The processed glass tube in the first step is not fused to a single mode optical fiber, but rather is directly fixed to the precision electric drill bracket. Then, a thin film is formed at the end of the glass tube through the bubbling method in the fourth and fifth steps, as shown in Figure 6a.
Secondly, an internal pressure system is composed of a needle tube and a spiral micrometer. As shown in Figure 6b, a secondary pressure is applied to the acrylic AB adhesive film at the end from the inside of the glass tube, allowing the film to expand and become thinner, andwait for 30 min until the film is initially cured.
Finally, after the adhesive film has been cured, a processed SMF is inserted into the glass tube from the end without a film, and the connection interface between the SMF and the glass tube is fixed with UV adhesive to make the sensor probe structure stable and compact, as shown in Figure 6c.
The fabrication process of the dual pressure assisted method is more complex, but it can help quantify the pressurization process. The film thickness produced by this method can reach 4.44 μm so that the fabricated sensor structure has better response characteristics. In addition, the methods of sensor fabrication through the bubble blowing and dual pressure assisted methods are not limited to acrylic AB adhesive. They can also be applied to other sensing materials, allowing easier and faster methods to produce sensors with better performance.
4. Experiments and Discussions
Measure the humidity performance indicators of the sensor proposed in this article, such as sensitivity, response time, repeatability, and stability, and analyze the impact of temperature on the humidity sensor.
4.1. Humidity Response Experiment
4.1.1. Experimental Device
In order to obtain reliable data and a stable humidity environment, a corresponding humidity detection system has been designed based on experimental requirements and detection content, as shown in Figure 7. The system includes two major parts: a modulation and demodulation system and a humidity control system.
Modulation and demodulation systems include an ASE broadband light source (KG-ASE-CL-17-SP, Beijing, China) with a wavelength range of 1528–1603 nm, an OSA (Yokogawa AQ6370D, Shanghai, China), whose resolution is maintained at 0.1 nm, an optical fiber circulator, and a humidity sensor based on the acrylate AB film. During the experiment, the light emitted from the ASE broadband light source passes through the circulator, with one output SMF connected to the sensor and the other output SMF connected to the OSA.
Humidity control systems include a hygrometer, sealed adjustable devices (humidity boxes), humidifiers, and nitrogen cylinders. The hygrometer has a humidity resolution of 0.1%RH with an accuracy of ±1.5% RH and a temperature resolution of 0.1 °C with an accuracy of ±0.2 °C. It is used to monitor the humidity and temperature levels in the experimental device. The nitrogen cylinders and humidifiers are connected to the humidity box through a conduit to provide dry and wet air for the experiment. Adjusting the switch at the connection can change the flow rate of dry and wet air, thereby controlling the humidity in the humidity box. Through multiple measurements, it can be determined that the humidity in the device can be adjusted to a minimum of 3% RH and a maximum of 98% RH.
4.1.2. Sensitivity
Sensitivity is one of the main indicators to measure the performance of a sensor, which refers to the ratio of the change value of the output quantity to the change value of the input quantity under the steady-state operation of the sensor:
Figure 8 shows the sensor interference spectrum when the relative humidity rises from 10% RH to 90% RH in steps of 5% RH at room temperature (27 °C) for the sensor based on acrylate AB adhesive film. As the relative humidity increases, the interference spectrum moves towards a longer wavelength direction.
Figure 9 shows the scatter plot after sampling using the peak value of a wave peak in Figure 8 and the curve obtained through exponential fitting. From the scatter diagram, it can be seen that the interference spectrum of the sensor moves slightly with the change in humidity when the humidity is low, and the interference spectrum movement distance of the sensor gradually increases as the humidity gradually increases. In addition, the calculation results of the fitting curve have supported that during the humidity rise process, there is an exponential correlation between the peak point of the interference spectrum and the RH gradient rise; the variance is about 0.9994, and the RH ascending sensitivity is 167.5 pm/% RH.
Similarly, when the interference spectrum of the sensor is in an environment with a relative humidity of 90% RH, the relative humidity of the environment is reduced from 90% RH to 10% RH in steps of 5% RH, and the change in the reflected interference spectrum is recorded. As shown in Figure 10, when the relative humidity decreases, and the interference spectrum moves towards a shorter wavelength direction.
Figure 11 is an exponential fitting curve of the peak value of a wave peak. According to the fitting calculation results, there is an exponential correlation between the peak point of the interference spectrum and the RH gradient decrease during the humidity decrease process, with a variance of 0.99984 and a decrease sensitivity of 161.3 pm/% RH.
We produced 33 sensors during the experiment, and they all exhibited the same behavior, indicating that they have stable and good performance.
4.1.3. Response Time
In sensor response time measurement experiments, sudden changes in the humidity environment are needed to reduce the impact on response time measurement. Therefore, based on the above humidity detection system, a modified conical flask filled with different saturated salt solutions was selected for the experiment. The improved response time experimental detection device is shown in Figure 12.
Conical flasks filled with saturated solution, saturated solution, and NaCl saturated solution, respectively (regarded as device 1, 2, 3), are selected to provide three different relative humidity environments, 39.0% RH, 55.5% RH, and 76.9% RH (measured before the experiment). In this experiment, the response time is the time required to rise from 5% of the wavelength difference to 95%, based on the spectral wavelength corresponding to stabilization in two humidity environments.
At room temperature (27 °C), the sensor is placed in the air in device 1. After the waveform stabilizes, the recording of the interference spectrum of the sensor begins. By quickly transferring the sensor to device 2, it is possible to measure the response time of the sensor from one relative humidity environment to another. After the transfer, the sensor is placed in the environment for 5 min to basically reach a stable state, and then the sensor is transferred to device 3 again to constantly observe the changes in the interference spectrum. After it stabilizes, the previous operation is repeated in the order of humidity from high to low, until it is completely stable, and the recording ends.
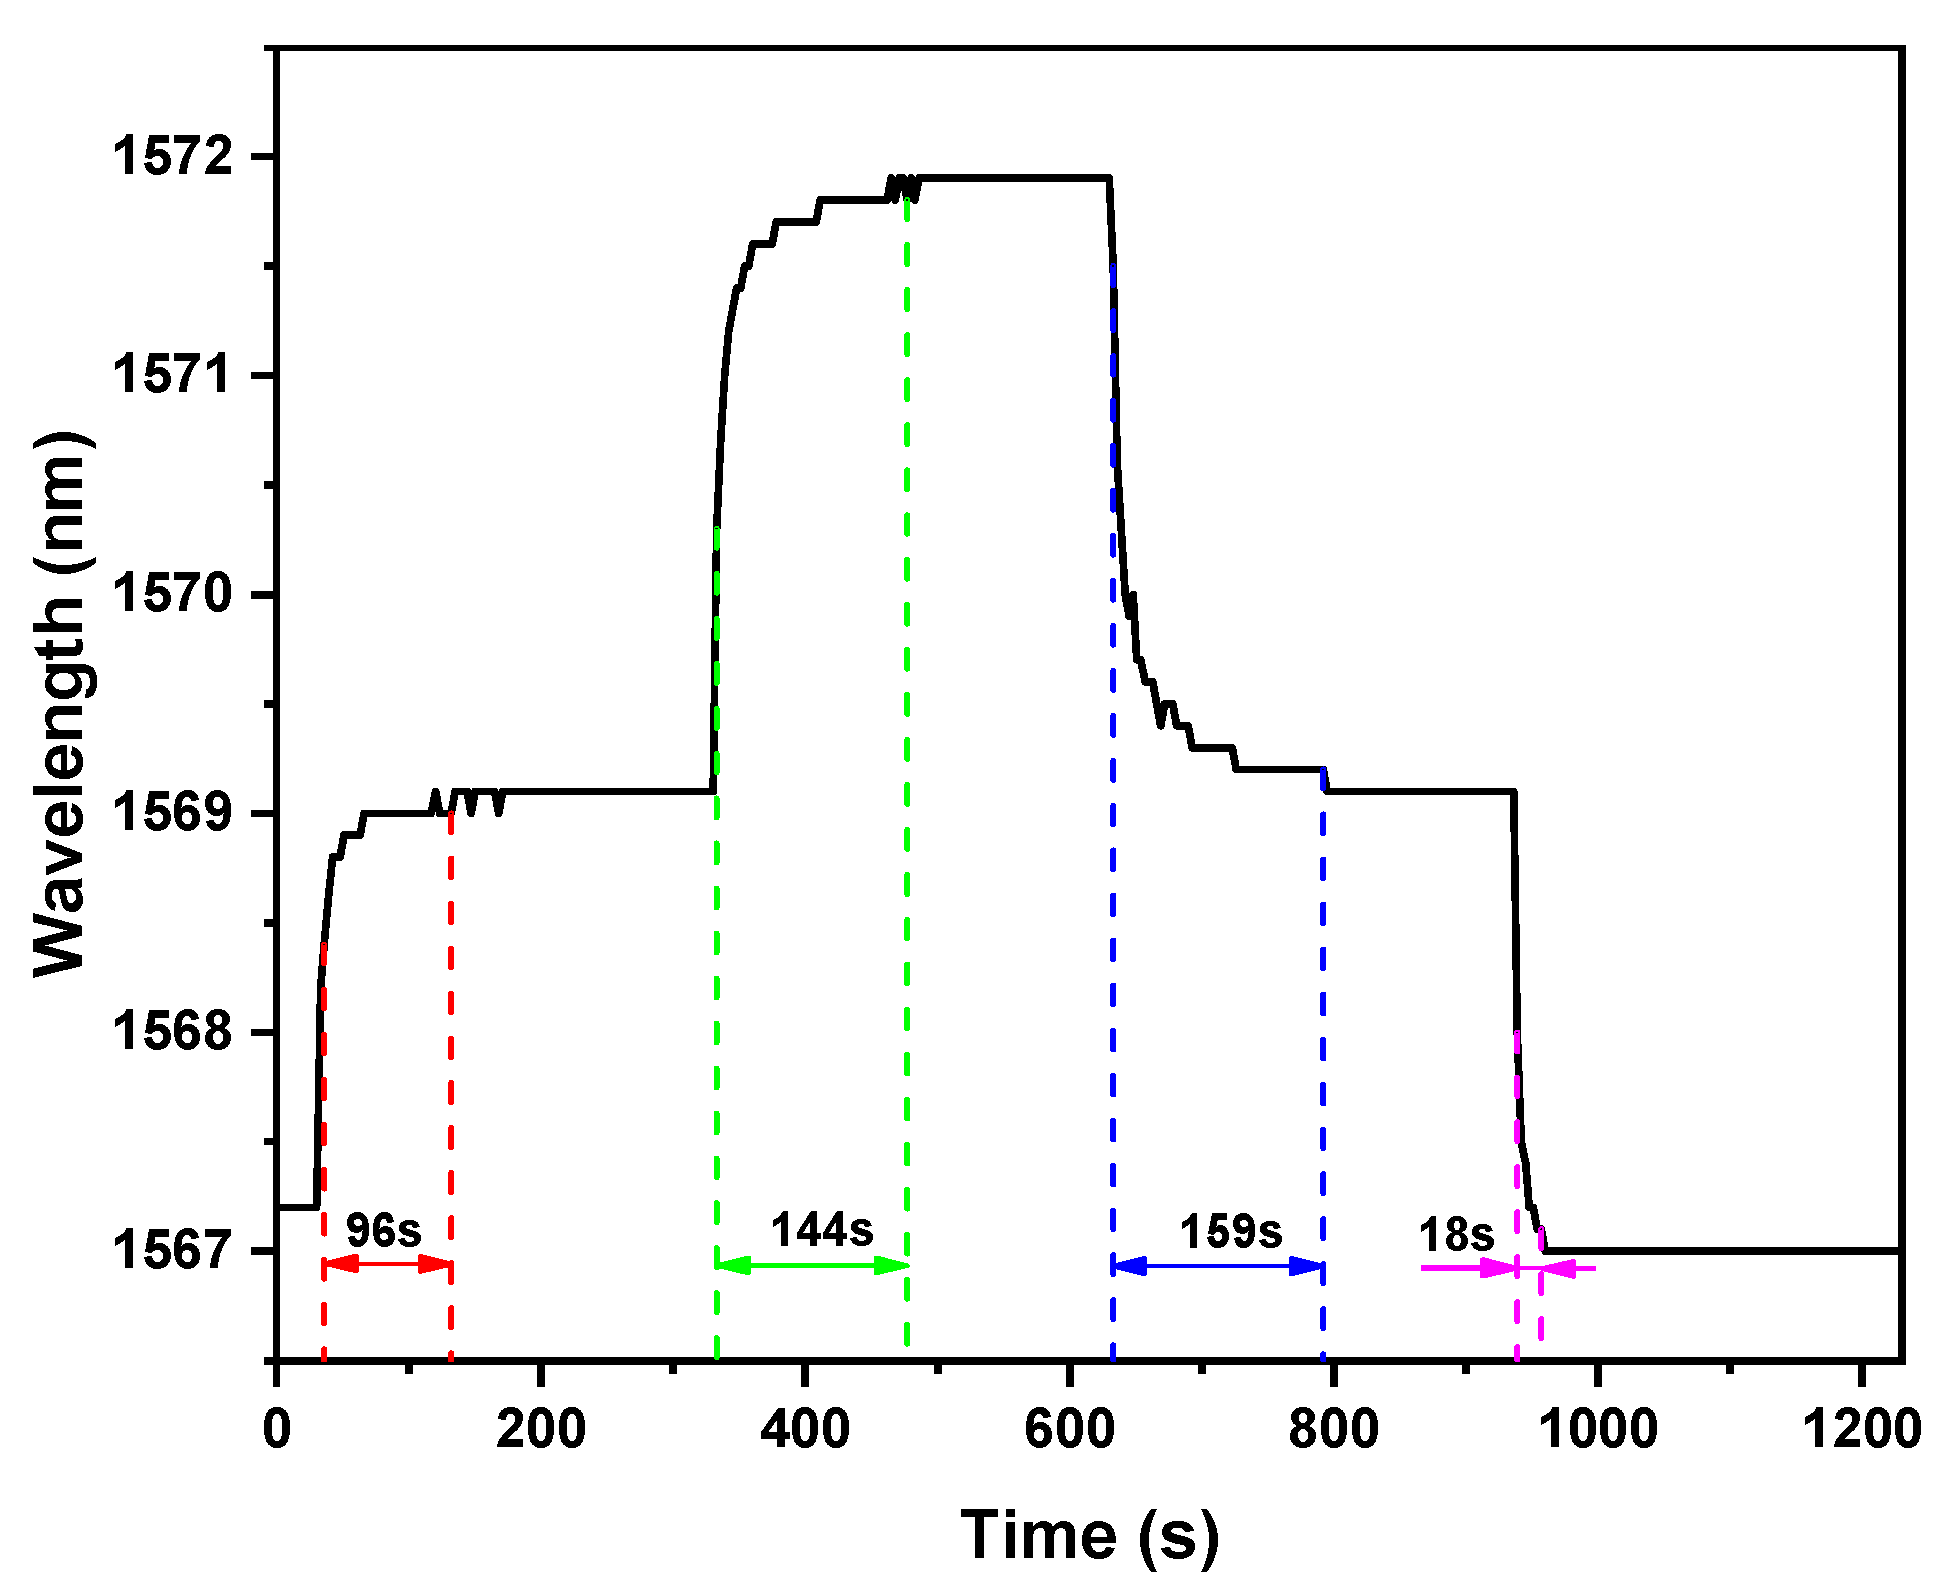
Figure 13 shows the humidity response time curve of the sensor. When the relative humidity around the sensor suddenly changes from 39.0% RH to 55.5% RH, it takes about 96 s to move from the interference spectrum to stabilization. When it is stabilized in device 2, due to the impact of indoor humidity on device 2 during the transfer, the humidity is measured and becomes 55.9% RH.
Next, the sensor is transferred to conical flask 3, and the time for the interference spectrum to move from the beginning to stabilization is approximately 144 s. Between spectral stabilization and the transfer sensor, there may be a shift in the interference light due to changes in the external environment affecting the interior of the device as the experiment progresses. After stabilization, the humidity in device 3 becomes 76.0% RH.
Then, using the same method, the sensor is transferred from device 3 to device 2, and finally it is transferred to device 1 until it is stable. The time required for the sensor to transfer to a stable state twice is approximately 159 s and 18 s. Based on the above data, it can be obtained that the response time for humidity rises is 6.5 s/% RH, and the response time for humidity decreases is 4.8 s/% RH.
The reason why the last response time is significantly different from the previous one may be that the relative humidity in device 1 is the lowest, and it takes the shortest time to recover from exposure to air. However, device 2 and device 3 require a certain amount of time to recover to their original humidity environment after exposure to air. Because the interference spectrum of the sensor varies with the humidity in the device, this process has a certain impact on the measurement of response time.
4.1.4. Repetitiveness
In order to evaluate the repeatability of the sensor, it is necessary to conduct a second humidity sensitivity experiment based on the sensor sensitivity experiment in Section 4.1.2. In this work, after completing the first sensitivity experiment, a second humidity sensitivity detection experiment was conducted on the sensor immediately. Figure 14 and Figure 15, respectively, show the experimental results of two humidity increase/decrease experiments by the sensor.
From the results of two humidity rise and fall experiments, we can see that the sensor always maintains a good exponential response to the relative humidity of the external environment. Comparing the two experimental results, this brings up the important fact that the proposed sensor has a relatively good repeatability in humidity detection, which further verifies the reversibility of the sensor.
4.1.5. Stability
An experiment was developed to detect the stability of the sensor using the system in Figure 12. Under normal temperature (27 °C) and pressure, in the above device 1, 2, 3, the stability of the proposed sensor was tested in a humidity environment with relative humidity of 39.1% RH, 57.1% RH, and 76.9% RH (measured during the experiment), respectively. After placing the sensor in the current humidity environment for 5 min to ensure that the humidity environment within the device reaches a stable level, the recording begins. the interference spectrum is recorded every 10 min, with a total recording time of 210 min and a total of 22 records. The experimental results of the stability experiment are shown in Figure 16.
According to the experimental results, when the humidity environment is almost constant, the interference wavelength remains within a certain range. In different humidity environments, the maximum fluctuation of the humidity sensor within 60 min is 0.1 nm, which exhibits good stability.
Due to the limitations of experimental conditions, it is impossible to completely avoid small disturbances caused by changes in environmental conditions during the experimental process, such as changes in room temperature, and changes in three humidity environments experienced during sensor transfer. However, through the analysis of sensor sensitivity, response time, repeatability, reversibility, and stability, it can still be seen that the sensor has excellent performance in humidity sensing.
4.2. Temperature Impact Analysis
In humidity response experiments, it can be observed that changes in ambient temperature have an impact on the sensor. Therefore, through the temperature detection system shown in Figure 17, we further explored the impact of temperature on the sensing process.
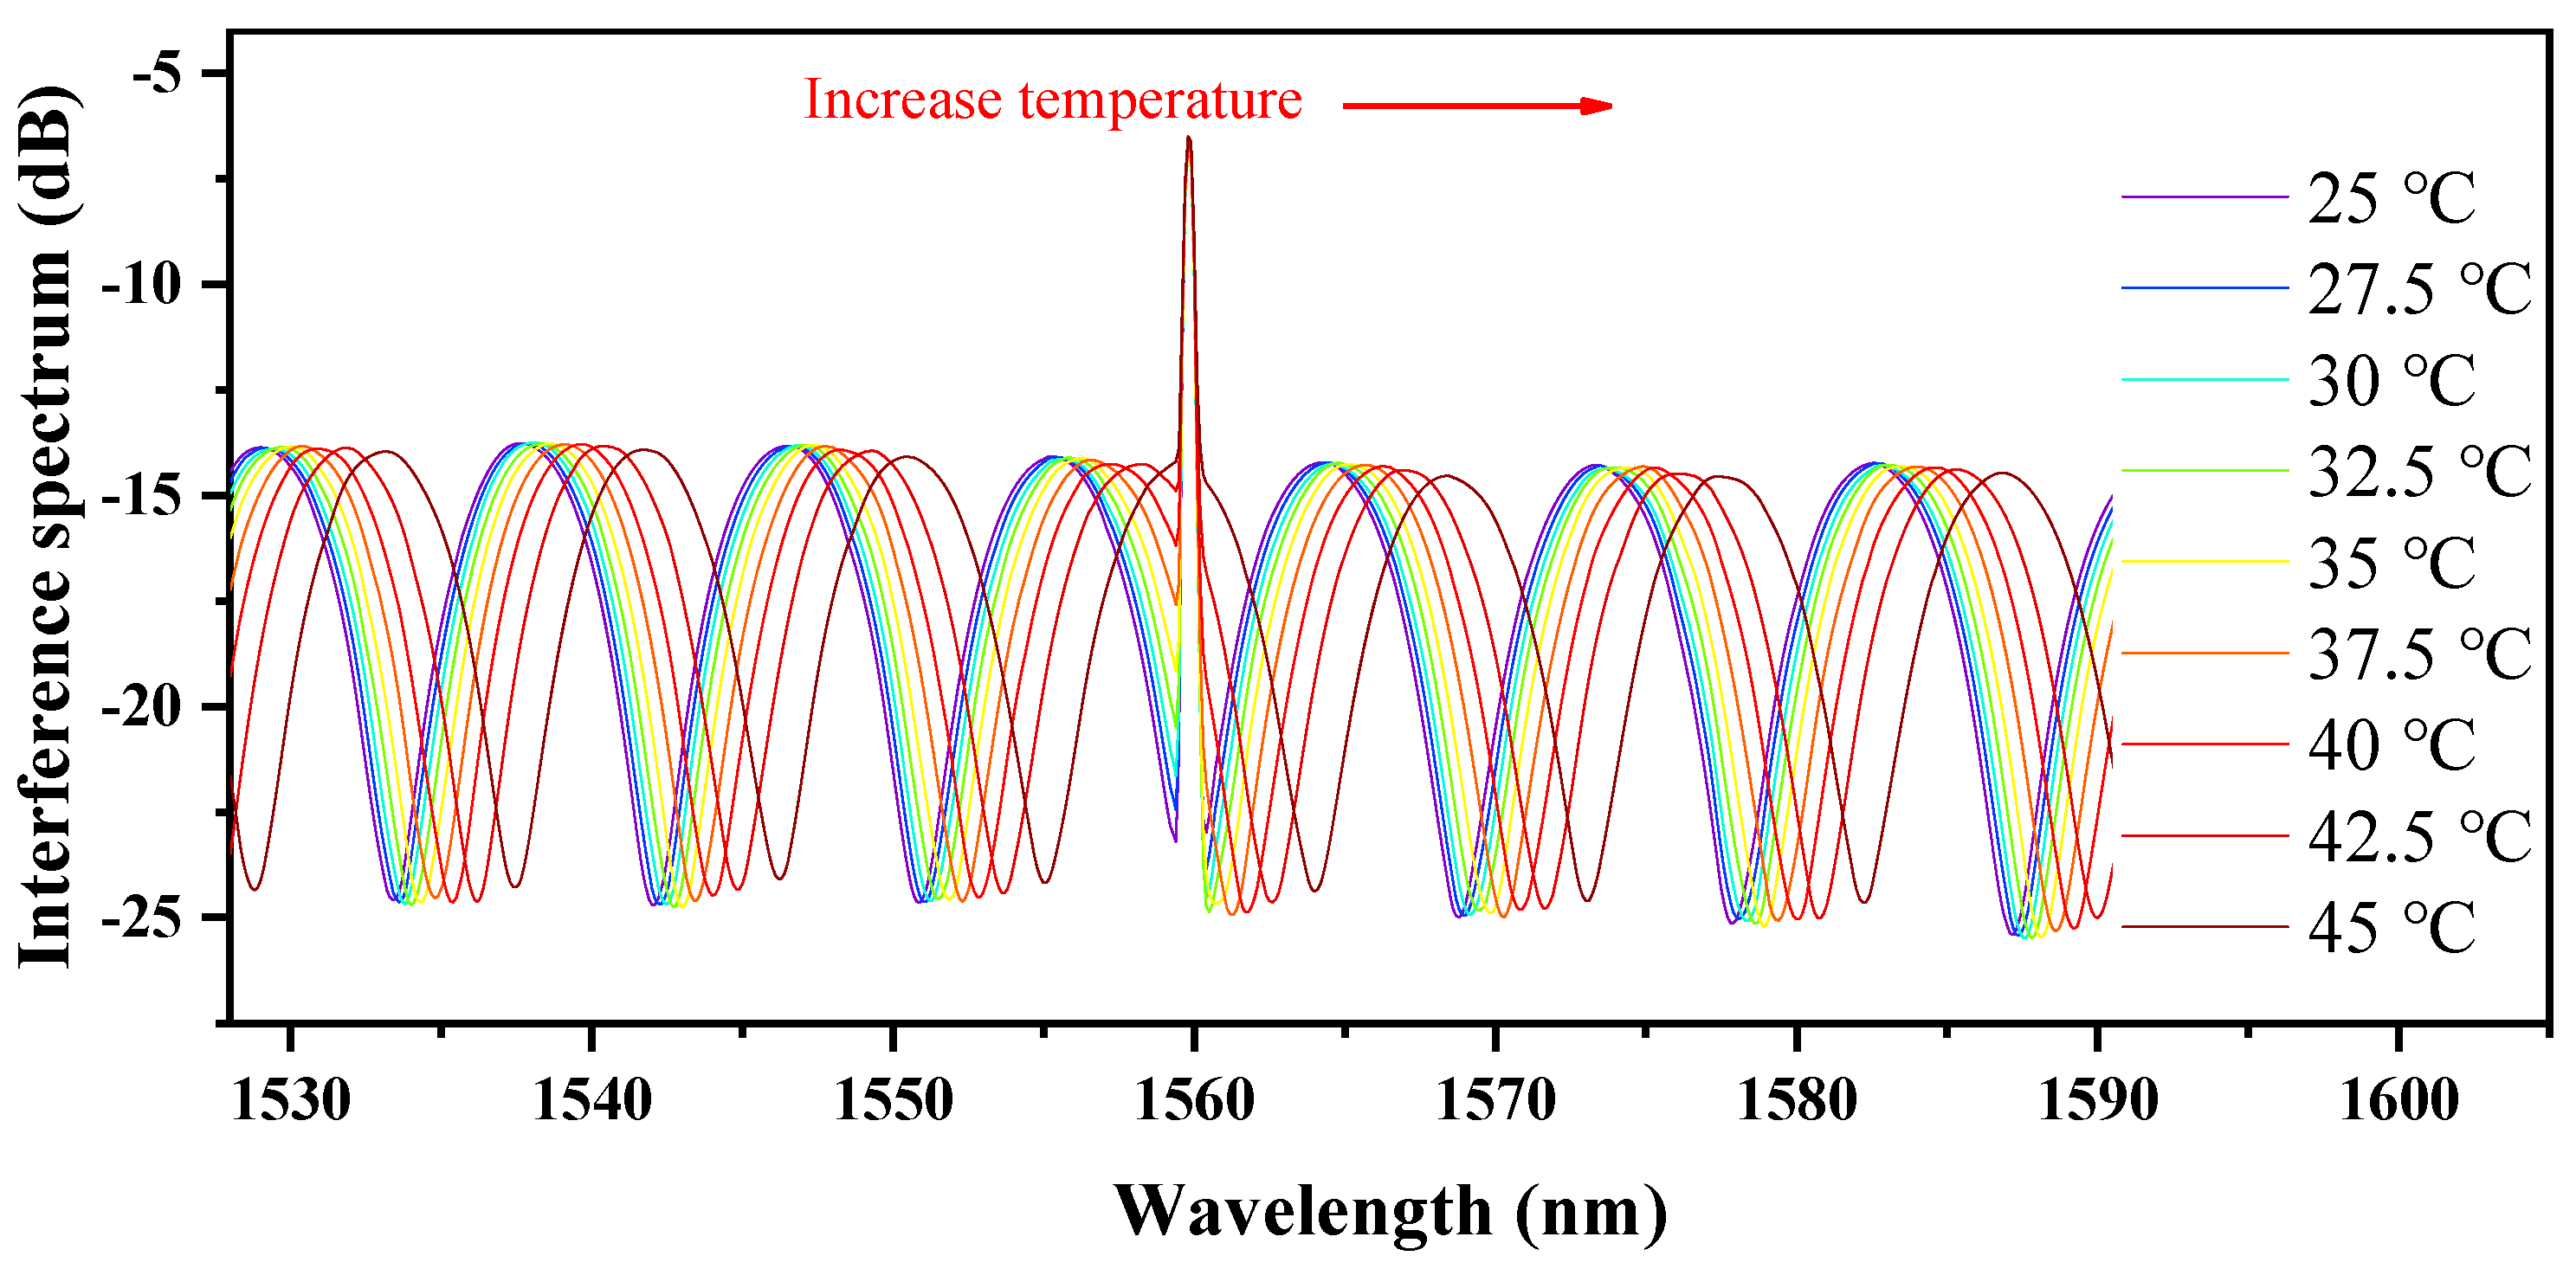
In the temperature response experiment of the sensor, another sensor with the same structure is used for temperature detection experiment. The humidity is maintained at 30% RH, and the temperature increases from 25 °C to 45 °C. The interference spectrum changes with the ambient temperature as shown in Figure 18.
This picture sets forth the important fact that as the temperature increases, the interference spectrum moves towards a longer wavelength direction. Because we conducted the experiment in an environment with low humidity, we can basically eliminate this interference. The increase in temperature causes a change in the refractive index of the material, resulting in a shift in the interference spectrum. the peak point of the leftmost wave peak is taken, and a plot of the interference spectrum change when the temperature rises from 25 °C to 45 °C is obtained, as shown in Figure 19. From the curve, it shows that the moving range of the interference spectrum is 1531.2 dB to 1536.1 dB, and the temperature sensitivity of the sensor is 245 pm/°C.
Temperature calibration is achieved by splicing a section of fiber Bragg gratings (FBG) onto the fiber of the sensor [25]. The sensitivity matrix is as follows:
where and are the relative humidity coefficients of the fiber Bragg grating and the FP cavity; and are the temperature coefficients of the fiber Bragg grating and the FP cavity; and are changes in relative humidity and temperature; and are the wavelength shifts of the fiber Bragg grating and the FP cavity, respectively. The variation of the interference spectrum of the improved sensor at different ambient temperature is shown in Figure 20.
Similarly, as the temperature increases, the interference spectrum moves towards a longer wavelength direction. The variation curve of the interference spectrum with temperature rise obtained by taking the peak point of the leftmost wave peak is shown in Figure 21. is the curve supports the fact that the interference spectrum of the sensor with FBG has a moving range of 1537.6 dB to 1540.4 dB, and its temperature sensitivity is 140 pm/°C.
The improved structure of the sensor greatly reduces its sensitivity to temperature, making it more suitable for use in daily environments.
This work is the first time that acrylate AB adhesive has been used for humidity sensor research. From the results, it can be seen that the sensor has good performance in sensitivity, stability, and response time, indicating that acrylate AB adhesive has great potential in humidity sensing.
4.3. Performance Comparison
In Table 1, we compare the performance of some fiber optic humidity sensors based on FP interference in recent years. Though they have different humidity-sensitive materials, the sensors mentioned in this article still perform outstandingly.
In addition, Acrylic AB adhesive is cheap and has good stability, its adhesive performance can optimize the production process, and it has potential in humidity sensing.
5. Conclusions
A method of fabricating an FP cavity through acrylate AB adhesive film using a bubbling method and a dual pressure assisted method is proposed. These methods can quickly and efficiently fabricate ultra-thin film structures. In addition, the dual pressure assist method not only pressurizes the acrylate AB adhesive to generate bubbles, but also inflates and pressurizes the film, which can make the film thinner and make the structure more sensitive. Then, through humidity response experiments, various characteristics of the sensor are verified, and the sensitivity of humidity rise and fall is 167.5 pm/% RH and 161.3 pm/% RH, respectively. The response time for humidity rise is 6.5 s/% RH, and the response time for humidity drop is 4.8 s/% RH. In addition, as a humidity sensitive material for FP cavities, acrylate AB film exhibits good repeatability and stability. Finally, the temperature response detection is completed, and the structure is improved.
Author Contributions
Conceptualization, Q.W., F.Z., M.Z. and G.W.; methodology, Q.W., M.Z. and G.W.; software, Q.W.; validation, Q.W., F.Z. and M.Z.; formal analysis, Q.W., F.Z. and K.Z.; investigation, Q.W., F.Z. and M.Z.; resources, G.W.; data curation, Q.W. and K.Z.; writing—original draft preparation, Q.W.; writing—review and editing, Y.Z., G.W. and Q.D.; visualization, Q.W. and K.Z.; supervision, G.W., Z.H. and Q.D.; project administration, Y.Z. and G.W.; funding acquisition, Y.Z. and G.W. All authors have read and agreed to the published version of the manuscript.
Funding
This research was funded by National Natural Science Foundation of China (61762033) and Natural Science Foundation of Hainan Province (617079).
Institutional Review Board Statement
Not applicable.
Informed Consent Statement
Not applicable.
Data Availability Statement
Not applicable.
Acknowledgments
The authors thanks for the support of National Natural Science Foundation of China (61762033) and Natural Science Foundation of Hainan Province (617079). And thanks to G.W. for providing access to instrumentation.
Conflicts of Interest
The authors declare no conflict of interest.
References
- Niu, H.; Yue, W.; Li, Y.; Yin, F.; Gao, S.; Zhang, C.; Kan, H.; Yao, Z.; Jiang, C.; Wang, C. Ultrafast-response/recovery capacitive humidity sensor based on arc-shaped hollow structure with nanocone arrays for human physiological signals monitoring. Sens. Actuators B Chem. 2021, 334, 129637. [Google Scholar] [CrossRef]
- Zhang, Y.; Wu, L.; Wang, X.; Yu, J.; Bin Ding, B. Super hygroscopic nanofibrous membrane-based moisture pump for solar-driven indoor dehumidification. Nat. Commun. 2020, 11, 3302. [Google Scholar] [CrossRef] [PubMed]
- Farahani, H.; Wagiran, R.; Hamidon, M.N. Humidity sensors principle, mechanism, and fabrication technologies: A comprehensive review. Sensors 2014, 14, 7881–7939. [Google Scholar] [PubMed] [Green Version]
- Li, H.-N.; Li, D.-S.; Song, G.-B. Recent applications of fiber optic sensors to health monitoring in civil engineering. Eng. Struct. 2004, 26, 1647–1657. [Google Scholar] [CrossRef]
- Kolpakov, S.A.; Gordon, N.T.; Mou, C.; Zhou, K. Toward a new generation of photonic humidity sensors. Sensors 2014, 14, 3986–4013. [Google Scholar] [CrossRef] [Green Version]
- Ascorbe, J.; Corres, J.M.; Arregui, F.J.; Matias, I.R. Recent developments in fiber optics humidity sensors. Sensors 2017, 17, 893. [Google Scholar] [CrossRef] [Green Version]
- Sun, L.-P.; Li, J.; Jin, L.; Ran, Y.; Guan, B.-O. High-birefringence microfiber Sagnac interferometer based humidity sensor. Sens. Actuators B Chem. 2016, 231, 696–700. [Google Scholar] [CrossRef] [Green Version]
- Shivananju, B.N.; Yamdagni, S.; Fazuldeen, R.; Kumar, A.K.S.; Nithin, S.P.; Varma, M.M.; Asokan, S. Highly sensitive carbon nanotubes coated etched fiber bragg grating sensor for humidity sensing. IEEE Sens. J. 2014, 14, 2615–2619. [Google Scholar] [CrossRef]
- Noor, M.Y.M.; Kassim, N.M.; Supaat, A.S.M.; Ibrahim, M.H.; Azmi, A.I.; Abdullah, A.S.; Peng, G.D. Temperature-insensitive photonic crystal fiber interferometer for relative humidity sensing without hygroscopic coating. Meas. Sci. Technol. 2013, 24, 105205. [Google Scholar] [CrossRef]
- Zheng, Y.; Dong, X.; Zhao, C.; Li, Y.; Shao, L.; Jin, S. Relative humidity sensor based on microfiber loop resonator. Adv. Mater. Sci. Eng. 2013, 2013, 815930. [Google Scholar] [CrossRef] [Green Version]
- Tan, Y.; Sun, L.-P.; Jin, L.; Li, J.; Guan, B.-O. Temperature-insensitive humidity sensor based on a silica fiber taper interferometer. IEEE Photonics Technol. Lett. 2013, 25, 2201–2204. [Google Scholar] [CrossRef]
- Lang, C.; Liu, Y.; Cao, K.; Li, Y.; Qu, S. Ultra-compact, fast-responsive and highly-sensitive humidity sensor based on a polymer micro-rod on the end-face of fiber core. Sens. Actuators B Chem. 2019, 290, 23–27. [Google Scholar] [CrossRef]
- Wang, B.; Tian, J.; Hu, L.; Yao, Y. High sensitivity humidity fiber-optic sensor based on all-agar Fabry–Perot interferometer. IEEE Sens. J. 2018, 18, 4879–4885. [Google Scholar] [CrossRef]
- Massaroni, C.; Caponero, M.A.; D’amato, R.; Lo Presti, D.; Schena, E. Fiber Bragg grating measuring system for simultaneous monitoring of temperature and humidity in mechanical ventilation. Sensors 2017, 17, 749. [Google Scholar] [CrossRef] [Green Version]
- Hu, P.; Dong, X.; Ni, K.; Chen, L.H.; Wong, W.C.; Chan, C.C. Sensitivity-enhanced Michelson interferometric humidity sensor with waist-enlarged fiber bitaper. Sens. Actuators B Chem. 2014, 194, 180–184. [Google Scholar] [CrossRef]
- Aldaba, A.L.; Lopez-Torres, D.; Elosua, C.; Auguste, J.-L.; Jamier, R.; Roy, P.; Arregui, F.; Lopez-Amo, M. SnO2-MOF-Fabry-Perot optical sensor for relative humidity measurements. Sens. Actuators B Chem. 2018, 257, 189–199. [Google Scholar] [CrossRef] [Green Version]
- Wang, Y.; Shen, C.; Lou, W.; Shentu, F.; Zhong, C.; Dong, X.; Tong, L. Fiber optic relative humidity sensor based on the tilted fiber Bragg grating coated with graphene oxide. Appl. Phys. Lett. 2016, 109, 031107. [Google Scholar] [CrossRef]
- Ni, K.; Chan, C.C.; Chen, L.; Dong, X.; Huang, R.; Ma, Q. A chitosan-coated humidity sensor based on Mach-Zehnder interferometer with waist-enlarged fusion bitapers. Opt. Fiber Technol. 2017, 33, 56–59. [Google Scholar] [CrossRef]
- Chu, R.; Guan, C.; Bo, Y.; Shi, J.; Zhu, Z.; Li, P.; Yang, J.; Yuan, L. All-optical graphene-oxide humidity sensor based on a side-polished symmetrical twin-core fiber Michelson interferometer. Sens. Actuators B Chem. 2019, 284, 623–627. [Google Scholar] [CrossRef]
- Tong, R.-J.; Zhao, Y.; Chen, M.-Q.; Peng, Y. Relative humidity sensor based on small up-tapered photonic crystal fiber Mach–Zehnder interferometer. Sens. Actuators A Phys. 2018, 280, 24–30. [Google Scholar] [CrossRef]
- Ben Ayed, E.; Magnin, A.; Putaux, J.-L.; Boufi, S. Vinyltriethoxysilane-functionalized starch nanocrystals as Pickering stabilizer in emulsion polymerization of acrylic monomers. Application in nanocomposites and pressure-sensitive adhesives. J. Colloid Interface Sci. 2020, 578, 533–546. [Google Scholar] [CrossRef] [PubMed]
- Chung, Y.C.; Park, J.E.; Choi, J.W.; Chun, B.C. Synthesis and characterizations of antifungal polyurethanes with enhanced tensile and shape recovery performances. Adv. Polym. Technol. 2018, 37, 3392–3400. [Google Scholar] [CrossRef]
- Hu, J.S. Foundation of optical coating. Opt. Eng. 2005, 2, 123–125. [Google Scholar]
- Zhu, C.; Perman, J.A.; Gerald, R.E.; Ma, S.; Huang, J. Chemical detection using a metal–organic framework single crystal coupled to an optical fiber. ACS Appl. Mater. Interfaces 2019, 11, 4393–4398. [Google Scholar] [CrossRef] [PubMed]
- Wang, C.; Zhou, B.; Jiang, H.; He, S. Agarose filled Fabry–Perot cavity for temperature self-calibration humidity sensing. IEEE Photonics Technol. Lett. 2016, 28, 2027–2030. [Google Scholar] [CrossRef]
- Nazari, M.; Amini, A.; Hill, M.R.; Cheng, C.; Samali, B. Physical and chemical reaction sensing in a mixed aqueous solution via metal-organic framework thin-film coated optical fiber. Microw. Opt. Technol. Lett. 2020, 62, 72–77. [Google Scholar] [CrossRef]
- Zhao, Y.; Yuan, Y.; Gan, W.; Yang, M. Optical fiber Fabry–Perot humidity sensor based on polyimide membrane: Sensitivity and adsorption kinetics. Sens. Actuators A Phys. 2018, 281, 48–54. [Google Scholar]
- Zhu, H.; He, J.-J.; Shao, L.; Li, M. Ultra-high sensitivity optical sensors based on cascaded two Fabry-Perot interferometers. Sens. Actuators B Chem. 2018, 277, 152–156. [Google Scholar] [CrossRef]
- Wang, Y.; Huang, Q.; Zhu, W.; Yang, M. Simultaneous measurement of temperature and relative humidity based on FBG and FP interferometer. IEEE Photonics Technol. Lett. 2018, 30, 833–836. [Google Scholar] [CrossRef]
- Chen, M.-Q.; Zhao, Y.; Wei, H.-M.; Zhu, C.-L.; Krishnaswamy, S. 3D printed castle style Fabry-Perot microcavity on optical fiber tip as a highly sensitive humidity sensor. Sens. Actuators B Chem. 2021, 328, 128981. [Google Scholar] [CrossRef]
- Zhao, Y.; Tong, R.-J.; Chen, M.-Q.; Xia, F. Relative humidity sensor based on hollow core fiber filled with GQDs-PVA. Sens. Actuators B Chem. 2019, 284, 96–102. [Google Scholar] [CrossRef]
- Xu, W.; Huang, W.-B.; Huang, X.-G.; Yu, C.-Y. A simple fiber-optic humidity sensor based on extrinsic Fabry–Perot cavity constructed by cellulose acetate butyrate film. Opt. Fiber Technol. 2013, 19, 583–586. [Google Scholar] [CrossRef]
Figure 1.
Structural diagram of FP interference optical fiber humidity sensor based on acrylate AB adhesive film.
Figure 1.
Structural diagram of FP interference optical fiber humidity sensor based on acrylate AB adhesive film.

Figure 2.
Sensor Manufacturing Platform.

Figure 3.
Manufacturing steps of an optical fiber humidity sensor based on acrylate AB adhesive film. (a) Fuse SMF and glass tube. (b) Cut glass tube. (c) Place optical fibers and acrylic AB adhesive. (d) Bubble blow and film transfer. (e) Sensor structure.
Figure 3.
Manufacturing steps of an optical fiber humidity sensor based on acrylate AB adhesive film. (a) Fuse SMF and glass tube. (b) Cut glass tube. (c) Place optical fibers and acrylic AB adhesive. (d) Bubble blow and film transfer. (e) Sensor structure.

Figure 4.
Physical image of acrylic AB adhesive bubble.

Figure 5.
SMF connected to glass tube and covered with acrylic AB adhesive film.

Figure 6.
Schematic diagram of dual pressure assistance method. (a) Transfer adhesive film to glass tube. (b) Apply pressure through the needle tube and spiral micrometer. (c) Connect SMF to glass tube.
Figure 6.
Schematic diagram of dual pressure assistance method. (a) Transfer adhesive film to glass tube. (b) Apply pressure through the needle tube and spiral micrometer. (c) Connect SMF to glass tube.

Figure 7.
Structure Diagram of Humidity Detection System.

Figure 8.
When the humidity increases, the interference spectrum moves towards a longer wavelength direction.
Figure 8.
When the humidity increases, the interference spectrum moves towards a longer wavelength direction.

Figure 9.
Scatter plots and exponential fitting plots of sampled values at RH ascending.

Figure 10.
When the humidity decreases, the interference spectrum moves towards a shorter wavelength direction.
Figure 10.
When the humidity decreases, the interference spectrum moves towards a shorter wavelength direction.

Figure 11.
Scatter plots and exponential fitting plots of sampled values at RH descending.

Figure 12.
Humidity Response Time Detection Device for Sensors.

Figure 13.
The time curve that sensor achieves stable performance after being transferred to different conical bottle devices.
Figure 13.
The time curve that sensor achieves stable performance after being transferred to different conical bottle devices.

Figure 14.
Scatter plots and exponential fitting results of the first sensitivity experiment.

Figure 15.
Scatter plots and exponential fitting results of the second sensitivity experiment.

Figure 16.
Stability experiment of sensor.

Figure 17.
Temperature Detection System.

Figure 18.
Temperature response curve of the sensor.

Figure 19.
The sensor interference spectrum moves towards a longer wavelength as the temperature increases.
Figure 19.
The sensor interference spectrum moves towards a longer wavelength as the temperature increases.

Figure 20.
After improving the sensor structure, the interference spectrum shift decreases as the temperature increases.
Figure 20.
After improving the sensor structure, the interference spectrum shift decreases as the temperature increases.

Figure 21.
Temperature response curve of sensor with FBG.


Table 1.
Performance Comparison of Fiber Optic Humidity Sensors Based on FP.
| The Structure of Sensors | Material | Range | Sensitivity | Time |
|---|---|---|---|---|
| FPI | Agar film | 25–95% RH | 4.2 nm/% RH | 2018 [13] |
| FPI | Agarose | 43–63% RH | 22.5 pm/% RH | 2016 [25] |
| FPI | agarose gel | 16–85% RH | 22.5 pm/% RH | 2017 [26] |
| FPI | Chitosan | 35–95% RH | 280 pm/% RH | 2016 [27] |
| FPI | polyimide | 20–90% RH | 22.1 pm/% RH | 2020 [28] |
| FPI | PI film | 20–90% RH | 22.07 pm/% RH | 2018 [29] |
| FPI | PVA film | 46–75% RH | 248.9 pm/% RH | 2021 [30] |
| FPI | GQDs-PVA | 13.47–81.34% RH | 117.25 pm/% RH | 2019 [31] |
| FPI | CAB film | 8.8–88.1% RH | 307 pm/% RH | 2013 [32] |
| FPI | Acrylate AB glue | 10–90% RH | 172.5 pm/% RH | our work |
Disclaimer/Publisher’s Note: The statements, opinions and data contained in all publications are solely those of the individual author(s) and contributor(s) and not of MDPI and/or the editor(s). MDPI and/or the editor(s) disclaim responsibility for any injury to people or property resulting from any ideas, methods, instructions or products referred to in the content. |
© 2023 by the authors. Licensee MDPI, Basel, Switzerland. This article is an open access article distributed under the terms and conditions of the Creative Commons Attribution (CC BY) license (https://creativecommons.org/licenses/by/4.0/).
Share and Cite
MDPI and ACS Style
Wang, Q.; Zhang, F.; Zhang, M.; Zhang, K.; Zhang, Y.; Wang, G.; Hu, Z.; Deng, Q. FP Interferometric Optic Fiber Humidity Sensor Based on Acrylate AB Adhesive Film. Photonics 2023, 10, 873. https://doi.org/10.3390/photonics10080873
AMA Style
Wang Q, Zhang F, Zhang M, Zhang K, Zhang Y, Wang G, Hu Z, Deng Q. FP Interferometric Optic Fiber Humidity Sensor Based on Acrylate AB Adhesive Film. Photonics. 2023; 10(8):873. https://doi.org/10.3390/photonics10080873
Chicago/Turabian StyleWang, Qiying, Fangfang Zhang, Mengfan Zhang, Kunpu Zhang, Yaqian Zhang, Guanjun Wang, Zhuhua Hu, and Qian Deng. 2023. "FP Interferometric Optic Fiber Humidity Sensor Based on Acrylate AB Adhesive Film" Photonics 10, no. 8: 873. https://doi.org/10.3390/photonics10080873
Note that from the first issue of 2016, this journal uses article numbers instead of page numbers. See further details here.