Article

Performance Enhancement in a Few-Mode Rayleigh-Brillouin Optical Time Domain Analysis System Using Pulse Coding and LMD Algorithm

1
Department of Electronic and Communication Engineering, North China Electric Power University, Baoding 071003, China
2
Hebei Key Laboratory of Power Internet of Things Technology, North China Electric Power University, Baoding 071003, China
3
Baoding Key Laboratory of Optical Fiber Sensing and Optical Communication Technology, North China Electric Power University, Baoding 071003, China
*
Author to whom correspondence should be addressed.
Photonics 2024, 11(4), 308; https://doi.org/10.3390/photonics11040308
Submission received: 29 January 2024 / Revised: 24 March 2024 / Accepted: 25 March 2024 / Published: 27 March 2024
(This article belongs to the Special Issue Advanced Photonic Sensing and Measurement II)

Abstract

:
Rayleigh Brillouin optical time domain analysis (BOTDA) uses the backscattered Rayleigh light generated in the fiber as the probe light, which has a lower detection light intensity compared to the BOTDA technique. As a result, its temperature-sensing technology suffers from a low signal-to-noise ratio (SNR) and severe sensing unreliability due to the influence of the low probe signal and high noise level. The pulse coding and LMD denoising method are applied to enhance the performance of the Brillouin frequency shift detection and temperature measurement. In this study, the mechanism of Rayleigh BOTDA based on a few-mode fiber (FMF) is investigated, the principles of the Golay code and local mean decomposition (LMD) algorithm are analyzed, and the experimental setup of the Rayleigh BOTDA system using an FMF is constructed to analyze the performance of the sensing system. Compared with a single pulse of 50 ns, the 32-bit Golay coding with a pulse width of 10 ns improves the spatial resolution to 1 m. Further enhanced by the LMD algorithm, the SNR and temperature measurement accuracy are increased by 5.5 dB and 1.05 °C, respectively. Finally, a spatial resolution of 1.12 m and a temperature measurement accuracy of 2.85 °C are achieved using a two-mode fiber with a length of 1 km.

1. Introduction

Brillouin optical time domain analysis (BOTDA) can be used to measure parameters such as temperature, strain, and vibration, and it is capable of continuous monitoring over long distances, with high spatial resolution and measurement accuracy [1,2,3,4]. It has broad application prospects in areas such as electric power, petroleum, aviation, and health monitoring of large structures [5,6]. BOTDA sensing technology includes two main structures: double-ended and single-ended. The double-ended BOTDA system requires a probe light and a pump light to be injected from both ends of the sensing fiber [7,8,9], which can lead to complex system architectures and inconvenience in practical engineering applications. Compared with double-ended BOTDA systems, the Rayleigh BOTDA system uses the backscattered Rayleigh light generated in the fiber as the probe light, which still has detection capabilities if the optic fiber breaks [10,11,12]. Moreover, the single-ended working mode is more convenient for practical engineering applications. The characteristics of the single-ended structure make it appear similar to the Brillouin optic time domain reflectometer (BOTDR), yet their working principles are entirely distinct. Rayleigh-based BOTDA operates on the basis of stimulated Brillouin scattering (SBS), whereas BOTDR is based on spontaneous Brillouin scattering. The signal strength of Rayleigh BOTDA exceeds that of the BOTDR, but issues with weak signals and high noise levels still persist. With the increase in sensing distance, the decrease in the signal-to-noise ratio (SNR) will lead to a reduction in the measurement accuracy. Therefore, we need to look for methods to improve the performance of Rayleigh BOTDA.
Distributed Brillouin sensing systems mostly use single-mode fiber (SMF) as the sensing fibers. SFMs propagate only in the fundamental mode and have a small core diameters. Counter-propagating the pump light and probe light can excite SBS, although spontaneous Brillouin scattering may be excessively amplified by the SBS of the pump or probe light, thus limiting the input power. These limitations lead to a low SNR and limited sensing distance for the system. Few-mode fibers (FMFs) are used in distributed temperature measurements as a new type of optical fiber that is different from ordinary single-mode fibers. Because FMFs have large core diameters, high SBS thresholds, and transmits a limited number of orthogonal modes [13,14], it can achieve the sensing of parameters such as temperature, strain, and bending, and can overcoming the problem of multiparameter cross-sensitivity, with potential for simultaneous multiparameter measurements [15,16,17,18], which has received widespread attention from researchers [19,20,21]. When light waves are coupled in FMFs, different Brillouin scattering spectra (BGSs) will be formed for the optical signals in the different modes, which react differently to changes in the measurement parameters.
Affected by the constraints of fiber-optic nonlinear effects, such as self-phase modulation, a high level of pulsed incident power can cause excessive attenuation of pulses and waveform distortion, shorten the sensing distance, and induce measurement errors [22]. An FMF can carry higher levels of pulsed incident power, effectively solving the issue of the limited pulsed power limitation in single-mode fibers. However, compared to single-mode fibers, the BGSs are broadened, and the Brillouin peak gain and the Brillouin frequency shift (BFS) are reduced because of the different incidence angles of the light in the different modes in the FMFs, as well as the interactions among the multiple modes [23,24,25]. The reduction in the Brillouin peak gain further worsens the SNR in single-ended BOTDA sensing systems; hence, it is urgently needed to find ways to enhance the pump power and reduce the noise.
Various techniques have been proposed to improve the performance of distributed Brillouin fiber sensors [26,27,28,29,30,31,32,33,34,35,36,37,38,39,40,41,42,43]. Among these advanced techniques, methods such as optical pulse coding [26,27,28], distributed Raman amplification [29,30,31], and different signal processing methods [32,33,34,35] exhibit better performances than classical standard configurations. Optical pulse coding technology, effectively solves this issue effectively by increasing the average level of power and the SNR by extending the duration of the pulse sequence, while maintaining a constant pulse width (equivalent to that of 1 bit in the code) and spatial resolution. In recent years, artificial intelligence and machine learning (ML) algorithms, such as deep learning [44], random forest [45], support vector machine [46], artificial neural networks (ANNs) [47], cascaded feedforward neural networks [48], etc. are applied in BOTDA systems for BFS extraction and show great superiority both in efficiency and accuracy. When the SNR is higher than 20 dB, the Lorentzian curve fitting (LCF) can fit the BGS very well, and its measurement accuracy is comparable to that of ML algorithms [45]. At the lowest SNR observed (e.g., in the presence of digital interference or during the study or monitoring of special optical fibers), the backward-correlation method performs comparatively well [49].
In signal processing methods for noise reduction [32,33,34,35,36,37,50], filtering, wavelet denoising, and cumulative averaging are commonly used. Nonlocal means, as well as block-matching and 3D filtering, have been used to reduce noise by treating the BGS as a two-dimensional image structure. Subsequent techniques also include the use of deep learning models [36,44,51], such as ANNs, convolutional neural networks, and others, for denoising processing. Although the aforementioned methods are quite effective, some of them are not computationally efficient, others may reduce the spatial resolution of the measurements, and some may do not perform well in denoising when dealing with nonlinear and nonstationary signals. Local mean decomposition (LMD) is an adaptive and nonparametric time–frequency decomposition method for processing nonlinear and nonstationary signals [52,53,54].
In this study, the enhancement in performance by the pulse coding and LMD denoising of the few-mode Rayleigh BOTDA is experimentally demonstrated. The mechanism of Rayleigh BOTDA based on FMF is investigated, the principles of the Golay code and LMD algorithm are analyzed, and the experimental setup of Rayleigh BOTDA system using FMF is constructed to analyze the performance of the sensing system. The proposed method can effectively increase the signal power and reduce the noise in the sensing signal, thereby improving the spatial resolution and SNR, and ultimately, improving the measurement accuracy.

2. Principles and Method

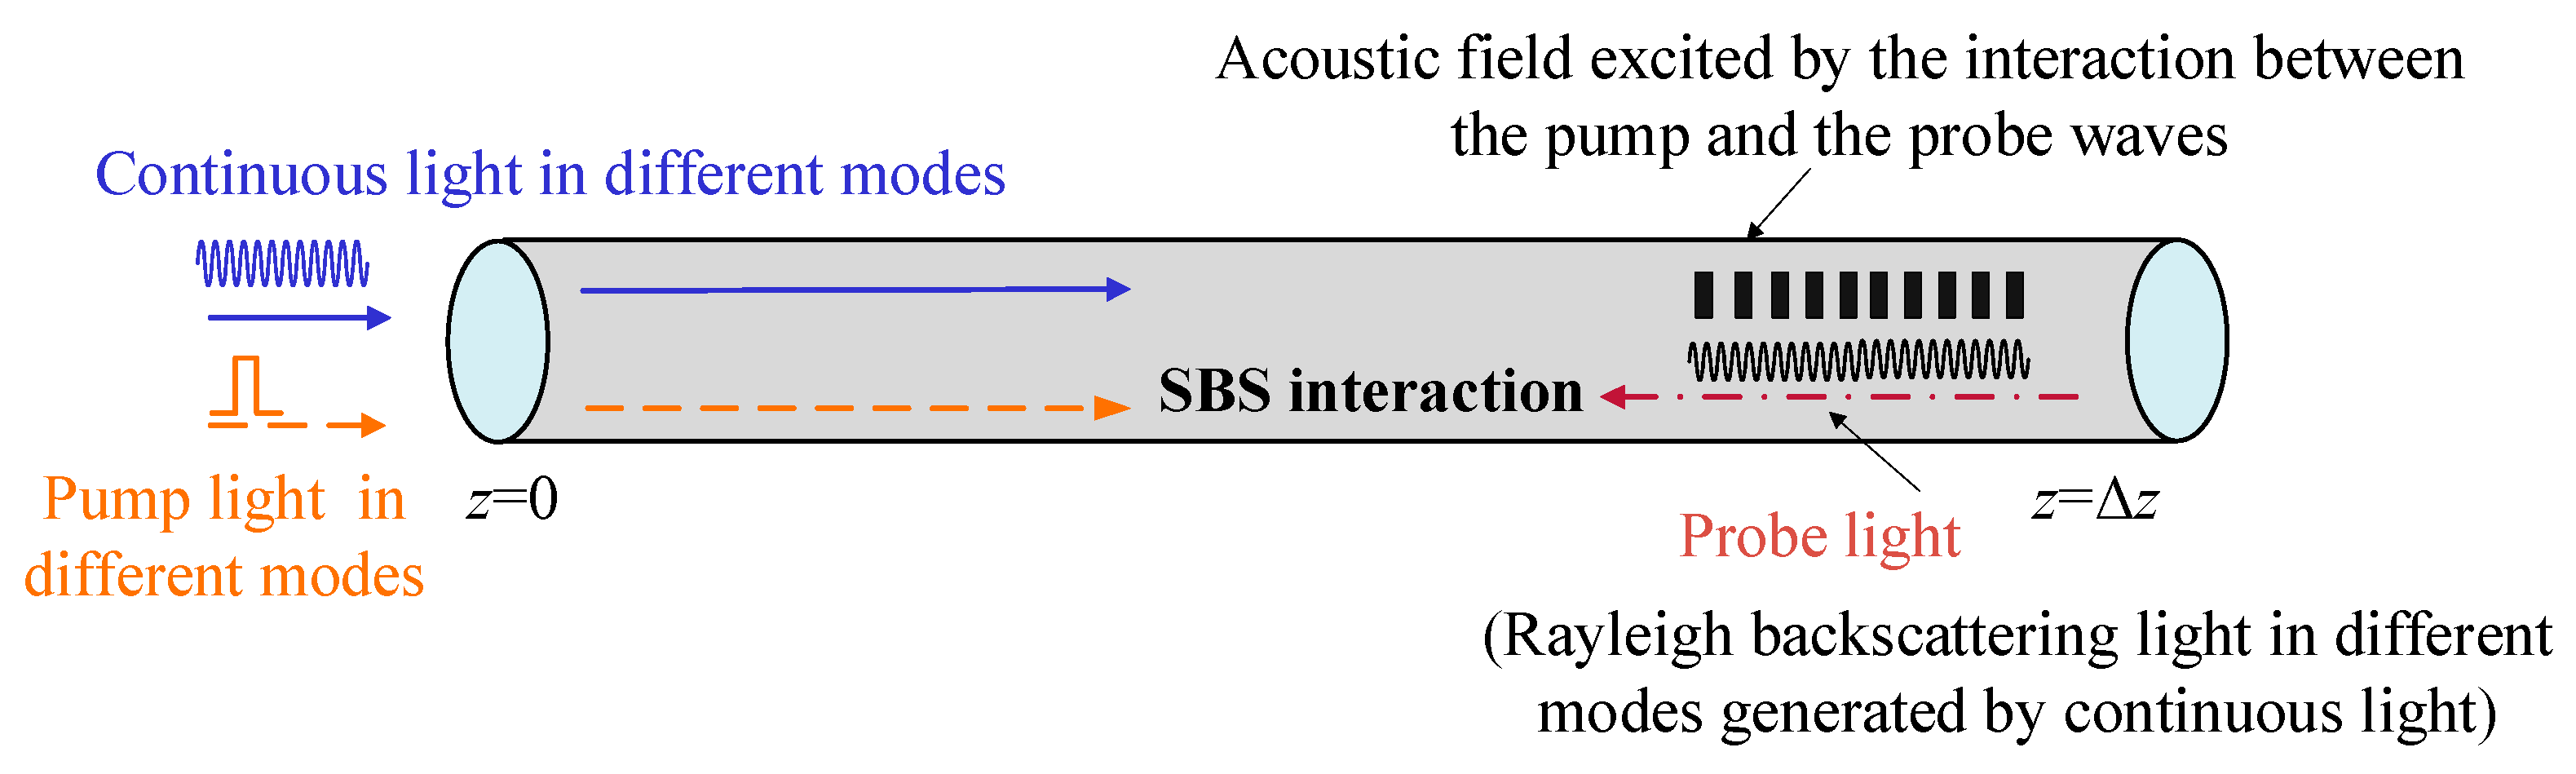
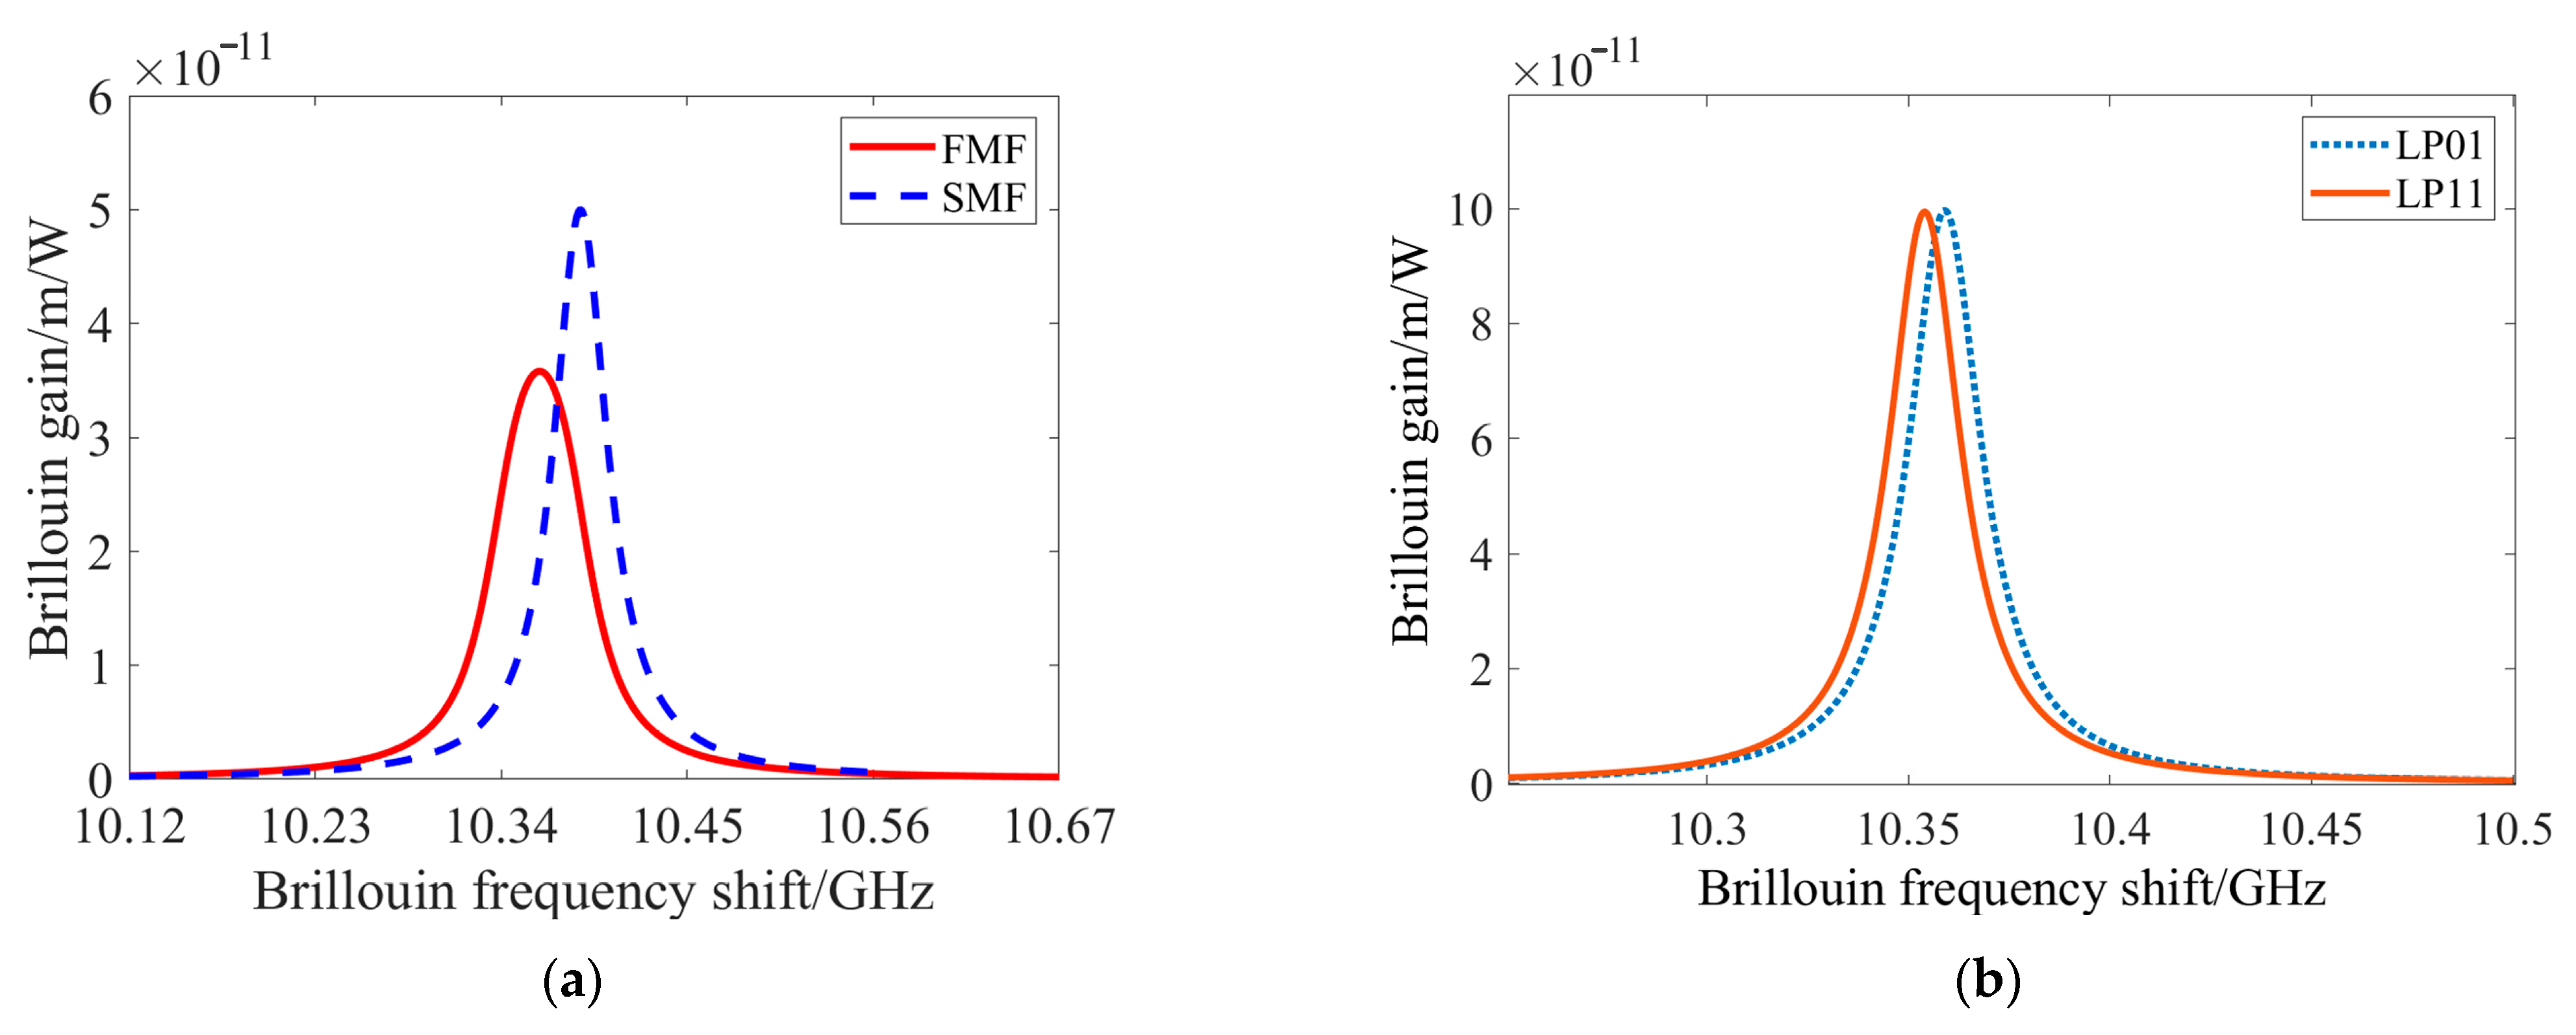
2.1. Rayleigh BOTDA with FMF

In a double-ended BOTDA system, the pulsed pump light and the continuous light need to be injected into the fiber from opposite ends, whereas in the Rayleigh BOTDA system [11], they only need to be injected from the same end of the fiber. The continuous light and the pulsed pump light enter into the sensing fiber in sequence. Here, the Rayleigh backscattering light produced by continuous light acts as the probe light, whereas the pulsed light acts as the pump light. The probe light and pump light excite the SBS interactions in the sensing fiber when the frequency of the probe light falls into the BGS, and the maximu of SBS interactions occur when the optical frequency difference between the probe light and the pump light is equal to the BFS of the fiber.
FMFs with large core diameters, high SBS thresholds, and that transmit a limited number of orthogonal modes are commonly used for distributed fiber measurements. When an incident light wave enters a few-mode fibers at different angles, it excites various modes that propagate in parallel in the fiber. The light wave of each mode interacts with the acoustic phonons in the FMF, resulting in different Brillouin frequency shifts and BGSs, respectively. Unlike the SBS effect in an SMF, the SBS effect in an FMF occurs not only among the same optical modes (i.e., intramodal SBS) but also among different optical modes (i.e., intermodal SBS).
Figure 1 presents operating principle of a Rayleigh BOTDA system. When the continuous light and the pulsed pump light in different modes enter into the sensing fiber, the Rayleigh backscattering light in the different modes produced by the continuous light serves as the probe light. The probe light and pulsed pump light in different modes excite intramodal or intermodal SBS in the sensing fiber, and the maximum value of SBS interactions occurs when the optical frequency difference between the probe light and the pump light is equal to the BFS vB of the fiber. The Brillouin frequency shifts in an FMF of each mode can be represented as follows [13]:
ν B = 2 n eff V A λ p
where neff represents the effective refractive index in each mode, λp and VA are the optical wavelength and the acoustic velocity in an FMF. The Brillouin scattering superposition spectrum broadens and the peak gain decreases due to mode propagation in FMF and interference from mode coupling. The BGS can be described as follows [55,56]:
g ( v ) = g 0 ( Δ ν B 0 / 2 ) F max F min × tan 1 F max v Δ ν B 0 / 2 tan 1 F min v Δ ν B 0 / 2
where g0 represents the Brillouin gain coefficient in an SMF; ∆vB0 is the linewidth of the BGS in an SMF; Fmax and Fmin are the maximum and minimum BFSs at the scattering angles, respectively.
A simulation graph of simulated Brillouin scattering spectra for the FMF and SMF is provided in Figure 2a. The differential mode group delay, mode coupling, and the inherent dispersion of the FMF among the different modes cause the broadening of the BGS due to the superposition of the different modes. Moreover, intermodal SBS leads to a reduction in the Brillouin scattering spectral gain and the BFS. In FMF, each mode propagates independently. Figure 2b shows the Brillouin scattering spectra simulation for LP01 and LP11 modes in a two-mode fiber. During the simulation, the core refractive index used is 1.4485, and the cladding’s refractive index is 1.4436. Through COMSOL finite element simulation, the effective refractive indices obtained for LP01 and LP11 are 1.4481 and 1.4474 respectively.

2.2. Golay Codes Principle
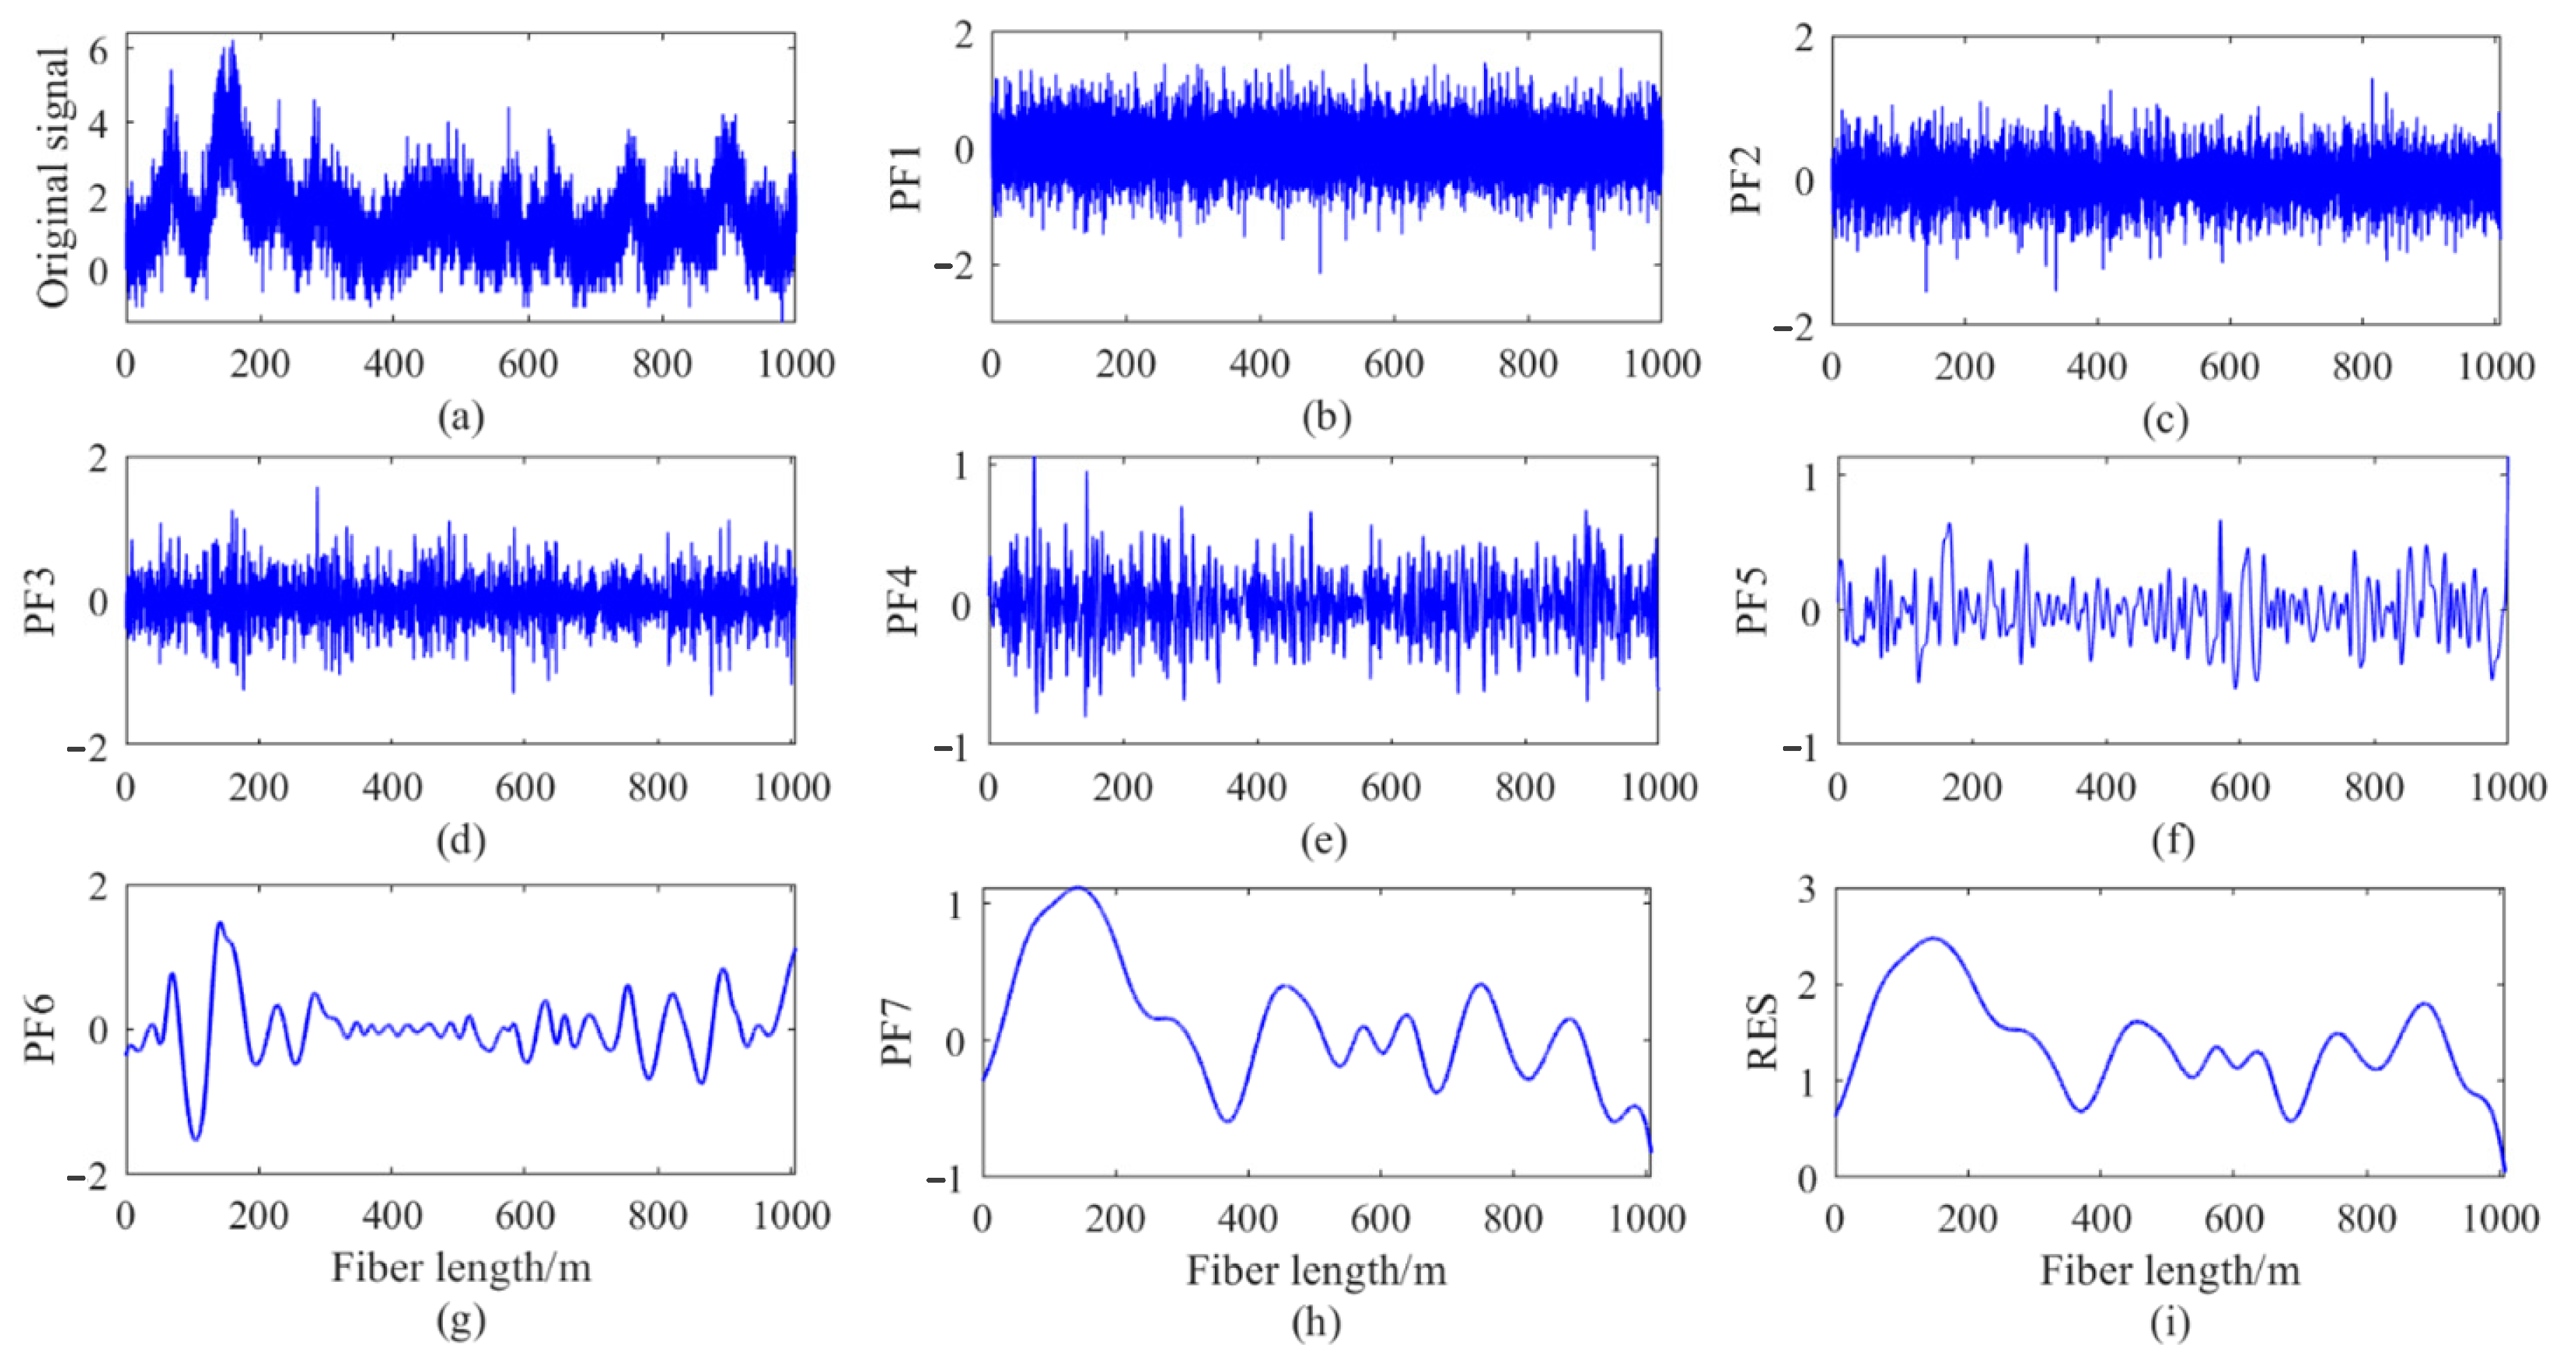
A Golay pulse code [28,57] consists of a pair of complementary bipolar sequences, which are autocorrelation codes (Ak and Bk) with the same length (N). The sum of their autocorrelation functions is equals to an integer multiple of the δ function, which can be expressed as follows:
A k A k + B k B k = 2 N δ k δ k = 1 ,   k = 0 0 ,   k 0
where represents the correlation operation, N is the length of the Golay complementary sequence, and δk is the unit impulse function.
In a Rayleigh BOTDA system utilizing Golay coding, a Golay bipolar complementary sequence must be converted into four unipolar sequences for transmission in the sensing system. The unipolar sequences can be described as follows:
A k = U k 1 U k 2 ,   B k = W k 1 W k 2
where U k 1 = 1 ,   A k = 1 0 ,   A k = 1 ,   U k 2 = 0 ,   A k = 1 1 ,   A k = 1 ,   W k 1 = 1 ,   B k = 1 0 ,   B k = 1 ,   W k 2 = 0 ,   B k = 1 1 ,   B k = 1 .
When the noise source approximates Gaussian white noise [51], the coding gain is √N/2. In our previous analysis of the SNR with pulse coding and single pulse, the SNR after coding was significantly improved compared to the SNR of a single pulse, and the spatial resolution remained unchanged compared with that of the single pulse.

2.3. LMD Method

The local mean decomposition (LMD) method is a time-frequency signal decomposition technique that progressively separates frequency-modulated signals from amplitude-modulated envelope signals [54,58]. LMD can decompose the amplitude- and frequency-modulated signals into product function (PF) components, with each product function being the product of an envelope signal and a frequency-modulated signal, from which the time-varying instantaneous phase and instantaneous frequency can be derived. All PF components are processed iteratively to obtain the residual components, and the denoised signal can finally be obtained by reconstructing the residual components and the PF components containing useful information.
Assuming x(t) as a nonstationary original sequence, the maximum and minimum values of the sequence x(t) can be calculated. Subsequently, the mean value of the maximum and minimum points of each half-wave oscillation of the signal is computed, and the ith mean value, Li(t), and the ith local envelope function, ai(t), for each of the two adjacent extreme points, mi(t) and ni(t), can be expressed as follows:
L i ( t ) = [ m i ( t ) + n i ( t ) ] / 2
a i ( t ) = | m i ( t ) n i ( t ) | / 2
The local mean function, Li(t), is separated from the original sequence to obtain the signal, hi(t), which is demodulated to obtain the pure frequency modulation (FM) function si(t). The hi(t) and si(t) are expressed as follows:
h i ( t ) = x i ( t ) L i ( t )
s i ( t ) = h i ( t ) / a i ( t )
By multiplying the envelope function, ai(t), and the pure FM signal, si(t), the PF component PFi(t) can be obtained as follows:
P F i ( t ) = a i ( t ) s i ( t )
By separating the PFi(t) component in the original sequence, the residual signal, ui(t), is obtained; ui(t) represents the original sequence and the process is repeated k times until the residual signal transforms into a monotonic function. Then, the residual signal, uk(t), is represented as follows:
u k ( t ) = x i ( t ) P F 1 ( t ) P F k ( t )
The denoised signal, z(t), is obtained by reconstructing the effective PF component, PFi(t), and the residual component, uk(t), and it is expressed as follows:
z ( t ) = i = 1 k P F i ( t ) + u k ( t )
From the above analysis, it can be seen that the LMD algorithm adaptively decomposes a complex signal into the sum of several physically components in decreasing order of frequency. The denoised detection signal in a Rayleigh BOTDA system can be extracted by reconstructing the PF components and the residual components.

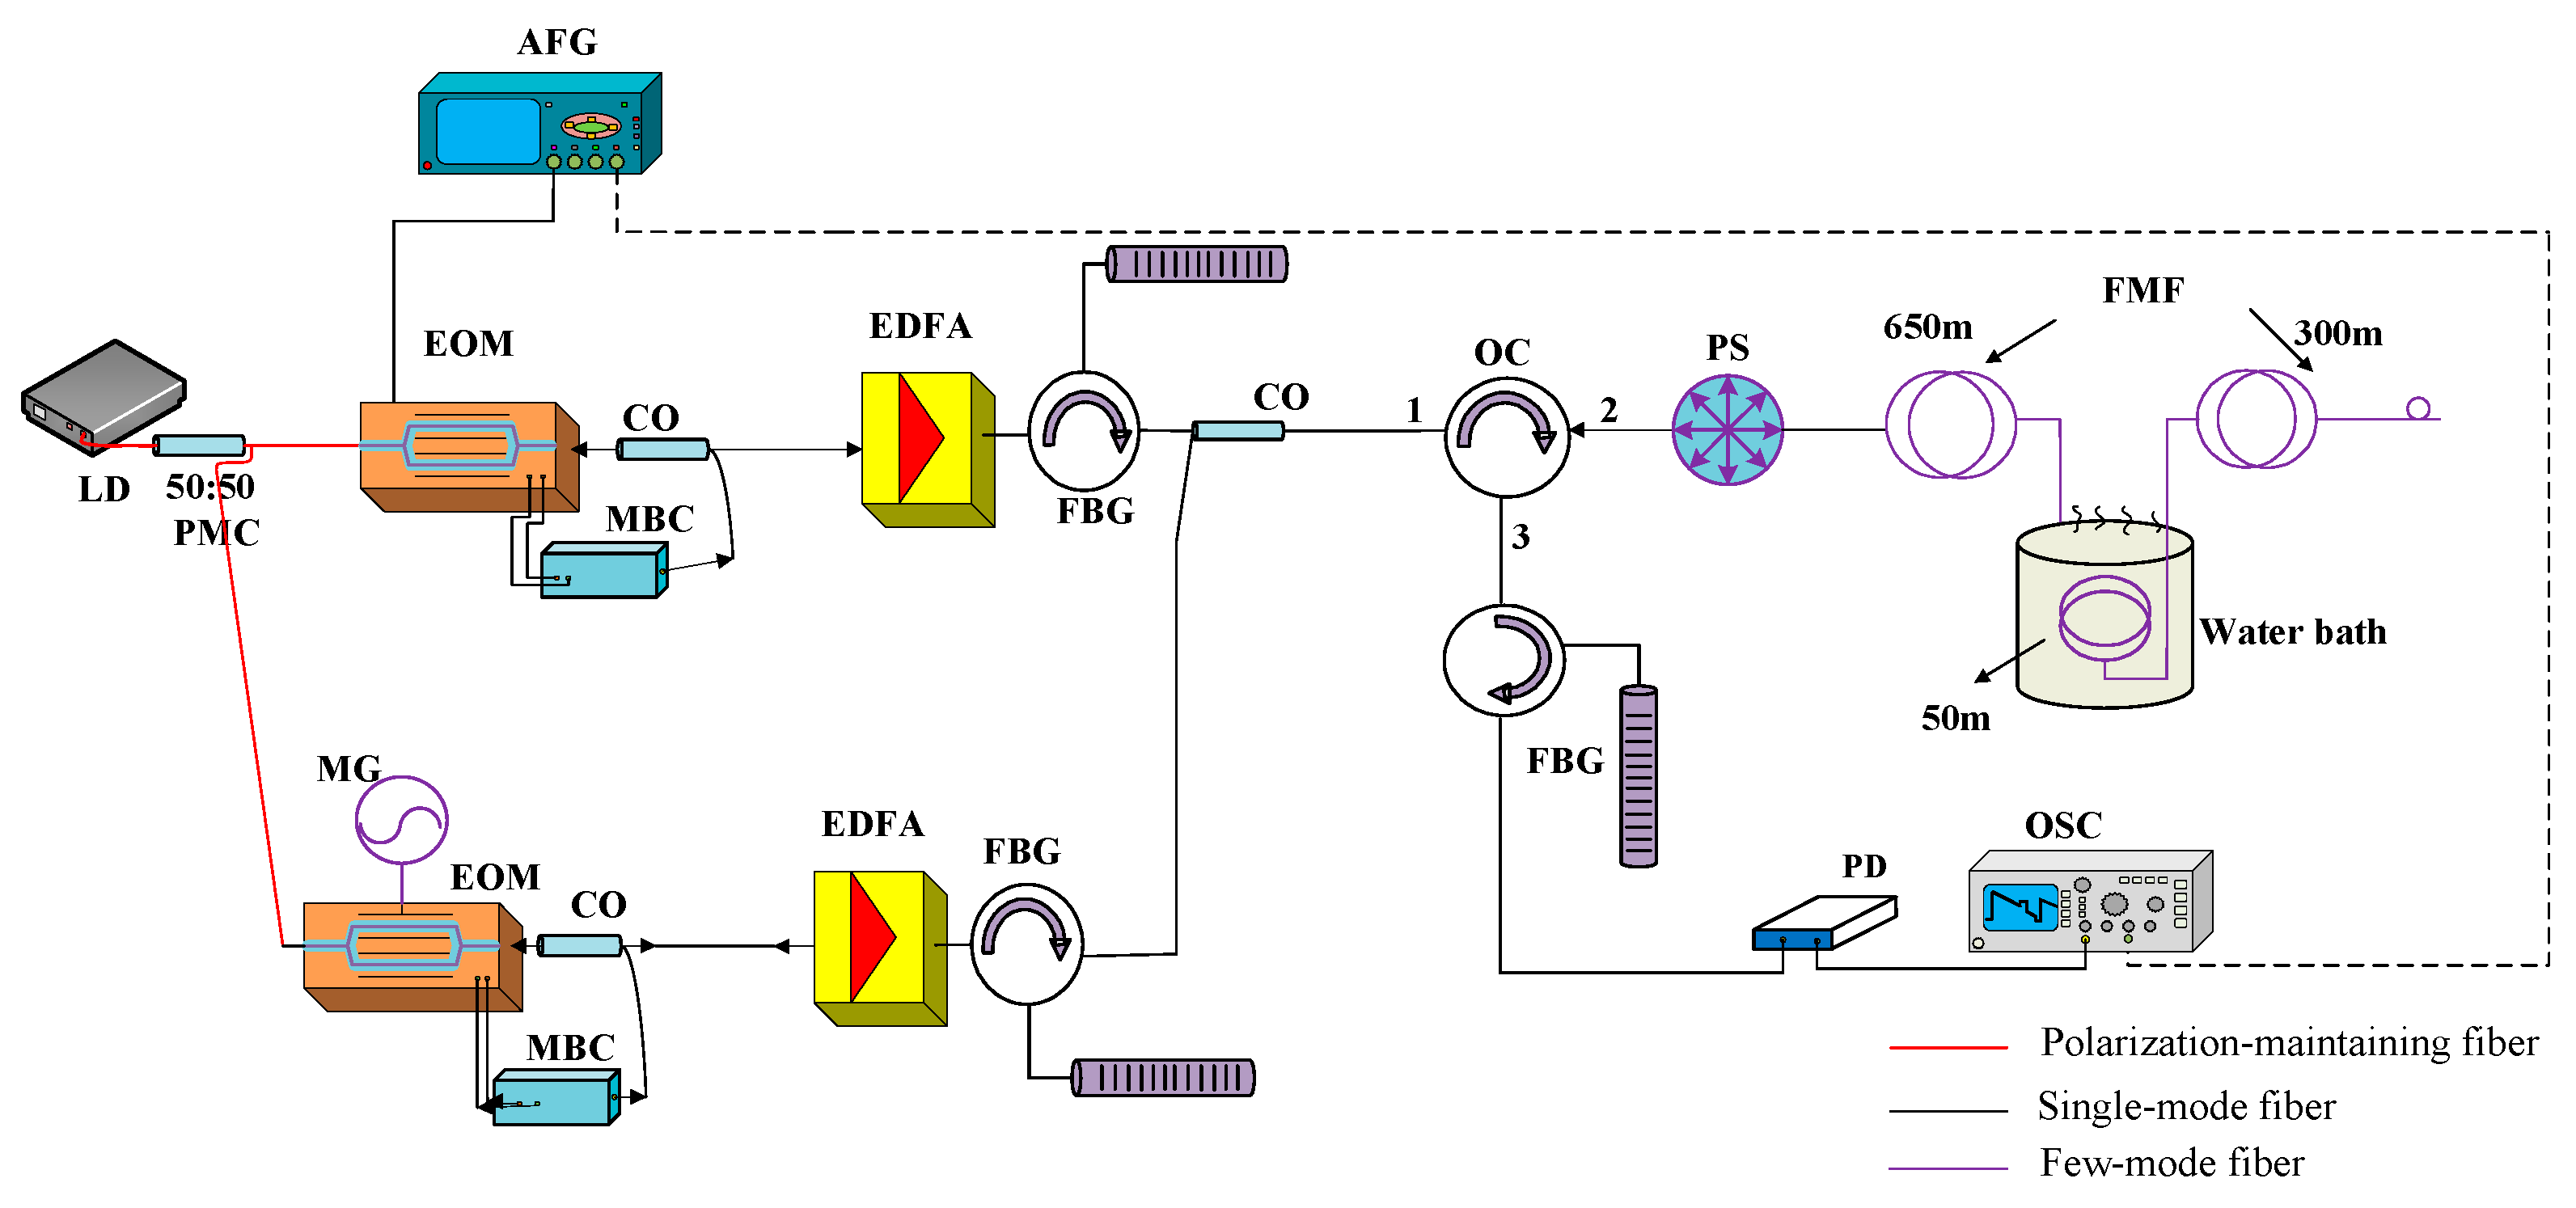
3. Experimental Setup

3.1. Experimental Setup

The experimental setup of the Rayleigh BOTDA system is shown in Figure 3. A narrow-linewidth laser diode (LD) with a central wavelength of 1550.01 nm and a linewidth of 100 kHz was used as the light source. A 50/50 polarization-maintaining coupler (PMC) was used to divide into two branches as the continuous wave and the pump wave into two branches. The upper branch was pulsed using an electro-optic modulator (EOM) driven by a pulse generator (AFG) with an extinction ratio of 40 dB. The pulsed light was amplified using an erbium-doped fiber amplifier (EDFA), which was filtered with a fiber Bragg grating (FBG). The lower branch was modulated using an EOM, which operated in the suppressed carrier regime and was driven using a microwave generator (MG). The continuous wave was amplified with an EDFA, which was filtered with an FBG. The continuous light and pump light were combined with a coupler (CO) and entered port 1 of the circulator (OC). All incident lights entered the FMF through port 2 of the OC, and the Rayleigh scattering light generated along the fiber acted as the probe light. The polarization scrambler (PS) periodically changed the polarization of the incident lights to eliminate the effect of polarization mismatch in the system. The pump light and the probe light underwent the SBS effect in the FMF, and the backscattered probe light carrying the SBS information entered through an FBG. After filtering by the FBG, only the Stokes light was retained. The Stokes light was converted into an electrical signal using a photoelectric detector (PD) with a bandwidth of 500 MHz, and the resulting electrical signal was then sampled using an oscilloscope (OSC) with a sampling rate of 1 GS/s.
In the experiment, a step-refractive index two-mode fiber (TMF) with a total length of 1 km was used, which was produced by the Changfei company, with a core diameter of 14 μm, core refractive index of 1.4485, and cladding diameter of 125 μm. The entire fiber is consisted of 650 m, 50 m, and 300 m, with the 50 m section placed in a thermostatic water bath for temperature control. The experiment mainly consisted of two parts: a single-pulse pumped light with a pulse width of 50 ns and a period of 12 μs, corresponding to a spatial resolution of 5 m; a coded-pulse pumped light with a pulse width of 10 ns, a 32-bit non-return-to-zero Golay coding, and a period of 12 μs, corresponding to a spatial resolution of 1 m. Among them, the peak pulsed power was 600 mW for the single pulse, 200 mW for the coded pulse, and the continuous light power was 1.5 mW. By sweeping the frequency of the MG from 10.765 GHz to 10.865 GHz with a step of 5 MHz, the BGS along the fiber was achieved. The electrical signal corresponding to each sweeping frequency was averaged 5000 times to improve the SNR.
It should be noted that in this article, only a PS is placed in front of the FMF. Since the initial polarization states of the pump light and continuous light entering the PS are different, and the Rayleigh backscattered signal acts as the probe light also changes during transmission, therefore, the relative state of polarization between pump light and probe light will also change. We compared experimentally placing a PS in front of the FMF with placing two PSs separately in the branches of pump light and continuous light, and their Brillouin signals with 5000 times average are shown in Figure 4. It can be seen that placing two PSs does indeed have a better effect than using a single one, but the impact is not particularly significant. Therefore, we used only one PS throughout the entire experimental process.

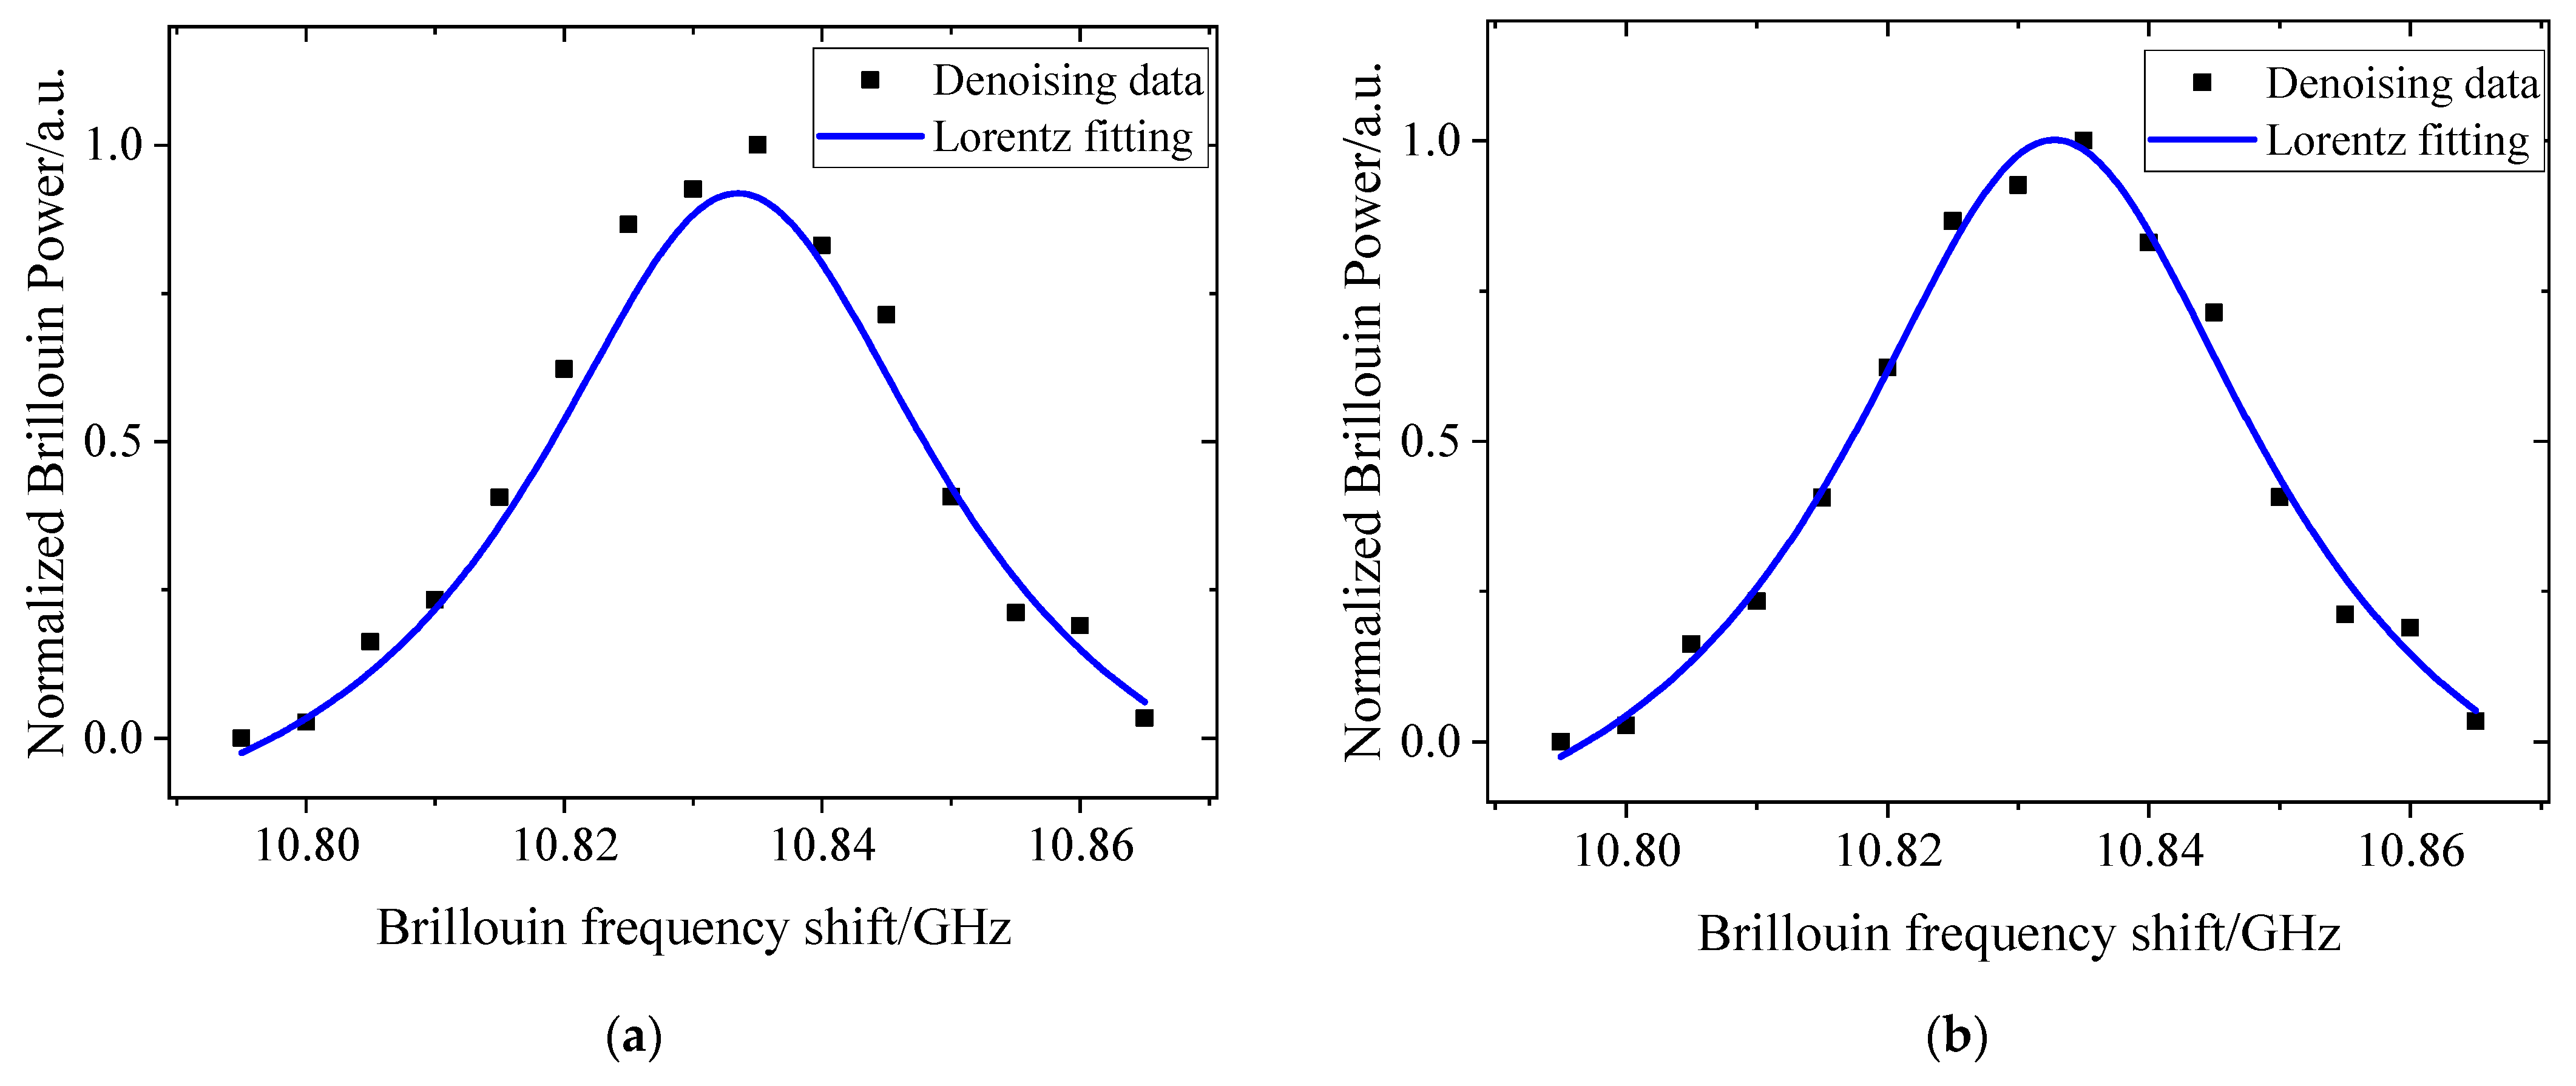
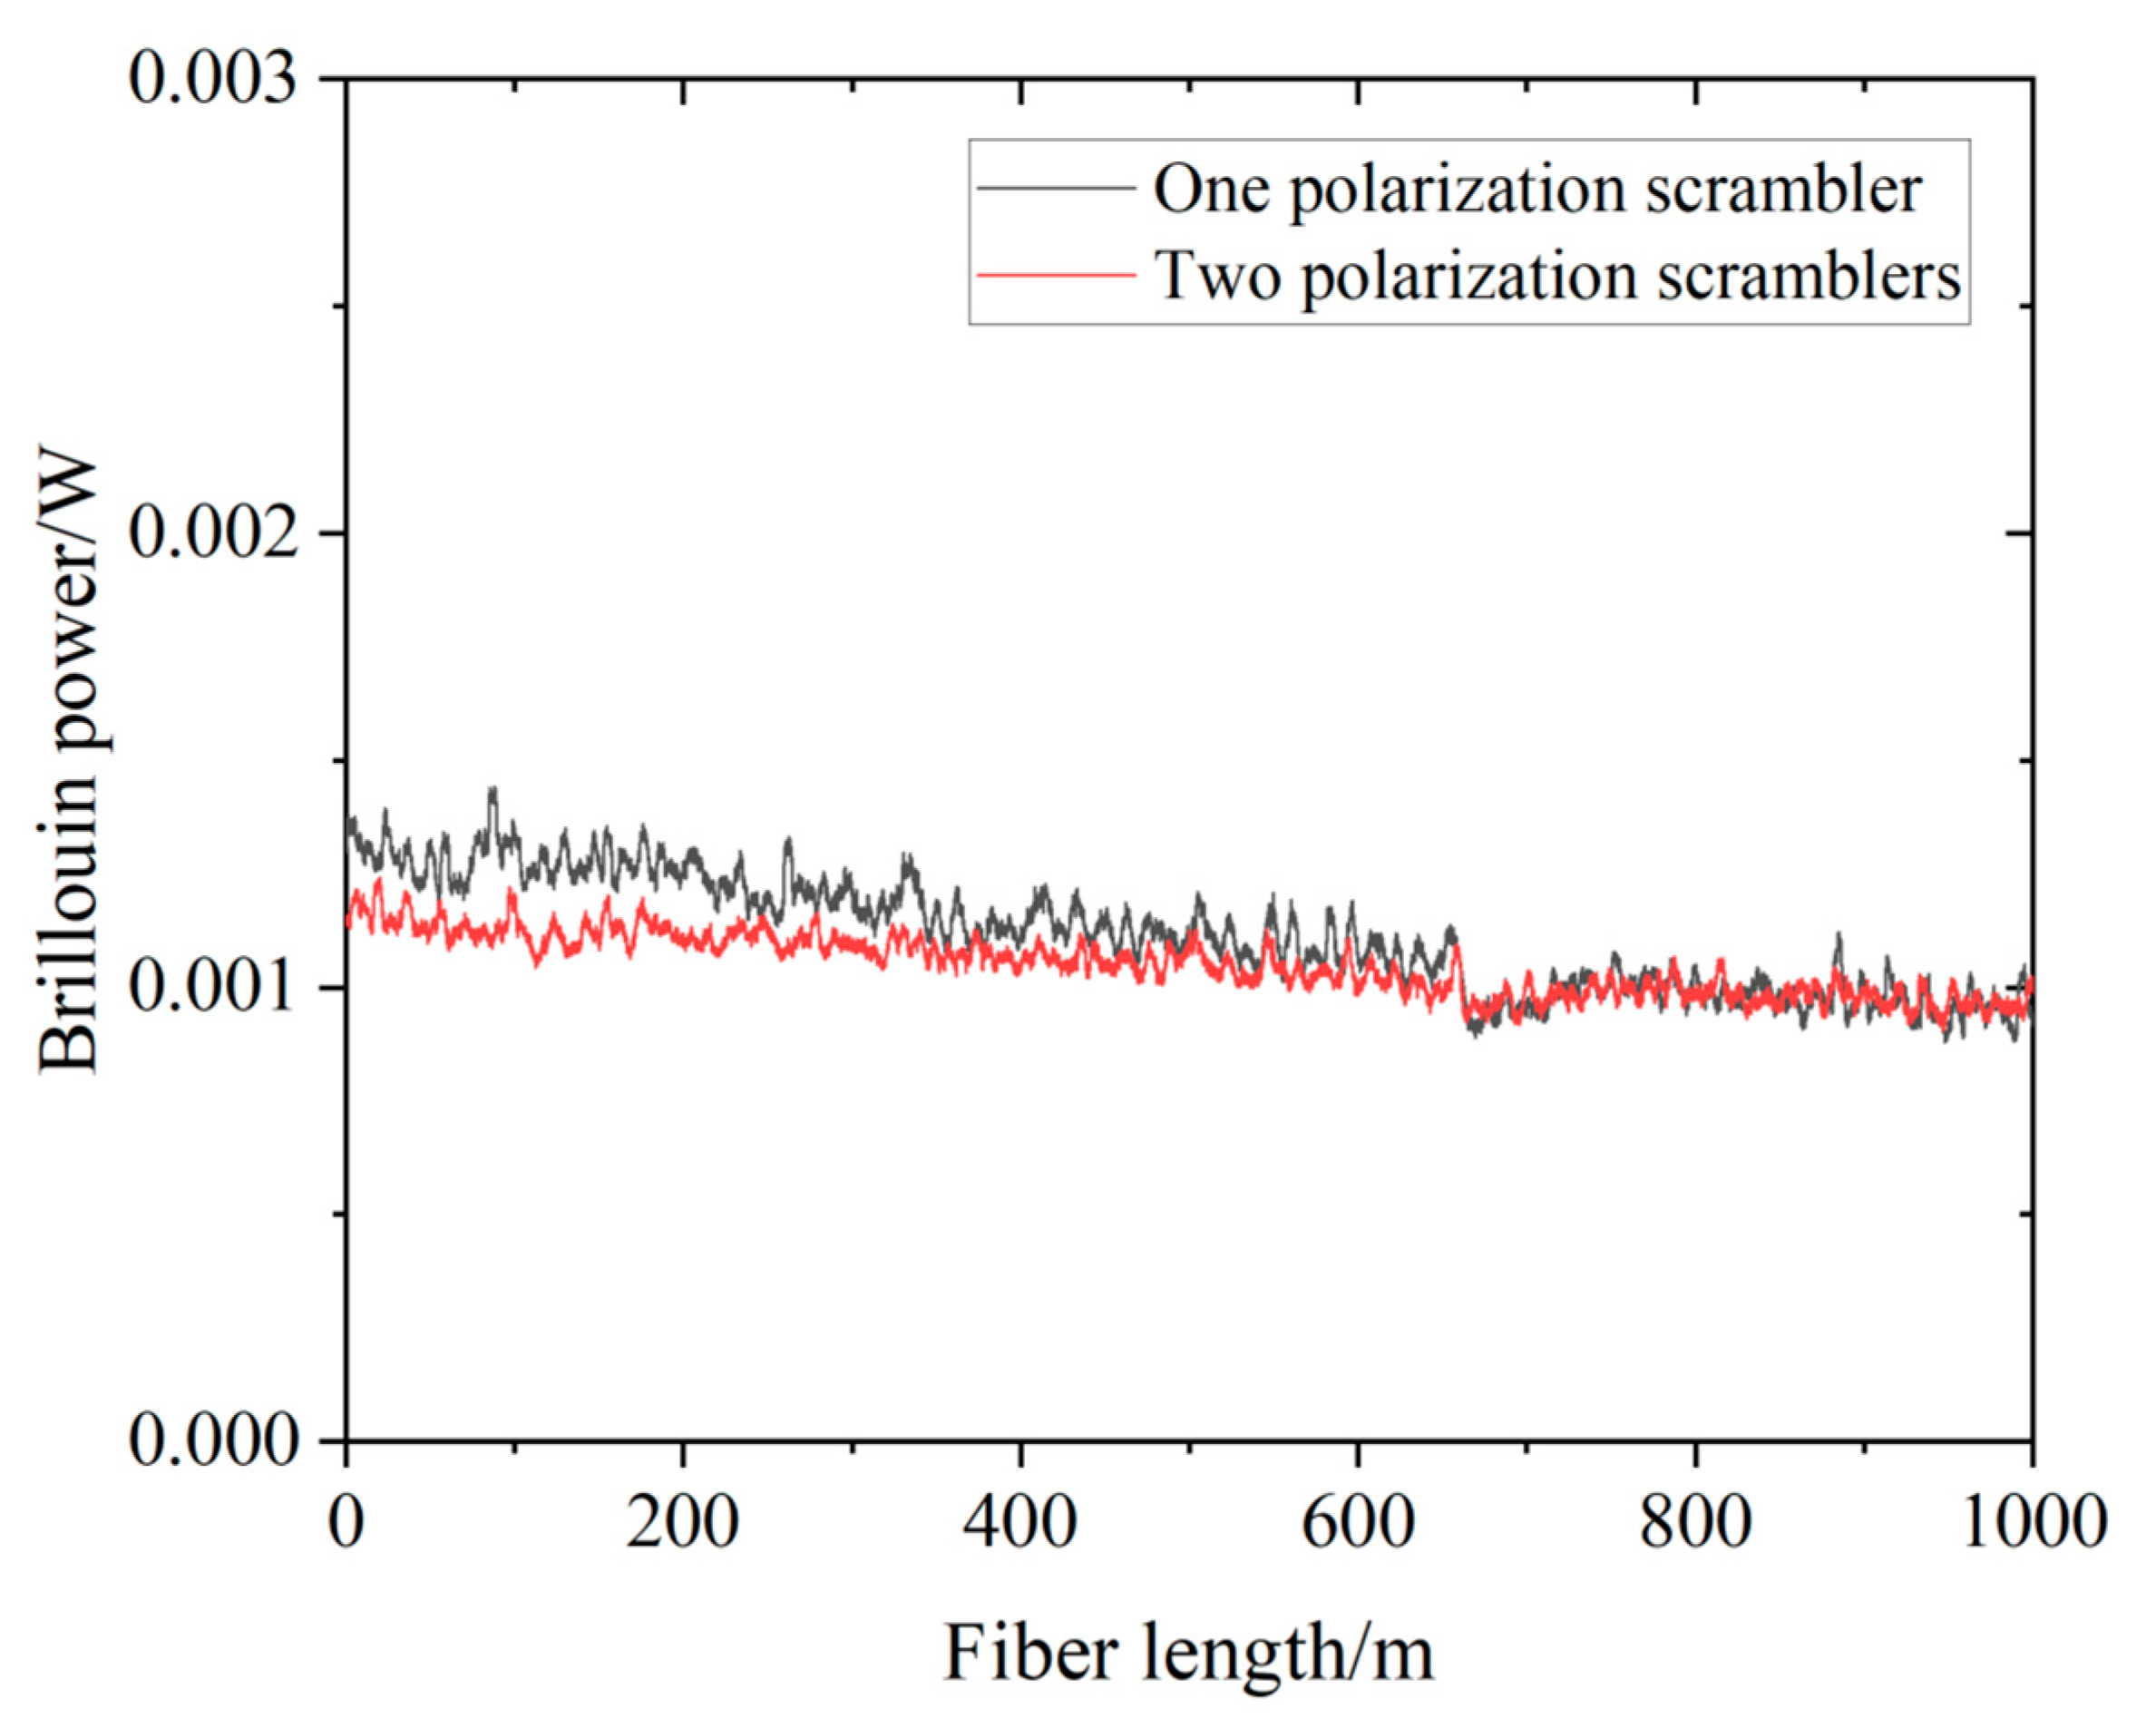
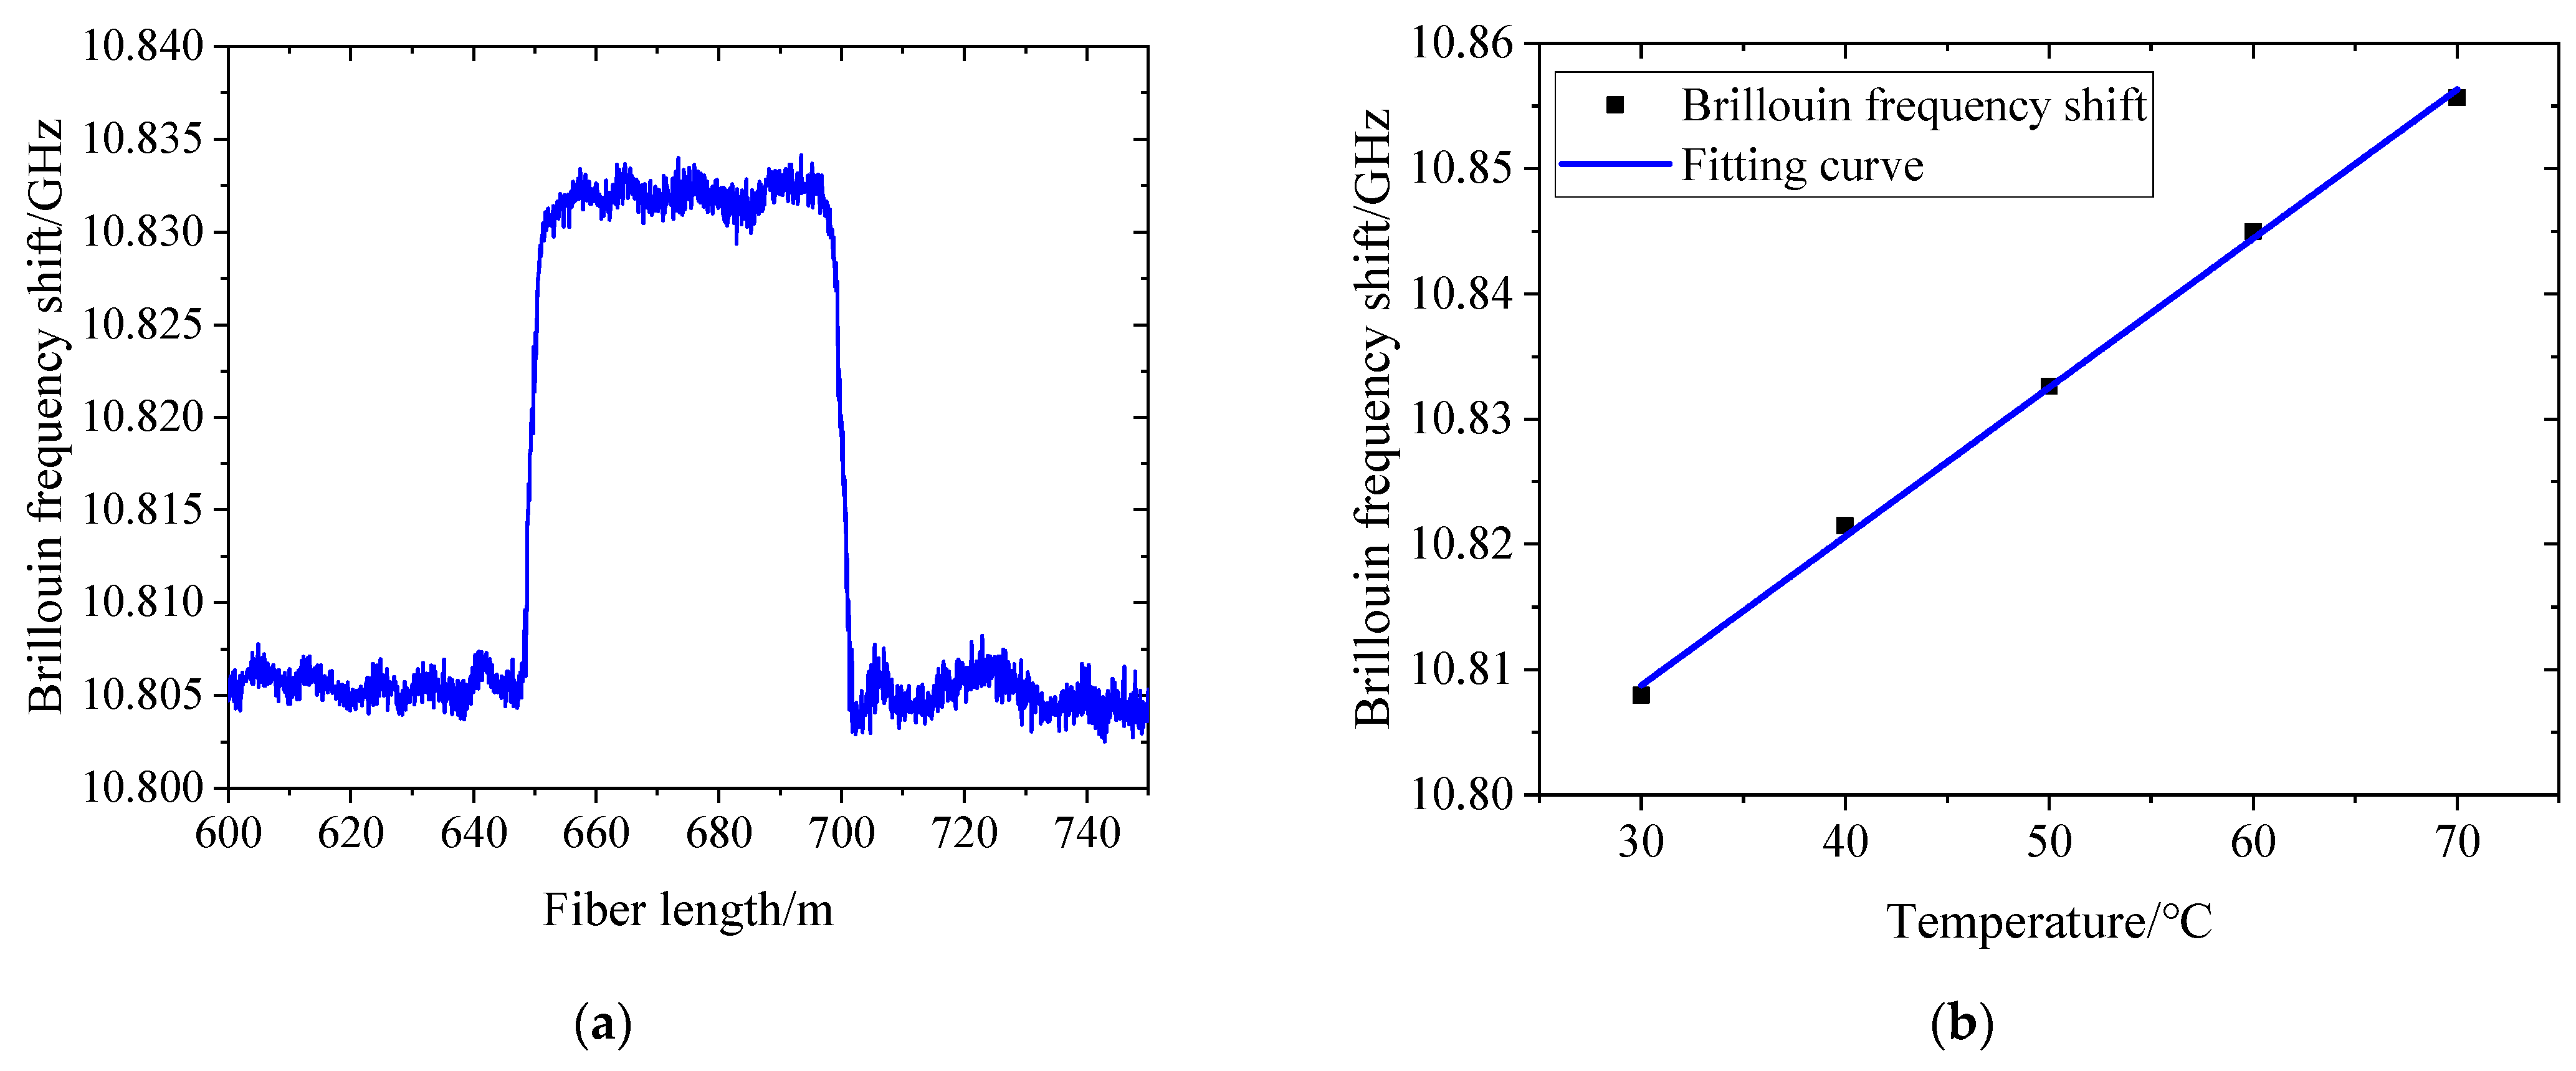
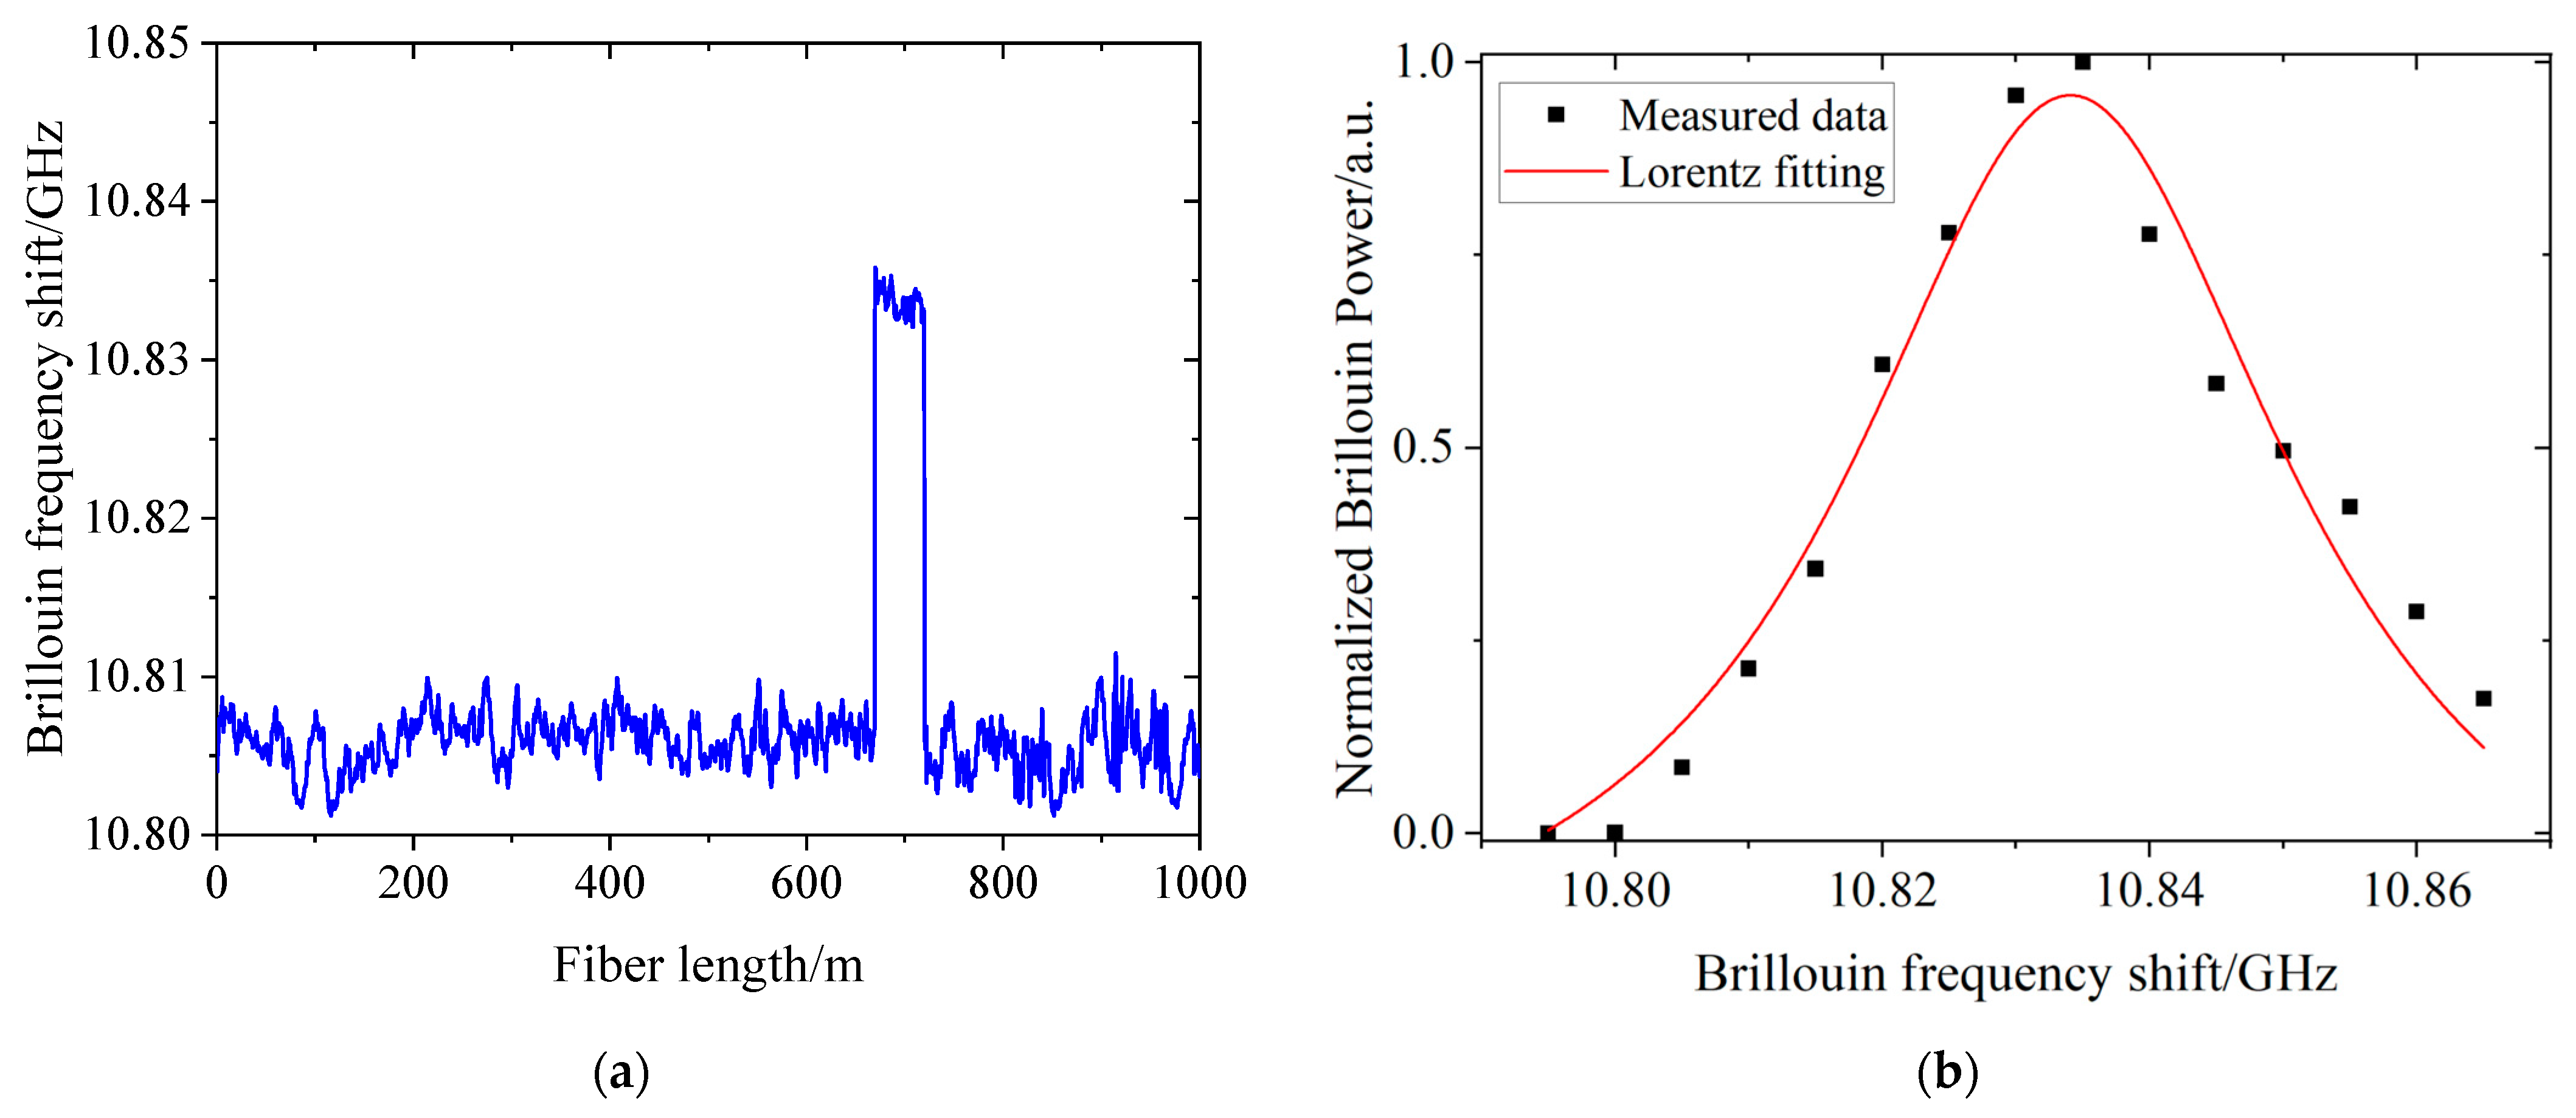
3.2. Results and Discussion

3.2.1. Single Pulse

In a BOTDA system, the Brillouin signal strength can be enhanced by increasing the pump’s pulse width or power. Few-mode fibers can tolerate higher levels of injection power, and we experimentally obtained thresholds of approximately 19.13 dBm and 13.45 dBm for 1 km long TMF and SMF by conducting an SBS threshold measurement experiment. The distribution of the Brillouin frequency shifts in the heated section and the temperature coefficient fitting curve of the TMF under the condition of a single pulse with a peak power of 600 mW are shown in Figure 5. From Figure 5a, we can infer that the spatial resolution was approximately 5 m, and the maximum Brillouin frequency shift fluctuation in the heated section was 2.67 MHz. The Brillouin gain spectrum was measured within the range of 30 °C to 70 °C, and the curve of the relationship between the Brillouin frequency shift and the temperature was obtained, as shown in Figure 5b. The linear fitting of the measurement data suggests that the temperature coefficient of the Brillouin frequency shift was approximately 1.2 MHz/°C.
During the iterative calculation process, the local amplitude is used to demodulate the local mean function separated from the original signal, and the iteration is stopped if the demodulation comes out as a pure frequency modulation function. Figure 6a–g represent the original signal and PF components from the 1st order to the 7th order. Figure 6i shows the decomposed residual component RES, which is a pure FM signal. It is clearly seen that LMD decomposes the signal into seven distinct PFs, with PF1 having the highest frequency and PF7 the lowest.
To better verify the noise reduction effect of the LMD algorithm, a comparison is made between the noise reduction results of Savitzky-Golay (SG) filtering and LMD algorithm. The Brillouin power distribution of the original signal and the denoised signals at 10.805 GHz and the Brillouin frequency shifts of the denoised signals are shown in Figure 7. From Figure 7a, it can clearly be seen that after reconstruction by the LMD algorithm, the fluctuations in the time-domain signal and Brillouin frequency shift were significantly reduced. After LMD algorithm and SG filter denoising, the maximum Brillouin frequency shift fluctuation in the heated section was 0.46 MHz and 1.44 MHz, respectively. The aforementioned results validate the effectiveness of the LMD noise reduction algorithm. It should be noted that the LMD algorithm processes by calculating the average value of extreme points in neighboring half-wave oscillations and obtaining their envelope. As a result, this can attenuate extremities which may subsequently reduce spatial resolution to some extent. By comparing Figure 5a and Figure 7b, it is evident that the spatial resolution before denoising is approximately 4.2 m, whereas after LMD algorithm, the spatial resolution is about 5 m.

3.2.2. Coded Pulse

The Rayleigh BOTDA system uses the backscattered Rayleigh light generated in the fiber as the probe light, so the effect of enhancing the detection signal’s strength by increasing the pulse width or pump power under single-pulse pump conditions is limited. To achieve higher spatial resolution, we reduced the pulse width to 10 ns and 30 ns without altering the single pulse peak power of 600 mW. As a result, after LCF fitting, some distortions appeared in the BGS signal, preventing us from accurately capturing the Brillouin frequency shift. Therefore, by using Golay code pulses, we increased the signal strength at high spatial resolutions which enhanced both the signal-to-noise ratio and measurement accuracy.
The Brillouin frequency shift along the entire fiber is shown in Figure 8a. The Brillouin frequency shift in the heated optical fiber was approximately 10.834 GHz, with a frequency shift fluctuation of approximately 3.75 MHz and a spatial resolution of 1 m. The Brillouin gain spectrum obtained by LCF at 662 m of the fiber in the heated section is shown in Figure 8b. The SNR is calculated to be 31.4 dB, so it is reasonable to use LCF to fit the BGS [45]. According to the LCF, the root mean square error (RMSE) between the measured and fitted values is 0.676731 MHz, and the Brillouin linewidth of the BGS is 40.5 MHz. On the basis of the formula for Brillouin frequency shift precision, δvB = ΔvB/(4RSNC)1/4, the precision of the Brillouin frequency shift was determined to be 4.69 MHz. Furthermore, using the formula for the relationship between temperature measurement precision and Brillouin frequency shift measurement precision, ΔT = δvB/CvT, where CvT = 1.2 MHz/°C, which is the temperature coefficient of the BFS, the temperature measurement precision was calculated to be 3.9 °C.
From the above results, it is known that after 32-bit Golay coding, the spatial resolution of the system improves from 5 m to 1 m. However, this will sacrifice a certain level of SNR, reducing the accuracy of temperature measurement. To further enhance the system’s performance, the time-domain signal was processed for noise reduction using the SG filter and LMD algorithm. The distributions of the Brillouin power and Brillouin frequency shift after SG filter and LMD denoising are obtained, as shown in Figure 9. The Brillouin shift fluctuations in the heated section after noise reduction by SG filter and LMD algorithm are calculated to be 3.26 MHz and 1.46 MHz, respectively. Similar to the single pulse, after noise reduction with LMD algorithm, it will affect spatial resolution, at which point the spatial resolution is 1.12 m.
The Brillouin frequency shift formula indicates that the SNRs after SG filter and LMD are 33.2 dB and 36.9 dB, respectively. Correspondingly, the temperature measurement accuracies after SG filter and LMD denoising are 3.53 °C and 2.85 °C, respectively. Figure 10 shows the Brillouin gain spectrum after noise reduction by SG filter and LMD. The data after denoising using the LMD algorithm showed a better fit compared to that of SG filter. By comparing the results before and after the noise reduction, it can be concluded that with the LMD algorithm, the SNR improved by 5.5 dB and the temperature measurement accuracy increased by 1.05 °C. With the pulse coding and LMD noise reduction algorithm, the spatial resolution and temperature measurement accuracy achieved by the Rayleigh BOTDA system significantly improved to 1.12 m.
In TMF, there exist three types of linear polarized modes: LP01, LP11a, and LP11b. This study did not separate each linear polarized mode, thus leading to an increased spectral width of the Brillouin scattering, which, in turn, constrained the measurement accuracy. In subsequent studies, individual modes in the FMF will be separated to achieve simultaneous multiparameter measurements with high spatial resolution.

4. Conclusions

In conclusion, we proposed and demonstrated the implementation of pulse coding and LMD denoising in a Rayleigh BOTDA sensing system. The proposed scheme effectively overcomes the tradeoffs between the spatial resolution and SNR, and it exhibits high spatial resolution and temperature measurement accuracy along a two-mode sensing fiber. Compared to a 50 ns single pulse, the coded pulse featured a narrow pulse width and low injection power, and the spatial resolution improved to 1 m. An experiment was conducted with a 1 km long TMF, and it successfully measured the BGS with a spatial resolution of 1.12 m and a temperature measurement accuracy of about 3.9 °C. Upon comparing the noise reduction performance of SG filter and LMD algorithm, it is evident that LMD algorithm surpasses SG filter. With the LMD noise reduction algorithm, the SNR and temperature measurement accuracy improved by 5.5 dB and 1.05 °C, respectively. The results of this study demonstrate that pulse coding and the LMD algorithm can effectively improve the performance of the few-mode Rayleigh BOTDA system and provide theoretical and experimental bases for the realization of simultaneous multi-parameter measurements.

Author Contributions

Conceptualization, L.Z. (Lixin Zhang) and X.L.; methodology, L.Z. (Lixin Zhang) and Y.L.; software, L.Z. (Lei Zhang) and J.W.; validation, L.Z. (Lixin Zhang), X.L. and J.W.; formal analysis, L.Z.(Lei Zhang); investigation, X.L.; writing—original draft preparation, L.Z. (Lixin Zhang); writing—review and editing, L.Z. (Lixin Zhang). All authors have read and agreed to the published version of the manuscript.

Funding

This research was funded by the National Natural Science Foundation of China (grant numbers: 62205105 and 52177141); Fundamental Research Funds for the Central Universities (grant number: 2022MS079); and S&T Program of Hebei (SZX2020034).

Institutional Review Board Statement

Not applicable.

Informed Consent Statement

Not applicable.

Data Availability Statement

Data are contained within the article.

Conflicts of Interest

The authors declare no conflicts of interest.

References

  1. Zhang, X.; Yang, J.; Qian, Y.; Zhang, Z.; Wang, X.; Xue, Y.; Yuan, Y.; Wang, Y.; Qin, Y. High Spatial Resolution Internal Stress Testing and Analysis of Fiber Optic Winding Structure Using BOTDA. J. Light. Technol. 2023, 41, 5138–5145. [Google Scholar] [CrossRef]
  2. Gao, S.; Wen, Z.; Wang, H.; Baker, C.; Chen, L.; Cai, Y.; Bao, X. Stimulated Brillouin Scattering and Longitudinal Strain Performance of BOTDA-Based Nonuniform As2Se3-PMMA Tapered Fibers. J. Light. Technol. 2023, 41, 4359–4365. [Google Scholar] [CrossRef]
  3. Dong, Y. High-Performance Distributed Brillouin Optical Fiber Sensing. Photonic Sens. 2021, 11, 69–90. [Google Scholar] [CrossRef]
  4. Luo, K.; Wang, B.; Guo, N.; Yu, K.; Yu, C.; Lu, C. Enhancing SNR by Anisotropic Diffusion for Brillouin Distributed Optical Fiber Sensors. J. Light. Technol. 2020, 38, 5844–5852. [Google Scholar] [CrossRef]
  5. Qi, D.; Guan, X.; Cheng, Y.; Chan, C. Peak-Tracking BOTDA with Dynamic Ternary Search. Opt. Express 2023, 31, 31946–31954. [Google Scholar] [CrossRef] [PubMed]
  6. Wu, W.; Xing, G.; Feng, X. Research on Structure State Identification Method of Segmented Pipeline Based on Distributed Optical Fiber Sensing. J. Civ. Struct. Health Monit. 2023, 14, 255–268. [Google Scholar] [CrossRef]
  7. Wang, Y.; Chen, L.; Bao, X. Single-Shot Chirped Pulse BOTDA for Static and Dynamic Strain Sensing. Opt. Lett. 2021, 46, 5774. [Google Scholar] [CrossRef] [PubMed]
  8. Hoshino, K.; Saito, D.; Endo, Y.; Hasegawa, T.; Tanaka, Y. Brillouin Gain Spectrum Manipulation Using Multifrequency Pump and Probe for Slope-Assisted BOTDA with Wider Dynamic Range. Appl. Phys. Express 2022, 15, 022009. [Google Scholar] [CrossRef]
  9. Minardo, A.; Coscetta, A.; Bernini, R.; Zeni, L. Heterodyne Slope-Assisted Brillouin Optical Time-Domain Analysis for Dynamic Strain Measurements. J. Opt. 2016, 18, 025606. [Google Scholar] [CrossRef]
  10. Huang, L.; Fan, X.; He, Z. Scanning-Free Hybrid Rayleigh–Brillouin Distributed Fiber-Optic Sensing System. Opt. Lett. 2023, 48, 4629. [Google Scholar] [CrossRef]
  11. Cui, Q.; Pamukcu, S.; Lin, A.; Xiao, W.; Herr, D.; Toulouse, J.; Pervizpour, M. Distributed Temperature Sensing System Based on Rayleigh Scattering BOTDA. IEEE Sens. J. 2011, 11, 399–403. [Google Scholar] [CrossRef]
  12. Cui, Q.; Pamukcu, S.; Pervizpour, M. Impact Wave Monitoring in Soil Using a Dynamic Fiber Sensor Based on Stimulated Brillouin Scattering. Sensors 2015, 15, 8163–8172. [Google Scholar] [CrossRef] [PubMed]
  13. Chen, W.; Hu, G.; Liu, F.; Wang, F.; Song, C.; Li, X.; Yu, Y. Threshold for Stimulated Brillouin Scattering in Few-Mode Fibers. Appl. Opt. 2019, 58, 4105–4110. [Google Scholar] [CrossRef] [PubMed]
  14. Song, K.Y.; Kim, Y.H. Characterization of Stimulated Brillouin Scattering in a Few-Mode Fiber. Opt. Lett. 2013, 38, 4841–4844. [Google Scholar] [CrossRef] [PubMed]
  15. Wu, H.; Tang, M.; Wang, M.; Zhao, C.; Zhao, Z.; Wang, R.; Liao, R.; Fu, S.; Yang, C.; Tong, W.; et al. Few-Mode Optical Fiber Based Simultaneously Distributed Curvature and Temperature Sensing. Opt. Express 2017, 25, 12722. [Google Scholar] [CrossRef] [PubMed]
  16. Li, A.; Wang, Y.; Fang, J.; Li, M.; Kim, B.Y.; Shieh, W. Few-Mode Fiber Multi-Parameter Sensor with Distributed Temperature and Strain Discrimination. Opt. Lett. 2015, 40, 1488. [Google Scholar] [CrossRef]
  17. Sui, Q.; Zhang, H.; Downie, J.D.; Wood, W.A.; Hurley, J.; Mishra, S.; Lau, A.P.T.; Lu, C.; Tam, H.-Y.; Wai, P.K.A. Long-Haul Quasi-Single-Mode Transmissions Using Few-Mode Fiber in Presence of Multi-Path Interference. Opt. Express 2015, 23, 3156. [Google Scholar] [CrossRef]
  18. Sheng, D.; Han, Z.; Qiao, Z.; Dong, T.; Wang, C.; Tian, H. Distributed Multi-Parameter Sensor Based on Brillouin Scattering in an Etched Few-Mode Multi-Core Fiber. Opt. Commun. 2024, 552, 130085. [Google Scholar] [CrossRef]
  19. Kim, Y.H.; Song, K.Y. Characterization of Distributed Brillouin Sensors Based on Elliptical-Core Two-Mode Fiber. IEEE Sens. J. 2019, 19, 2155–2161. [Google Scholar] [CrossRef]
  20. Kim, Y.H.; Song, K.Y. Recent Progress in Distributed Brillouin Sensors Based on Few-Mode Optical Fibers. Sensors 2021, 21, 2168. [Google Scholar] [CrossRef]
  21. Li, L.; Jiang, C.; Hu, C.; Gao, J.; Deng, L.; Cao, T.; Li, H. Highly Sensitive Strain Sensor Based on Tapered Few-Mode Fiber. Rev. Sci. Instrum. 2023, 94, 075006. [Google Scholar] [CrossRef] [PubMed]
  22. Horiguchi, T.; Shimizu, K.; Kurashima, T.; Tateda, M.; Koyamada, Y. Development of a Distributed Sensing Technique Using Brillouin Scattering. J. Light. Technol. 1995, 13, 1296–1302. [Google Scholar] [CrossRef]
  23. Feng, L.; Liu, Y.; He, W.; You, Y.; Wang, L.; Xu, X.; Chou, X. Intramode Brillouin Scattering Properties of Single-Crystal Lithium Niobate Optical Fiber. Appl. Sci. 2022, 12, 6476. [Google Scholar] [CrossRef]
  24. Zhang, Y.; Gao, H.; Fu, X.; Tian, Y. Characterization of Brillouin scattering in a few-mode fiber. Acta Phys. Sin. 2017, 66, 024207. [Google Scholar] [CrossRef]
  25. Li, A.; Hu, Q.; Shieh, W. Characterization of Stimulated Brillouin Scattering in a Circular-Core Two-Mode Fiber Using Optical Time-Domain Analysis. Opt. Express 2013, 21, 31894–31906. [Google Scholar] [CrossRef]
  26. Li, Z.; Zhou, Y.; Hua, Z.; Yan, L. Balanced Detection for Performance Enhancement in a Pulse-Coded Brillouin Optical Time Domain Analyzer. IEEE Sens. J. 2023, 23, 1166–1171. [Google Scholar] [CrossRef]
  27. Zan, M.S.D.B.; Horiguchi, T. A Dual Golay Complementary Pair of Sequences for Improving the Performance of Phase-Shift Pulse BOTDA Fiber Sensor. J. Light. Technol. 2012, 30, 3338–3356. [Google Scholar] [CrossRef]
  28. Soto, M.A.; Floch, S.L.; Thévenaz, L. Bipolar Optical Pulse Coding for Performance Enhancement in BOTDA Sensors. Opt. Express 2013, 21, 16390–16397. [Google Scholar] [CrossRef] [PubMed]
  29. Bao, Y.; Huang, Q.; Sun, J. Theoretical Research on the Characteristics of BOTDR with Raman Amplification. Opt. Commun. 2021, 487, 126775. [Google Scholar] [CrossRef]
  30. Esmaeelpour, M.; Ryf, R.; Fontaine, N.K.; Chen, H.; Gnauck, A.H.; Essiambre, R.J.; Toulouse, J.; Sun, Y.; Lingle, R. Transmission Over 1050-Km Few-Mode Fiber Based on Bidirectional Distributed Raman Amplification. J. Light. Technol. 2016, 34, 1864–1871. [Google Scholar] [CrossRef]
  31. Soto, M.A.; Bolognini, G.; Pasquale, F.D. Optimization of Long-Range BOTDA Sensors with High Resolution Using First-Order Bi-Directional Raman Amplification. Opt. Express 2011, 19, 4444–4457. [Google Scholar] [CrossRef] [PubMed]
  32. Zhao, J.; Wang, T.; Zhang, Q.; Zhang, M.; Zhang, J.; Qiao, L.; Gao, S.; Liu, J.; Li, J. Signal-to-Noise Ratio Improvement of Brillouin Optical Time Domain Analysis System Based on Empirical Mode Decomposition and Finite Impulse Response. Appl. Opt. 2020, 59, 4220. [Google Scholar] [CrossRef] [PubMed]
  33. Soto, M.A.; Ramírez, J.A.; Thévenaz, L. Intensifying the Response of Distributed Optical Fibre Sensors Using 2D and 3D Image Restoration. Nat. Commun. 2016, 7, 10870. [Google Scholar] [CrossRef] [PubMed]
  34. Farahani, M.A.; Castillo-Guerra, E.; Colpitts, B.G. Acceleration of Measurements in BOTDA Sensors Using Adaptive Linear Prediction. IEEE Sens. J. 2013, 13, 263–272. [Google Scholar] [CrossRef]
  35. Qian, X.; Jia, X.; Wang, Z.; Zhang, B.; Xue, N.; Sun, W.; He, Q.; Wu, H. Noise Level Estimation of BOTDA for Optimal Non-Local Means Denoising. Appl. Opt. 2017, 56, 4727. [Google Scholar] [CrossRef]
  36. Li, B.; Jiang, N.; Han, X. Denoising of BOTDR Dynamic Strain Measurement Using Convolutional Neural Networks. Sensors 2023, 23, 1764. [Google Scholar] [CrossRef] [PubMed]
  37. Li, B.; Jiang, N.; Han, X. Denoising of Brillouin Gain Spectrum Images for Improved Dynamic Measurements of BOTDR. IEEE Photonics J. 2023, 15, 1–8. [Google Scholar] [CrossRef]
  38. Zhang, Y.; Lu, Y.; Chen, L.; Wu, T.; He, C. Segmented Noise Reduction Based on Brillouin-Spectrum-Partition in Brillouin Optical Time Domain Sensors. IEEE Sens. J. 2021, 21, 22792–22802. [Google Scholar] [CrossRef]
  39. Zha, J.; Meng, Y.; Li, D.; Yin, H.; Wang, D.; Yu, W. Determination of Average Times for Brillouin Optical Time Domain Analysis Sensor Denoising by Non-Local Means Filtering. Opt. Commun. 2018, 426, 648–653. [Google Scholar] [CrossRef]
  40. Yang, Z.; Li, Z.; Zaslawski, S.; Thévenaz, L.; Soto, M.A. Design Rules for Optimizing Unipolar Coded Brillouin Optical Time-Domain Analyzers. Opt. Express 2018, 26, 16505–16523. [Google Scholar] [CrossRef]
  41. Sun, Q.; Tu, X.; Sun, S.; Meng, Z. Long-Range BOTDA Sensor over 50 Km Distance Employing Pre-Pumped Simplex Coding. J. Opt. 2016, 18, 055501. [Google Scholar] [CrossRef]
  42. Wang, Q.; Bai, Q.; Liang, C.; Wang, Y.; Liu, Y.; Jin, B. Random Coding Method for SNR Enhancement of BOTDR. Opt. Express 2022, 30, 11604–11618. [Google Scholar] [CrossRef] [PubMed]
  43. Zhou, Y.; Yan, L.; Li, Z.; He, H.; Ye, J.; Pan, W.; Luo, B. Long-Range High-Spatial-Resolution Distributed Brillouin Sensing Enabled by Correlation-Domain Encoding. Opt. Lett. 2023, 48, 3143–3146. [Google Scholar] [CrossRef] [PubMed]
  44. Zheng, H.; Yan, Y.; Wang, Y.; Shen, X.; Lu, C. Deep Learning Enhanced Long-Range Fast BOTDA for Vibration Measurement. J. Light. Technol. 2022, 40, 262–268. [Google Scholar] [CrossRef]
  45. Nordin, N.D.; Zan, M.S.D.; Abdullah, F. Comparative Analysis on the Deployment of Machine Learning Algorithms in the Distributed Brillouin Optical Time Domain Analysis (BOTDA) Fiber Sensor. Photonics 2020, 7, 79. [Google Scholar] [CrossRef]
  46. Wu, H.; Wang, L.; Guo, N.; Shu, C.; Lu, C. Brillouin Optical Time-Domain Analyzer Assisted by Support Vector Machine for Ultrafast Temperature Extraction. J. Light. Technol. 2017, 35, 4159–4167. [Google Scholar] [CrossRef]
  47. Azad, A.K.; Wang, L.; Guo, N.; Lu, C.; Tam, H.Y. Temperature Sensing in BOTDA System by Using Artificial Neural Network. Electron. Lett. 2015, 51, 1578–1580. [Google Scholar] [CrossRef]
  48. Lv, T.; Ye, X.; Huang, K.; Zheng, Y.; Ge, Z.; Xu, Z.; Sun, X. Cascaded Feedforward Neural Network Based Simultaneously Fast and Precise Multi-Characteristics Extraction and BFS Error Estimation. J. Light. Technol. 2022, 40, 7937–7945. [Google Scholar] [CrossRef]
  49. Krivosheev, A.I.; Barkov, F.L.; Konstantinov, Y.A.; Belokrylov, M.E. State-of-the-Art Methods for Determining the Frequency Shift of Brillouin Scattering in Fiber-Optic Metrology and Sensing (Review). Instrum. Exp. Tech. 2022, 65, 687–710. [Google Scholar] [CrossRef]
  50. Zhang, Y.; Lu, Y.; Zhang, Z.; Wang, J.; He, C.; Wu, T. Noise Reduction by Brillouin Spectrum Reassembly in Brillouin Optical Time Domain Sensors. Opt. Lasers Eng. 2020, 125, 105865. [Google Scholar] [CrossRef]
  51. Wu, H.; Wan, Y.; Tang, M.; Chen, Y.; Zhao, C.; Liao, R.; Chang, Y.; Fu, S.; Shum, P.P.; Liu, D. Real-Time Denoising of Brillouin Optical Time Domain Analyzer With High Data Fidelity Using Convolutional Neural Networks. J. Light. Technol. 2019, 37, 2648–2653. [Google Scholar] [CrossRef]
  52. Li, S.; Sun, S.; Shu, Q.; Chen, M.; Zhang, D.; Zhou, D. Partial Discharge Signal Denoising Method Based on Frequency Spectrum Clustering and Local Mean Decomposition. IET Sci. Meas. Amp Technol. 2021, 14, 853–861. [Google Scholar] [CrossRef]
  53. Hsueh, H.-C.; Chien, S.-Y. On-Line Local Mean Decomposition and Its Application to ECG Signal Denoising. In Proceedings of the 2014 IEEE Biomedical Circuits and Systems Conference (BioCAS) Proceedings, Lausanne, Switzerland, 22–24 October 2014; pp. 17–20. [Google Scholar]
  54. Smith, J.S. The Local Mean Decomposition and Its Application to EEG Perception Data. J. R. Soc. Interface 2005, 2, 443–454. [Google Scholar] [CrossRef] [PubMed]
  55. Kovalev, V.I.; Harrison, R.G. Observation of Inhomogeneous Spectral Broadening of Stimulated Brillouin Scattering in an Optical Fiber. Phys. Rev. Lett. 2000, 85, 1879–1882. [Google Scholar] [CrossRef] [PubMed]
  56. Kovalev, V.I.; Harrison, R.G. Waveguide-Induced Inhomogeneous Spectral Broadening of Stimulated Brillouin Scattering in Optical Fiber. Opt. Lett. 2002, 27, 2022. [Google Scholar] [CrossRef] [PubMed]
  57. Jedwab, J.; Parker, M.G. Golay Complementary Array Pairs. Des. Codes Cryptogr. 2007, 44, 209–216. [Google Scholar] [CrossRef]
  58. Zhang, Q.; Wang, T.; Zhao, J.; Liu, J.; Wang, Y.; Zhang, J.; Qiao, L.; Zhang, M. Denoising Algorithm for Brillouin Optical Time-Domain Analysis Sensing Systems Based on Local Mean Decomposition. Acta Opt. Sin. 2021, 41, 1306009. [Google Scholar] [CrossRef]
Figure 1. Operating principle of Rayleigh BOTDA systems.
Photonics 11 00308 g001
Figure 2. Simulation of Brillouin scattering spectra for (a) an FMF and an SMF; (b) each mode in FMF.
Photonics 11 00308 g002
Figure 3. Experimental setup of the Rayleigh BOTDA system. LD: laser diode; PMC: polarization-maintaining coupler; AFG: pulse generator; EOM: electro-optic modulator; MG: microwave generator; MBC: modulator bias controller; EDFA: erbium-doped fiber amplifier; FBG: fiber Bragg grating; CO: coupler; OC: circulator; PS: polarization scrambler; PD: photoelectric detector; OSC: oscilloscope.
Photonics 11 00308 g003
Figure 4. Comparison of Brillouin signals using one PS and two PSs.
Photonics 11 00308 g004
Figure 5. Brillouin frequency shift distribution in the heated section and the temperature coefficient fitting curve: (a) distribution of the Brillouin frequency shift at 50 °C in the heated section; (b) Brillouin frequency shift versus temperature.
Photonics 11 00308 g005
Figure 6. (a) Original signal; (bh) PF components; (i) RES from LMD decomposition.
Photonics 11 00308 g006
Figure 7. Distributions of the Brillouin power and Brillouin frequency shift after LMD denoising: (a) comparison of the original signal and the denoised signal at 10.805 GHz; (b) distribution of the Brillouin frequency shift at 50 °C in the heated section.
Photonics 11 00308 g007
Figure 8. (a) Brillouin frequency shift distribution; (b) Brillouin gain spectrum at 662 m.
Photonics 11 00308 g008
Figure 9. Distributions of the (a) Brillouin power and (b) Brillouin frequency shift after LMD and SG filter denoising.
Photonics 11 00308 g009
Figure 10. Brillouin gain spectrum after noise reduction by (a) SG filter and (b) LMD.
Photonics 11 00308 g010
Disclaimer/Publisher’s Note: The statements, opinions and data contained in all publications are solely those of the individual author(s) and contributor(s) and not of MDPI and/or the editor(s). MDPI and/or the editor(s) disclaim responsibility for any injury to people or property resulting from any ideas, methods, instructions or products referred to in the content.

