1. Introduction
Confining light to a small volume increases the light–matter interaction, as described by Purcell’s theory. This is crucial for nonlinear optical effects and is especially important when one deals with the detection of a small object, such as molecules or biosamples. The refractive index of biosamples and their environment (substrates, matrices, solvents …) is often relatively low. In materials with high refractive index, light confinement is accessible using, for instance, a photonic crystal structure. However, confining light to an object with low refractive index is still a challenge for several spectral ranges. In the visible and near-infrared range, the use of dielectric structures for light confinement has been proposed [
1,
2,
3] and has shown interesting results, however, the achieved volumes remain on the order of magnitude of the cube of the wavelength. The main approaches to reach smaller sizes involve the use of metallic structures based on plasmonic effects [
4,
5,
6], which has led to several breakthroughs, but with the intrinsic drawback of bringing additional losses.
Terahertz (THz) technology has shown increasing development in recent years. Although almost the entire electromagnetic (EM) spectrum is used, one spectral range has still to be harnessed and exploited, namely, the THz band. Because of its application in security and healthcare, nowadays the THz domain is one of the most appealing spectral ranges. There, many materials and living tissues are semi-transparent and can be imaged, identified, and analyzed. The THz range is extremely promising for spectroscopy, especially for biological systems, since the energy of the photon in the THz range is around
at room temperature (~6 THz) and corresponds to the fundamental vibrational modes of molecules, molecular crystals or macromolecules, such as carbohydrates [
7], DNA, RNA, and proteins [
8]. To summarize, while spectroscopy in the mid-infrared range of the spectrum mainly probes vibrations associated with localized atom–atom stretches in molecules, THz frequencies mainly probe collective vibrational modes in heavy and/or long molecules. However, there are still many hurdles to jump over to enable THz spectroscopy of actual biosamples. One of the major issues is that they are very small compared to the THz wavelength, which is typically between 0.1 and 1 mm. Therefore, it is mandatory to enable subwavelength confinement of the THz electromagnetic field in the sample.
Such confinement has been a subject of interest in the community. To our knowledge, all the approaches exploit the relatively good response of metals in the THz range compared to the visible or near infrared ranges. There are two different approaches. The first one is to use a near-field microscopy set-up and to functionalize it for THz spectroscopy [
9]. The second is to use a subwavelength waveguide structure. One can, for instance, use a metallic wire [
10] around which the THz wave will propagate. In this case, the sample is placed around the wire and the light–matter interaction is not entirely enhanced because higher confinements can be achieved using full metallic boundary conditions. The most natural approach to confine the light in one direction is to use a parallel plate metallic waveguide (PPMW) [
11]. In such a waveguide, the lower frequency mode (transverse electromagnetic: TEM) shows no frequency cut-off, relatively low losses, and, importantly, very weak dispersion linked only to the metallic material’s dispersion, which is ideal for time-domain spectroscopy (TDS) [
12,
13] experiments. However, a specific coupling scheme is needed to properly excite the mode of interest.
The first proposed method uses silicon cylindrical lenses [
11] with the drawbacks of introducing coupling that is highly dependent on waveguide geometry, and adding reflections due to the high refractive index of silicon. Despite this, this technique has been used inside a cryostat [
14]. To overcome the limitations, tapered coupling antennas were used [
15] which improved the coupling and the ease of use of the device. However, the main limitation of the PPMW is that it assumes a quasi-infinite height with the major consequence that there is no vertical confinement. There are two drawbacks of this: firstly, the light–matter interaction for small samples is smaller than in the case of 2D confinement; secondly, no vertical confinement means that during the propagation inside the waveguide, the mode will expand in the vertical direction, resulting in a strong astigmatism, probably explaining the high losses experienced in Ref. [
15].
In this article, we present the design, technological process, characterization, and typical application of a device aiming to confine THz pulses into a 2D waveguide. The thick slot line waveguide (TSLW) does not show significant reflection or dispersion. We combined the curved tapered antenna approach (similarly to Ref. [
15]) to properly inject the beam into the waveguide together with the approach of Ref. [
16], using a fully planar geometry and subsequent 2D confinement. We modified this combination with the use of an exponential growth taper, as in Vivaldi antennas. Due to its final shape and geometry, we named our exponential tapered antenna coupled metallic waveguide “
Butterfly”.
2. Design
2.1. General Considerations
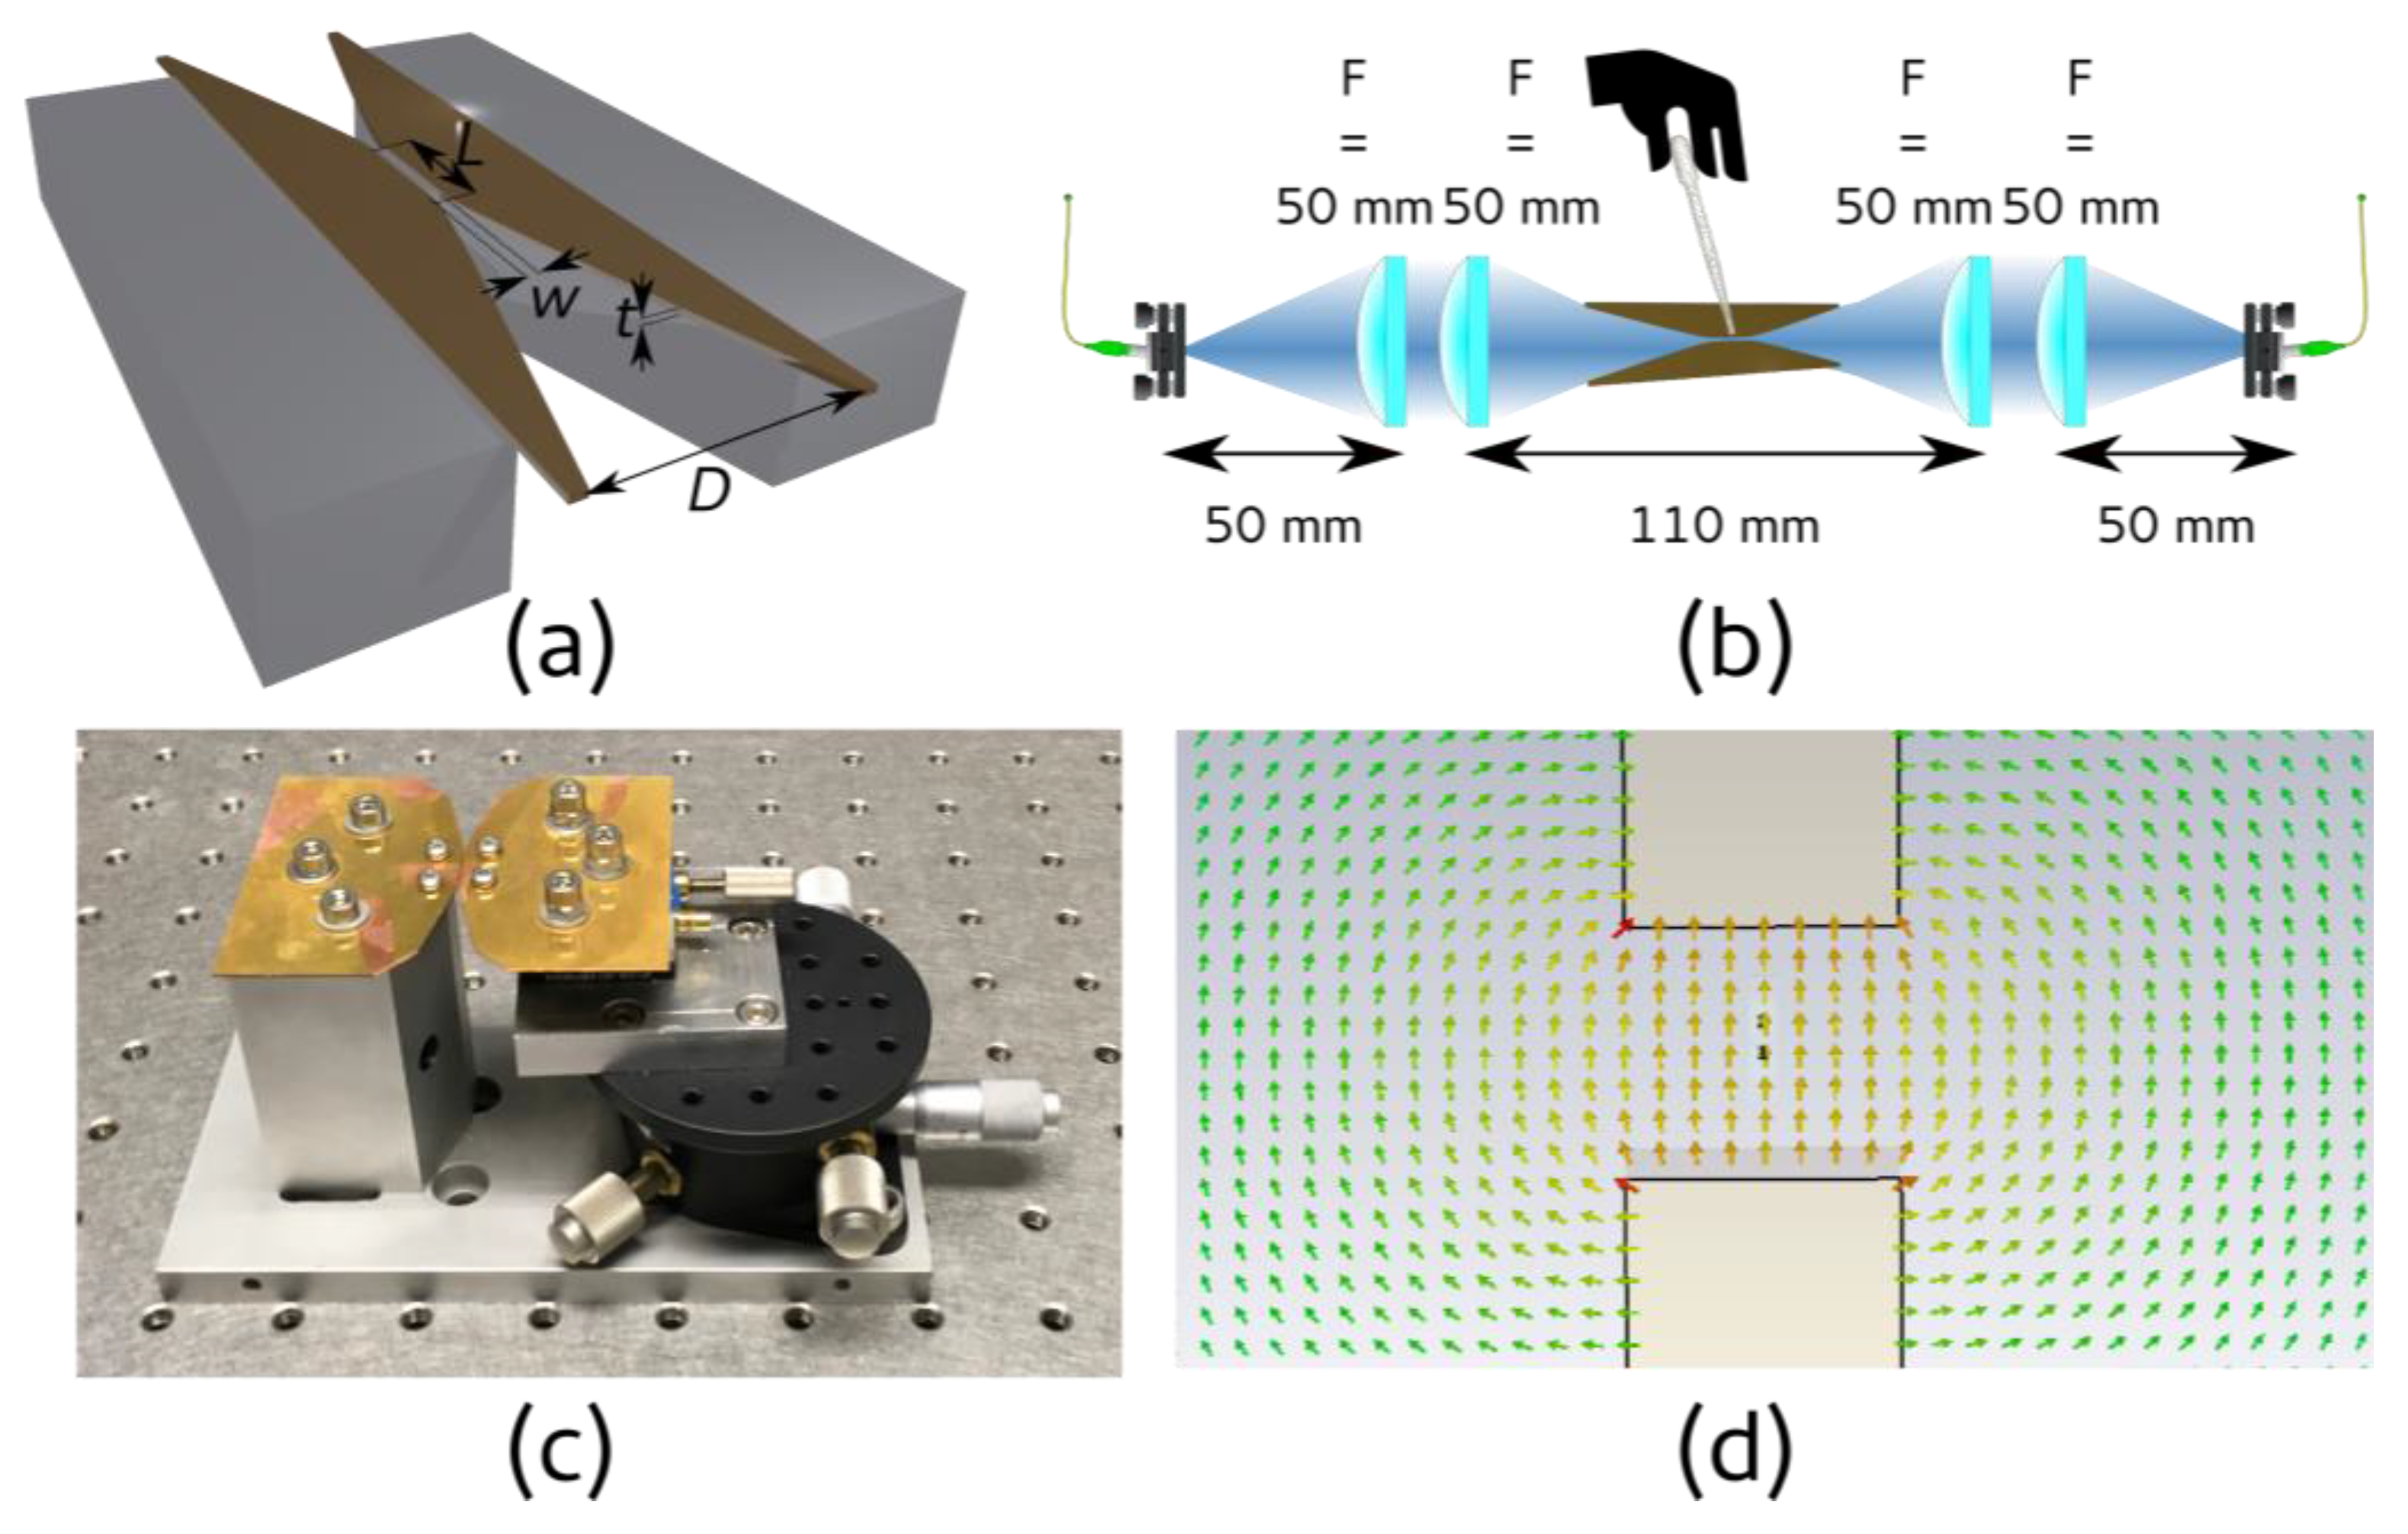
There are four requirements for the butterfly device. (1) The hollow guiding part, where occurs THz light confinement and subsequent light matter interaction enhancement should be long enough (several mm, meaning several tens of wavelengths); (2) The hollow part has to remain accessible from the outside in order to fill the slot with an analyte; (3) One has to be able to inject and to extract light from the waveguide using standard THz optical lenses or mirrors; Finally, (4) the device should not induce significant dispersion nor echo pulses resulting from any reflection.
Translating these requirements in components gives: (1) & (2)—we need a waveguide with a cross section at the wavelength scale, which is not closed. (3) & (4)—we need non-dispersive and matched antennas for injection and for extraction of the THz pulse. We decided to use a planar design to fulfill (2) & (3), and to fulfill (4), we limit our toolbox to the use of the transverse electromagnetic mode of a metallic quasi-coplanar waveguide. Thus, we decided to use a device made of three components: an injection exponentially tapered antenna (ETA) [
17], a TSLW [
18], and an extraction exponentially tapered antenna making the ‘butterfly’ structure shown in
Figure 1.
Indeed, the TSLW can be seen as the intermediate topology between the parallel plate waveguide [
19,
20] and the slot line waveguide [
18]. In the case of the absence of any substrate, both are known to support a TEM mode, and thus have small dispersion [
21,
22], even up to optical wavelengths [
23].
We chose the thickness, t, of the TSLW (and the metallic plate) to be 500 µm, thick enough to insert a sample in and thin enough to confine the THz field, and we kept the width, w, variable by installing one of the wings of the butterfly on top of a micrometer displacement stage. We choose the length L to be 10 mm, which is a relatively large value for THz solid-state sample but will allow the evaluation of losses in the butterfly device.
The exponentially tapered antenna [
17] was chosen to avoid reflections at the guide/antenna interface by keeping a continuous curve with continuous derivative giving a shape following the parametric equation:
where
is set to keep the curve derivative continuous at the interface with the waveguide (
α and
β are the two parameters for the exponential). More concretely,
α is a length depicting how fast the exponential will end up following its asymptotic linear curve, and subsequently,
β is defined through the opening angle
. In other words, the higher
α is, the smoother and longer the exponential region is. Consequently, it will introduce uncertainty on the actual length of the waveguide. Additionally,
gives the opening angle of the antenna away from the waveguide. We fixed
α to 10 µm and
β to 30 µm. This curve is repeated 4 times following the
x and
y symmetry of the butterfly.
For validation, we performed electromagnetic, time-domain simulations using CST software [
24].
2.2. Waveguide Simulation
As stated before, the TSLW lies between the parallel plate’s waveguide and the slot line waveguide. In the first case, the plates are the vertical sidewalls of the wings and in the second case, the slot is the void between the wings. Since we aim at using a low dispersion mode, we will focus on the transverse electromagnetic (TEM) mode. We used a lossy metal with the DC conductivity of copper for the metallic parts. The losses are a combination of the ohmic losses in the parallel plate’s waveguide [
19]:
with additional losses due to the finite thickness of the waveguide.
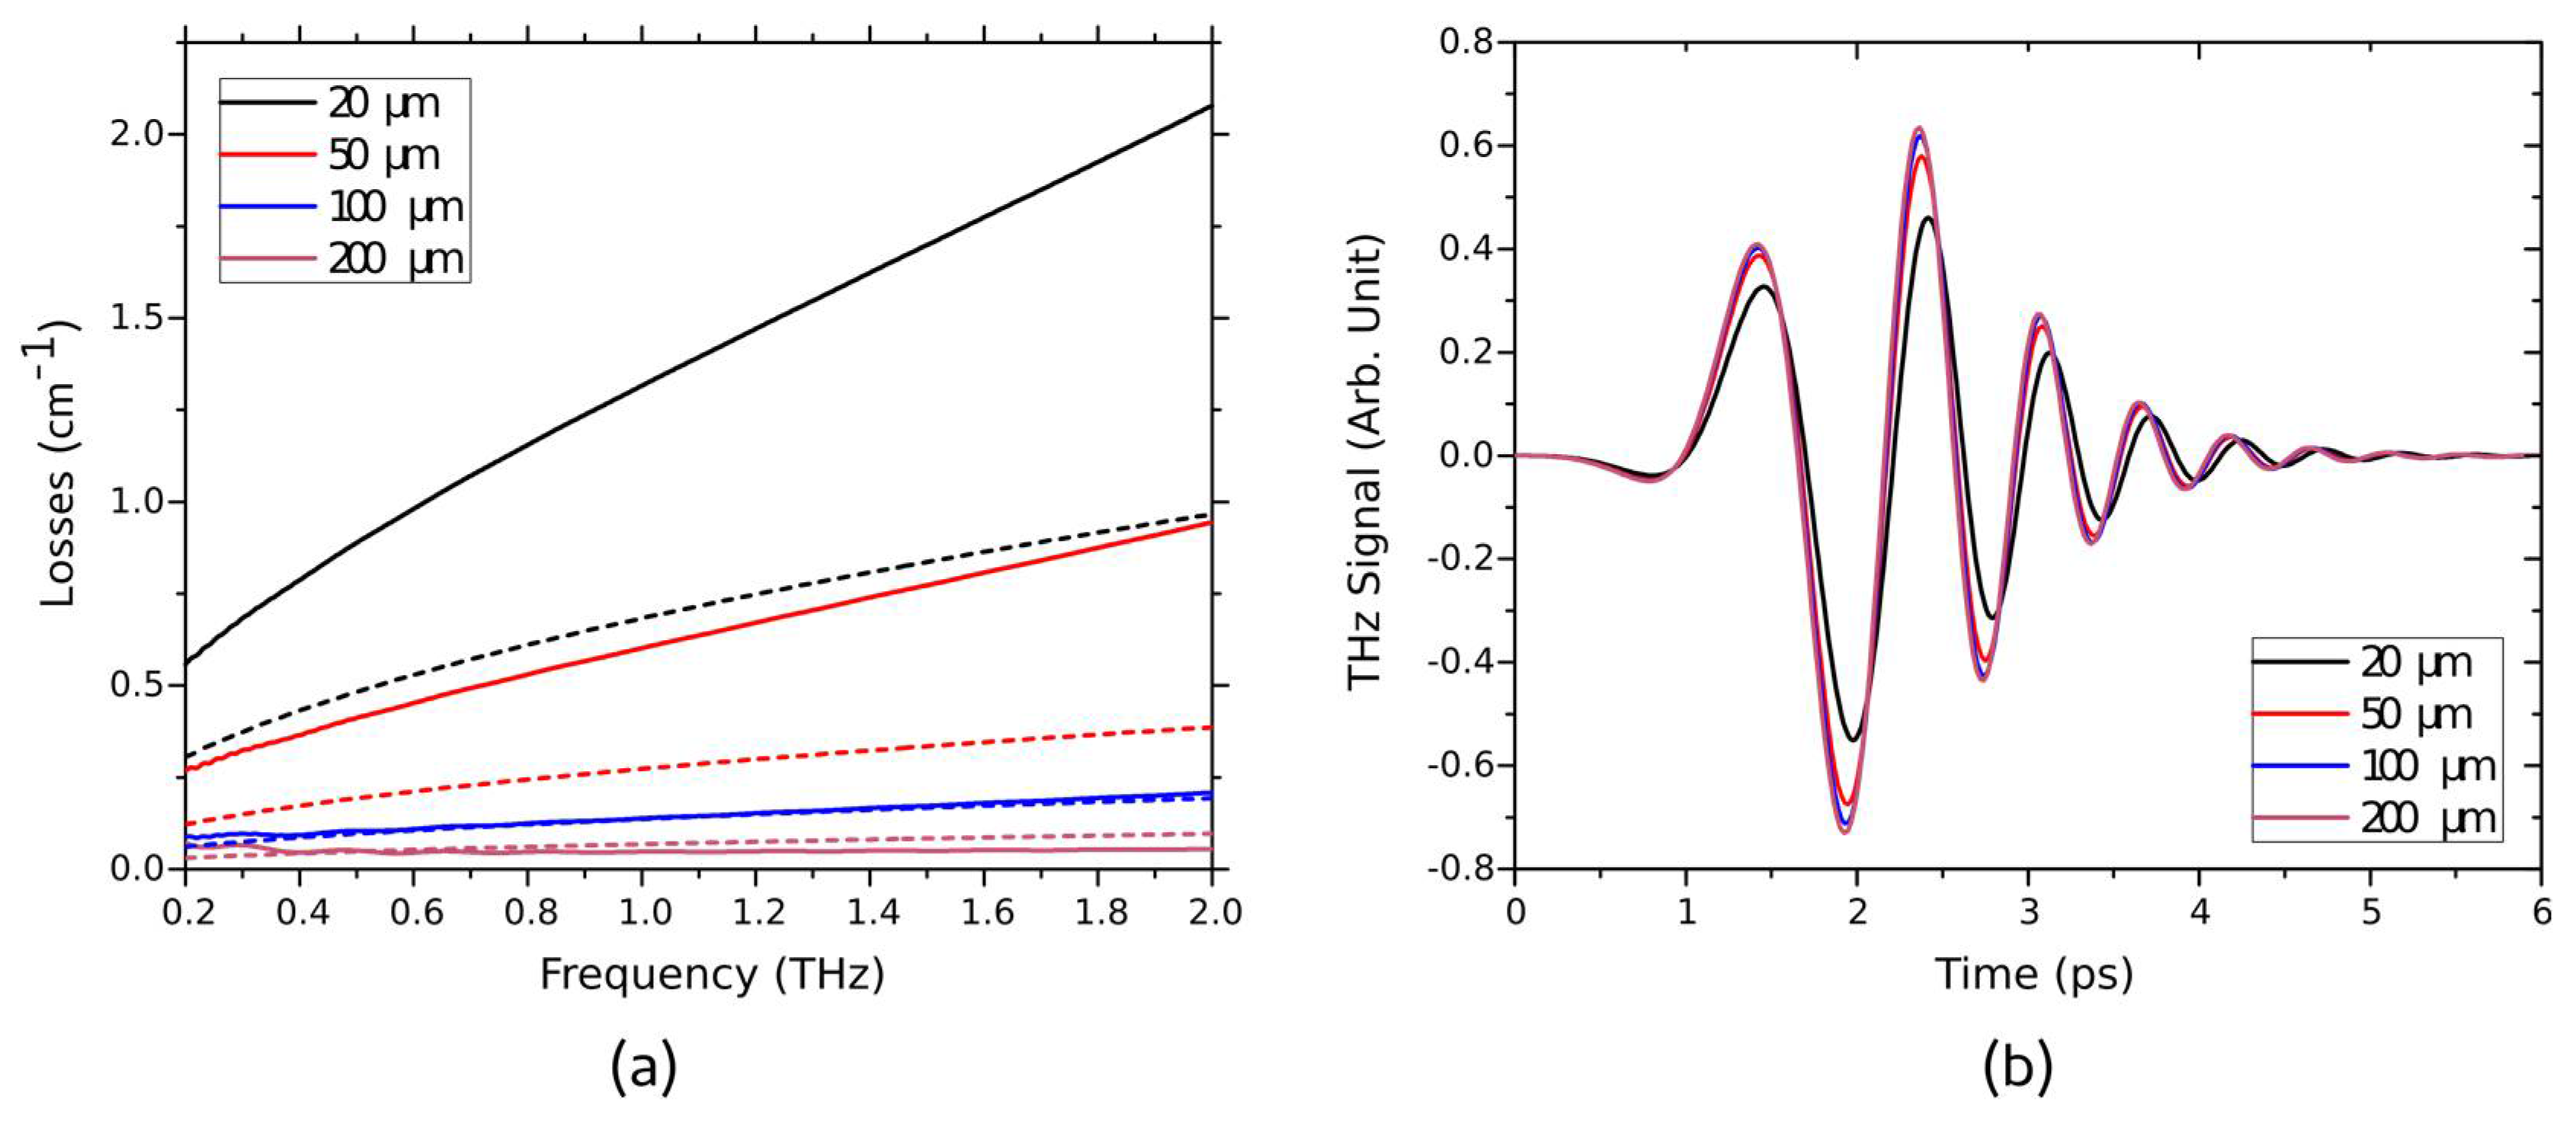
As presented in
Figure 2, the losses are inversely proportional to the width of the waveguide. First, we wanted to check if the losses originate from ohmic or radiative sources. For this purpose, we performed the same simulation with a perfect electrical conductor (PEC) instead of copper. The result did not show any losses. Thus, we can conclude that these losses originate from ohmic losses from the metal. Then, one can see a discrepancy between the theoretical parallel plate’s waveguide losses and the simulated ones. The simulated losses are about 2.25 times higher than the theoretical ones. We attributed these additional losses to the finite nature of the thickness of the metal resulting in a 2D confinement instead of 1D and thus a higher field concentration. One can similarly observe these losses in the time-domain data (after 5–mm waveguide). In addition, these data show negligible dispersion (the pulse is not broadened). These simulations confirm the choice made for the waveguide regarding our goal.
2.3. Antenna Simulation
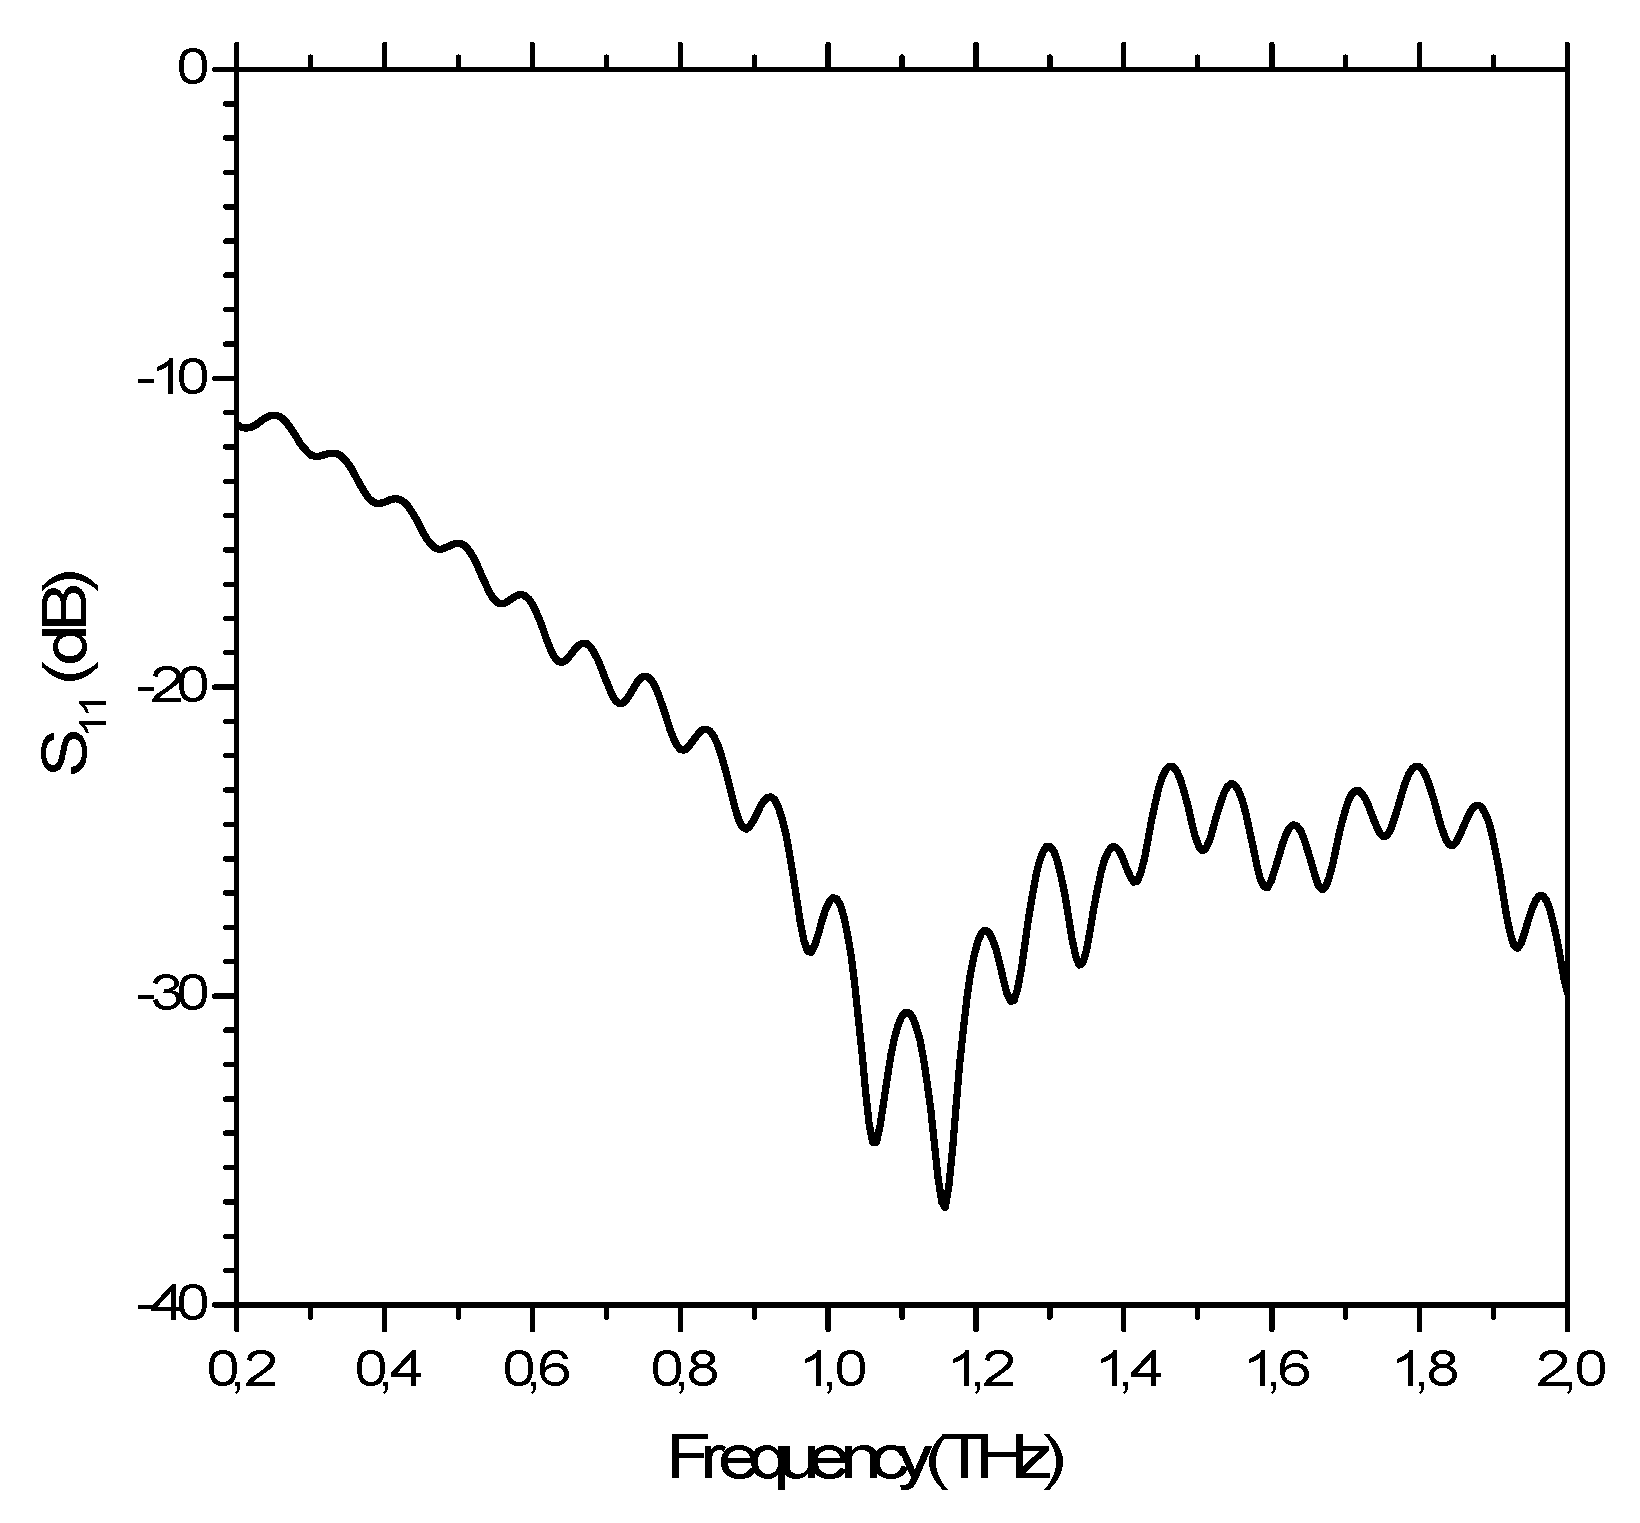
Further, as the waveguide fulfills our requirements, we have to couple it to the free space using an antenna. The additional constraints of being lowly dispersive, broadband, and planar lead to our choice of antenna presented above. The two main questions on the characteristics of the antenna in the butterfly are how the antenna will couple the THz-light into the waveguide and how the antenna will couple back the light into the free space. Thus, we looked over the reflection (S
11 parameter of the dominant mode) and the far field pattern of a 1-mm-long and 20-µm-wide waveguide followed by a TSLW with the above-mentioned parameters and opening value D = 500 µm (see
Figure 1). This value for D is rather small but we cannot perform simulations for larger D due to the amount of memory needed. Still, these simulations allow us to understand the behavior of the antenna and to draw the main conclusions.
Figure 3 shows two different behaviors depending on the frequency range. At low frequencies (below 1.2 THz), S
11 experiences exponential decay. We interpret it as a reflection at the edge of the simulated antenna (D = 500 µm). At the higher frequencies, the S
11 does not continue to decrease. We attribute this effect to the simulation limitation. On top of the two above-mentioned effects, a Fabry–Perot effect induces a modulation. The reflection value at low frequencies is too high for our requirements. However, the value at high frequencies is fully compatible. This means that for the simulated size of the antenna (D = 500 µm), an important part of the spectrum could not be used. However, since this value of D is only limited by the memory needed in the simulations and since all the simulations are scalable, we found this frequency cut-off value to be around 12 GHz for D = 5 cm.
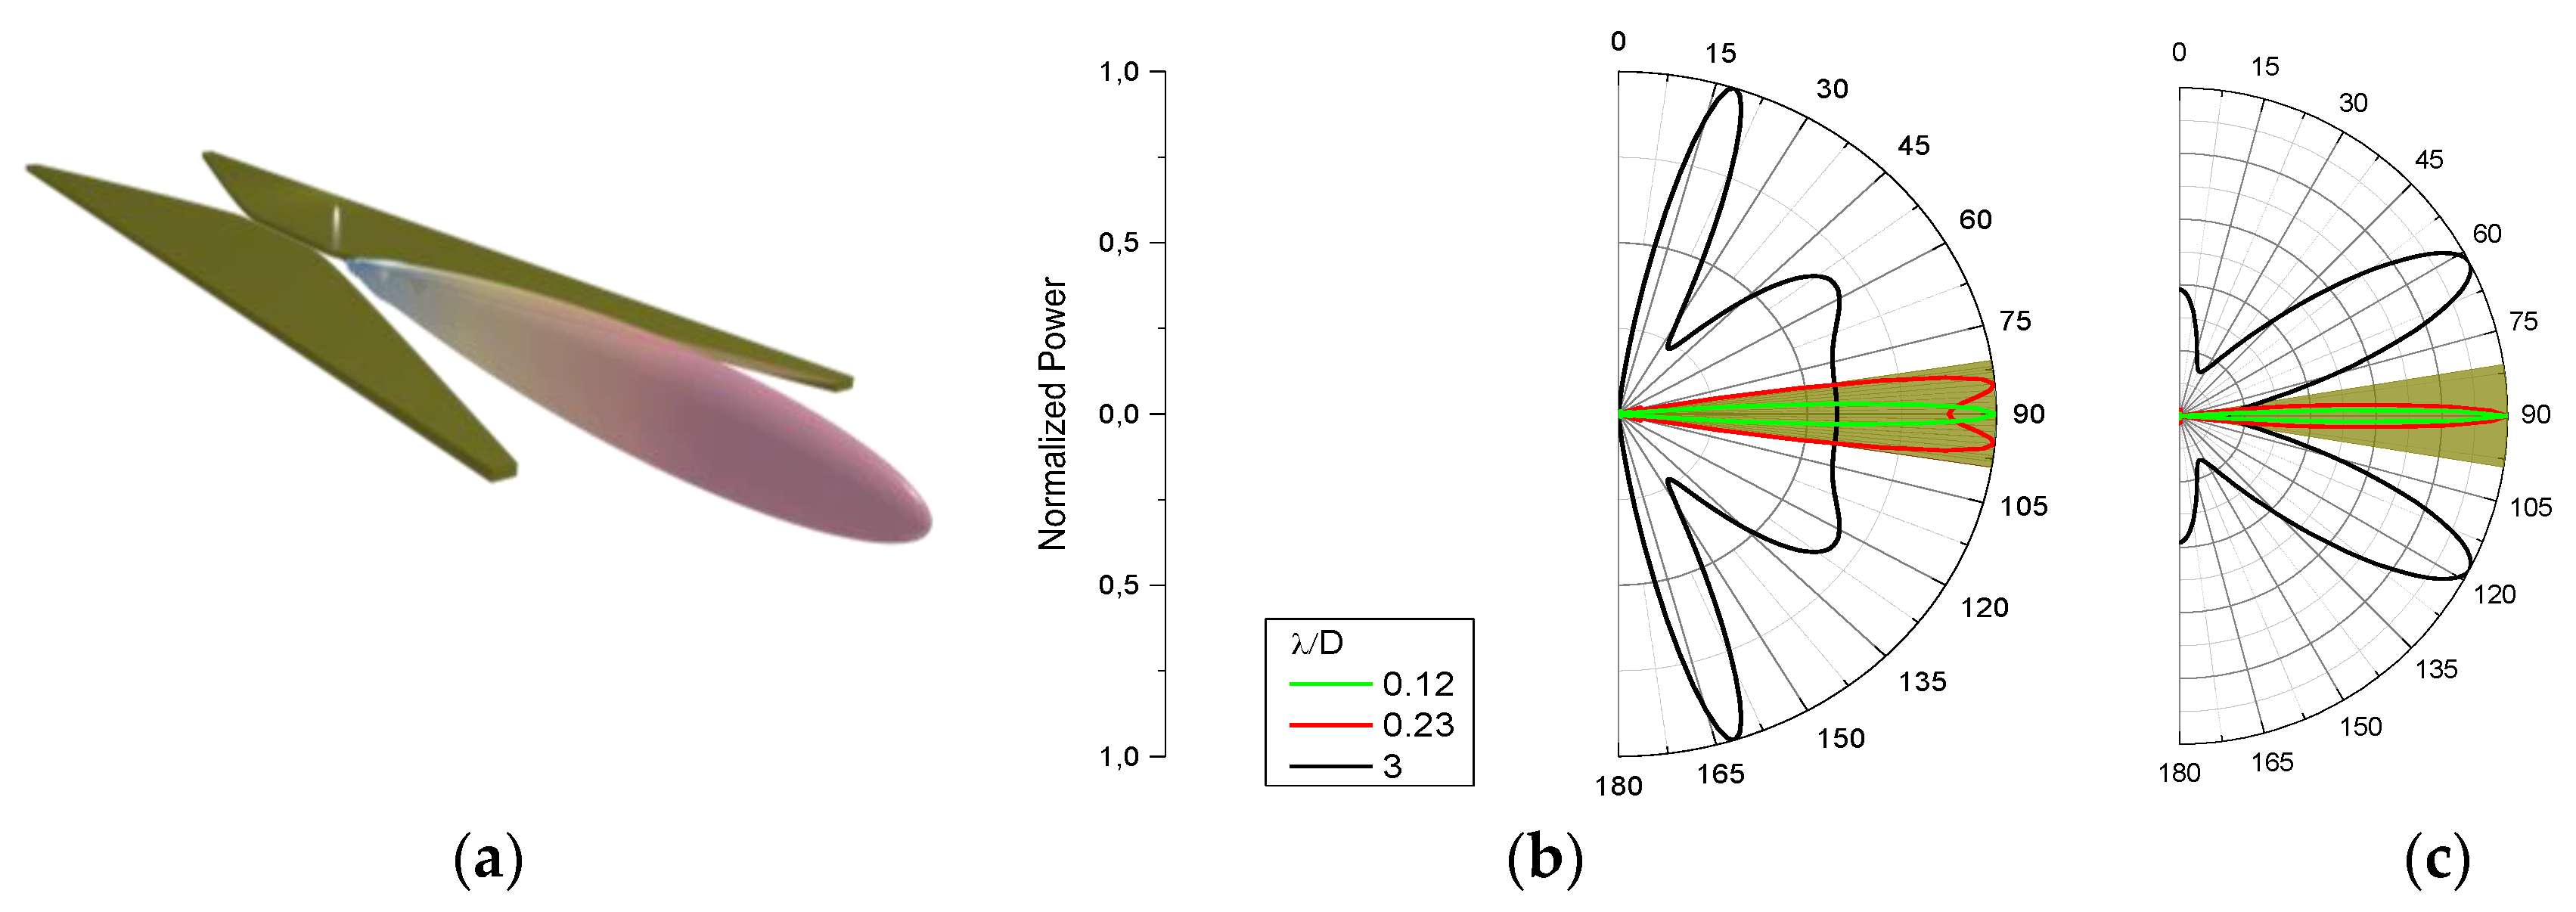
To go a step further, we computed the far field of the described antenna. Due to the memory limitation, the ratio between the aperture D and the wavelength was limited to 8, which is small if compared to the realization (the ratio is between 30 and 300). The simulated far field radiation patterns are presented in
Figure 4. It is important to notice that the width of the waveguide does not change the far field pattern since we couple only to the mode of interest.
First, one can see in
Figure 4a that the radiation pattern has a single main lobe pointing along the waveguide axis. To be quantitative,
Figure 4b,c shows two sections of the radiation pattern, respectively the E-plane and the H-plane. These two figures show that at a very low frequency (
λ > D), the radiation pattern is too wide and has several lobes, making it unusable. However, for the higher frequency (
λ < D) the radiation pattern is more directive and corresponds to the needs. More precisely, the 3 dB half beamwidth for
λ = 0.12D is 3° in the E-plane and 2° in the H-plane which is not perfectly axisymmetric, but still usable for our application. It has to be empathized that the radiation pattern does not change with the waveguide width.
We decided to fabricate the butterfly with the following parameters: t = 500 µm, D = 50 mm, and L = 10 mm. This gives a λ = 0.12D frequency around 50 GHz which is far below the lower frequency of our TDS system (200 GHz), meaning that the full pulse spectrum will be inside the butterfly bandwidth.
4. Characterization
To characterize the device, we performed TDS experiments using a Terasmart system from Menlo Systems GmbH [
29]. We used a four-lens (f = 50 mm, TPX lenses of 37.5 mm diameter) symmetric optical set-up as shown in
Figure 1b. The second lens is used to inject the THz pulse inside the gap of the butterfly waveguide; the third one is to collect the THz pulse from the butterfly. First, we aligned the system without any sample or device between the lenses. Then, to compensate the propagation in the waveguide part, the collecting lens was moved 10 mm toward the detector and finally its position was optimized to get the highest signal. Finally, we aligned the butterfly in order to have the focal plane of the lenses at the entrance and at the exit of the waveguide. The whole system is set in a plastic box flowed by dry nitrogen to avoid parasitic water vapor lines. The raw results are presented in
Figure 6.
From these results, one can see a small delay (~0.5 ps) between the pulses traveling through the butterfly and the reference set-up. This delay corresponds to 0.15 mm which is below the precision of the lenses’ positioning. Additionally, the injection/extraction into the butterfly is shown to be efficient since for low frequencies (below 0.7 THz), the compensation of the diffraction overcomes the losses and thus the signal is more important for high values of w than for the reference. Thus, we estimated the coupling efficiency to be close to unity. To ensure that the measured signal is actually going through the waveguide of the butterfly, we soaked the waveguide with isopropanol, making a meniscus between the two wings (see the curve denoted ISO in the figures). This shows that most (>90% for 31 µm and >98% for 215 µm) of the energy is going through the waveguide, especially for the higher frequencies, as one can see on the spectrum (>40 dB). Still, a parasitic pulse that does not interact with isopropanol is observed.
4.1. Losses and Dispersion
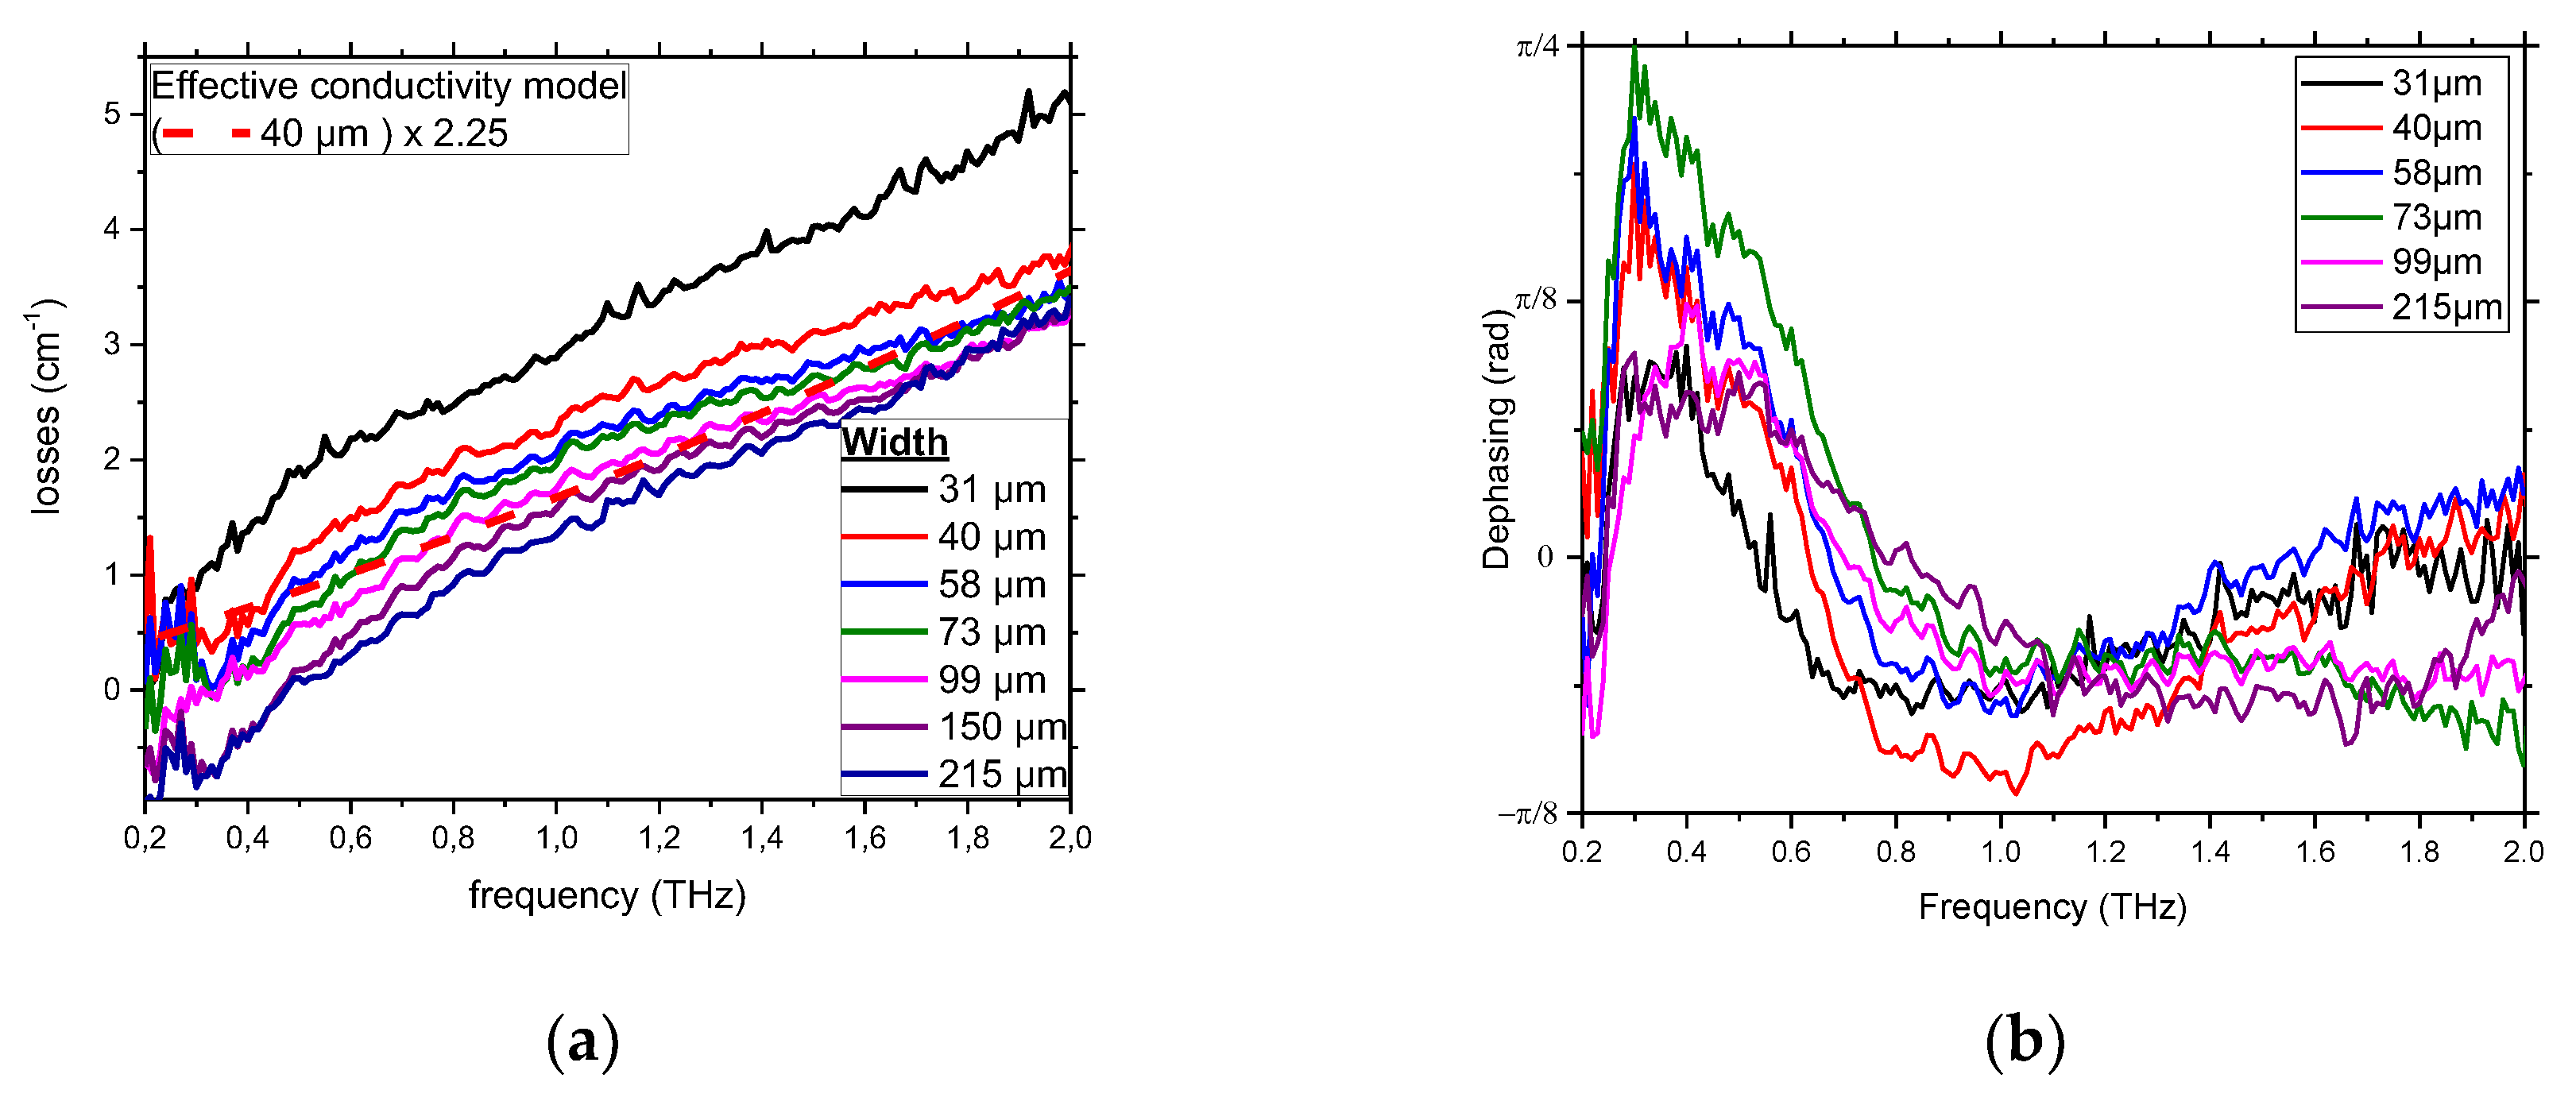
To analyze the butterfly device further, we calculated the power losses and the dispersion (phase difference with the reference removing the linear term representing the small delay), and the results are shown in
Figure 7.
As stated previously, the compensation of diffraction increases the signal at lower frequencies, resulting in artificial negative losses. This effect vanishes at frequencies higher than 700 GHz. Thus, the actual losses account for few inverse centimeters, increasing with frequency and decreasing with w. The losses shape matches the computed curve, as shown in
Figure 2. The losses are about four times higher than in the simulations. This factor is typical in the THz range [
30]. To analyze the additional losses, we computed an effective conductivity with the first order term from Ref. [
31,
32].
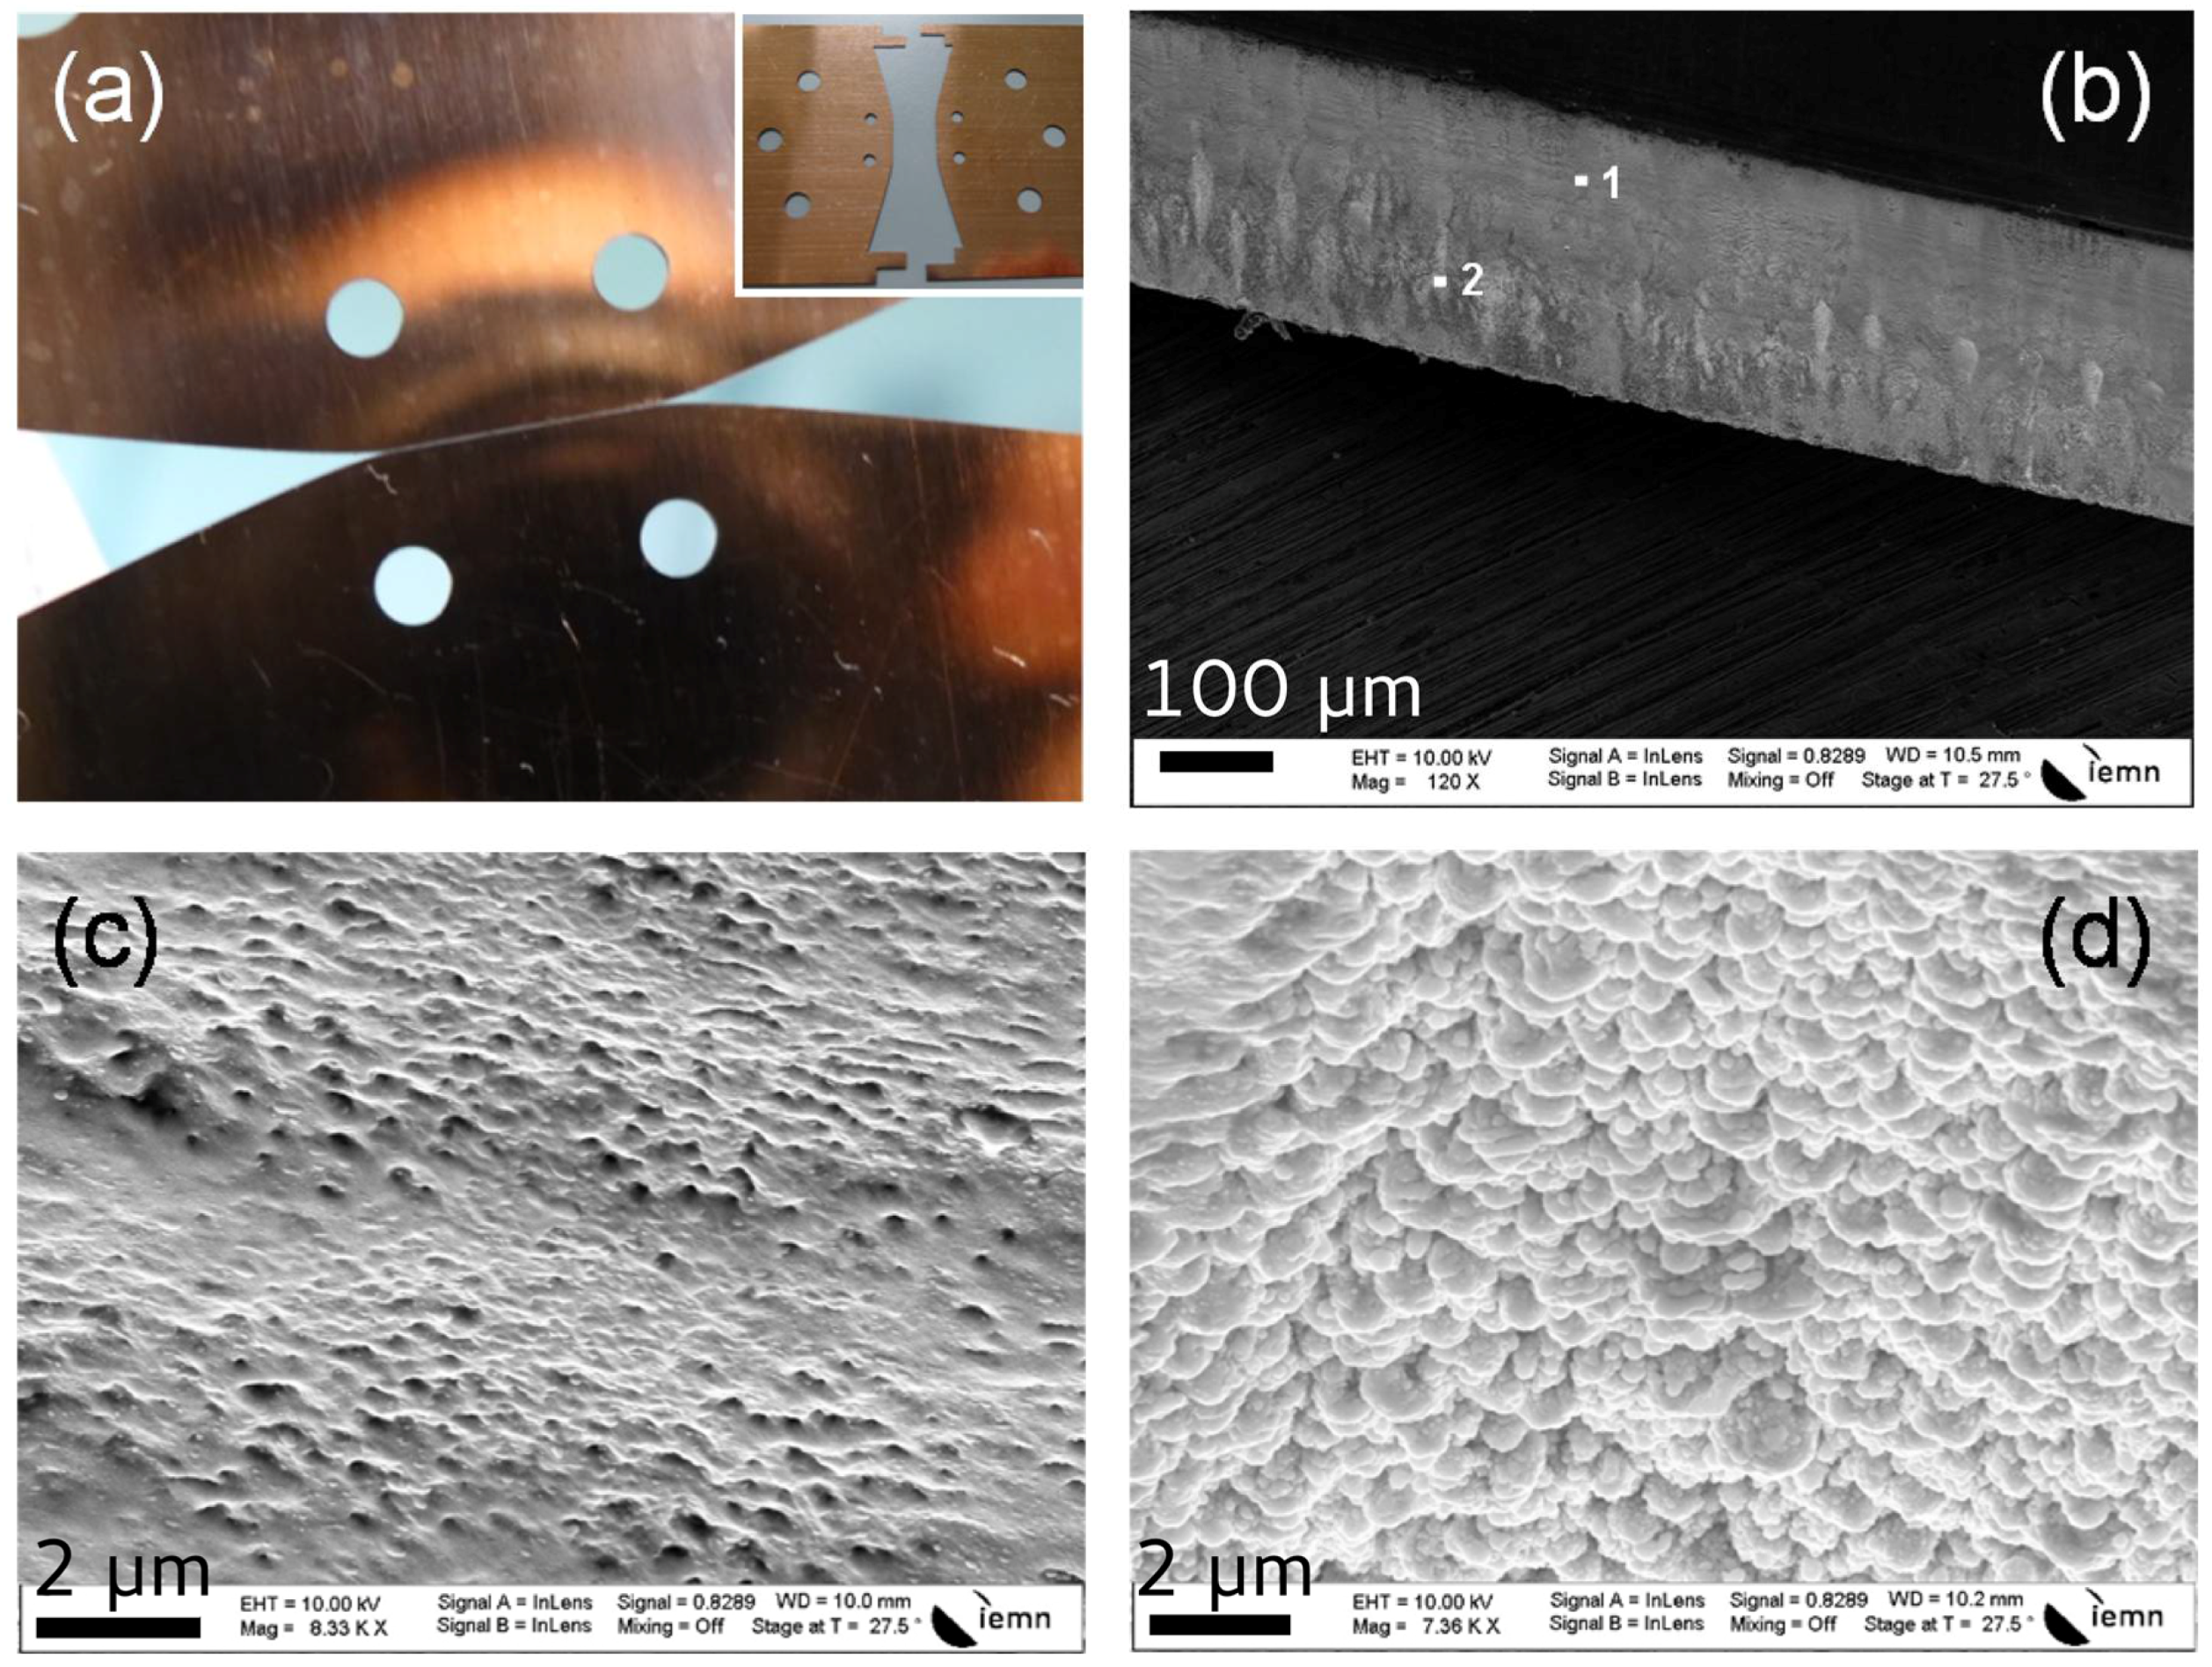
is the skin depth and varies with frequency (<100 nm@1 THz) and
R is the typical roughness RMS. We estimated this roughness RMS to be around 50 nm from the SEM picture of
Figure 5. We plot this term times 2.25 to take into account the additional losses due to the waveguide geometry in
Figure 7 for w = 40 µm. Here, one can see a good agreement with the experimental data, especially considering the fact that the value taken for
R is only an order of magnitude of the RMS. The dispersion is relatively low in the whole spectrum (below π/4). Still, the curves show a bump at low frequencies (below 0.7 THz). We attributed this small change to the same effect of diffraction. This effect was already observed in similar structures [
11]. It is clear from the temporal data that the dispersion is bearable and thus easily reaches the specifications for TDS.
4.2. Benchmarking
Since our primary goal is to precisely measure thin film samples, we benchmarked the butterfly by introducing a 50-µm-thick Kapton
® film into the gap. We made this choice due to the highly calibrated thickness and because the refractive index of Kapton has already been carefully measured [
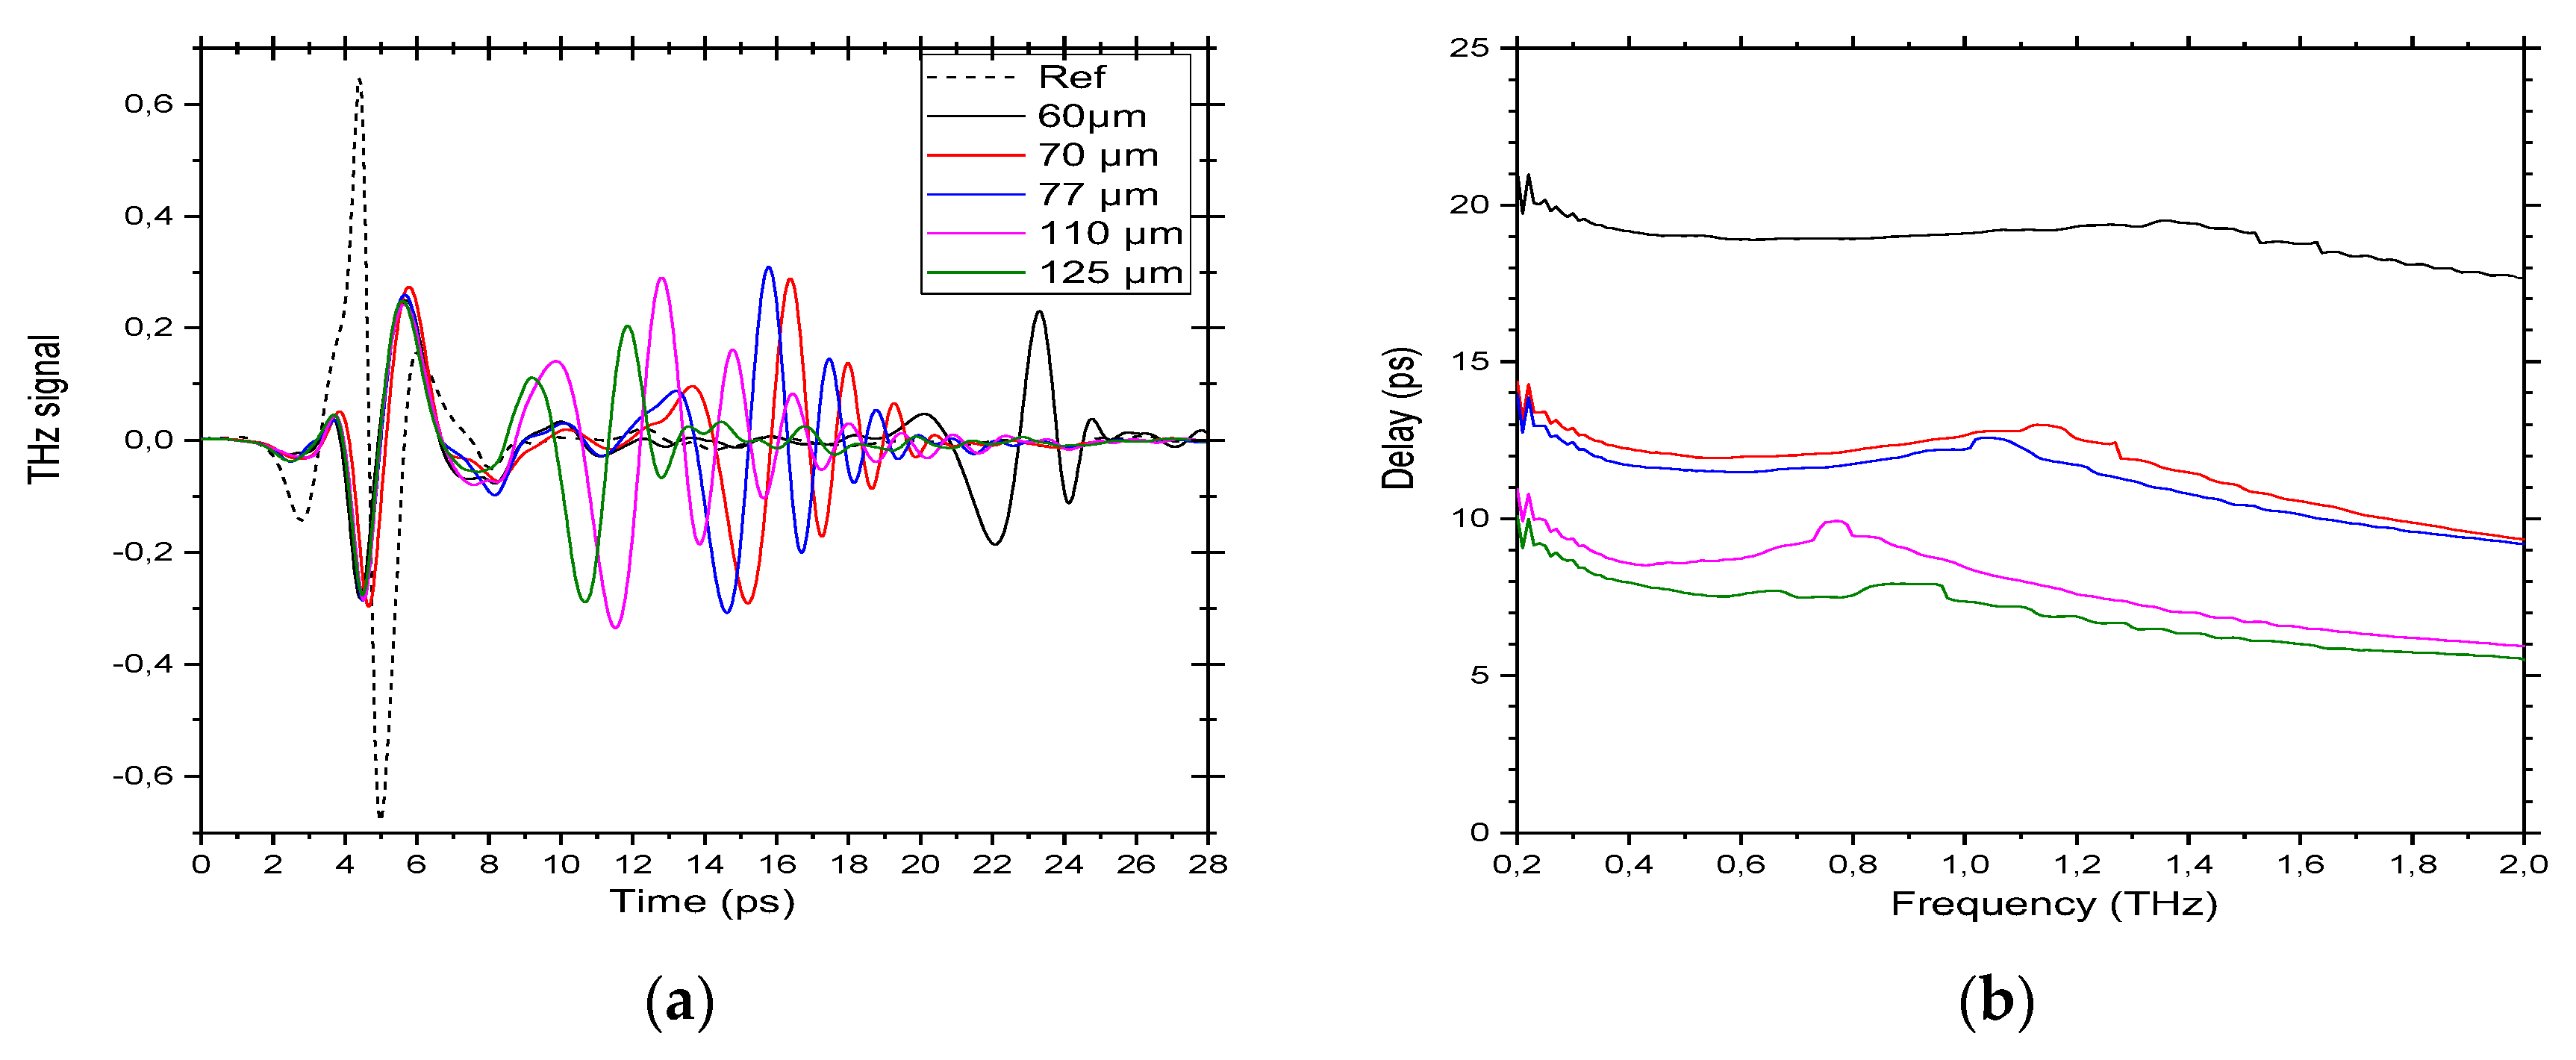
33]. The film was inserted and held from the bottom when the guide was widely open. We then closed the gap to the wanted width. The results of the TDS study are shown in
Figure 8.
First, one can see from the TDS results (
Figure 8a) that the pulse is delayed when interacting with Kapton
®. However, a parasitic pulse appears exactly at the same time as the reference pulse. As explained above (see
Section 4.1), this corresponds to the parasitic part of the beam that does not travel through the slot. Then, it is clear from the Figure that the wider the slot, the smaller the delay is, and this is simply due to the effective index effect in the waveguide. To be quantitative, we extracted the delay (
Figure 8b) by taking the dephasing of the delayed pulse (by time-domain filtering of the parasitic pulse) and divided by the frequency. The results show a very little dispersion, only a small kink in the middle of the band. Since this kink is around a frequency corresponding to the
λ/2 for the corresponding thickness, we attributed this kink to the appearance of the first higher order mode [
34].
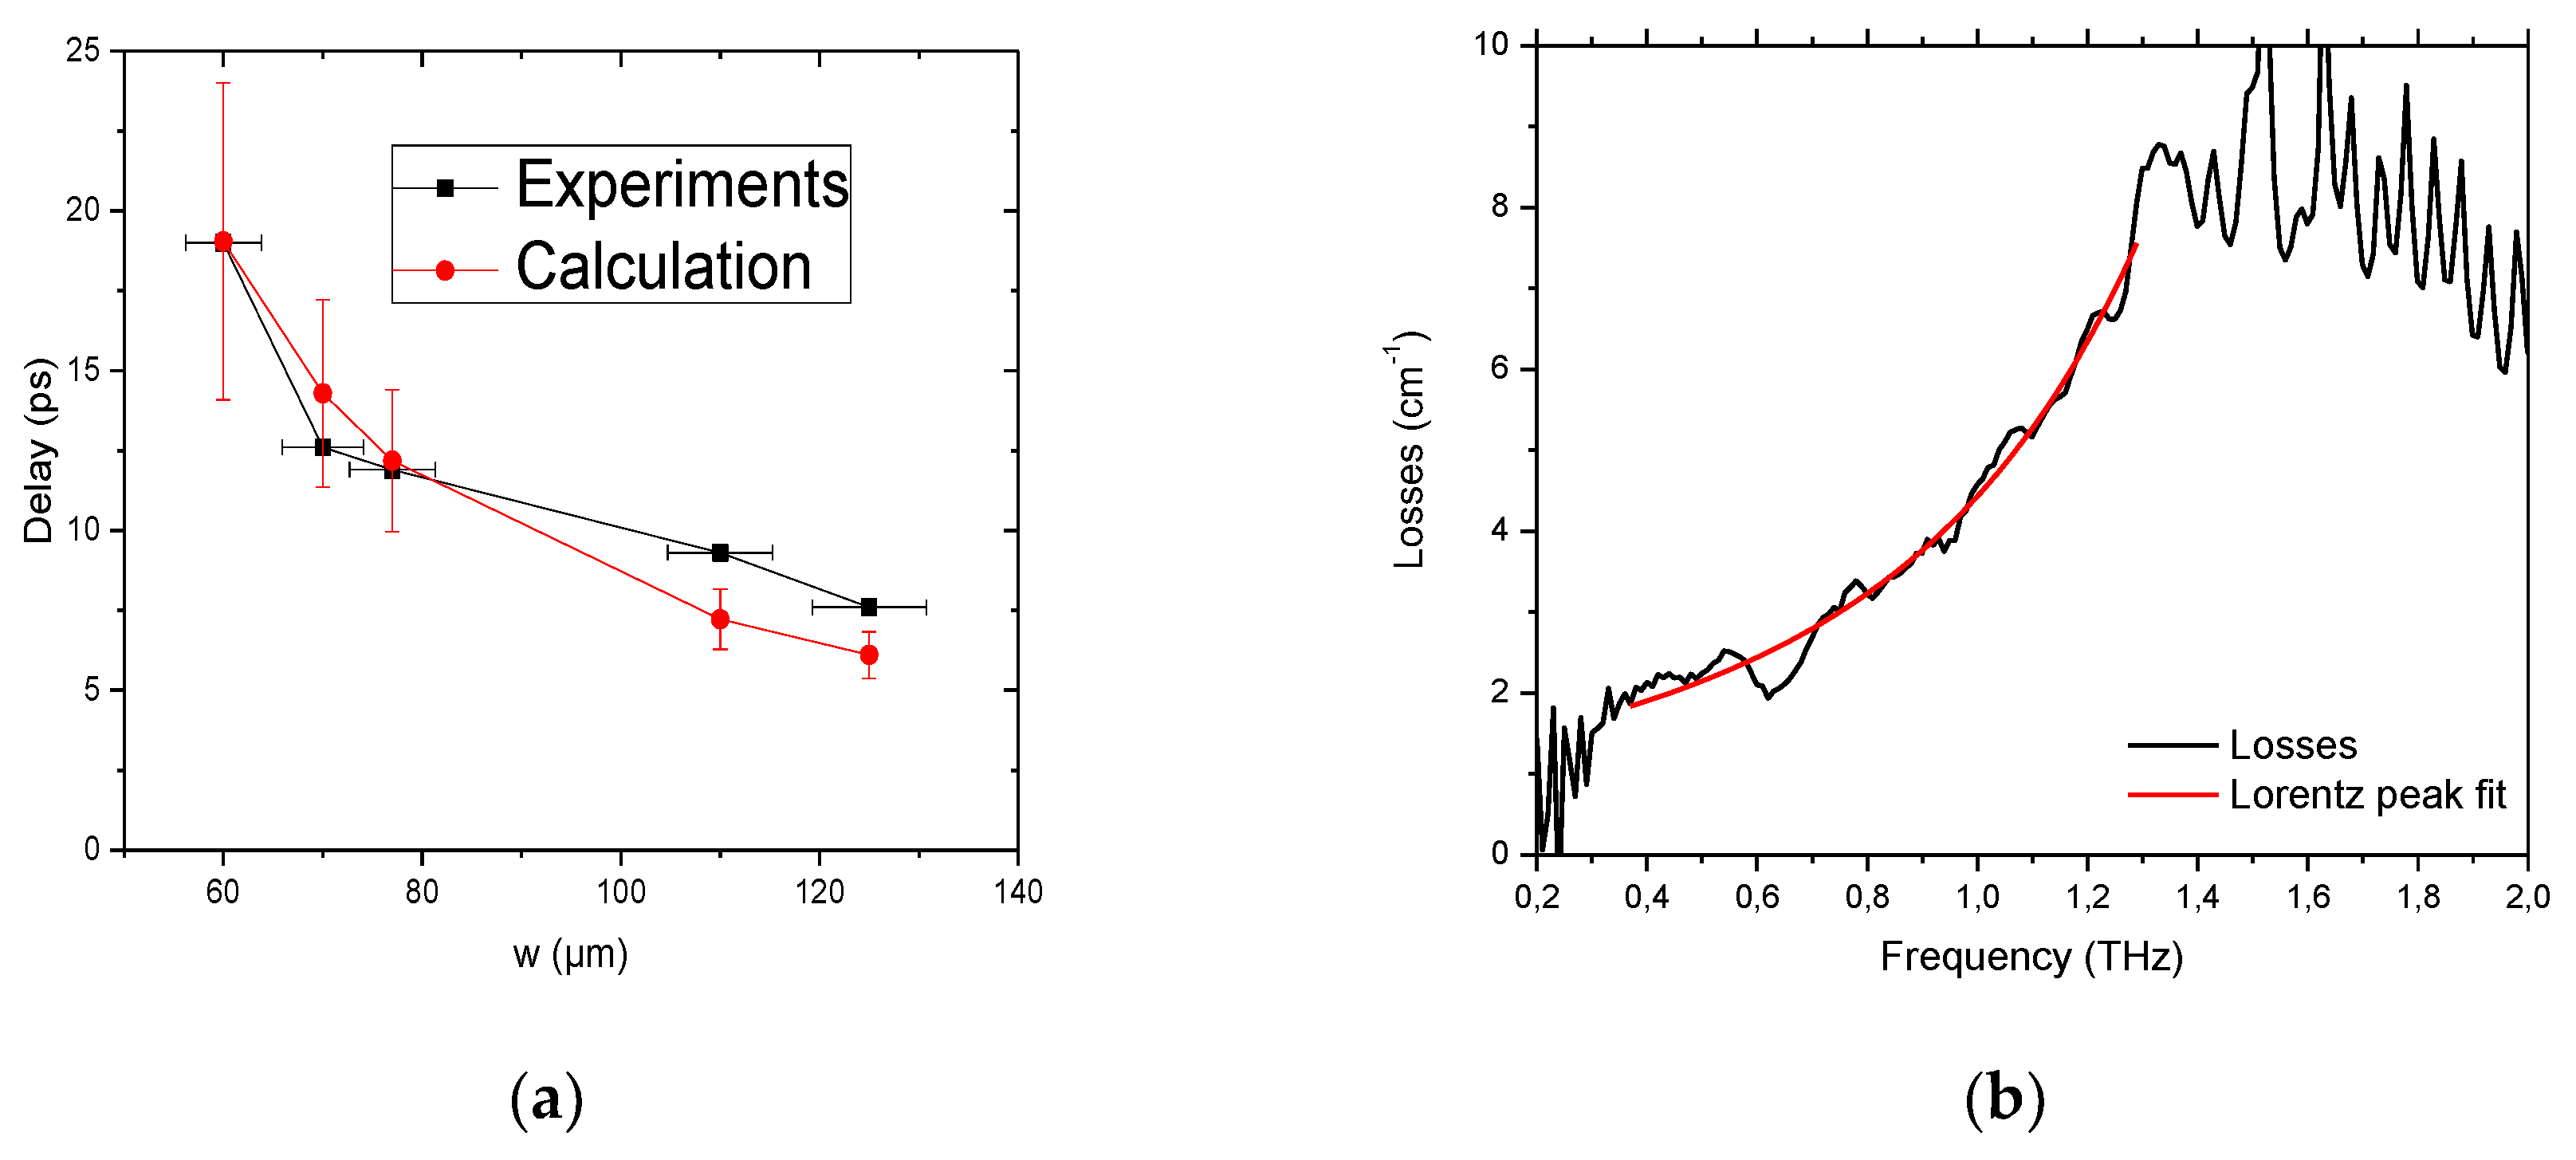
To confirm our interpretation, we calculated the delay from an effective refractive index model. Considering the capacitor-like geometry, the effective refractive index is calculated as:
The results of the calculation are compared to the experimental measurements in the
Figure 9a. The w error-bars correspond to the uncertainty of the width measurements and the delay error-bars correspond to the propagation of the width’s uncertainty through the calculations.
This shows a good agreement confirming the interpretations; only the points for higher values of w are out of the error bars. We attribute this discrepancy to the fact that for lower delays, it was difficult to ensure proper time filtering since the delayed pulse is very close to the parasitic one. It has to be noticed that the length of the thin film was exactly the same as the waveguide. A smaller length will induce a proportional smaller delay. To go a step further towards our spectroscopy goals, we also show the losses for w = 60 µm in
Figure 9b. Since we are probing 10 mm-long and 50 µm-thick sample we were able to retrieve extremely low losses at the cm
−1 level where experiments from the literature were done on 125 µm or 250 µm thick Kapton
® thin film and this did not allow measurement of losses below 10 cm
−1. The sensitivity we reached allowed us to see the shape of the losses in the spectral range between 0.3 and 1.3 THz, showing a super-linear shape as is often the case. Since this shape could be due to scattering or to the tail of a higher frequency peak, we fitted four different functions (
f2,
f4, Gaussian, and Lorentzian bells) and the best fit was obtained for the Lorentz curve centered at 1.95 THz with width of 0.95 THz and height of 22 cm
−1. These results are fully compatible with the ones in Ref. [
33] and shows that low absorption peaks can be measured in a thin-film. To conclude the experiments with Kapton
®, the butterfly device enables 1 cm-length interaction with a 50 µm-thick thin-film sample. As a result, we confirmed the refractive index published in Ref. [
33] (1.85 ± 0.5). In addition, we were able to more precisely measure the absorption in the spectral range between 0.3 THz and 1.3 THz, demonstrating the capacity of the butterfly device to measure small absorption features on a thin-film sample.
4.3. Test with Lactose
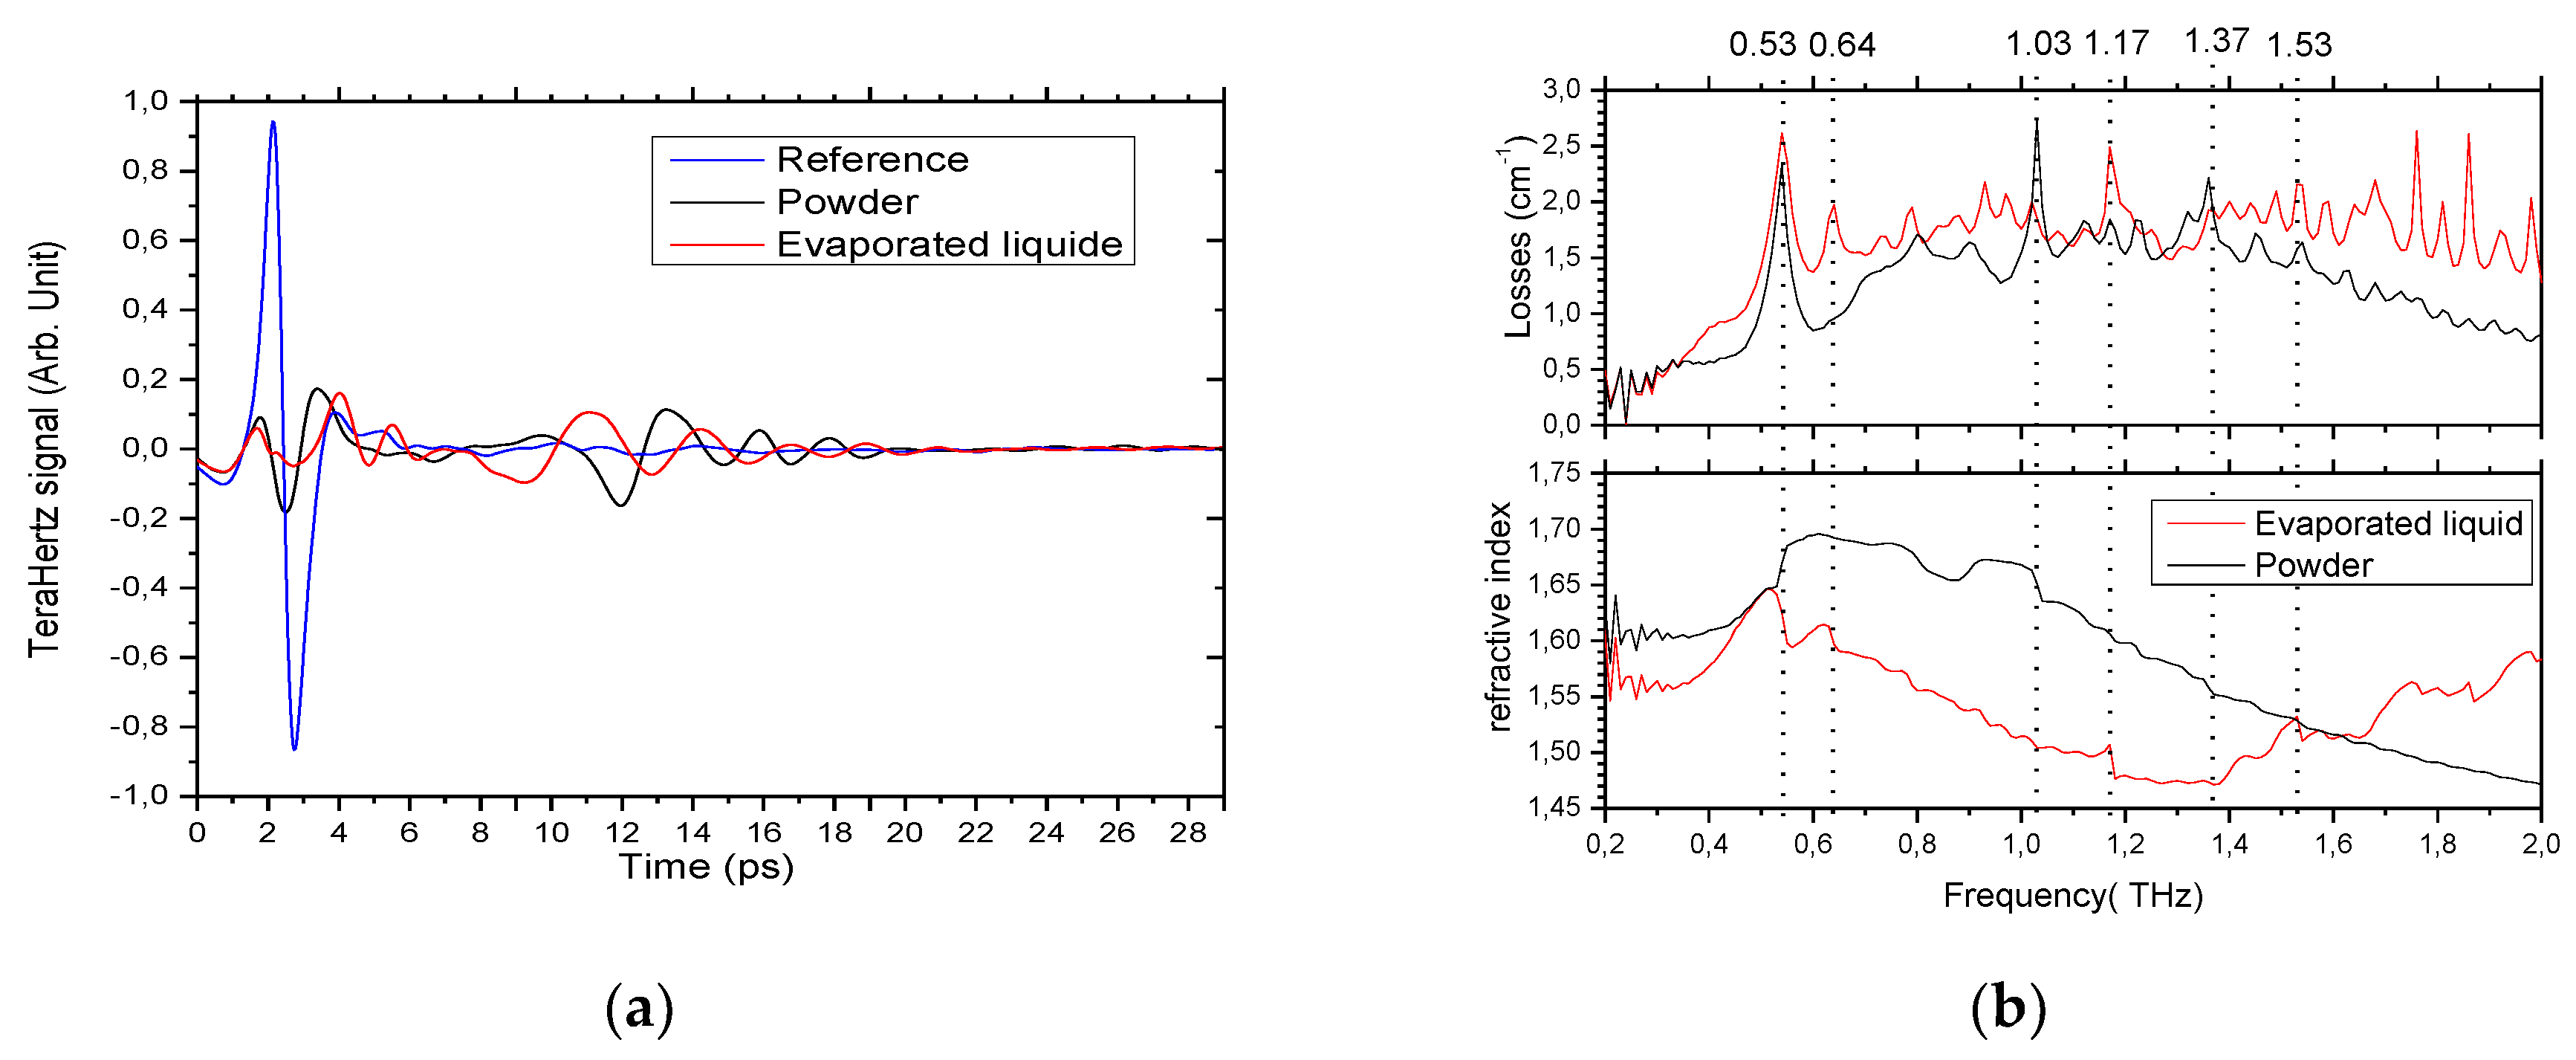
In order to show the full capabilities of the butterfly, especially regarding biosamples, we performed THz spectroscopy of alpha-lactose monohydrate obtained from Sigma-Aldrich. This was done in two steps; (1) on a powder sample and (2) on an evaporated lactose solution. For the powder sample, the slot was open at w = 150 µm. This gives a volume of 150 µm × 500 µm × 10 mm = 0.75 µL. We simply filled the slot of the butterfly with the purchased powder (volume <1 µL and a measured mass <200 µg) by inserting the powder from the top of the device. The powder stayed in the slot of the waveguide thanks to agglomeration and edge surface effects. For the evaporated liquid sample, we made a saturated solution of lactose in deionized water (200 g/L). Then, we filled from the top the slot of the butterfly using a 10 µL micropipette and let it dry. The residue inside the slot corresponds to a mass below 2 mg (estimated as ~200 µg since most of the lactose remained on top of the wings of the butterfly). The time traces and spectrum we obtained are presented in
Figure 10.
First, one can see that for the powder and evaporated liquid experiments, a delayed and broadened pulse (damped oscillation) was recorded. This dampened pulse is a signature for spectroscopic lines since it corresponds to the Fourier transform of a Lorentz bell curve (or a sum of Lorentz bell curves). This means we are able to retrieve not only the refractive index with the delay, but also the absorption lines from the sample. In addition, similarly to the Kapton
® experiments, a parasitic pulse that did not travel through the sample was recorded (around 2 ps). Thus, to avoid any fake interference effects, we removed the entire signal before 6 ps, before performing the Fourier transform, only keeping the actual data from the sample. From the spectrum, we extracted the effective refractive index and the losses (
Figure 10b). One can note that the effective refractive index found is slightly below the published one [
33]. This is because the slot is not fully filled with lactose. In addition, six peaks with corresponding resonances in the refractive index are pointed out using the dotted lines at 0.53, 0.64, 1.03, 1.17, 1.37, and 1.53 THz. From these peaks, the one at 0.64 THz is seen only in the spectrum of the evaporated liquid sample and the one at 1.03 THz is only seen in the powder sample. The peaks at 0.53 THz [
10,
35], 1.17 THz [
36,
37], and 1.37 THz [
38,
39] are the characteristic absorption peaks of alpha lactose monohydrate. These results suggest that the peaks at 1.53 THz and at 1.03 THz may be due to effects other than absorption of the material. We explain those peaks as resonances coming from the scattering and random nature of the medium such as Mie or effects that are more complex. In fact, there are many other tiny peaks in the spectra, especially in the evaporated liquid one, which we interpreted as such. To conclude, the use of the butterfly allowed us to perform THz spectroscopy on a minute powder sample (<1 µL) and on an evaporated liquid sample (<10 µL of liquid) and we were able to obtain the spectral peaks recorded in the literature. However, we will need to repeat the experiments to find the difference between the absorption peaks and the Mie resonance peaks.
5. Conclusions
In this paper, we presented the design of a butterfly device made of two antennas and a slot waveguide with the goal to concentrate the light field from a TDS experiment in a small volume. To follow the specific constraints of being low-loss, low-dispersion, and to have the slot of the waveguide accessible, we used a 2D device fabricated by the laser cutting of copper plates. We then characterized the butterfly using TDS and showed that its properties fulfilled the requirements for spectroscopy of biosamples in the 0.2–2 THz range. Consequently, we performed broadband TDS of a 50 µm-thick Kapton® film to detect small absorption features up to 2 THz. Finally, we used the butterfly on simulated biosamples (lactose powder and lactose solution). In both cases, we measured the typical peak at 0.53 THz on a µL-scale sample. Still, several improvements or modifications are possible, such as changing the length of the waveguide or improving the parallelism to reach a waveguide width as thin as 10 µm. We think that the demonstrated performances of the butterfly device open the path to many future experiments on other biosamples such as proteins, DNA, RNA, or other macromolecules, and is therefore a step forward for THz biophotonic spectroscopy.


