Demonstration of an SDM Network Testbed for Joint Spatial Circuit and Packet Switching †

Photonic Network System Laboratory, National Institute of Information and Communication Technology, 4-2-1 Nukui Kitamachi, Koganei, 184-8795 Tokyo, Japan
*
Author to whom correspondence should be addressed.
†
This paper is an extended version of our paper published in Luis, R.S.; Furukawa, H.; Rademacher, G.; Puttnam, B.J.; Wada, N. Hybrid circuit and Packet Switching SDM Network Testbed Using Joint Spatial Switching and Multi-Core Fibers. In Proceedings of the 2017 European Conference on Optical Communication (ECOC), Gothenburg, Sweden, 17–21 September 2017; pp. 1–3.
Photonics 2018, 5(3), 20; https://doi.org/10.3390/photonics5030020
Submission received: 11 June 2018
/
Revised: 19 July 2018
/
Accepted: 26 July 2018
/
Published: 28 July 2018
(This article belongs to the Special Issue Lightwave Communications and Optical Networks)
Abstract
:We demonstrate a spatial division multiplexing (SDM) network testbed composed of three nodes connected via 19-core multi-core fibers. Each node is capable of joint spatial circuit switching and joint packet switching to support 10 Tb/s spatial circuit super channels and 1 Tb/s line rate spatial packet super channels. The performance of the proposed hybrid network is evaluated, showing successful co-existence of both systems in the same network to provide high capacity and high granularity services. Finally, we demonstrate an optical channel selection associated with the quality of service requirements on the SDM network testbed.
1. Introduction
Recent estimates have placed the global yearly growth of router capacities at an arguable 45% [1]. This has mainly been driven by the increase in demand for machine-to-machine communication, specifically inter-datacenter traffic [1]. The demand growth has not been followed by a corresponding growth of the capabilities of optical interfaces which are limited by the restrictions imposed by single-core fiber communications using wavelength division multiplexing (WDM) [1,2]. Spatial division multiplexing (SDM) systems have recently gathered significant attention due to their potential to support the increasing bandwidth demands of optical networks [1,3]. SDM systems are capable of multiplying the spectral efficiency of conventional optical communications systems by a factor approaching the number of available spatial channels [4]. However, the choice of an optimum transmission medium to support SDM networks is still under intense discussion. Uncoupled core multi-core fibers (MCF) and, in particular, homogeneous MCFs are often considered to be the most flexible media for the implementation of SDM networks [5]. This yields from the fact that optical signals carried by MCFs can be easily multiplexed and demultiplexed in the optical domain [2,5]. Furthermore, the signals in different cores propagate at similar group velocities, leading to small differences between the propagation delays of different cores, referred to here as inter-core skew (ICS). This enables the implementation of synchronous spatial super channels [3], which can be received with limited, yet non-negligible, buffering or guard time mechanisms [6]. In addition, the use of spatial optical switches may reduce the required switching resources in SDM reconfigurable optical add and drop multiplexers (ROADM) [2]. This comes at the cost of reduced granularity which may be well suited for long distance transmission networks [5]. In the case of metropolitan or even regional reach networks, granularity may be a stronger requirement [1].
This group has recently proposed the use of optical packet switching extended to the spatial domain [7]. Optical packet spatial super channels (pSSC) routed through spatial optical packet switches can provide high granularity through statistical multiplexing as well as high throughput provided by the spatial dimension. Nevertheless, as optical packet switching systems tend to be rather costly with regard to their circuit-switched counterparts, a full optical packet switched SDM network may be unfeasible. Hence, we have proposed hybrid networks, where pSSC co-exist with circuit spatial super channels (cSSC). This approach is particularly suited for SDM networks, since these systems can be easily separated in the spatial domain with some spatial channels allocated for cSSC transmission and others allocated for pSSC. This principle was demonstrated in references [7,8,9]. In these works, it was shown that joint spatial circuit switching combined with joint spatial optical packet switching can be used to handle ultra-high capacity cSSC and pSSC paths through an SDM network. This paper extends the work presented in reference [9] by detailing the implementation of an SDM test bed designed to transport high capacity cSSCs with more than 10 Tb/s throughput as well as a 1 Tb/s line rate pSSC. The latter line rate translates to an effective data rate up to approximately 600 Gb/s, limited by the electronic switches and the ICS in the MCFs. The network is supported by 19-core homogeneous MCFs as well as joint spatial circuit and packet switches. In addition, we extend the SDM test bed so that conventional optical circuit channels as well as pSSC and cSSC can be provided. The extended SDM test bed is equipped with OpenFlow switches to distribute IP packet flow into optical channels. We further propose a method of selecting adequate optical channels associated with the quality of service (QoS) requirements and experimentally demonstrate the method on the SDM network testbed. As a result, the experiment shows that IP packet flows are distributed and transmitted on adequate optical channels with high quality.
This paper is structured as follows. Section 2 presents a detailed description of the experimental setup used to implement the testbed, including an analysis of the MCF skew and performance of the transmitted signals. Section 3 describes and demonstrates the proposed optical path selection algorithm. The main conclusions are outlined in Section 4.
2. SDM Network Testbed
2.1. Experimental Setup
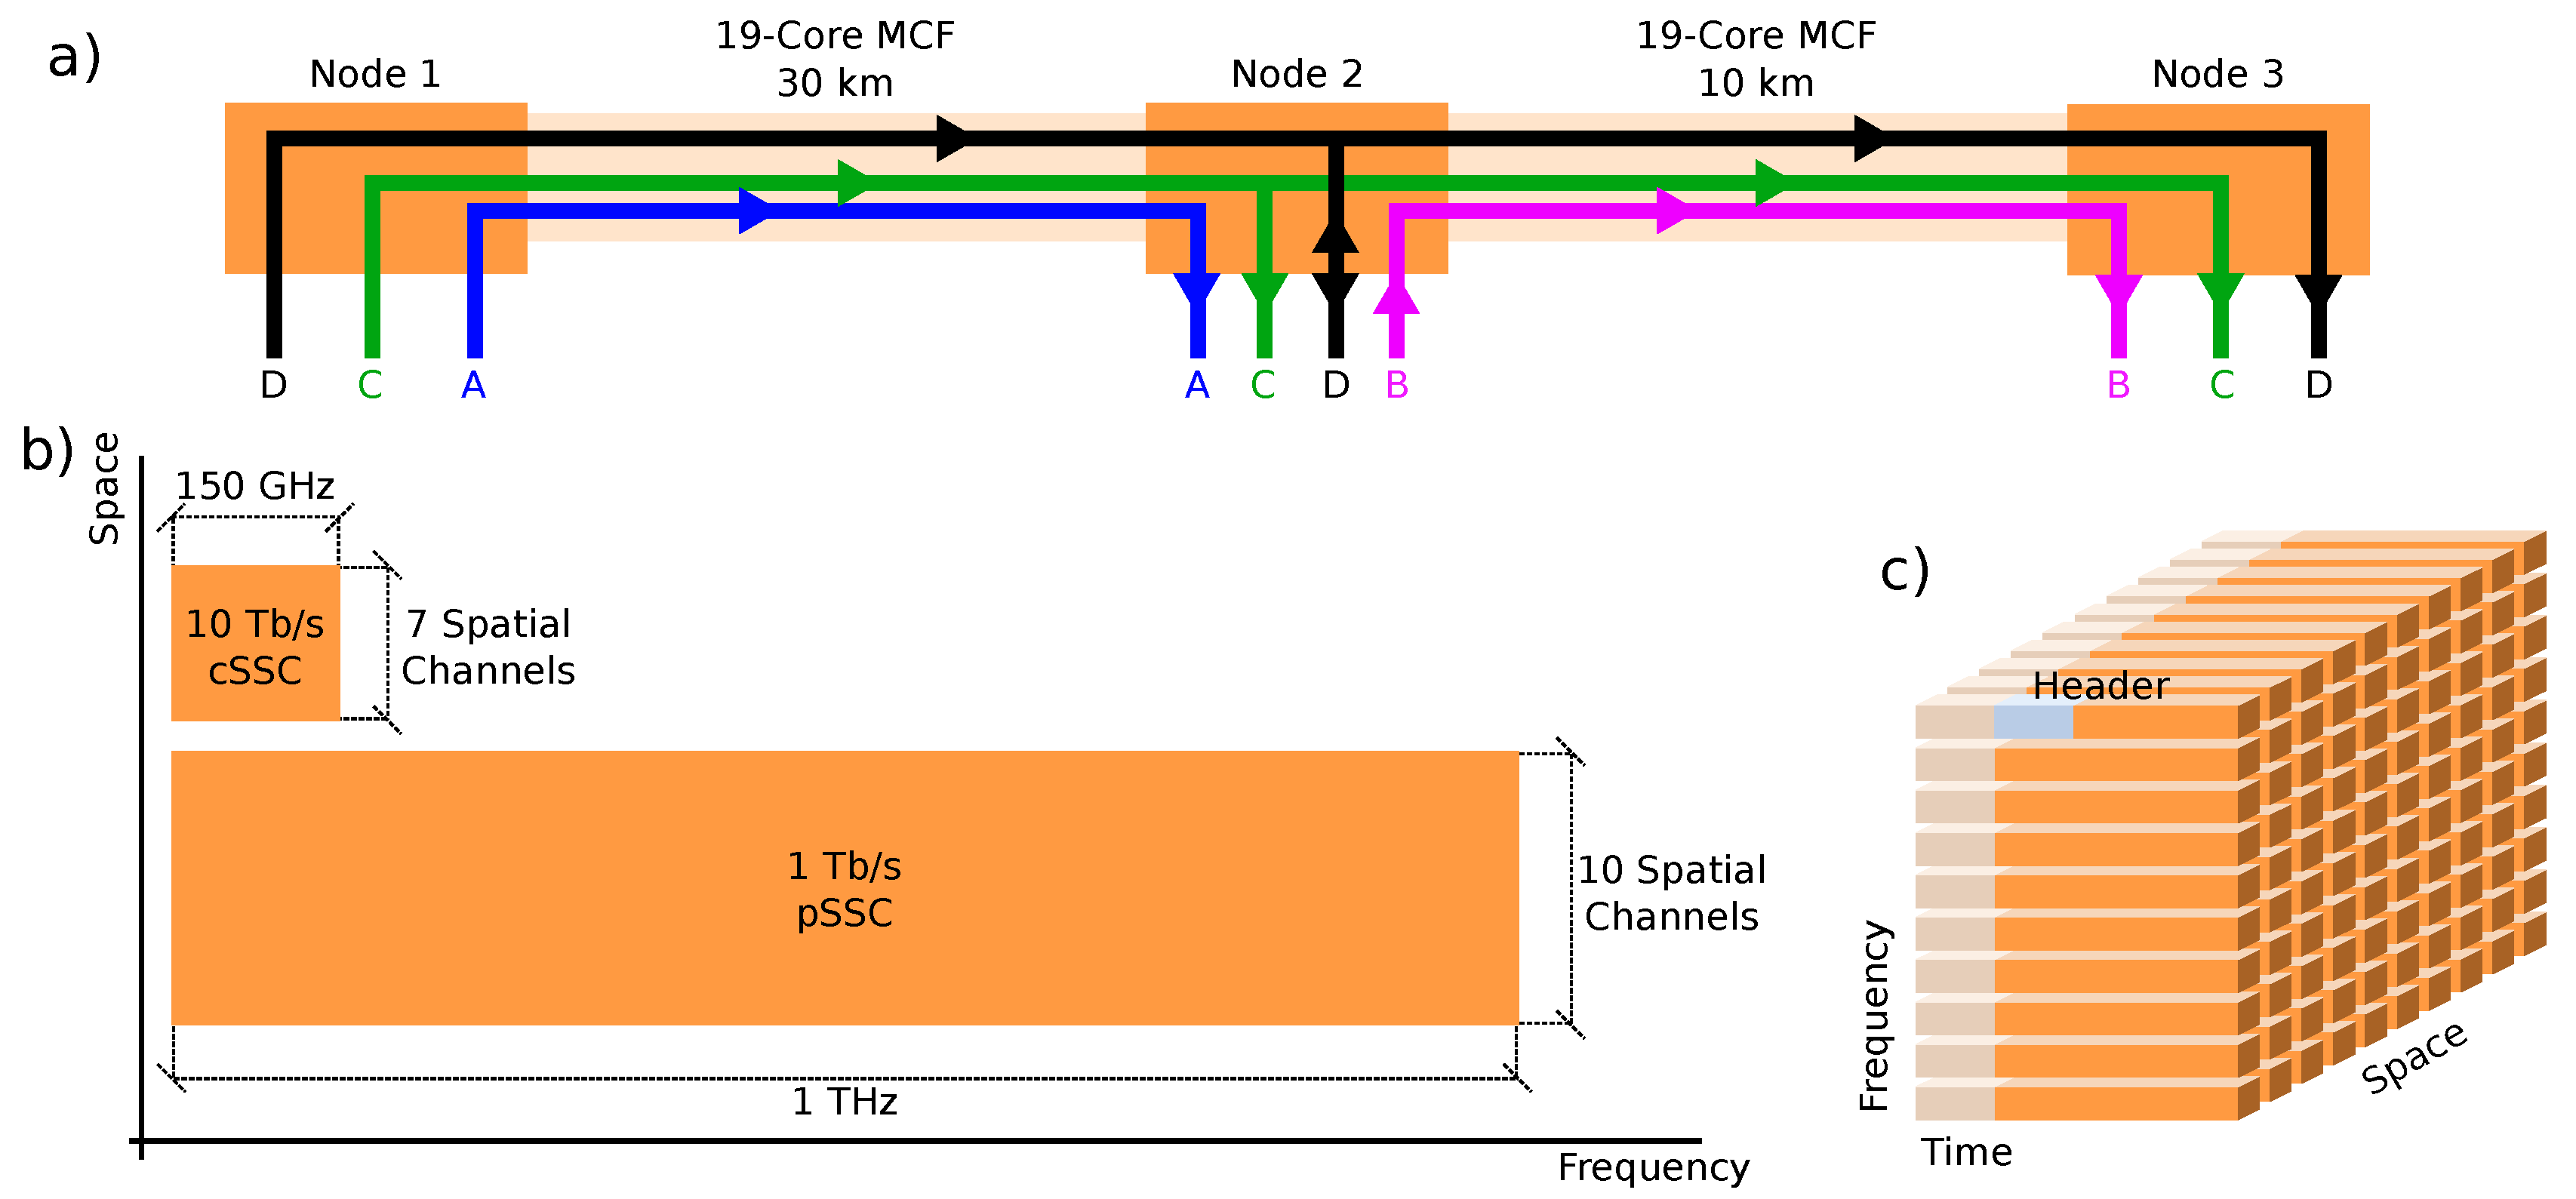
Figure 1a shows the implemented network structure. It was composed of nodes 1, 2 and 3 connected in a linear, unidirectional structure using two 19-core homogeneous single-mode MCFs of 30 km and 10 km. Each node was equipped with a 7-core joint circuit switch as well as an emulated 10-core joint packet switch. Figure 1b shows the resource allocation map. The network was used to transport a 10 Tb/s cSSC composed of six polarization-division multiplexed 64-ary quadrature amplitude modulated (PDM-64QAM) signals over a total bandwidth of 150 GHz and occupying 7 spatial channels. In addition, we transmitted a 1 Tb/s line rate pSSC composed of ten 10 Gb/s on-off keying (OOK) signals over a bandwidth of approximately 1 THz and occupying 10 spatial channels. Figure 1c shows the three-dimensional structure of the pSSC. Each carrier transported packets composed by a preample and payload. One of the carriers in one of the spatial channels carried the packet header.
For this demonstration, we assumed 4 transmission scenarios, as shown in Figure 1a. In scenarios A and B, the cSSC was transmitted from node 1 (add) to node 2 (drop) and from node 2 (add) to node 3 (drop), respectively. In scenario C, the cSSC was transmitted from node 1 (add) with multicasting at node 2 and drop at node 3. Simultaneously, the network ran scenario D, establishing layer 3 ethernet connections between the 3 nodes with the pSSC.
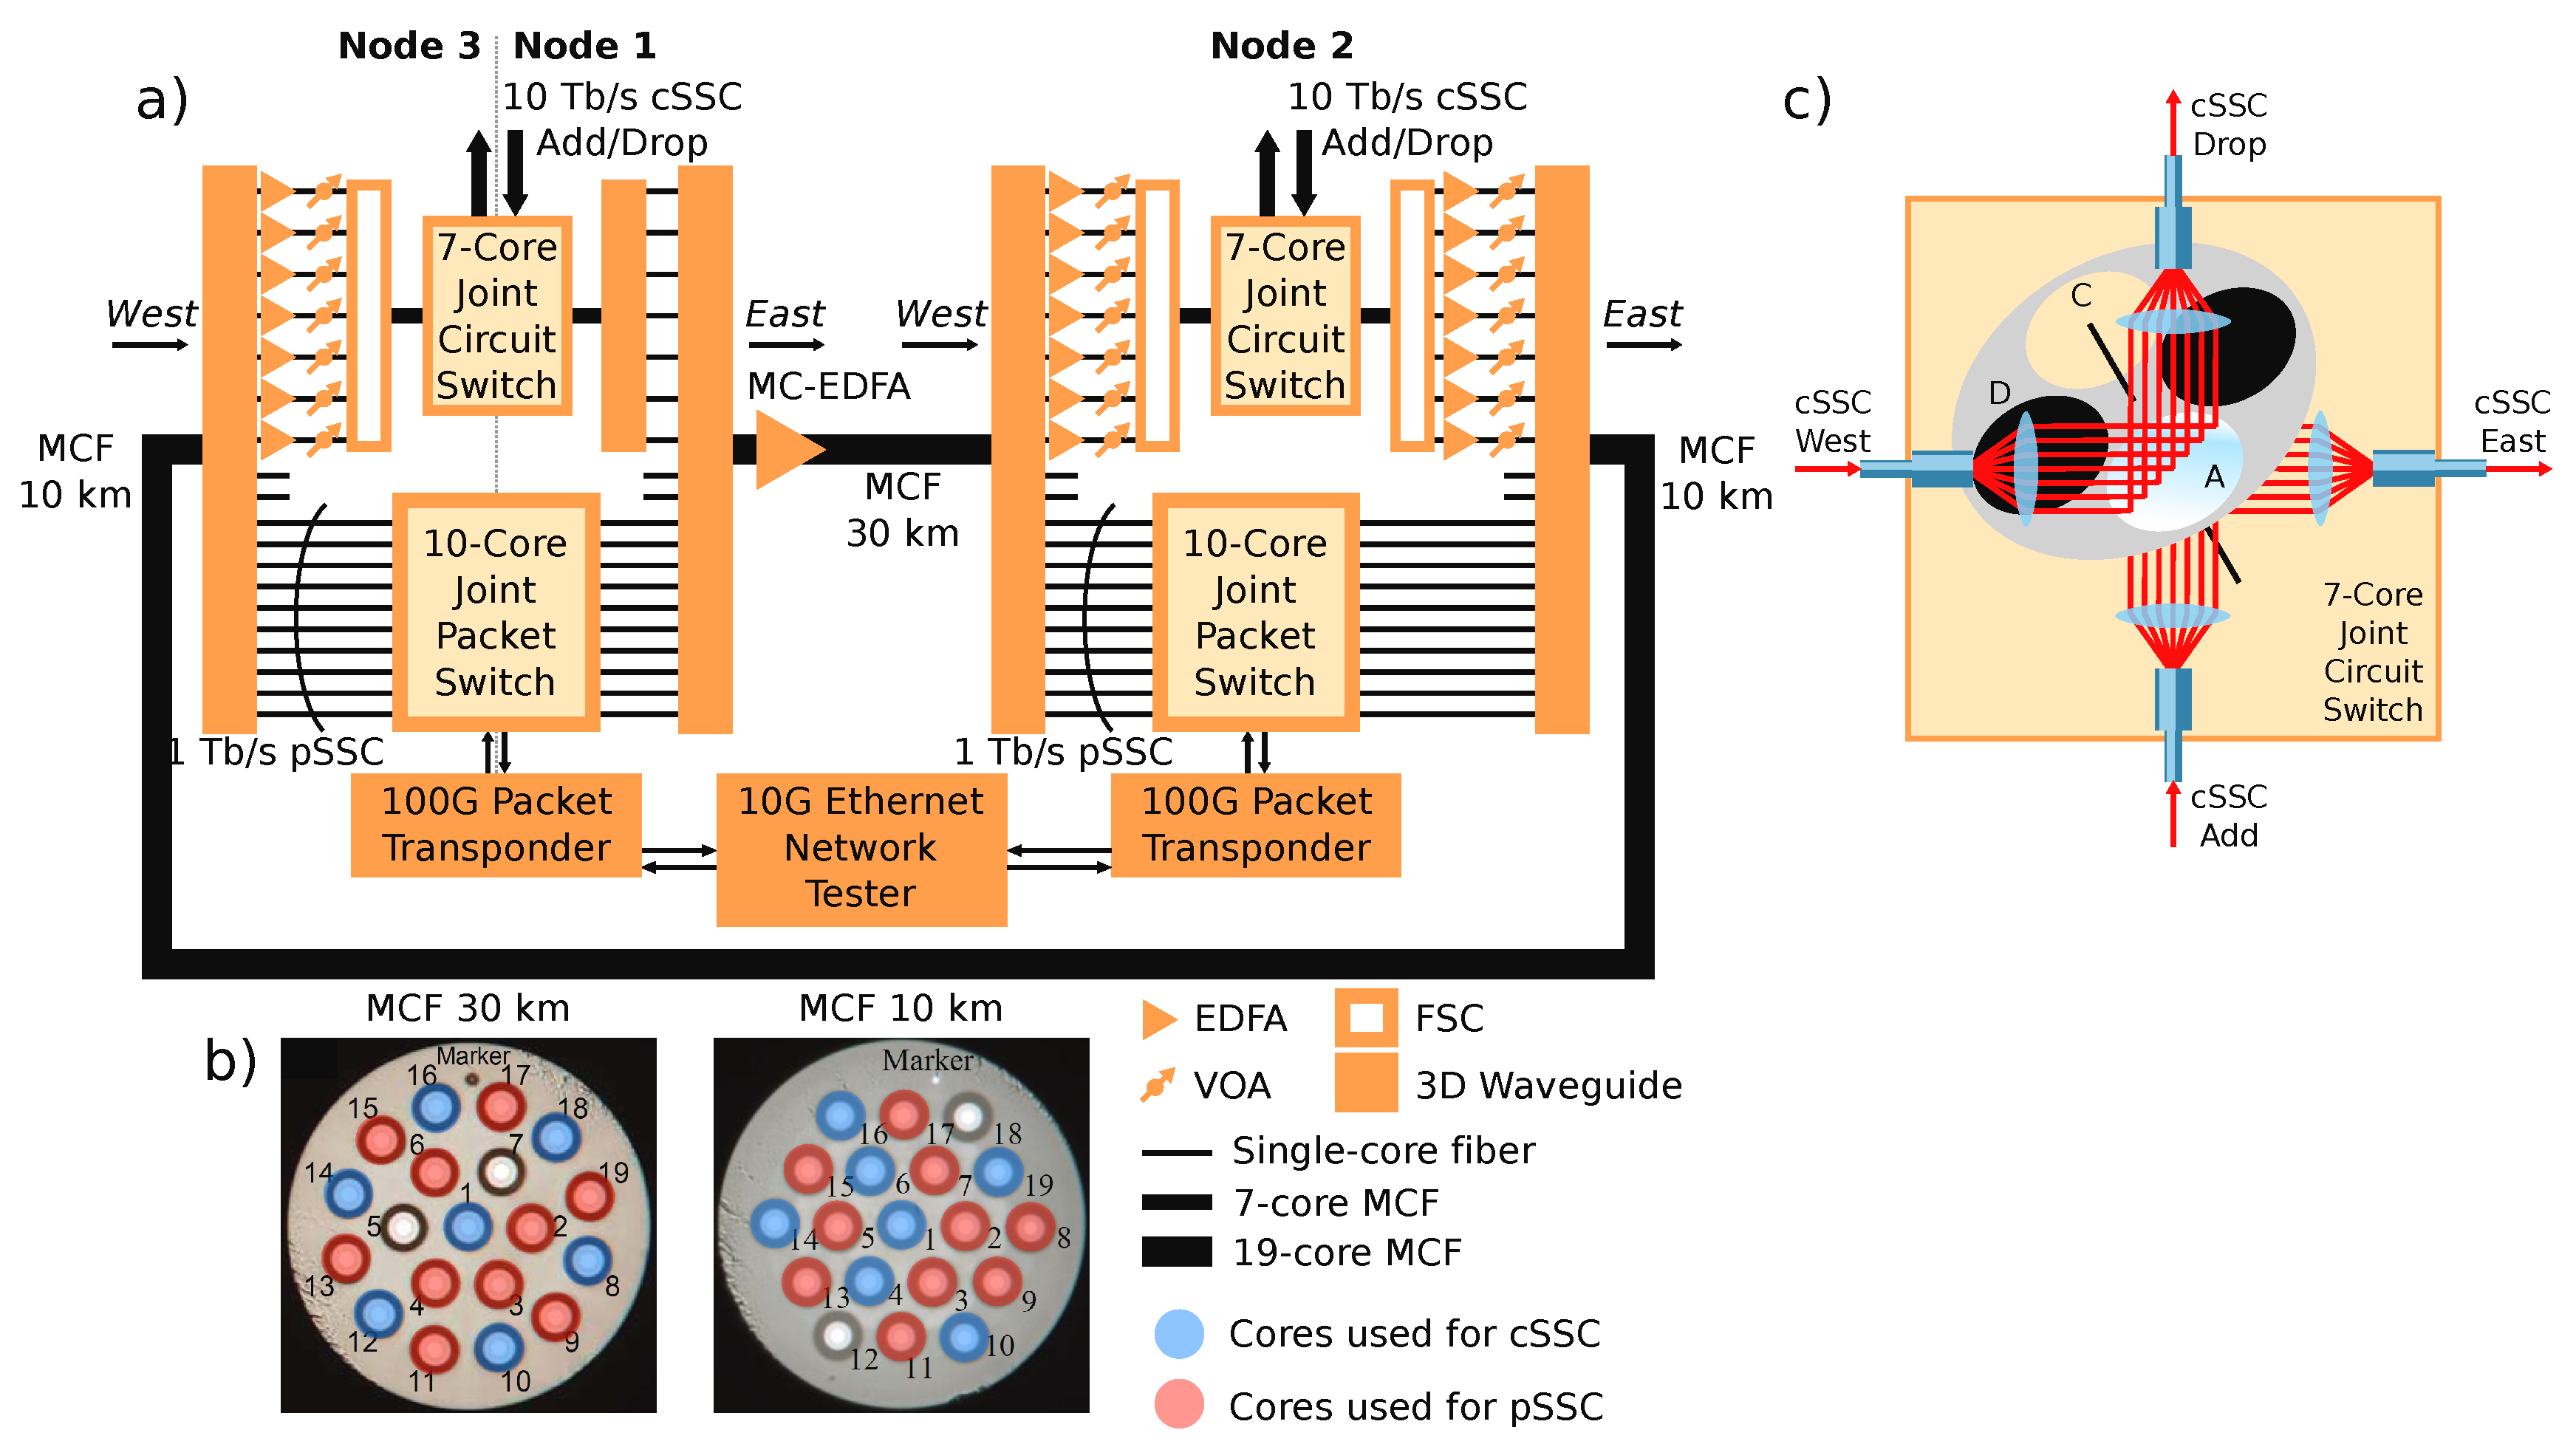
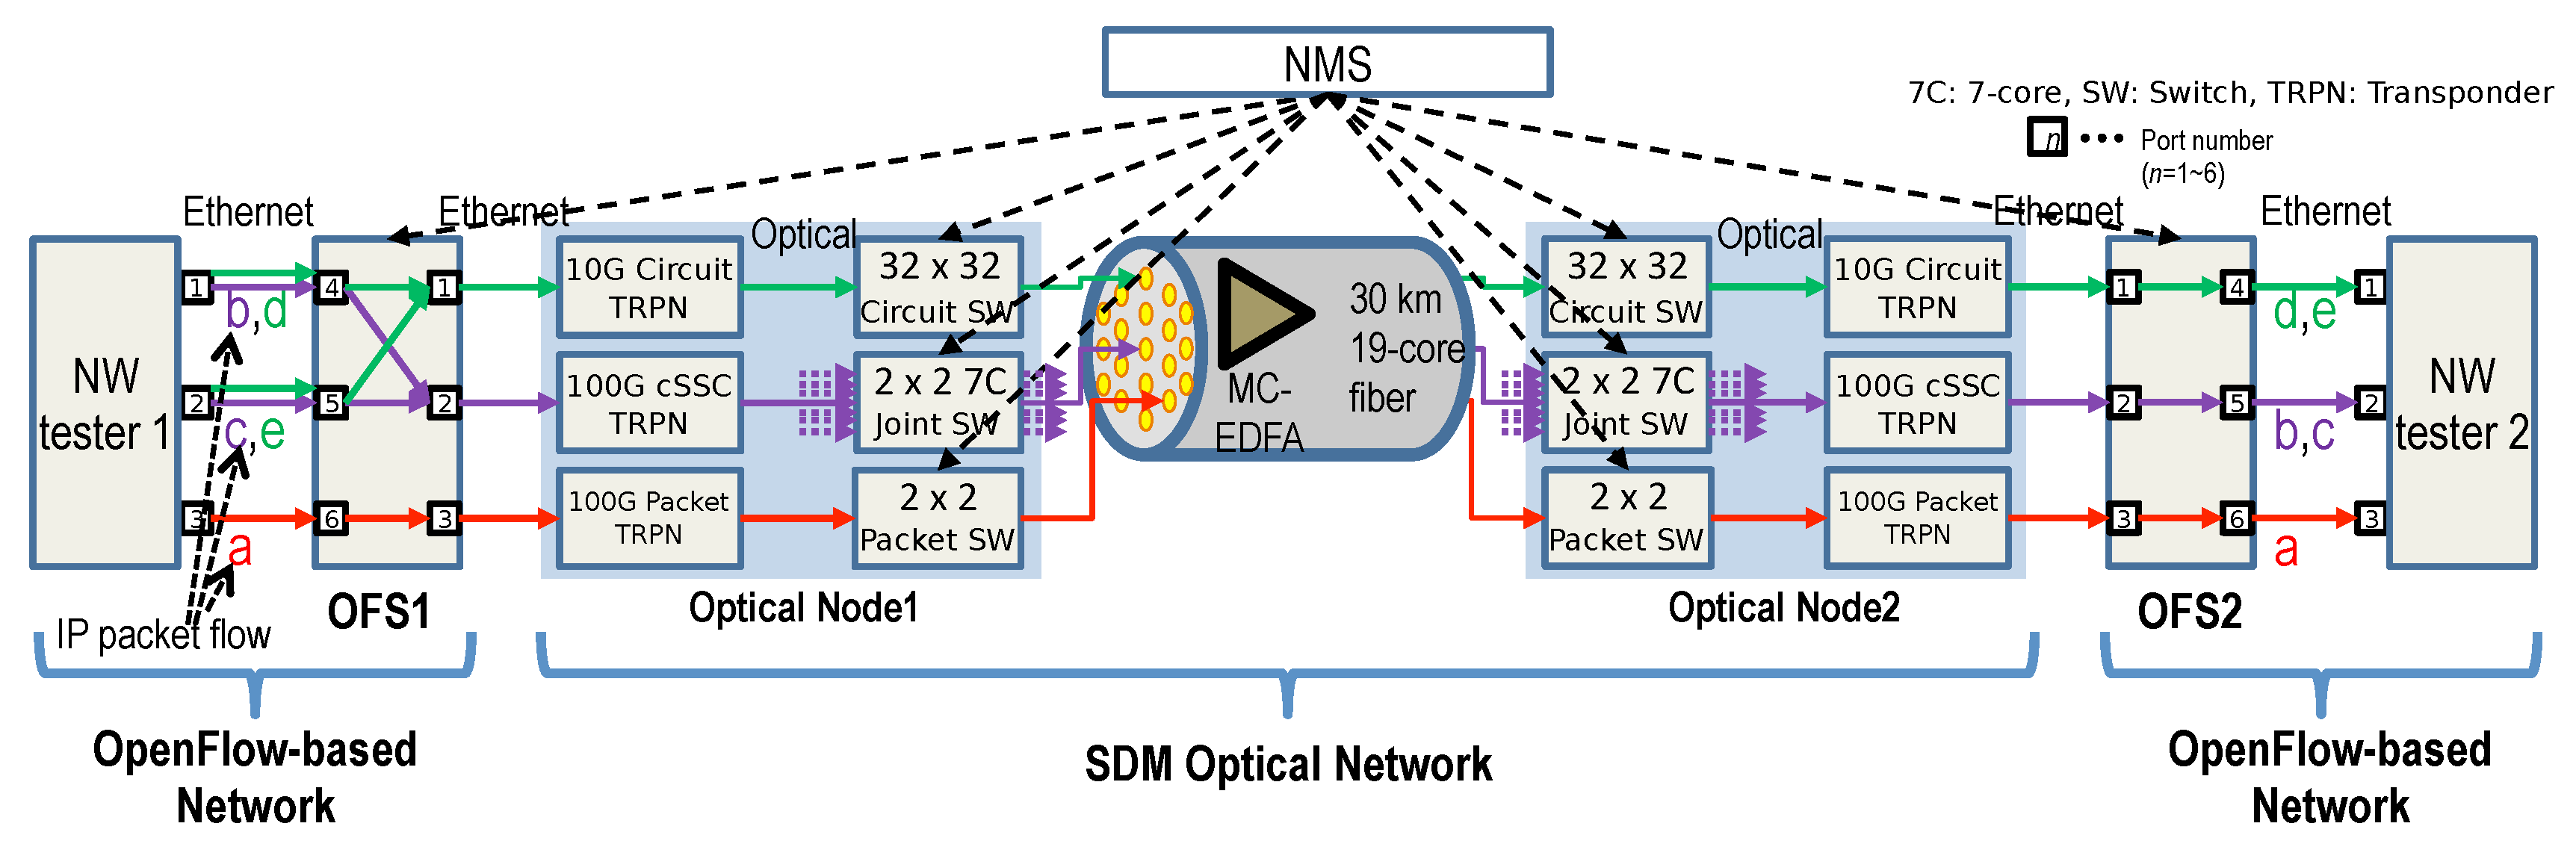
Figure 2a shows a simplified diagram of the experimental setup used to test the network structure shown in Figure 1a. Due to limitations in our laboratory, we implemented the proposed network by constructing two SDM-ROADMS with one acting as nodes 1 (east side) and 3 (west side) simultaneously, and the other acting as node 2. The nodes were connected via 19-core MCFs, whose profiles are shown in Figure 2b. Between nodes 1 and 2 we used a 30 km fiber with cores positioned in a two ring configuration and a center core. Each core was surrounded by an index trench which lead to inter-core crosstalk between −40 dB and −45 dB. This fiber was spliced to a multi-core erbium-doped fiber amplifier (MC-EDFA), which acted as a booster on the east line side of node 1. Detailed descriptions of the fiber and amplifier may be found in reference [10]. The link between nodes 2 and 3 was performed using a 10 km, 19-core MCF whose cores were also surrounded by index trenches to reduce inter-core crosstalk and were positioned in an hexagonal arrangement. This lead to crosstalk values between −30 dB and −35 dB. A detailed description of this fiber is included in reference [11]. Figure 2b shows the profiles of the 30 km and 10 km 19-core MCFs used in this experiment and the selection of cores used to transport the cSSC and the pSSC. We selected these cores to reduce the crosstalk within each spatial super channel but made no attempt to reduce crosstalk between different spatial super channels. The nodes were connected to the 19-core MCFs using 3D-waveguides to act as SDM multiplexers and demultiplexers. To handle the 7-core 10 Tb/s cSSC, the corresponding outputs of the 19-core SDM demultiplexers were multiplexed into 7-core MCFs by free space couplers (FSC). Seven erbium doped fiber amplifiers (EDFAs) followed by variable optical attenuators (VOAs) were used to compensate for the loss of the FSCs. The outputs of the FSCs were connected to 7-core joint circuit switches, further detailed in Figure 2c. These were composed of four 7-core MCF-pigtailed collimators aligned in a cross with a circular plate at the center. The plates were servo steered into one of 4 positions containing (A) a mirror for add/drop; (B) a half-mirror for multicasting; (C) a hole for through switching; and (D) a termination. The east sides of the switches were connected to the ROADMs’ east line sides via 7-core MCFs whose outputs were demultiplexed using a 3D waveguide coupler in the case of node 1, and a FSC in the case of node 2. In the case of node 1, the coupler outputs were multiplexed into the 19-core MC-EDFA by the east side 19-core SDM multiplexer. In the case of node 2, we used discrete EDFAs followed by VOAs preceding the 19-core SDM multiplexer. The add and drop from the joint circuit switches took the form of 7-core cSSCs carried by 7-core MCFs.
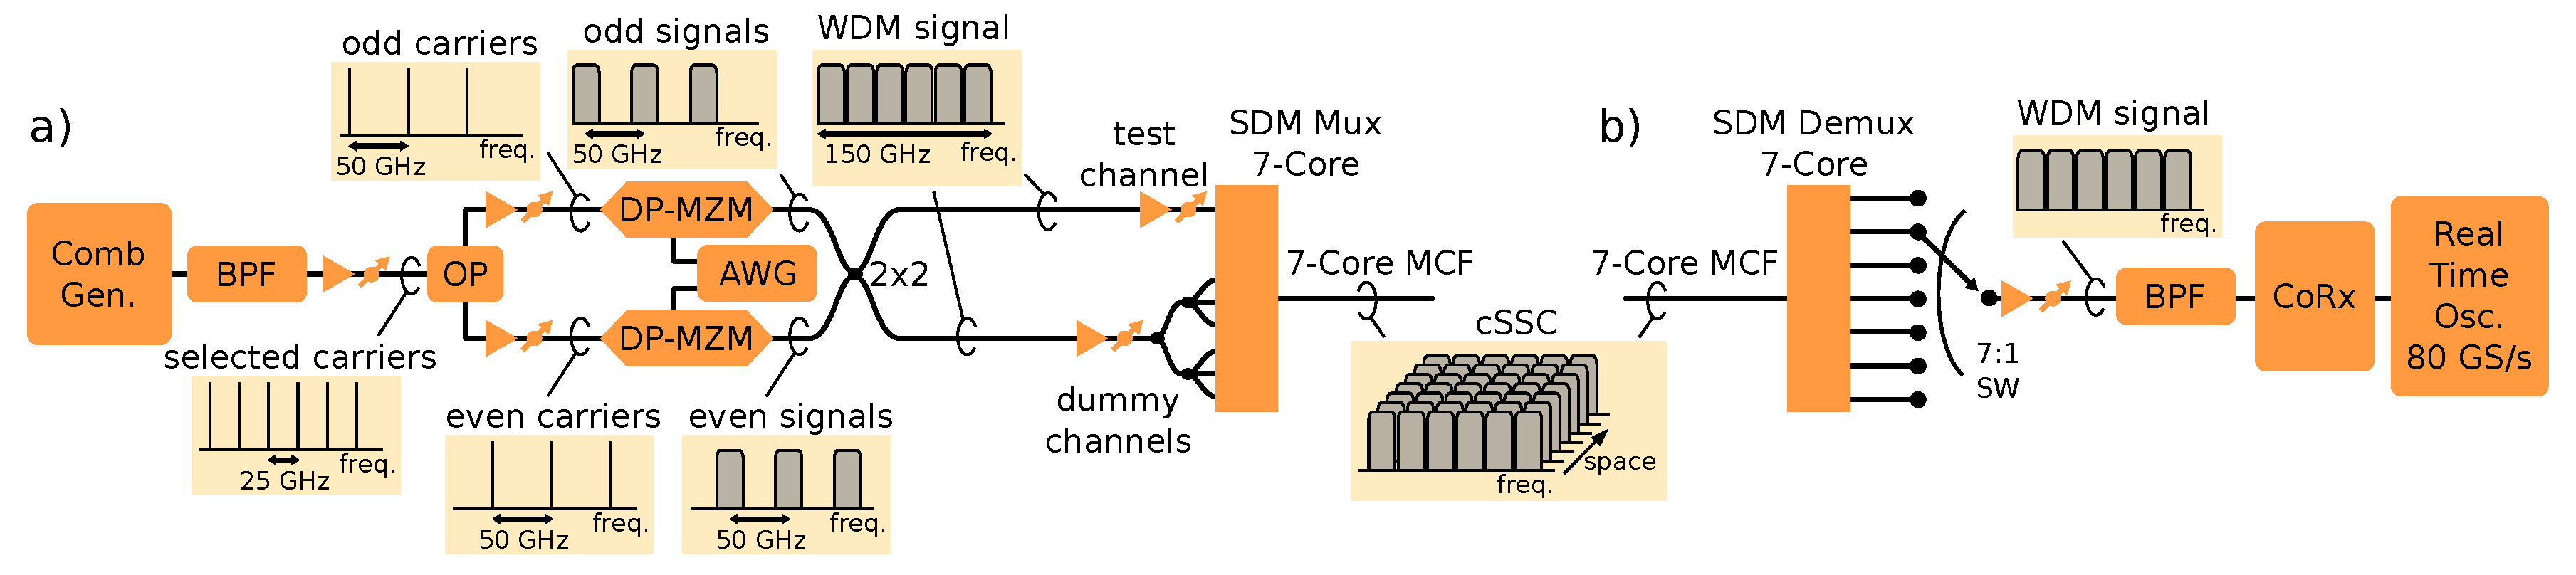
Figure 3a,b show the experimental setups used to produce and receive the 10 Tb/s cSSC, respectively. The output of a wideband frequency comb generator [12] was filtered with a band-pass filter (BPF) to select 6 carriers with a frequency spacing of 25 GHz, centered between 1549.32 nm and 1550.32 nm. The selected carriers were amplified by an EDFA followed by a VOA for power control and split into even and odd carriers by an optical processor (OP). Each group of carriers was again amplified and sent to a dual-polarization dual-parallel Mach–Zehnder modulator (DP-MZM). The modulators were driven by arbitrary waveform generators (AWGs) to produce 24.5 Gbaud PDM-64QAM signals. Even and odd signals were combined at a 2 × 2 coupler with one of its outputs acting as the test signal. The other output of the coupler was amplified at a high power EDFA and split into 6 replicas. These acted as dummy spatial channels and were decorrelated and multiplexed with the test channel at a 3D waveguide SDM multiplexer. The combined throughput of the cSSC was 12.348 Tb/s which corresponded to a net throughput of 10.29 Tb/s, assuming a 20% overhead to support soft-decision forward error correction [13]. The receiver was composed of an SDM demultiplexer followed by a manual switch to select the spatial channel under analysis. The selected spatial channel was then pre-amplified by an EDFA followed by a VOA and filtered with a BPF to limit the ASE power around the WDM channel under analysis. The resulting signal was detected by a polarization diverse coherent receiver whose outputs were digitized by a real-time oscilloscope operating at 80 GS/s. Digital signal processing was performed offline, and performance was estimated by direct error counting on 5 × 10 μs traces.
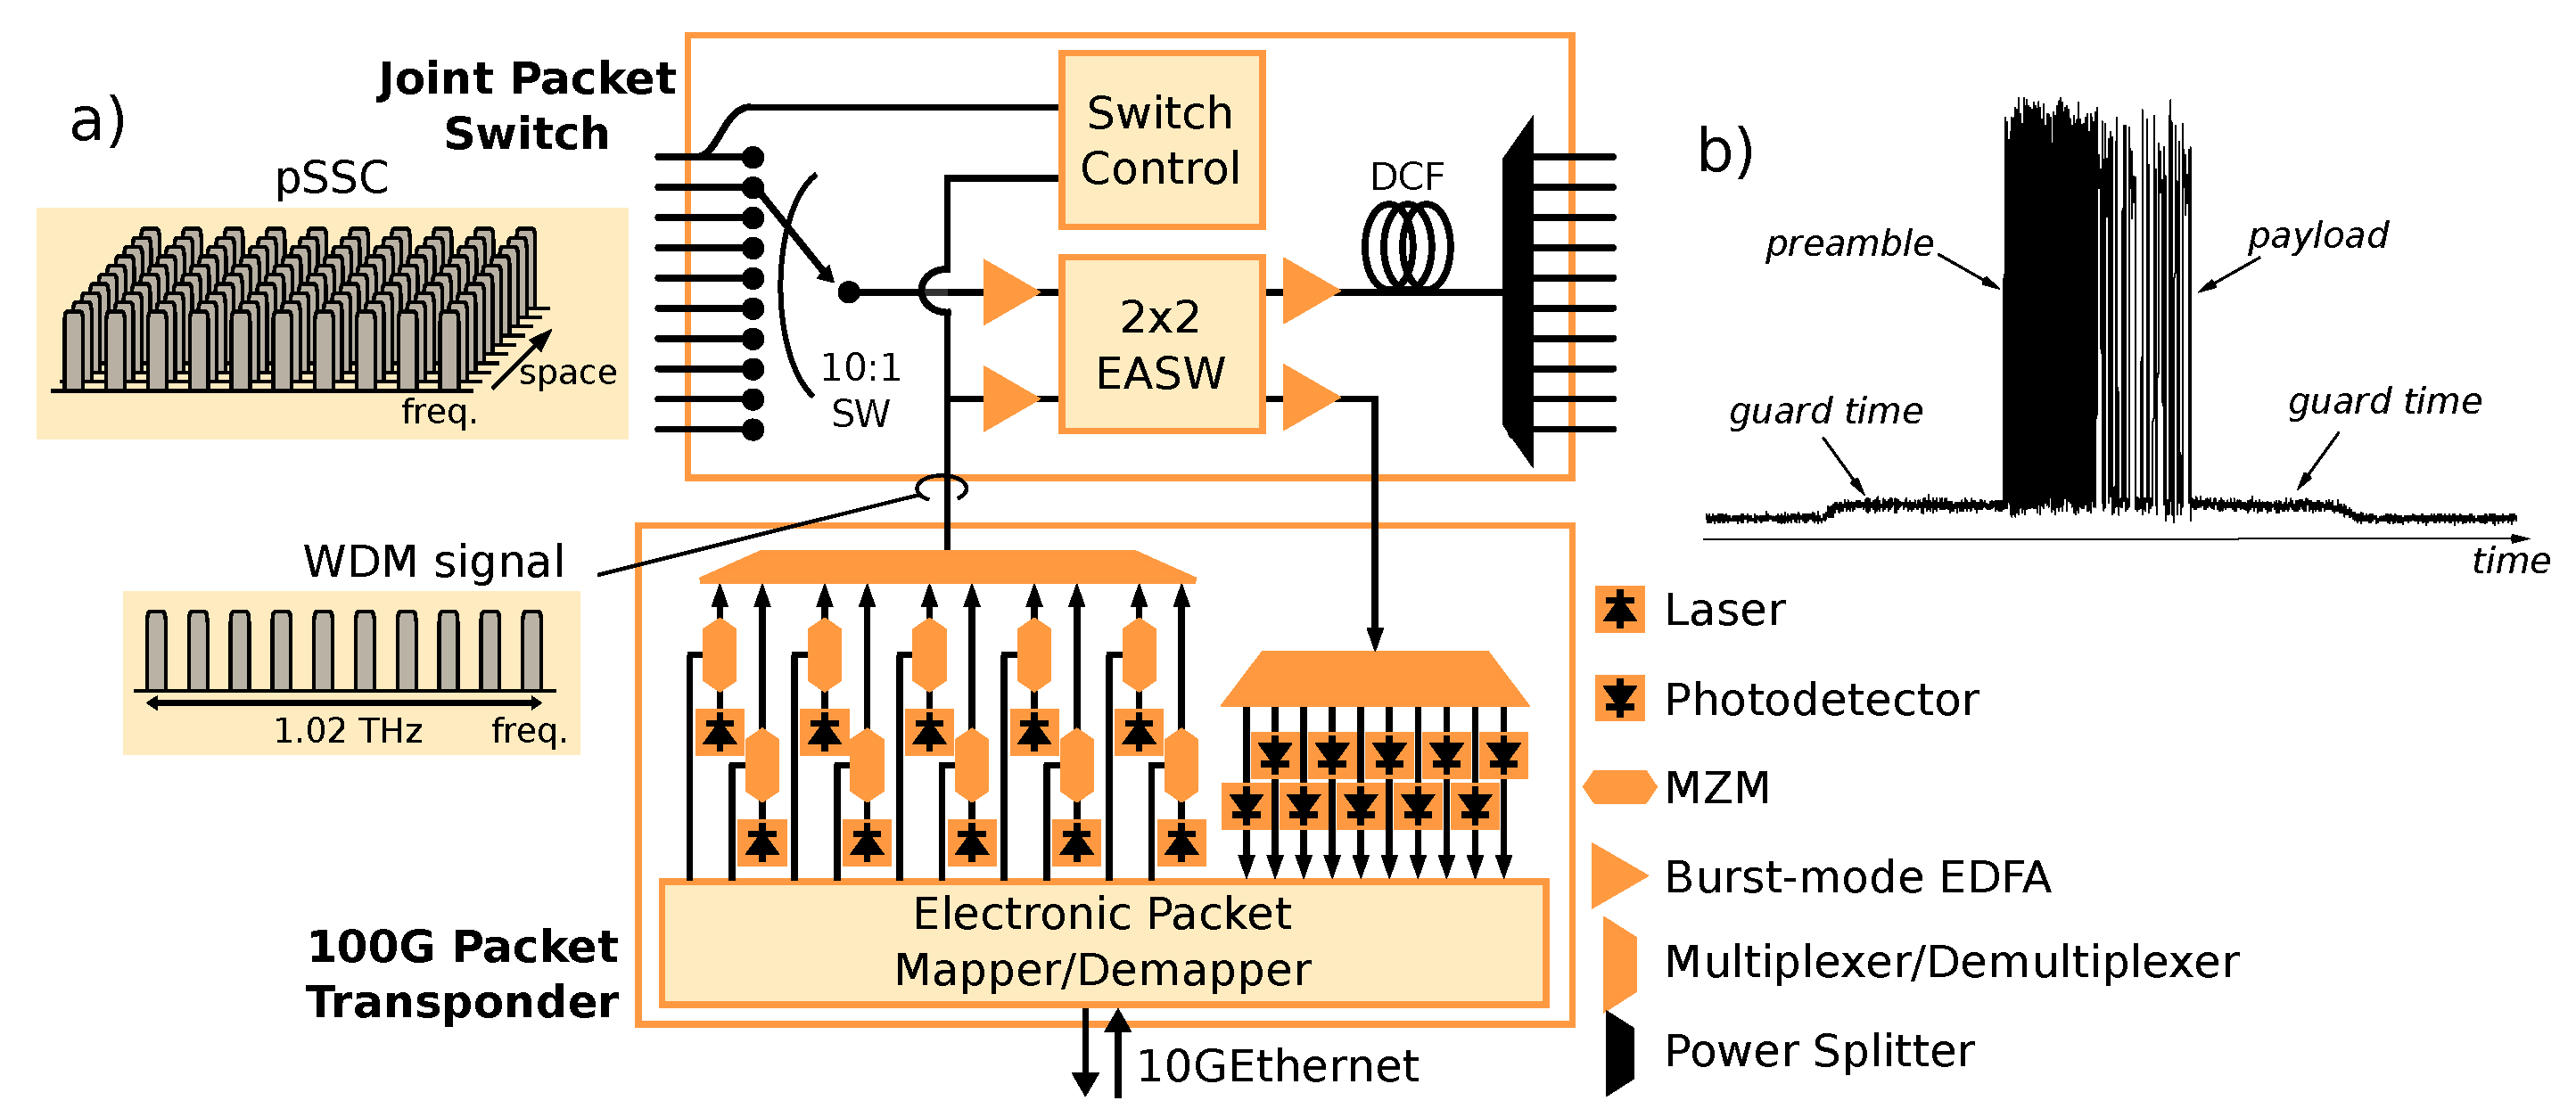
To handle the 1 Tb/s line rate pSSC, the 10 corresponding outputs of the west side 19-core SDM demultiplexers were directed to emulated 10-core joint packet switches, which are further detailed in Figure 4a. Due to the limited amount of equipment in our laboratory, we were only able to implement the setup for the processing of one of the spatial channels composing the 10-core pSSC. As such, it was necessary to process each spatial channel in turn. The selection of the spatial channel to be processed was performed using a manual 1:10 switch. The selected spatial channel was directed to a 2 × 2 electro-absorption switch (EASW), which routed the incoming multi-wavelength packets either to the other line side or to a 100G packet transponder. The EASW is described in detail in reference [14]. The add packets from the 100G packet transponder were directed by the EASW to a 1:10 power splitter to emulate the pSSC as a set of 10 replicas of the same 100G signal. The control of the switch was performed by a switch control module which took the label of one of the received spatial channels or the signals from the 100G transponder. Within the switch, burst-mode EDFAs [15] were used to compensate for the EASW loss. Finally, the use of dispersion compensation fiber (DCF) was required to compensate the dispersion introduced on the transmission MCF. We note that this setup relied on the assumption that the inbound spatial channels were temporally aligned, which was possible due to the use of homogeneous MCFs. This point will be further discussed in the following sub-section. Figure 4a also shows the internal structure of the 100G packet transponder. An electronic mapping and demapping circuit converted 10GEthernet packets into 10 × 10 Gb/s signals which were modulated onto 10 lightwaves by Mach-Zehnder modulators (MZM). The wavelengths of the lightwaves modulated by the MZMs were selected from the ITU-T grid with 100 GHz spacing and wavelength multiplexed by WDM multiplexers composed of arrayed waveguide gratings. The inverse operation was also carried out to take an incoming multi-wavelength packet and demultiplex it into 10 separate 10 Gb/s signals which were then directly detected by a set of 10 photodetectors. The resulting electrical signals were mapped into a 10GEthernet signal. One of the 10 Gb/s signals also carried the packet header to control the EASW. A detailed description of this system is available in reference [15]. Figure 4b shows a trace of one of the 10 Gb/s signals when produced from a 64 byte 10GEthernet packet. The packet was composed of a preamble, used for packet detection and synchronization, followed by the payload. Before and after the packet, there was a guard time of 24 ns, set to align packets with different arrival times. The test traffic was generated by a commercial 10GEthernet network tester.
2.2. Analysis of the Inter-Core Skew
Although we used homogeneous MCFs, it is well known that even in such fibers, the ICS is not negligible [16]. It results from limitations in the fiber fabrication process as well as environmental factors [6] and may be decomposed into a static component and a random time varying component [17]. It has been shown that static ICS is generally small enough to be compensated using periodically positioned static optical delay lines, even though such an effort may prove to be unfeasible for complex networks. On the other hand, dynamic ICS requires either potentially costly dynamically adjusted optical delay lines or buffering mechanisms to handle the delays between the signals arriving at the receivers or switches from different spatial channels. Since such mechanisms are generally implemented in packet-based telecommunications systems to handle other phenomena, such as delays in electrical components, the transition to SDM systems may require simply a readjustment to cope with MCF skew. This point was addressed in reference [7]. There, it was shown that the bandwidth utilization efficiency (BUE) in such networks may be limited by both static and dynamic components of the ICS.
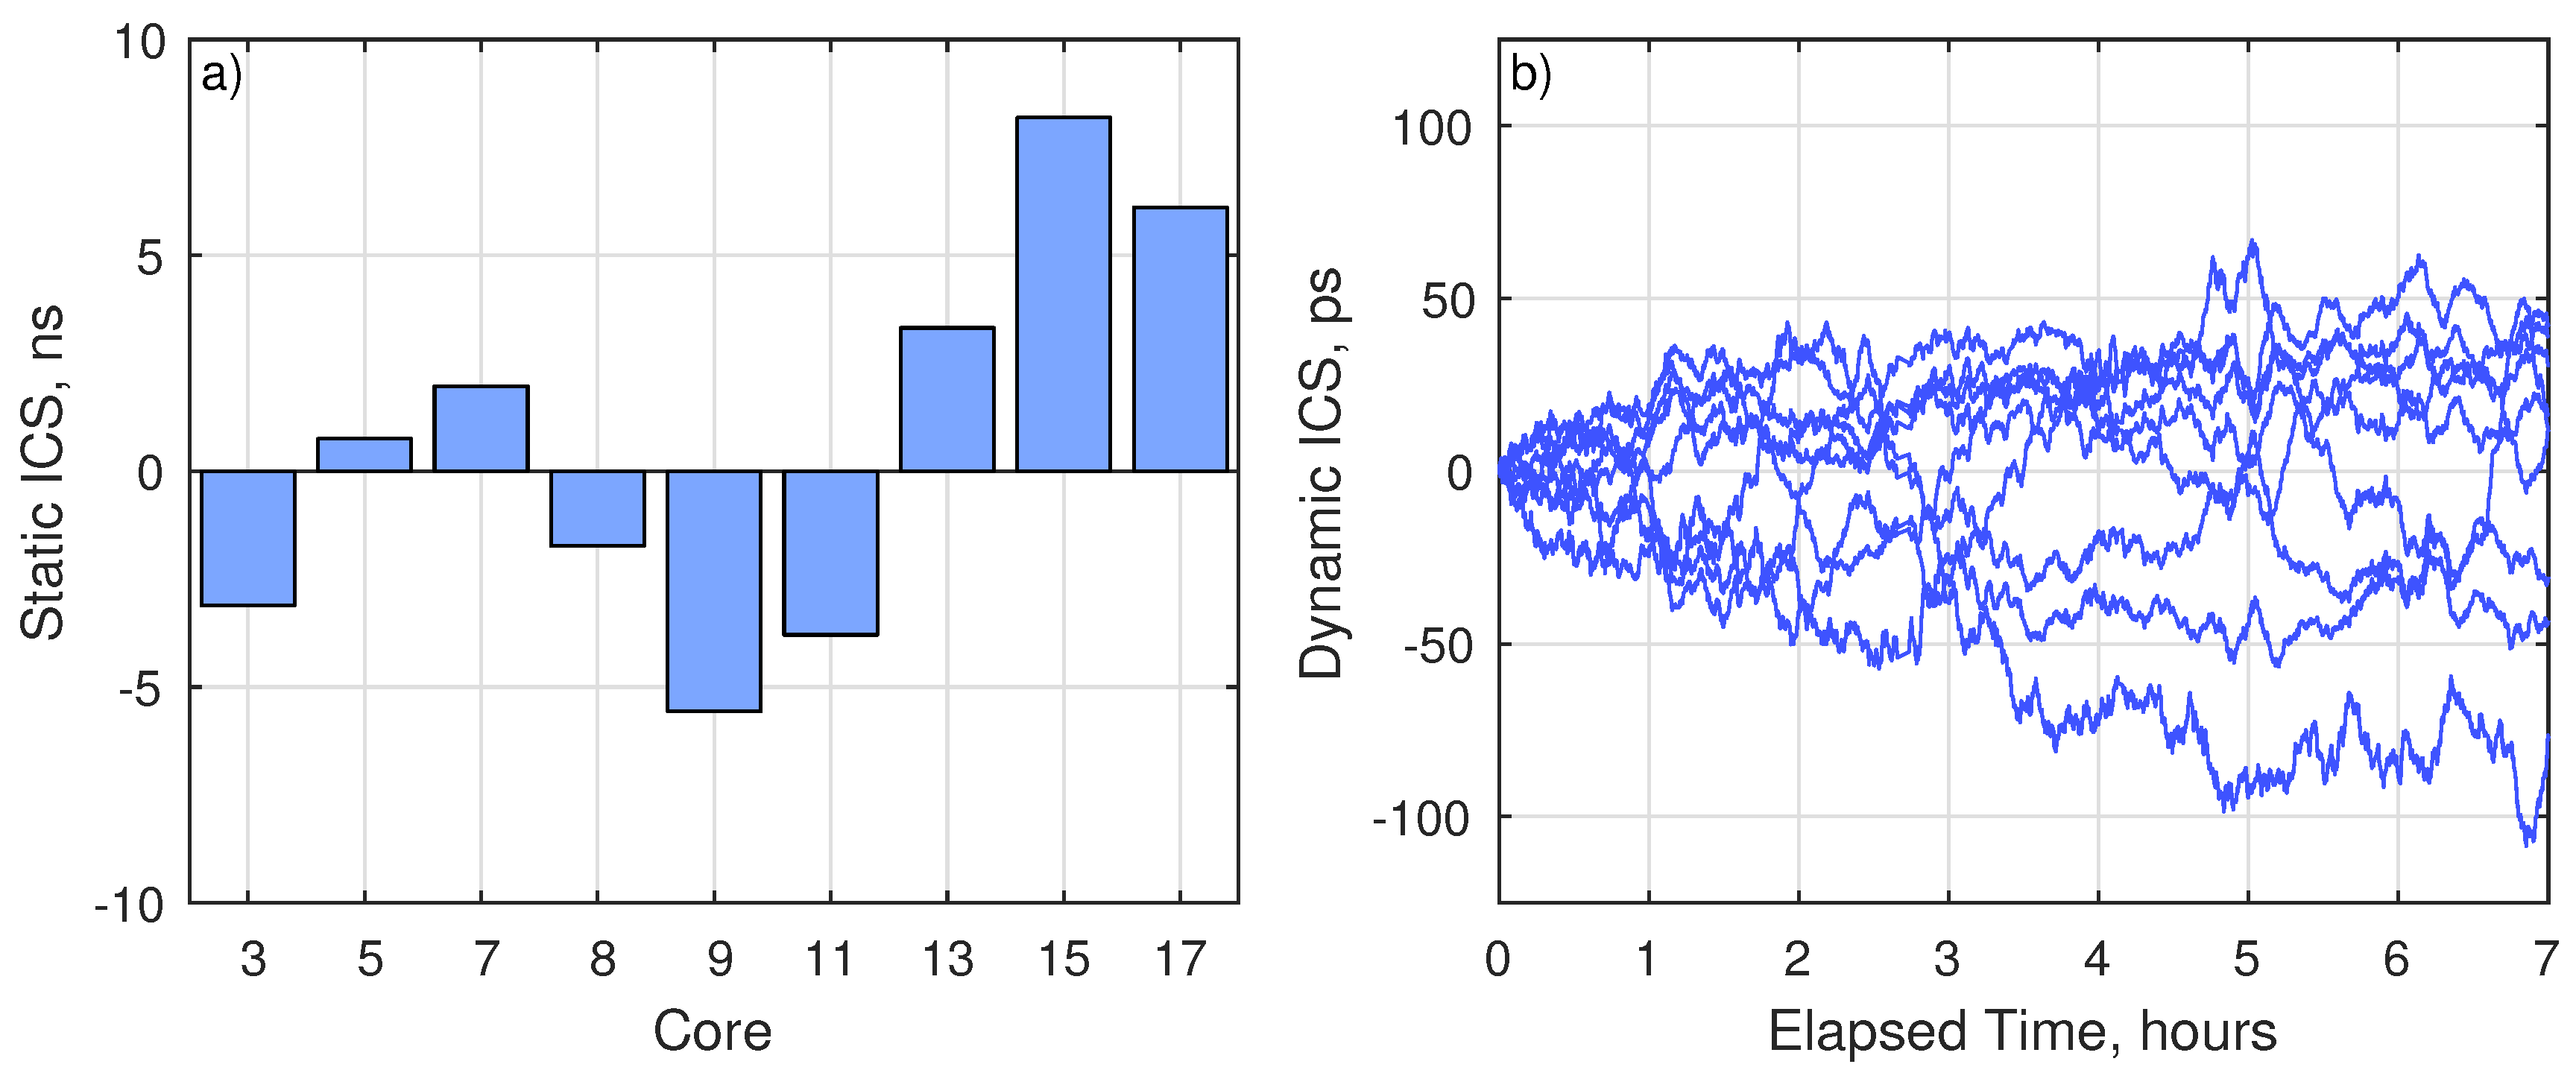
Here, we evaluated both the static and dynamic ICS of the 30 km MCF, as this is the most limiting link. For this purpose, we used an experimental setup similar to that in reference [17]. We transmitted time-aligned packets on the relevant MCF cores using the pSSC transmitter setup shown in Figure 4a. The delay between packets was then measured at the output of the 30 km MCF using an oscilloscope connected to the outputs of the SDM demultiplexer. Figure 5a shows the static ICS of the cores used for the transmission of the pSSC with respect to core 2 which was considered to be the reference. It is shown that the maximum absolute static ICS was below 8.2 ns. However, a guard time mechanism to support transmission of the pSSC would have to support the maximum difference between ICS values, corresponding to 13.8 ns. Figure 5b shows the dynamic skew for the same combinations of cores estimated over a period of 7 h. This skew was not corrected to remove the impact of the jitter introduced by the measurement apparatus. Nevertheless, it shows that, over the measurement period, the dynamic ICS was within a range of approximately 160 ps which is an order of magnitude below the static ICS. These results are higher than previous measurements, potentially due to the impact of electronic jitter on the measurement system. However, the approximate ratio between the static and dynamic components of ICS was similar to the results reported in reference [18]. As such, we may assume that the ICS impact was negligible in our system. In addition, we showed in the previous sub-section that the pSSC packets had a 24.8 ns guard time which is sufficient to account for static ICS without further compensation mechanisms.
We note that the use of 48 ns of guard time for each packet severely reduced the BUE of the proposed system. In fact, the maximum effective throughput of the pSSC was little over 600 Gb/s, which is far from the line data-rate of 1 Tb/s. However, the guard times could potentially be reduced in future iterations of our testbed by (i) improving the clock recovery sub-system used by the switch control as well as the electronic packet mapper and demapper, or (ii) by introducing static ICS compensation or MCFs with very low ICS. Such techniques will be required in future networks that accomodate pSSCs.
2.3. Network Performance
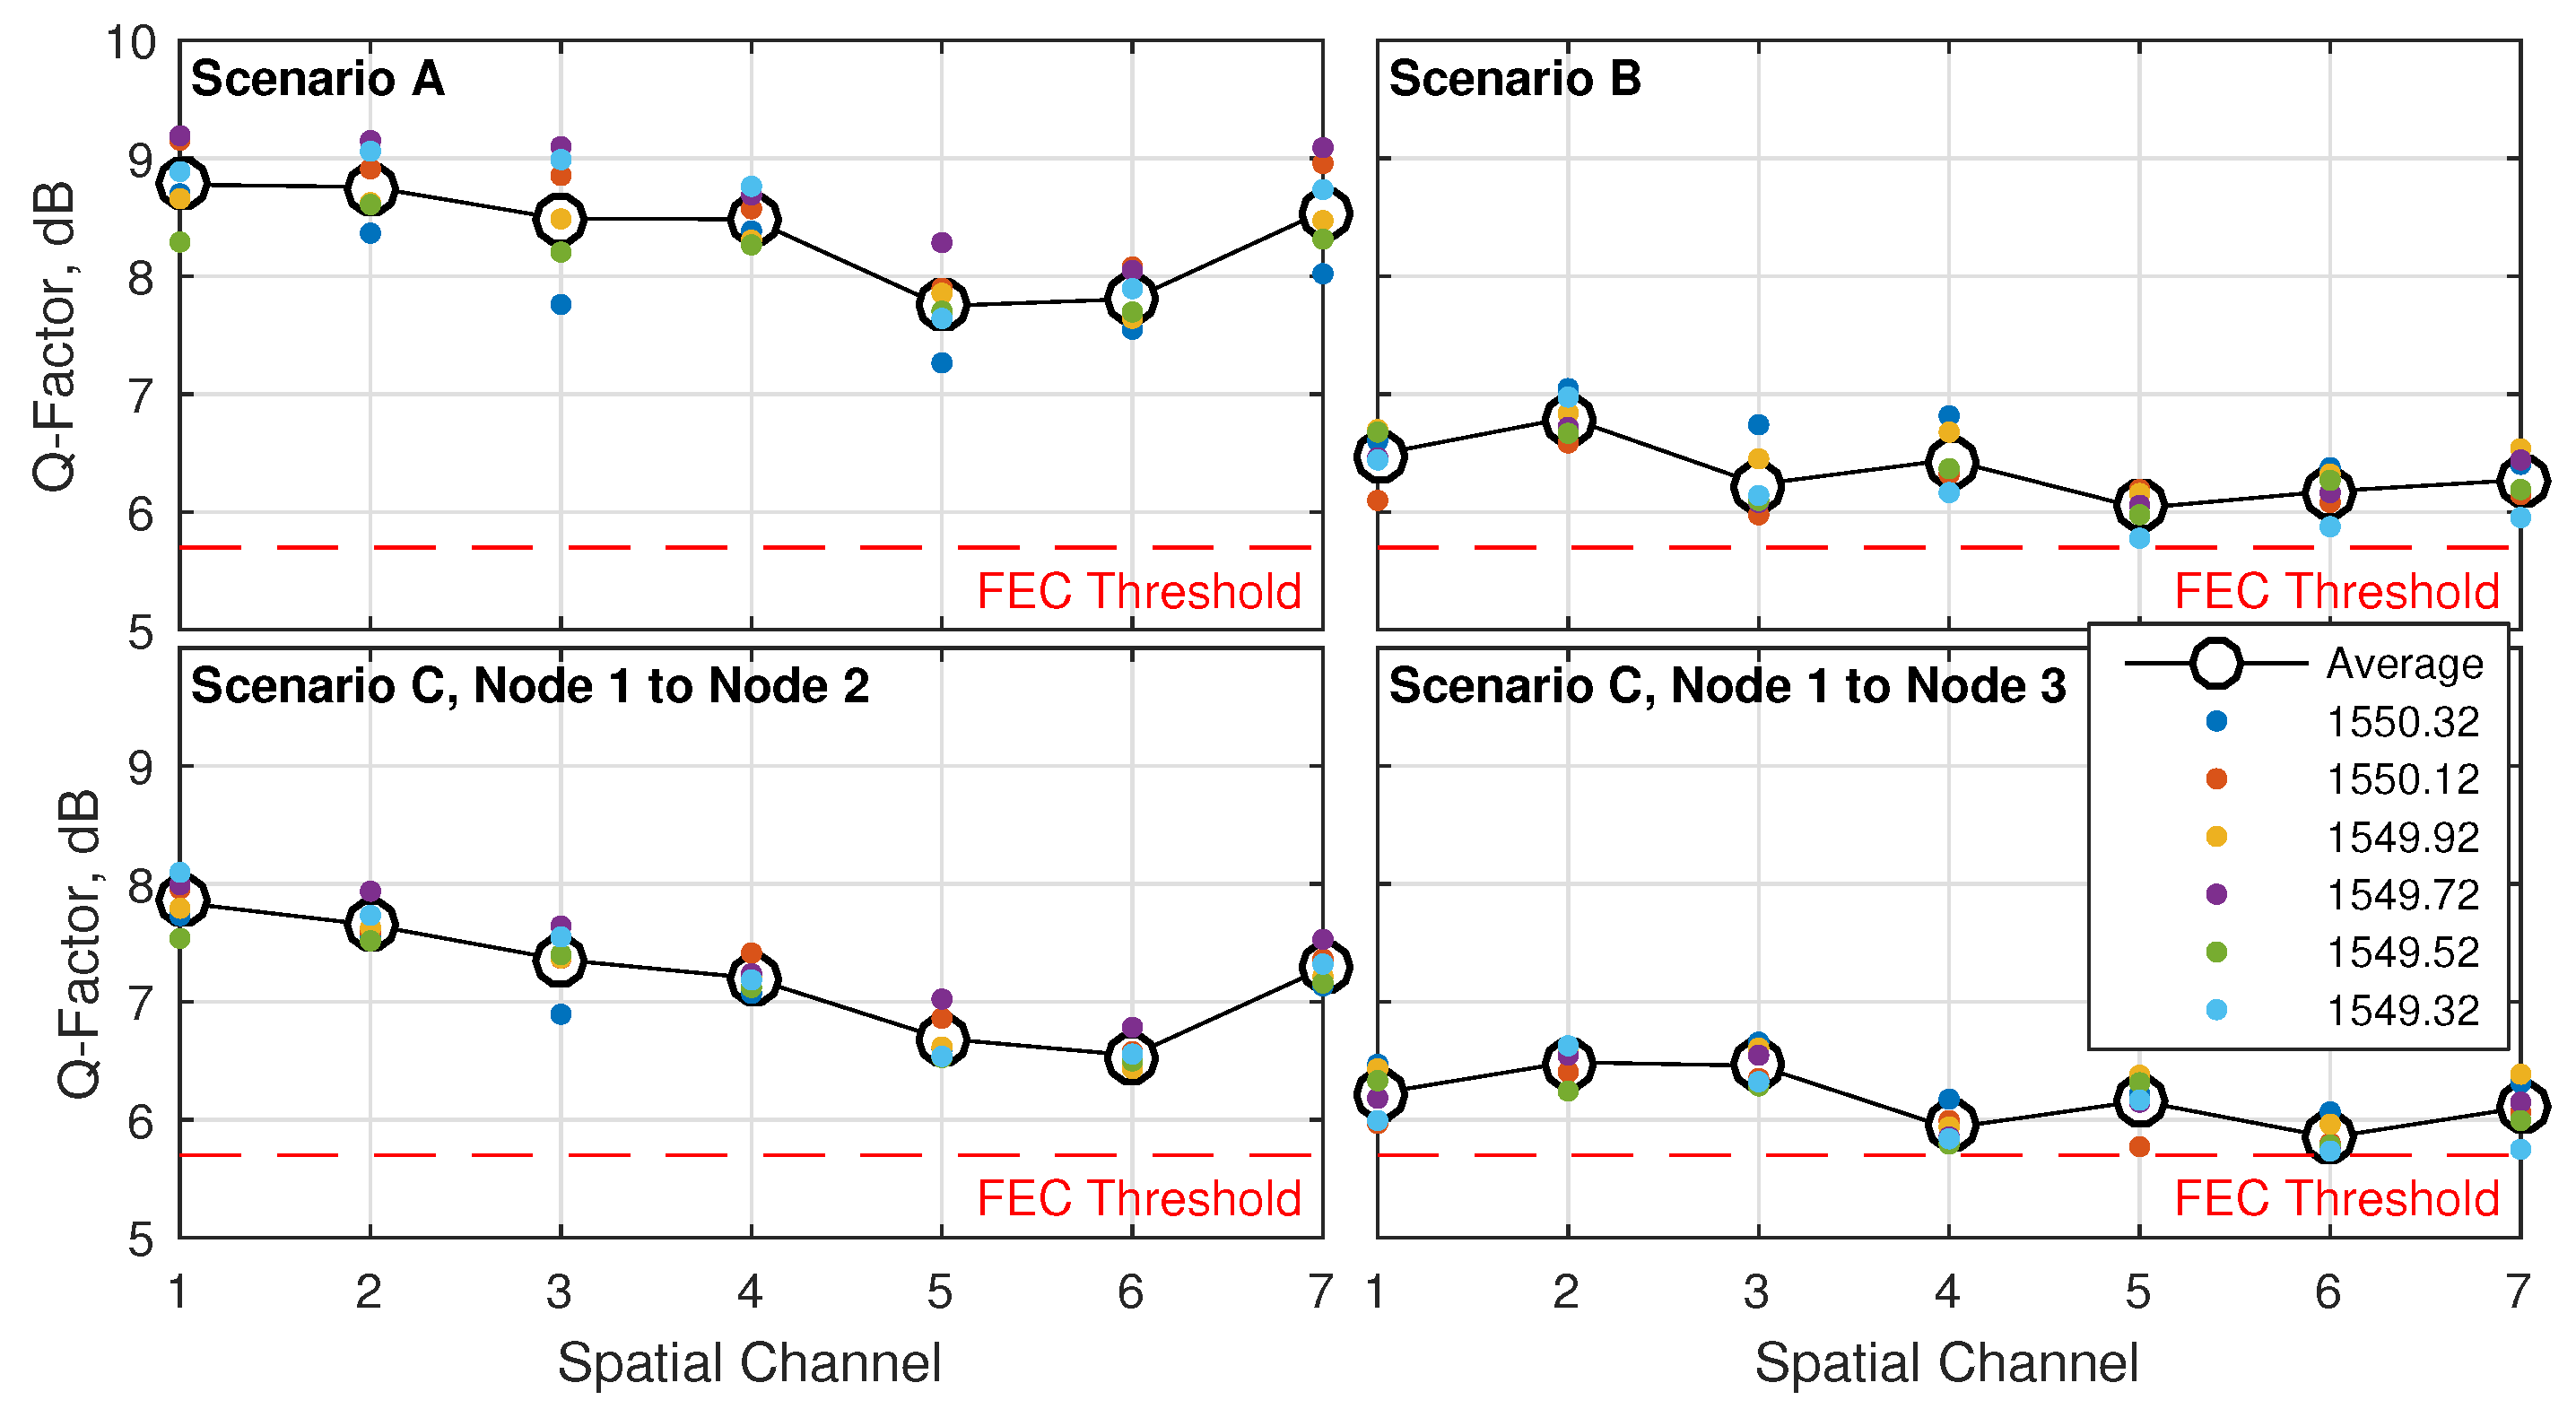
Figure 6 shows the Q-factor estimates for each of the spatial channels comprising the cSSC when implementing scenarios A to C. In the case of scenario A, the performance varied between spatial channels due to the different crosstalk levels imposed by the 30 km MCF onto different cores. This variation was less pronounced in scenario B, where the crosstalk levels on all relevant cores of the 10 km MCF were similar, though substantially higher. Hence, the performance was substantially lower with respect to scenario A. In the case of scenario C, the spatial channels dropped in node 2 had a performance similar to scenario A but with an approximately 1 dB penalty, mainly due to the impact of crosstalk introduced by the joint circuit switch in node 1. Finally, the spatial channels produced in node 1 and dropped at node 3 after multicasting at node 2 had the worst performance, dominated by the crosstalk introduced by the 10 km MCF. Nevertheless, in all cases, the performance exceeded the required forward error correction (FEC) threshold, despite the limited operational margin. This margin could be improved by (i) improving the crosstalk characteristics of the MCF used to connect nodes 2 and 3 and (ii) improving the isolation properties of the joint circuit switch.
Figure 7 shows the performance estimates for the spatial channels comprising the pSSC, assuming the three cases comprising scenario D. These cases are the transmission of packets from node 1 to node 2, the transmission of packets from node 1 to node 3 with forwarding at node 2, and the transmission of packets from node 2 to node 3. For each estimate, we used 108 packets. When transmitting packets from node 1 to node 2, we did not record frame errors with either 1518 byte or 9600 byte packets; hence, we can assume that the frame error rate (FER) was below 10−7. In contrast, the link from node 2 to node 3 was affected by the transient response of the non-burst-mode amplifiers in node 2 as well as electrical issues at the EASW switch in node 2. The impact of power bursts in the amplifiers was particularly strong with 9600 byte packets due to the longer length, resulting in the worst performance. For this reason, we observed FERs up to 10−5 on the link from node 1 to node 3 via node 2, and 10−6 on the link from node 2 to node 3. Nevertheless, all FER values were well below the required 10−4 requirement from ITU-T.
3. Demonstration of Optical Channel Selection
Our hybrid circuit and packet SDM optical network can simultaneously provide various optical channels, such as optical circuit or packet switching or spatial optical circuit or packet switching, which have different network performances (e.g., capacity, packet loss rate or delay) respectively. Basically, it is desirable to select an appropriate optical channel so that users’ QoS requirements can be satisfied. As examples of optical channel usage, optical packet or circuit channels are suitable for best-effort data transfer and priority data transfer, respectively [15]. In this section, we show a method of selecting adequate optical channels associated with QoS requirements in an SDM optical network connected with IP networks and experimentally demonstrate a proof of concept.
Generally, the degree of the QoS requirement is reflected in the value of the packet flow field, e.g., the IP precedence or the differentiated services code point (DSCP) [19] on the IP packet. Therefore, we defined a mapping between the DSCP value of IP packets and optical channels. At the edge node of the SDM optical networks, the DSCP value of the IP packet coming from the client network was analyzed and the user’s IP packet flow was allocated to an appropriate optical channel based on the mapping.
We experimentally demonstrated this method based on the SDM optical network testbed used in the previous experiment (Figure 1 in the previous section). Figure 8 shows the experimental setup. In the optical nodes, we newly added 32 × 32 MEMS switches used as optical circuit switches. In addition, 10 Gb/s and 100 Gb/s optical transponders were connected with circuit switches and 7-core joint circuit switches, respectively. Here, we utilized OpenFlow based networks (OFNs) as client networks (e.g., access, data center, or LAN) and connected them with the SDM optical network testbed. At the edges of OFNs, we introduced OpenFlow switches (OFSs) to allocate flows to optical channels. Here, it is assumed that optical paths to various nodes on each optical channel were preliminarily established.
In this demonstration, we prepared five IP packet flows (labeled packet flow a to e in Figure 9) with different DSCP values. As the DSCP value enlarged, the priority was higher. In addition, the five flows were classified by data type and aggregated into three types. The mapping table for data types, DSCP values of IP packets, and optical channels is shown in Table 1. Here, the optical packet channel and cSSC were allocated to transmit best-effort data and priority data, respectively. Moreover, an optical circuit channel was selected to transfer control messages. The network management system (NMS) set the flow table of OFSs to realize the mapping between the DSCP values of IP packets and optical channels.
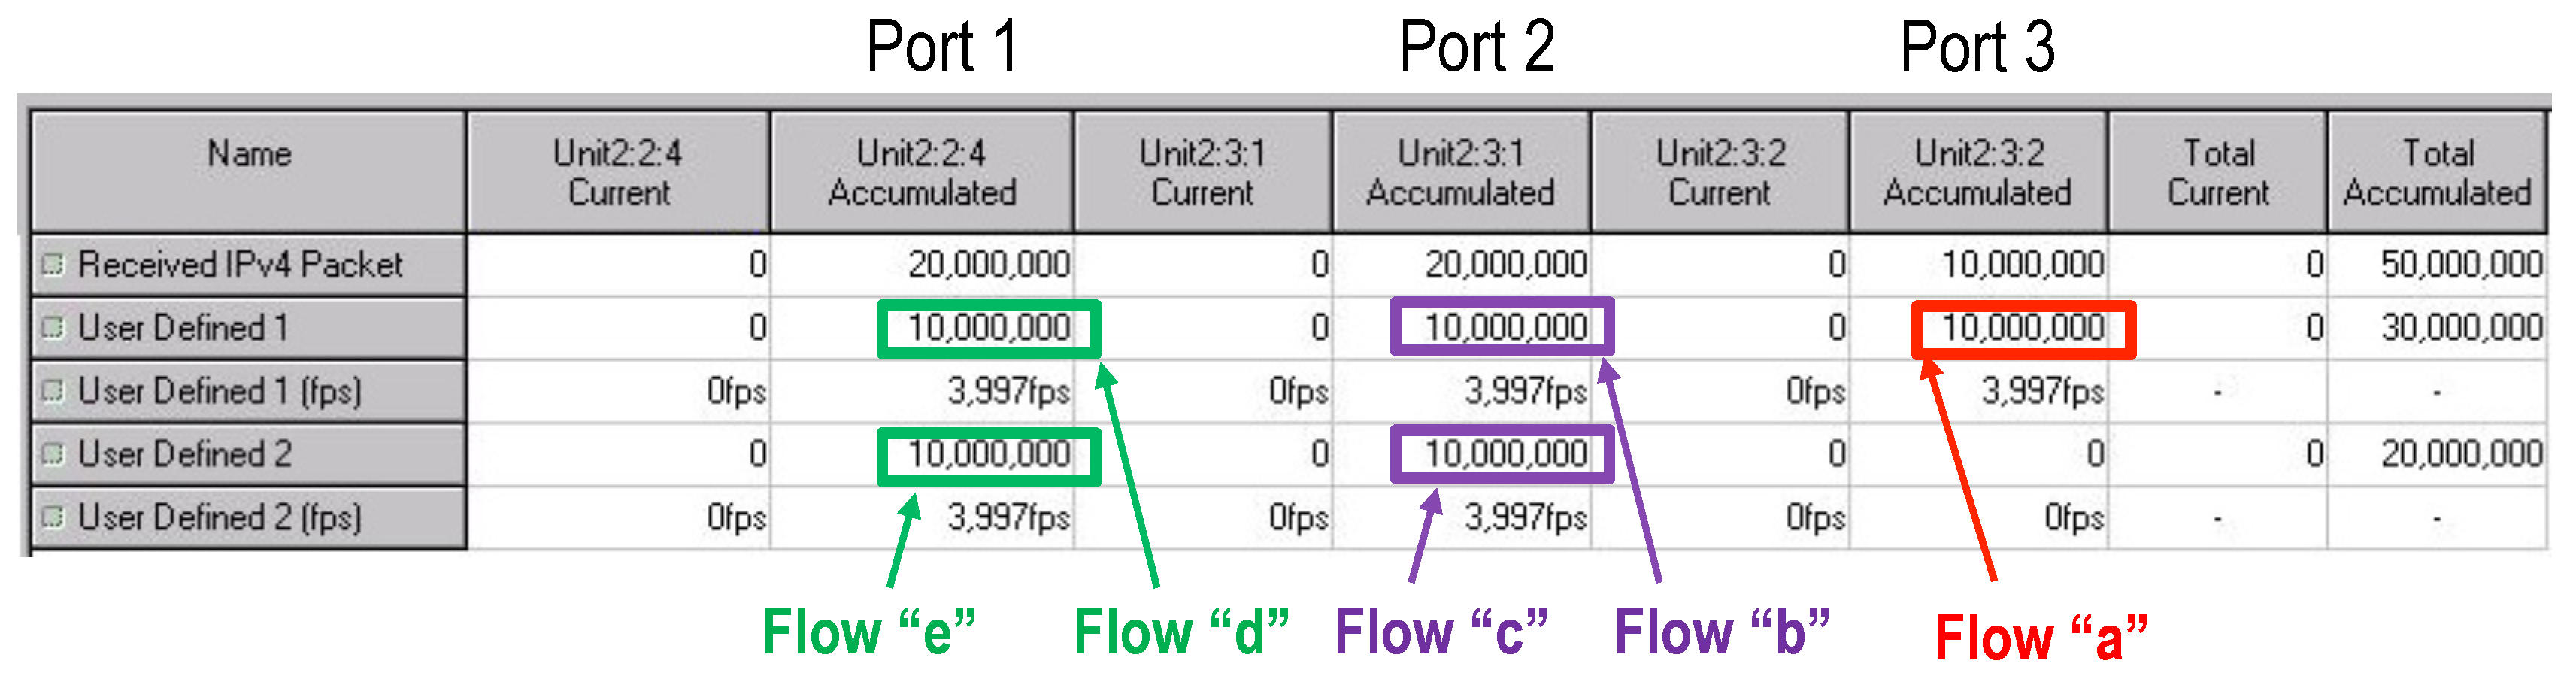
Network tester 1 output five IP packet flows from three Ethernet ports. In each flow, 10,000,000 IP packets were sent out at the bit-rate of 48.5 Mbps. The OFS 1 forwarded each flow to an optical transponder of a selected optical channel (packet, circuit, or cSSC) based on the flow table. The flow table of OFS 1 and 2 is shown in Table 2. The NMS also controlled all switches of optical nodes and set optical paths from node 1 to node 2 on each optical channel in advance. As a result, each flow was transferred by a selected optical channel through optical nodes and received by network tester 2. Here, even if IP packets were transmitted on optical channels, the contents of IP packets were preserved. The Ethernet ports 1, 2, and 3 of the tester were connected to circuit, cSSC, and packet channels, respectively. Figure 9 shows the number of received IP packets at the three ports. The received IP packets were classified by their DSCP values. It was confirmed that each flow was successfully transferred to an appropriate optical channel based on the DSCP value of IP packets. In addition, the IP packet loss rates were below 1 × 10⁻⁷ in all flows.
4. Conclusions
This paper has demonstrated a hybrid circuit and packet switching SDM network testbed. It was shown that packet and circuit switched spatial super channels may co-exist within the same SDM network to provide ultra-high capacity links as well as high-granularity connections. These were enabled by the use of joint spatial circuit switching and joint spatial packet switching. Finally, we evaluated the potential for optical channel selection based on QoS requirements on SDM networks.
Author Contributions
Methodology, R.S.L., G.R., B.J.P., H.F.; Writing—Review & Editing, R.S.L. and H.F.; Project Administration, H.F. and N.W.
Acknowledgments
The authors gratefully acknowledge the invaluable support of the NICT technical staff. In particular, the support towards the execution of the experimental work by Takahiro Hashimoto, Michie Kurihara, Takeshi Makino.
Conflicts of Interest
The authors declare no conflict of interest.
References
- Winzer, P.J.; Neilson, D.T. From scaling disparities to integrated parallelism: A decathlon for a decade. J. Lightwave Technol. 2017, 35, 1099–1115. [Google Scholar] [CrossRef]
- Klonidis, D.; Cugini, F.; Gerstel, O.; Jinno, M.; Lopez, V.; Palkopoulou, E.; Sekiya, M.; Siracusa, D.; Thouénon, G.; Betoule, C. Spectrally and spatially flexible optical network planning and operations. IEEE Commun. Mag. 2015, 53, 69–78. [Google Scholar] [CrossRef]
- Richardson, D.J.; Fini, J.M.; Nelson, L.E. Space-division multiplexing in optical fibres. Nat. Photonics 2013, 7, 354–362. [Google Scholar] [CrossRef] [Green Version]
- Essiambre, R.J.; Tkach, R.W. Capacity trends and limits of optical communication networks. Proc. IEEE 2012, 100, 1035–1055. [Google Scholar] [CrossRef]
- Ryf, R.; Chandrasekhar, S.; Randel, S.; Neilson, D.T.; Fontaine, N.K.; Feuer, M. Physical layer transmission and switching solutions in support of spectrally and spatially flexible optical networks. IEEE Commun. Mag. 2015, 53, 52–59. [Google Scholar] [CrossRef]
- Fini, J.; Zhu, B.; Taunay, T.; Yan, M.; Abedin, K. Statistical models of multicore fiber crosstalk including time delays. J. Lightwave Technol. 2012, 30, 2003–2010. [Google Scholar] [CrossRef]
- Furukawa, H.; Delgado Mendinueta, J.M.; Wada, N.; Harai, H. Spatial and spectral super-channel optical packet switching system for multigranular SDM-WDM optical networks. J. Opt. Commun. Netw. 2017, 9, A77–A84. [Google Scholar] [CrossRef]
- Luís, R.S.; Furukawa, H.; Rademacher, G.; Puttnam, B.J.; Wada, N. Hybrid optical packet and circuit switching in spatial division multiplexing fiber networks. In Proceedings of the 2017 International Conference on Optical Network Design and Modeling (ONDM), Budapest, Hungary, 15–17 May 2017; pp. 1–4. [Google Scholar]
- Luis, R.S.; Furukawa, H.; Rademacher, G.; Puttnam, B.J.; Wada, N. Hybrid circuit and Packet Switching SDM Network Testbed Using Joint Spatial Switching and Multi-Core Fibers. In Proceedings of the 2017 European Conference on Optical Communication (ECOC), Gothenburg, Sweden, 17–21 September 2017; pp. 1–3. [Google Scholar]
- Sakaguchi, J.; Klaus, W.; Puttnam, B.J.; Mendinueta, J.M.D.; Awaji, Y.; Wada, N.; Tsuchida, Y.; Maeda, K.; Tadakuma, M.; Imamura, K.; et al. 19-core MCF transmission system using EDFA with shared core pumping coupled via free-space optics. Opt. Express 2014, 22, 90–95. [Google Scholar] [CrossRef] [PubMed]
- Sakaguchi, J.; Puttnam, B.J.; Klaus, W.; Awaji, Y.; Wada, N.; Kanno, A.; Kawanishi, T.; Imamura, K.; Inaba, H.; Mukasa, K.; et al. 305 Tb/s space division multiplexed transmission using homogeneous 19-core fiber. J. Lightwave Technol. 2013, 31, 554–562. [Google Scholar] [CrossRef]
- Kuo, B.P.P.; Myslivets, E.; Ataie, V.; Temprana, E.G.; Alic, N.; Radic, S. Wideband parametric frequency comb as coherent optical carrier. J. Lightwave Technol. 2013, 31, 3414–3419. [Google Scholar] [CrossRef]
- Chang, D.; Yu, F.; Xiao, Z.; Stojanovic, N.; Hauske, F.N.; Cai, Y.; Xie, C.; Li, L.; Xu, X.; Xiong, Q. LDPC convolutional codes using layered decoding algorithm for high speed coherent optical transmission. In Proceedings of the OFC/NFOEC, Los Angeles, CA, USA, 4–8 March 2012; pp. 1–3. [Google Scholar]
- Furukawa, H.; Mendinueta, J.M.D.; Segawa, T.; Takahashi, R.; Harai, H.; Shinada, S.; Wada, N. 100 Gbps multi-format optical packet and circuit switching node with transparent optical switch and burst-mode amplifier. In Proceedings of the 2015 European Conference on Optical Communication (ECOC), Valencia, Spain, 27 September–1 October 2015; pp. 1–5. [Google Scholar]
- Furukawa, H.; Harai, H.; Miyazawa, T.; Shinada, S.; Kawasaki, W.; Wada, N. Development of optical packet and circuit integrated ring network testbed. Opt. Express 2011, 19, B242–B250. [Google Scholar] [CrossRef] [PubMed]
- Li, S.; Butler, D.; Li, M.J.; Koklyushkin, A.; Nazarov, V.; Khrapko, R.; Geng, Y.; McCollum, R. Bending effects in multicore optical fibers. In Proceedings of the 2013 IEEE Photonics Conference (IPC), Bellevue, WA, USA, 8–12 September 2013; pp. 279–280. [Google Scholar]
- Luis, R.S.; Puttnam, B.; Mendinueta, J.M.; Klaus, W.; Awaji, Y.; Wada, N. Comparing Inter-Core Skew Fluctuations in Multi-Core and Single-Core Fibers; OSA: San Jose, CA, USA, 2015; pp. 1–2. [Google Scholar]
- Saridis, G.M.; Puttnam, B.J.; Luís, R.S.; Klaus, W.; Awaji, Y.; Zervas, G.; Simeonidou, D.; Wada, N. Dynamic skew measurements in 7, 19 and 22-core multi core fibers. In Proceedings of the 2016 21st OptoElectronics and Communications Conference (OECC) Held Jointly with 2016 International Conference on Photonics in Switching (PS), Niigata, Japan, 3–7 July 2016; pp. 1–3. [Google Scholar]
- Nichols, K.; Blake, S.; Baker, F.; Black, D. Definition of the Differentiated Services Field (DS Field) in the IPv4 and IPv6 Headers; IETF RFC 2474; RFC Editor: Cambridge, MA, USA, 1998. [Google Scholar]
Figure 1.
Testbed network structure (a) and channel allocation map (b); three-dimensional structure of the packet spatial super channels (pSSC) (c).
Figure 1.
Testbed network structure (a) and channel allocation map (b); three-dimensional structure of the packet spatial super channels (pSSC) (c).

Figure 2.
Experimental setup for the spatial division multiplexing (SDM) testbed. (a) Simplified structure of the SDM reconfigurable optical add and drop multiplexers (ROADMs). (b) Profiles of the 30 km and 10 km 19-core multi-core fibers (MCFs). (c) Structure of the seven-core joint circuit switch.

Figure 3.
10 Tb/s circuit spatial super channels (cSSC) (a) transmitter and (b) receiver.

Figure 4.
10 Tb/s cSSC (a) Simplified structure of the 1 Tb/s 10-core joining packet switch and 100G packet transponder. (b) Trace of a 64 byte 10GEthernet after mapping into one carrier of one pSSC at the 100G packet transponder.
Figure 4.
10 Tb/s cSSC (a) Simplified structure of the 1 Tb/s 10-core joining packet switch and 100G packet transponder. (b) Trace of a 64 byte 10GEthernet after mapping into one carrier of one pSSC at the 100G packet transponder.

Figure 5.
Inter-core skew (ICS) of the 30 km MCF link for the pSSC. (a) Static ICS and (b) dynamic ICS over a period of 7 h.
Figure 5.
Inter-core skew (ICS) of the 30 km MCF link for the pSSC. (a) Static ICS and (b) dynamic ICS over a period of 7 h.

Figure 6.
Q-factor estimates for each of the spatial channels comprising the cSSC when implementing scenarios A to C.
Figure 6.
Q-factor estimates for each of the spatial channels comprising the cSSC when implementing scenarios A to C.

Figure 7.
FER estimates from the spatial channels composing the pSSC for three cases within scenario D assuming 1518 byte and 9600 byte packets.
Figure 7.
FER estimates from the spatial channels composing the pSSC for three cases within scenario D assuming 1518 byte and 9600 byte packets.

Figure 8.
Experimental setup for the SDM testbed for optical channel selection through quality of service (QoS).
Figure 8.
Experimental setup for the SDM testbed for optical channel selection through quality of service (QoS).

Figure 9.
The number of received IP packets for each DSCP value on Ethernet ports 1, 2, and 3 of network tester 2.
Figure 9.
The number of received IP packets for each DSCP value on Ethernet ports 1, 2, and 3 of network tester 2.


Table 1.
Mapping table for data types, differentiated services code point (DSCP) values of IP packets and optical channels in each IP packet flow.
Table 1.
Mapping table for data types, differentiated services code point (DSCP) values of IP packets and optical channels in each IP packet flow.
| Packet Flow | Type of Data | DSCP Value | Optical Channel | ||
|---|---|---|---|---|---|
| Low | a | Best-effort Data | 0 | optical packet switched | |
| b | Priority Data | 32 | spatial optical circuit switched | ||
| Priority | ↓ | c | 40 | ||
| d | Control Message | 48 | optical circuit switched | ||
| High | e | 56 |
Table 2.
Flow tables of OpenFlow switch (OFS) 1 and OFS 2.
| DSCP Value | OFS 1 | OFS 2 | ||
|---|---|---|---|---|
| Input Port | Output Port | Input Port | Output Port | |
| 0 | 6 | 3 | 3 | 6 |
| 32 | 5 | 2 | 2 | 5 |
| 40 | 4 | 2 | 2 | 5 |
| 48 | 5 | 1 | 1 | 4 |
| 56 | 4 | 1 | 1 | 4 |
© 2018 by the authors. Licensee MDPI, Basel, Switzerland. This article is an open access article distributed under the terms and conditions of the Creative Commons Attribution (CC BY) license (http://creativecommons.org/licenses/by/4.0/).
Share and Cite
MDPI and ACS Style
S. Luis, R.; Furukawa, H.; Rademacher, G.; J. Puttnam, B.; Wada, N. Demonstration of an SDM Network Testbed for Joint Spatial Circuit and Packet Switching †. Photonics 2018, 5, 20. https://doi.org/10.3390/photonics5030020
AMA Style
S. Luis R, Furukawa H, Rademacher G, J. Puttnam B, Wada N. Demonstration of an SDM Network Testbed for Joint Spatial Circuit and Packet Switching †. Photonics. 2018; 5(3):20. https://doi.org/10.3390/photonics5030020
Chicago/Turabian StyleS. Luis, Ruben, Hideaki Furukawa, Georg Rademacher, Benjamin J. Puttnam, and Naoya Wada. 2018. "Demonstration of an SDM Network Testbed for Joint Spatial Circuit and Packet Switching †" Photonics 5, no. 3: 20. https://doi.org/10.3390/photonics5030020
Note that from the first issue of 2016, this journal uses article numbers instead of page numbers. See further details here.