2.1. Structural Characterization
Amorphous Al
43Li
43Y
6Ni
8 powders (P1 and P2), ball-milled in different vials, were chemically analyzed.
Table 1 shows the element concentrations of the composition as well as additional constituent parts of Fe, O and N introduced upon milling through unavoidable wear of the milling tools and powder contamination despite the use of the protective Ar milling atmosphere. The values of O and N are given with reservation due to the high amount of Li, which sprinkles during melting. This behavior might cause the circumstance that the analyzed elements could not be summarized to 100%. For this reason, the amounts of O and N were not analyzed separately by carrier gas hot extraction for powder P2. Fe was brought into powder P1 due to abrasive particles of the milling vials and balls. In order to improve the milling conditions by avoiding abrasive particles the steel vial was replaced by a silicon nitride vial, which is characterized by an extremely low abrasion due to the high hardness of Si
3N
4. Chemical analysis of the material P2 from the silicon nitride vial reveals that this powder does not contain any Fe, but traces of Si. Nevertheless, a high non-metallic content again occurred, similar as observed for the powder milled in steel vials.
Table 1.
Chemical composition of amorphous and annealed Al43Li43Ni8Y6 powders. Since the amount of elements in wt.% cannot be summarized to 100%, it is not possible to give the amount in at.%. The standard deviation is 0.3 wt.%.
Table 1.
Chemical composition of amorphous and annealed Al43Li43Ni8Y6 powders. Since the amount of elements in wt.% cannot be summarized to 100%, it is not possible to give the amount in at.%. The standard deviation is 0.3 wt.%.
| Element | Theoretical composition | Powder P1 (steel vial) | Powder P2 (silicon nitride vial) |
|---|
| Amount [wt.%] | Amount [wt.%] | Amount [wt.%] |
|---|
| Al | 47.13 | 27.08 | 31.4 |
| Li | 12.12 | 8.82 | 9.3 |
| Ni | 19.07 | 11.13 | 11.7 |
| Y | 21.67 | 7.37 | 11.2 |
| Fe | - | 15.42 | traces |
| Si | - | - | 0.8 |
| ∑ | 100 | 69.82 | 64.4 |
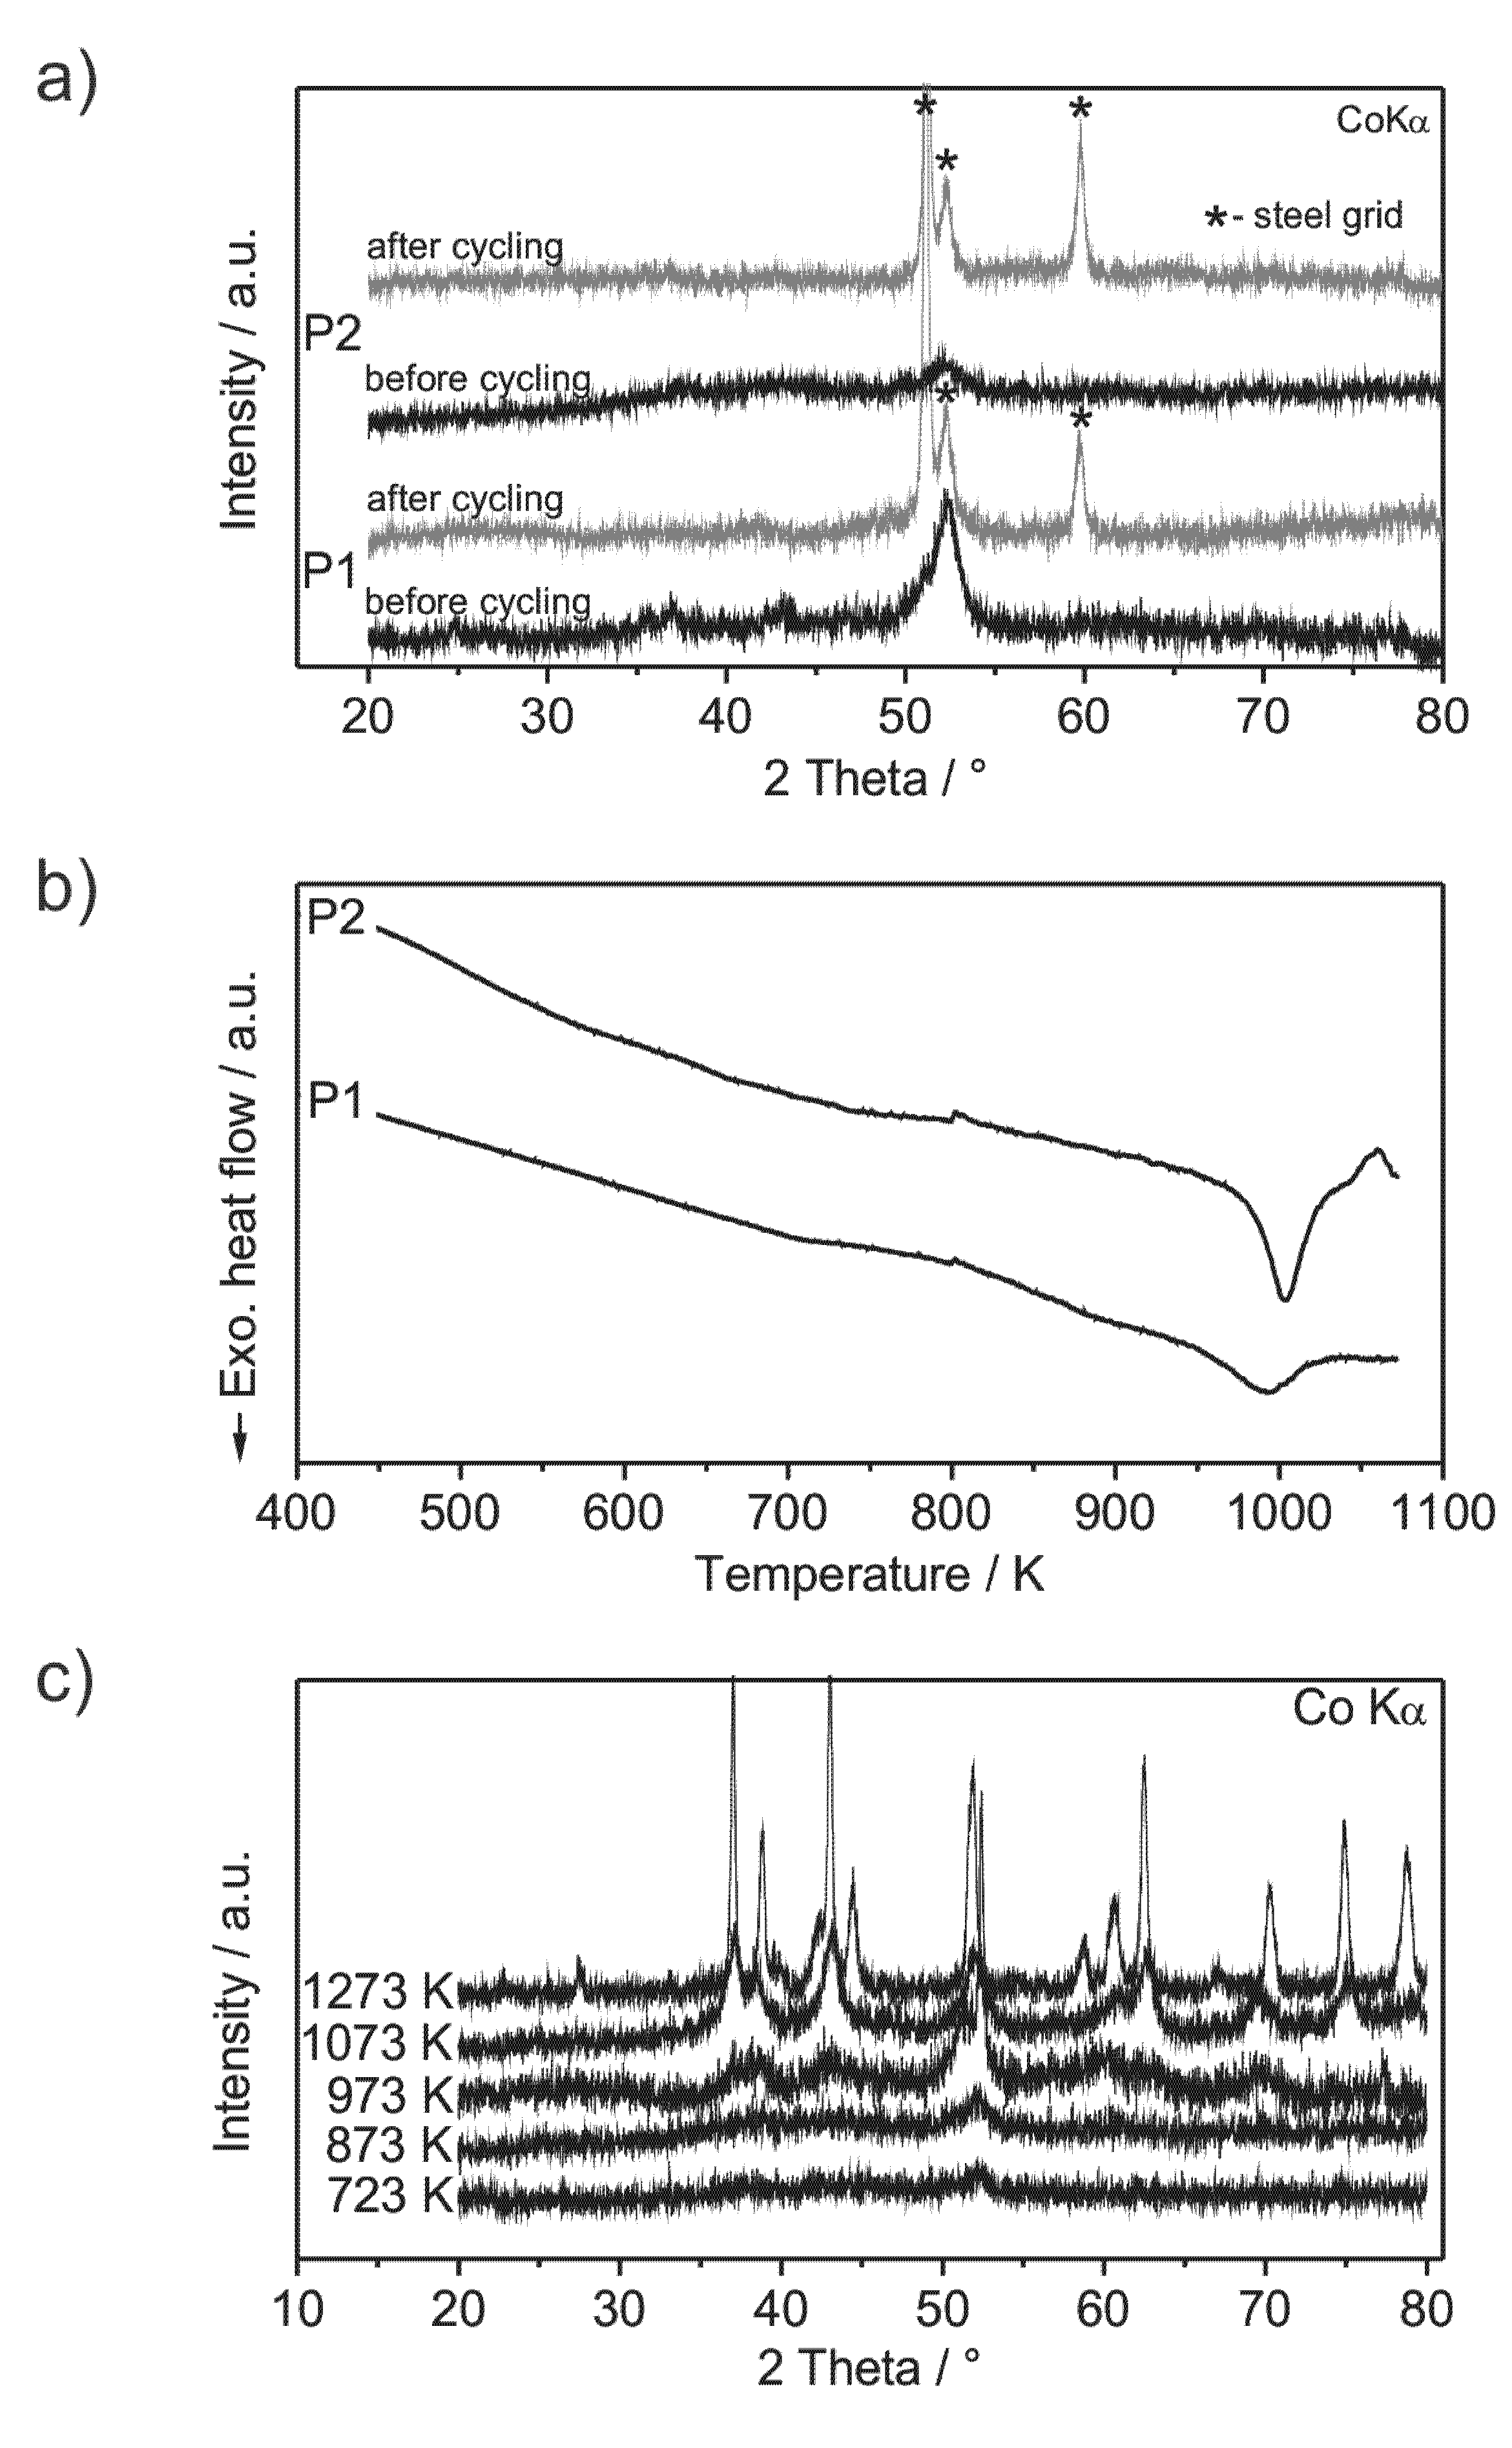
Analysis of the crystallinity of the milled compounds was performed by XRD (X-ray diffractometry) before and after cycling and by DSC (
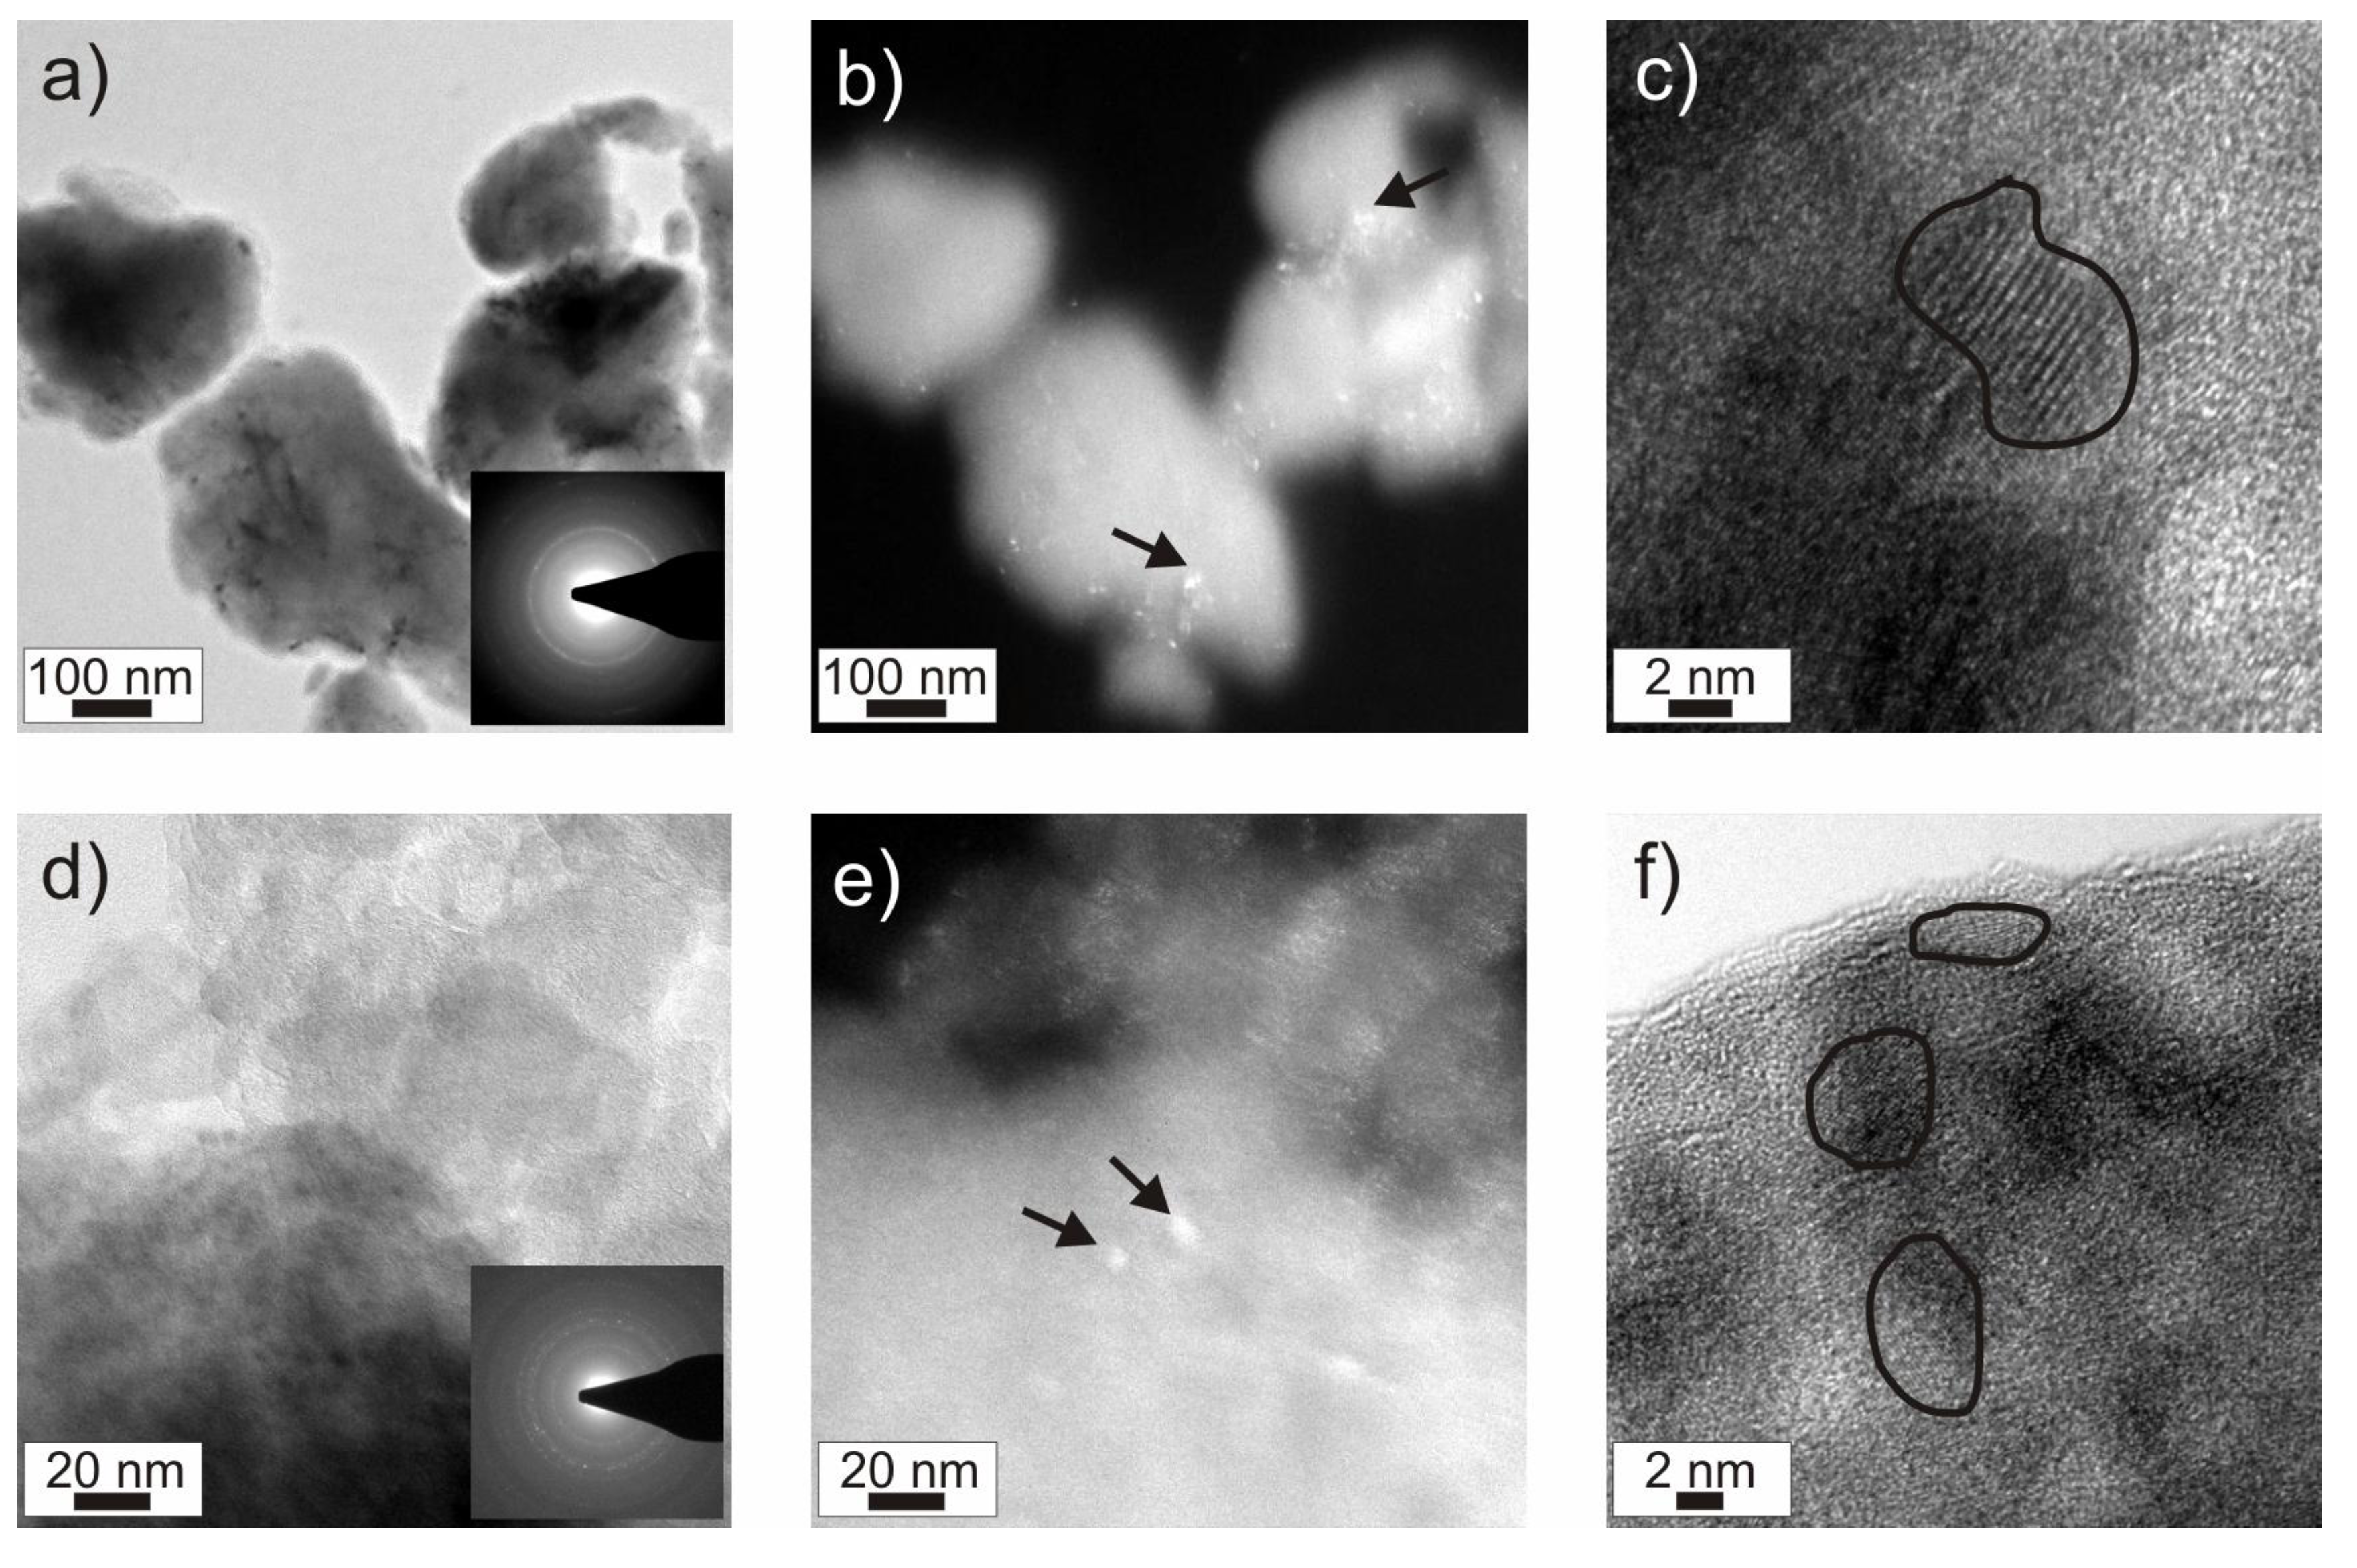
Figure 2a,b). The XRD patterns show very low intensities of broad reflections, which are more distinctive in the case of powder P1. This indicates the powders to be almost non-crystalline. TEM (transmission electron microscopy) pictures of powder P1 show low amounts of nanocrystals with sizes of about 5 nm embedded in an amorphous matrix (
Figure 3). The nanocrystals were analyzed to be AlY
3, Li, Ni, NiO and AlYO
3 by electron diffraction (marked by black arrows in
Figure 3b,e). Other phases may be present, but could not unambiguously excluded. The DSC curves (
Figure 2b) show exothermic events at 990 K for powder P1 and at 1000 K for powder P2, which are attributed to the crystallization of the amorphous fraction of the powder. Compared to amorphous powders with similar compositions (Al
86Ni
8Y
6 and Al
86Ni
8La
6) without Li the observed crystallization temperatures are strongly increased by ∆
T ≈ 470 K and 520 K, respectively [
13]. This may be caused by the addition of the 4th compound element, which leads to a more complicated phase formation process or the high amount of non-metal elements. In general, Al-based compositions with Al contents between 85 at.% and 92 at.% initiate crystallization in the temperature range of 470 K ≤
T ≤ 520 K and contain two to three crystallization steps in dependence of the constitution [
18,
19,
20]. In the binary system Al-Li, present as amorphous material, three exothermic events with low energies are observed which are associated with relaxation processes [
21]. These exothermic peaks disappear with increasing milling time indicating a suppressed relaxation due to the highly developed framework of the amorphous material. Up to 990 K Al
43Li
43Y
6Ni
8 no exothermic events typical for relaxation processes, nor an exothermic event assignable to the beginning of a phase formation process as observed for Li-free Al-based amorphous alloys are detected [
18,
19,
20]. However, at 990 K a phase formation process is induced in contrast to the Al-Li system where no phase formation occurs until melting [
21].
Figure 2c supports the absence of crystalline phases at temperatures below 990 K. The presence of O and N does not worsen the amorphization process as observed especially for powder P2. Si and Fe are frequently used alloying constituents in bulk metallic glasses, which demonstrate their compatibility as ingredients of amorphous alloys [
22,
23].
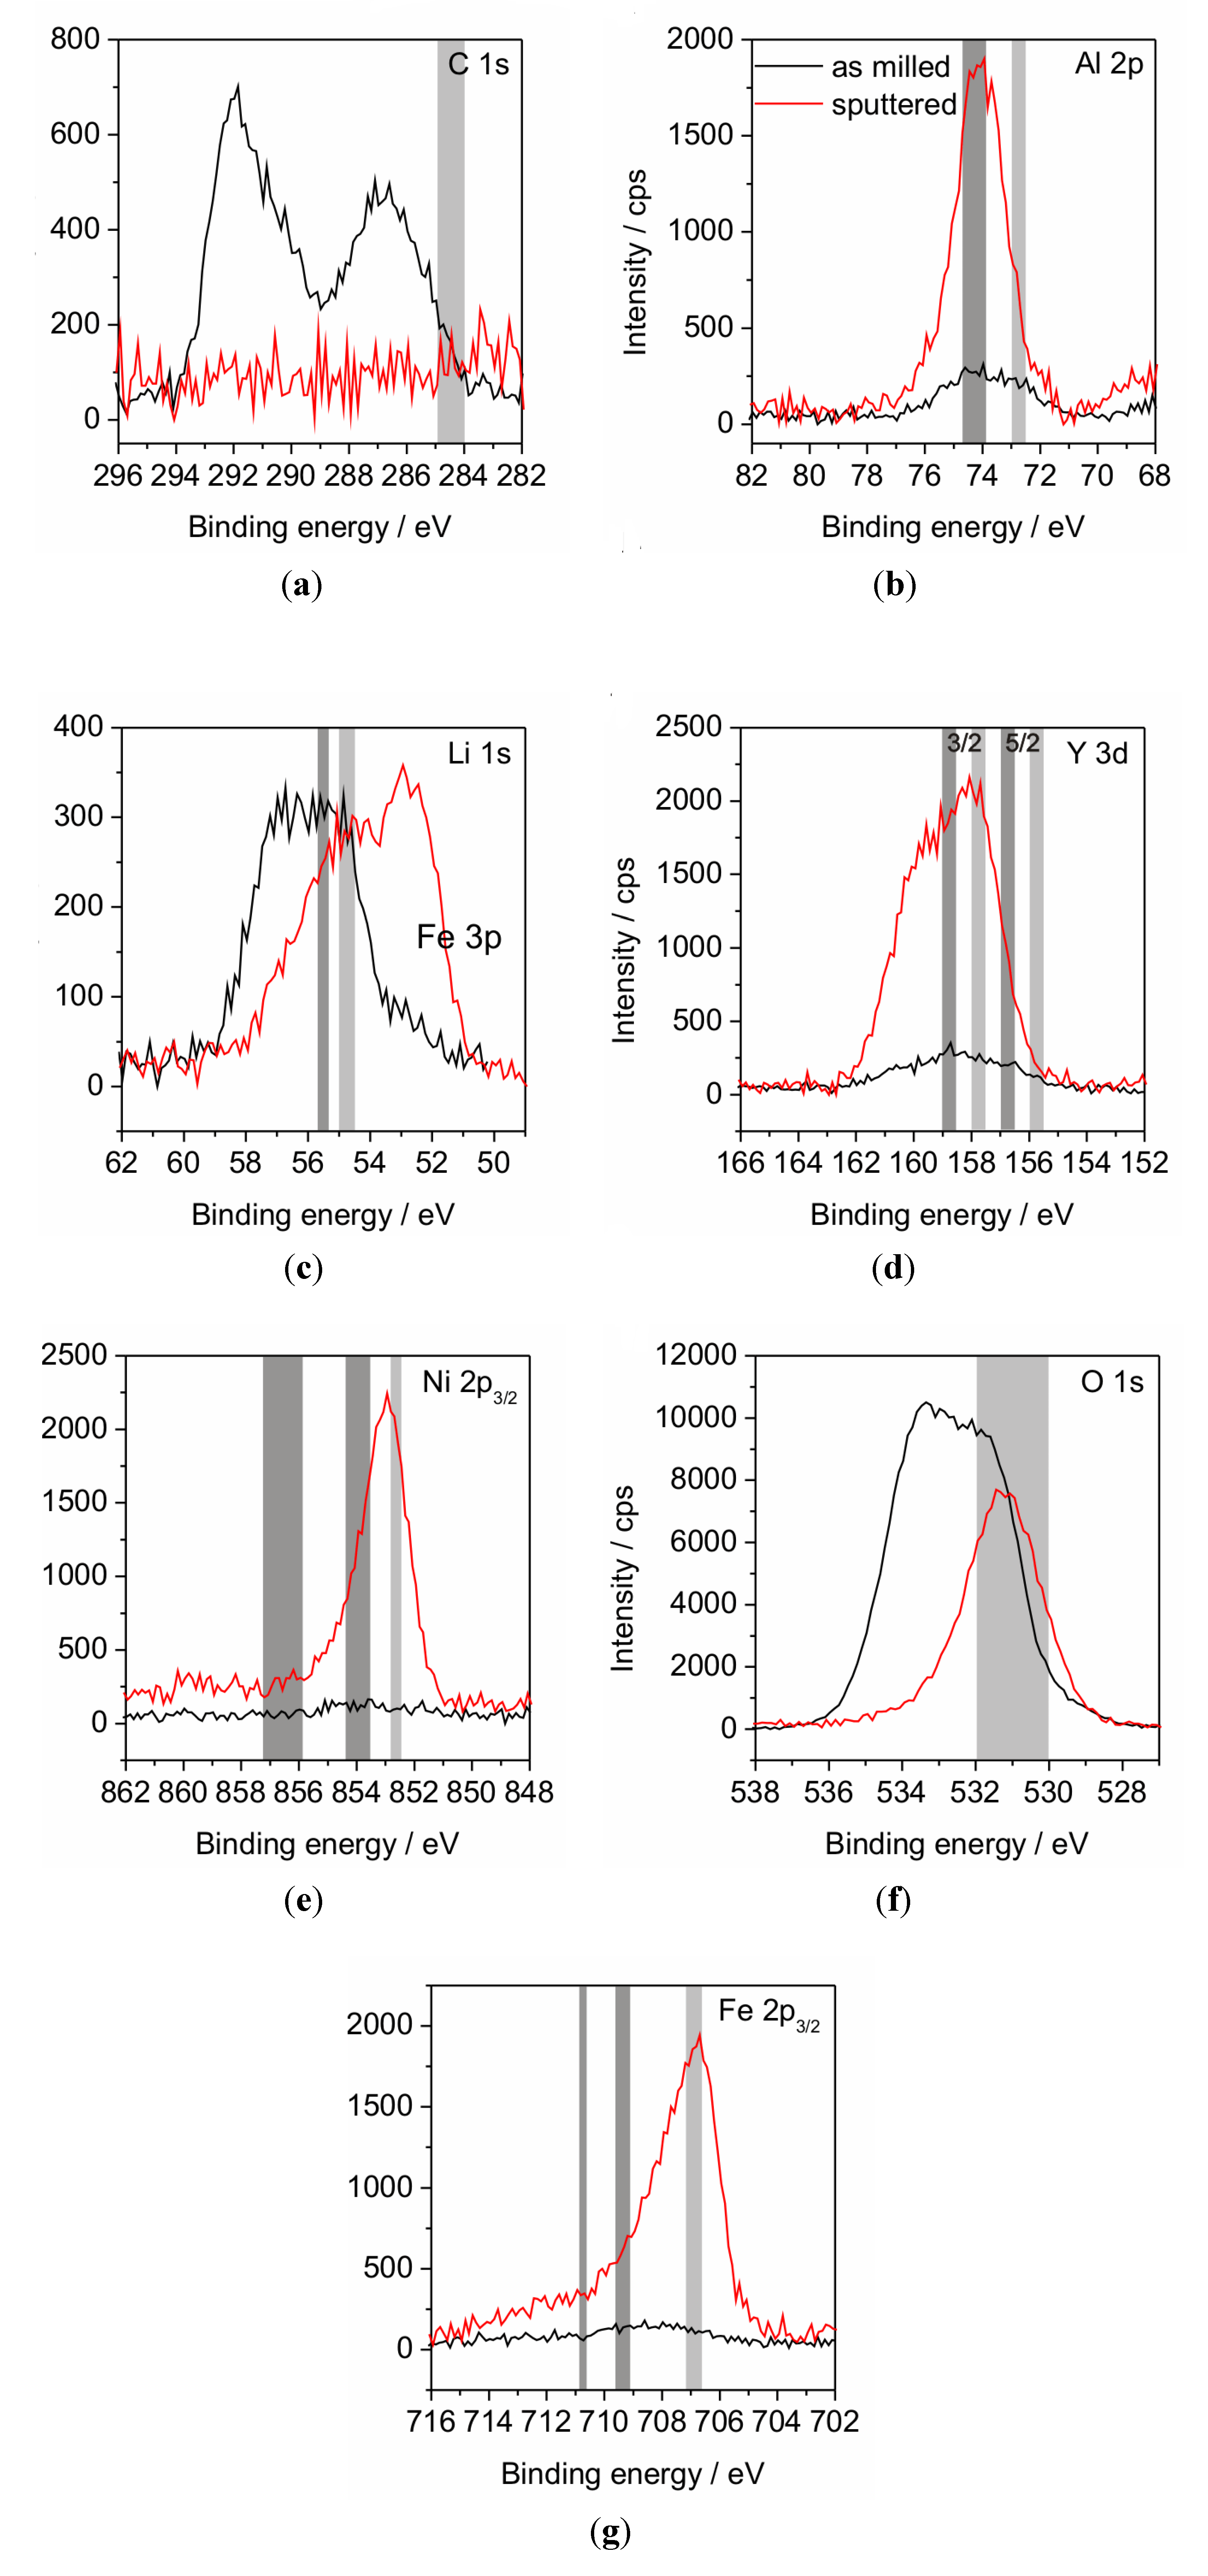
XPS investigations were performed in order to analyze the binding states of the compound elements (
Figure 4 and
Figure 5). It was observed that the surface layer of the powder mostly consists of Li- and C-compounds. Al, Y, Ni and Fe in oxidic or metallic states are hardly present (
Table 2) at the surface. As a consequence, subsequent sputtering was performed in order to eliminate this surface layer. Although sputtering obtained the appearance of the other alloy elements, the achieved depth of about 100 nm is still within a surface-near area since the atom concentration after sputtering deviates from the chemical analysis (
Table 1). A further point to be noted is the impossibility to detect the N, because the relevant BE area is overlapped by the BE of Y which may lead overestimation of the Y amount in case of high nitrogen concentration. The critical point of XPS analysis of material with low electrical conductivity, as our partly oxidized powders, is the occurrence of peak shifts due to surface charging and the demand for correcting the binding energy (BE) scale. In general, mostly C from the adventitious carbon contamination is chosen as reference element at a binding energy of around 284.5 to 285.0 eV. Though, if the herein presented results would be referenced to this value, all of the metallic elements would be present in their metallic states, which is not possible due to the significant amount of O. Furthermore, the Fe line would be situated at much lower BE than any known position [
24]. That requires the consideration which state is the most expected. Due to their high O-affinity Al and Y are estimated to be present as oxides. Y is not suited as reference since the binding state shows a doublet and the BEs of elemental and oxide lines of this doublet are closely spaced. Assuming Al to be present in its oxide state is assisted by the peak position of O in the sputtered state, which is related to Al
2O
3 (
Figure 4f and
Figure 5f). Obviously, at the surface (as-milled state) other oxides, maybe Li
2O, are present. Taking the spectra of all observed elements into account, it was decided to reference the measurements to Al
2O
3 at a BE of 74.0 eV (
Figure 4b and
Figure 5b). This referencing is also supported by the fact that only in this case the valence band cut-off in the samples is at 0 eV. From this point a BE-shift for C 1s to 287.0 eV occurs (
Figure 4a and
Figure 5a), which has not been discussed in the literature. Nevertheless, other Li-including systems are also found to show similar BE shifts of the C contamination [
25]. Otherwise this is still under discussion, nevertheless, already Hoenigman pointed out such a reference level problem between his
in situ deposited Li films with respect to C-reference sputter-cleaned material [
26]. The evaluation of Li is also critical due to the close BE positions of the elemental and oxide lines (
Figure 4c and
Figure 5c). Powder P2 is assumed to contain Li mainly in its oxide state, both in the as-milled and in the sputtered state. In the case of powder, P1 the Li 1s binding energy peak of the as-milled state is very broad. The sputtered state also shows another difficulty by the overlap of the Fe 3p line with the Li 1s position. Both circumstances disallow further conclusions. Besides the noted difficulties concerning the closely spaced doublet lines the evaluation of the Y is ambiguous since their BEs are located at around 1 eV higher energy levels (
Figure 4d and
Figure 5d) than in Y
2O
3, however, this shift definitely points to Y in oxide form [
24]. The presence of Ni-oxides can be excluded since the characteristic losses, which should then occur at 862 eV are missing [
24]. In the case of Fe the detection of Fe-oxides is more complicated, since characteristic energy losses are weakly pronounced and therewith are not clearly detectable.
However, the referencing of such a multicomponent system is nontrivial. Moreover, in a complex amorphous system as presented, the bonding relation of O is hard to compare to crystalline oxides, which we had to use as basis for discussion of the observed BEs. For this reason conclusions have to be drawn critically. It is curious that no metallic BE lines are visible for Al, Li and Y, because the amount of O (
Table 2) is insufficient for a complete oxidation of those elements. Building their first or solely oxidation states Al
2O
3, Li
2O, Y
2O
3, (FeO and NiO), respectively, would require an O-content of about 50 at.% taking into account that Ni and Fe are partially metallic which may balance the O-demand of Y. Al and Li exist in equal parts meaning that each metallic atom requires one O-atom. As further signs for the existence of metallic parts, the broadening of the Li-peak (powder P1) has to be noticed. In addition, the TEM investigation indicates a certain amount of metallic phases (Al
3Y, Li, Ni) as verified by electron diffraction. Nevertheless, we suppose the mentioned stable oxide-like peak position as a specific property of our amorphous compound and the oxygen deficiency as hint for metallic-like parts, especially when keeping in mind that the real bulk has not yet reached by sputtering of the µm-shaped particles.
Table 2.
Atomic concentration table of the XPS measurement.
Table 2.
Atomic concentration table of the XPS measurement.
| Electron shell | Powder P1 (steel vial) | Powder P2 (silicon nitride vial) |
|---|
| As-milled | Sputtered | As-milled | Sputtered |
|---|
| Amount [at.%] | Amount [at.%] | Amount [at.%] | Amount [at.%] |
|---|
| Li 1s | 39.99 | 50.22 | 37.49 | 23.67 |
| C 1s | 8.81 | 0.00 | 8.29 | 0.66 |
| O 1s | 47.13 | 23.80 | 48.06 | 39.33 |
| Al 2p | 3.30 | 18.71 | 5.28 | 29.04 |
| Fe 2p3/2 | 0.24 | 2.64 | - | - |
| Ni 2p | 0.06 | 1.02 | 0.13 | 1.69 |
| Y 3d | 0.46 | 3.16 | 0.74 | 5.60 |
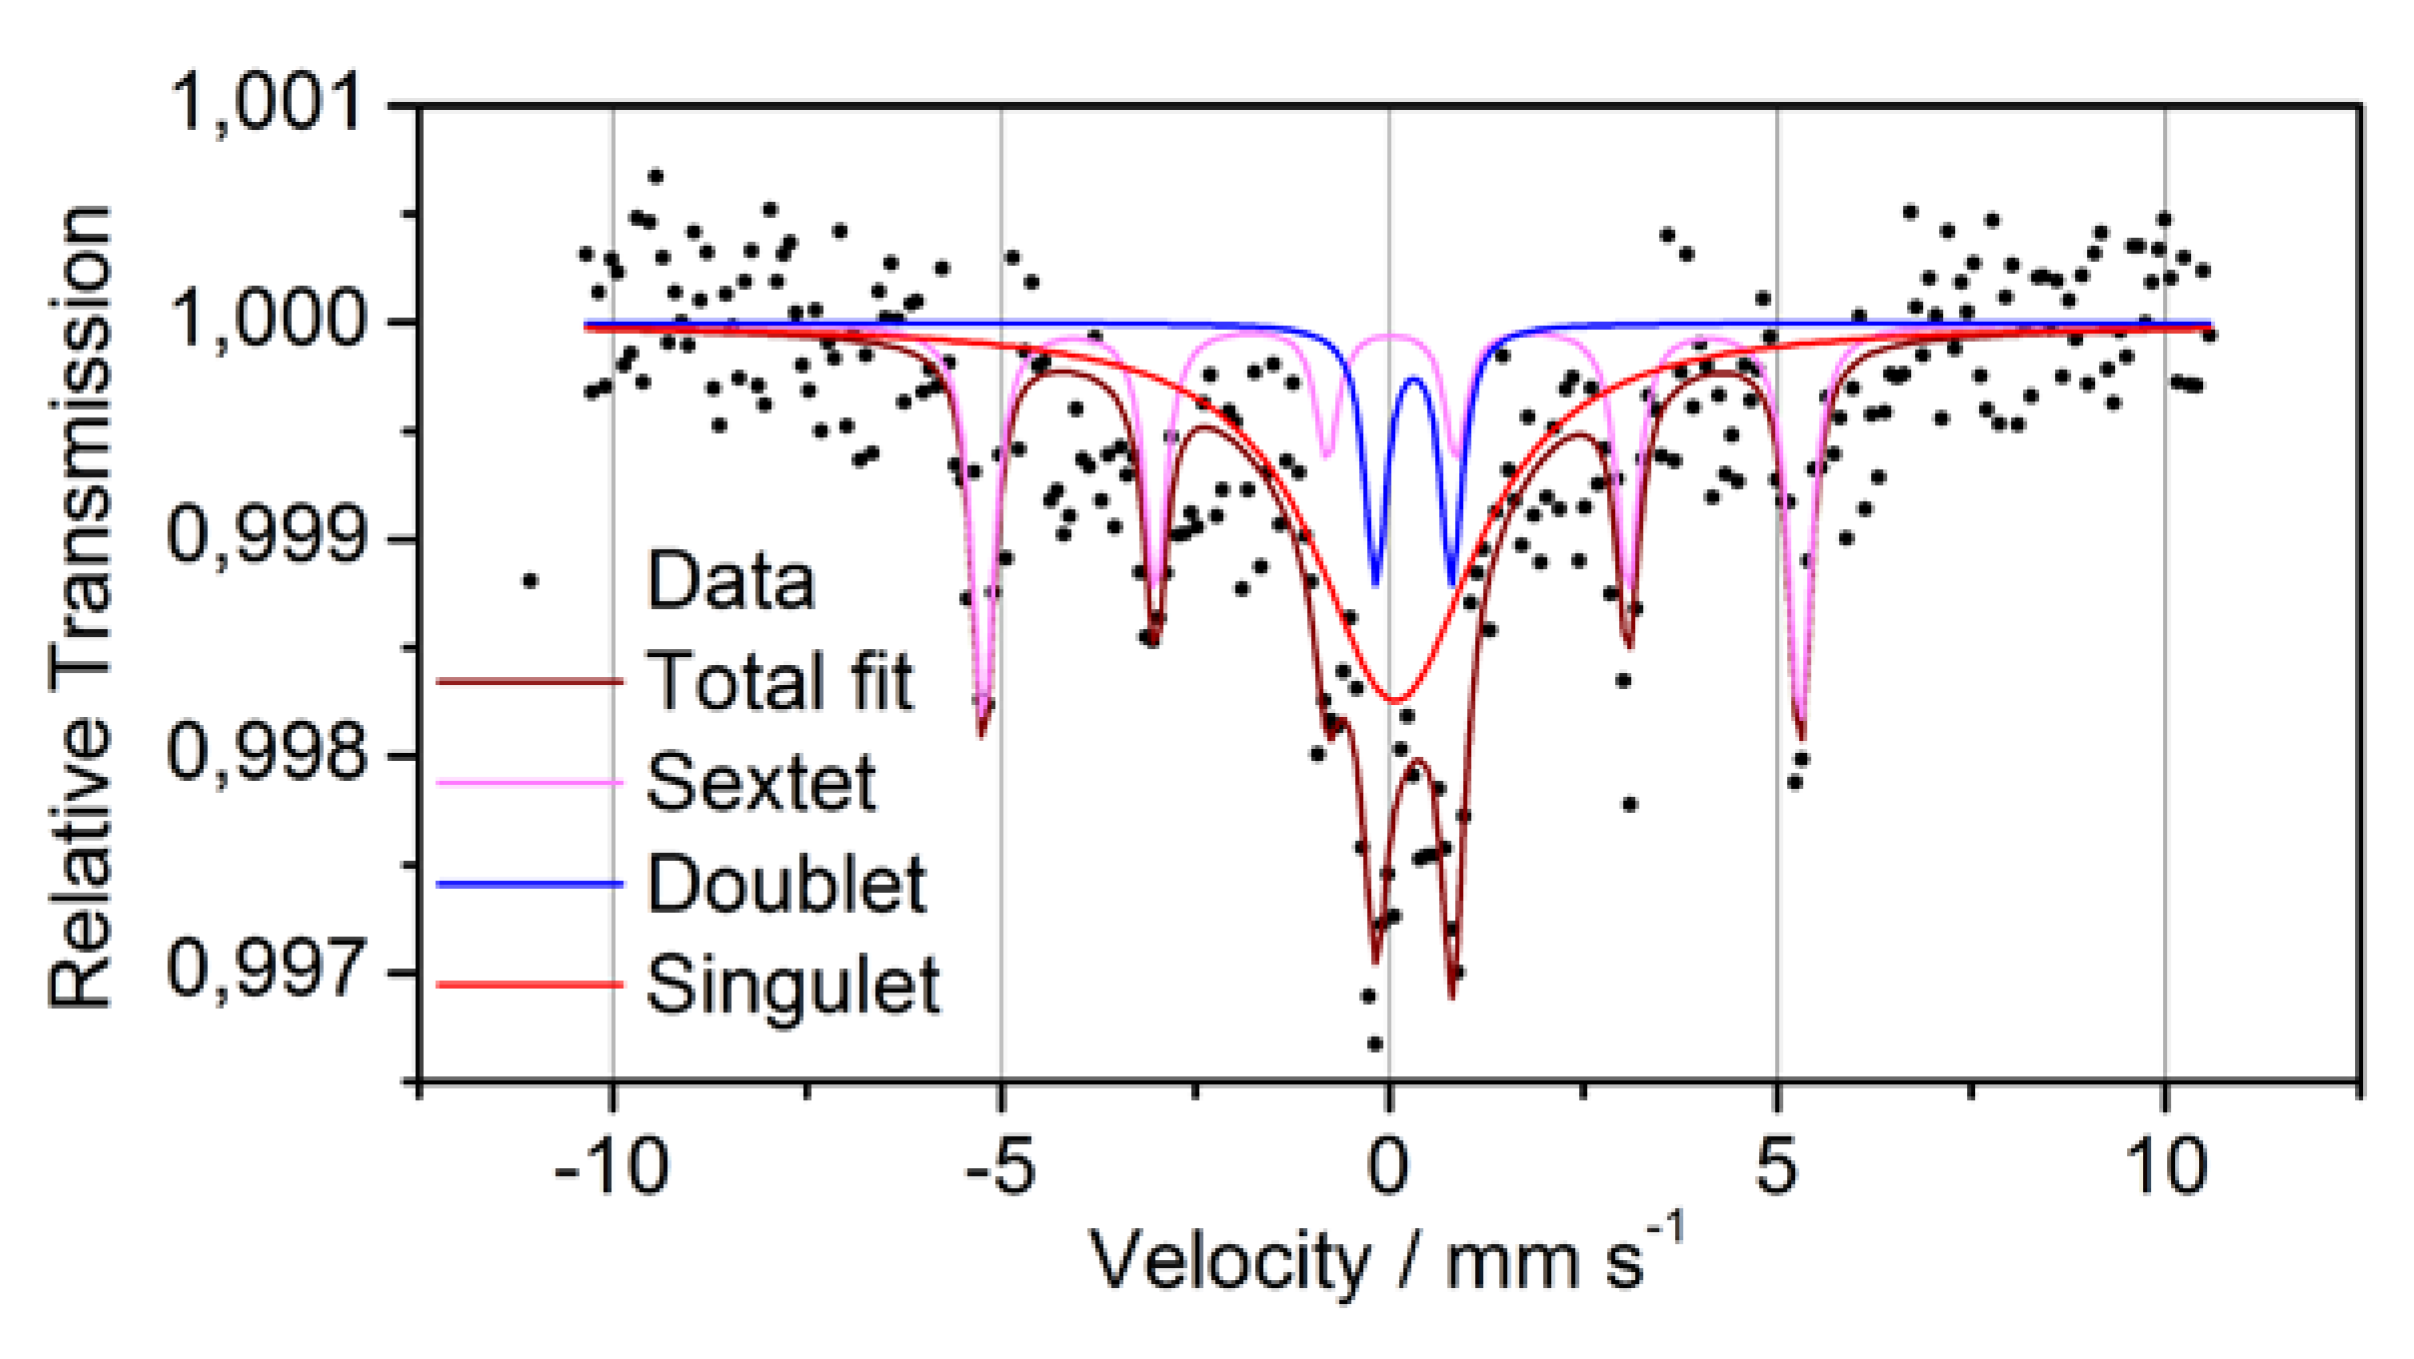
In order to clarify the oxidation state of Fe more precisely as it was possible by XPS, transmission Mössbauer spectroscopy was performed (
Figure 6 and
Table 3). The Mössbauer spectrum consists of a sextet, a paramagnetic doublet and a strong background symmetrically to the zero velocity. Because of its hyperfine parameters, the sextet can definitely be attributed to metallic α-Fe. The doublet has to be ascribed to bonded Fe
3+. This Fe may be either oxidized or bonded to another matrix element. The third subspectrum, the strong background, may originate from superparamagnetic Fe,
i.e., Fe in small nanometer-sized clusters with varying diameter and/or composition. The statistics of the measurement and the broadening of the related peak, however, does not allow to distinguish further between these sites. Moreover, it was found that the majority of
57Fe atoms do not give a coherent signal,
i.e., they are located at sites with largely varying local geometry. This corroborates the assumption of a relatively homogeneous intermixture of the components, as sketched in
Figure 1.
Table 3.
Mössbauer data for powder P1.
Table 3.
Mössbauer data for powder P1.
| Line | Isomer shift relative to α-Fe | Magnetic hyperfine field (α-Fe: 33T) | Quadrupole splitting | Areal fraction | Interpretation |
|---|
| Sextet | 0.03 mm/s | 32.6 T | - | 33% | ferromagnetic α-Fe |
| Doublet | 0.32 mm/s | 0 T | 0.98 mm/s | 10% | Fe3+ |
| Singulet | 0.08 mm/s | 0 T | - | 57% | Superparamagnetic metallic Fe |
Figure 2.
(a) XRD patterns of ball milled Al43Li43Ni8Y6 powders: P1 (steel milling vial) and P2 (silicon nitride milling vial) before and after cycling; (b) DSC curves of the powders P1 and P2 (heating rate 20 K/min); (c) XRD patterns of powder P2, annealed by DSC. Annealing at 1273 K is carried out within a furnace in a sealed Ta-crucible, because the melting temperature of the mandatory silver foil limits the applicability of DSC.
Figure 3.
TEM investigation of powder P1 (a–c: as-milled; d–f: after galvanostatic cycling): (a,d) Brightfield images showing typical powder particles (inserted: diffraction patterns); (b,e) Darkfield images: The bright spots indicate nanocrystals, some of them are marked by arrows); (c,f) High resolution micrographs showing some of the nanocrystals indicated by visible lattice fringes (highlighted by black lines).
Figure 4.
XPS diagrams of powder P1 including the binding energy lines of the elements C (
a), Al (
b), Li (
C), Y (
d), Ni (
e), O (
f) and Fe (
g). The grey areas mark the theoretic energy ranges as referenced by Moulder
et al. [
24]. The right, light grey areas indicate the position of the elemental line; left positioned, dark grey areas indicate oxide states.
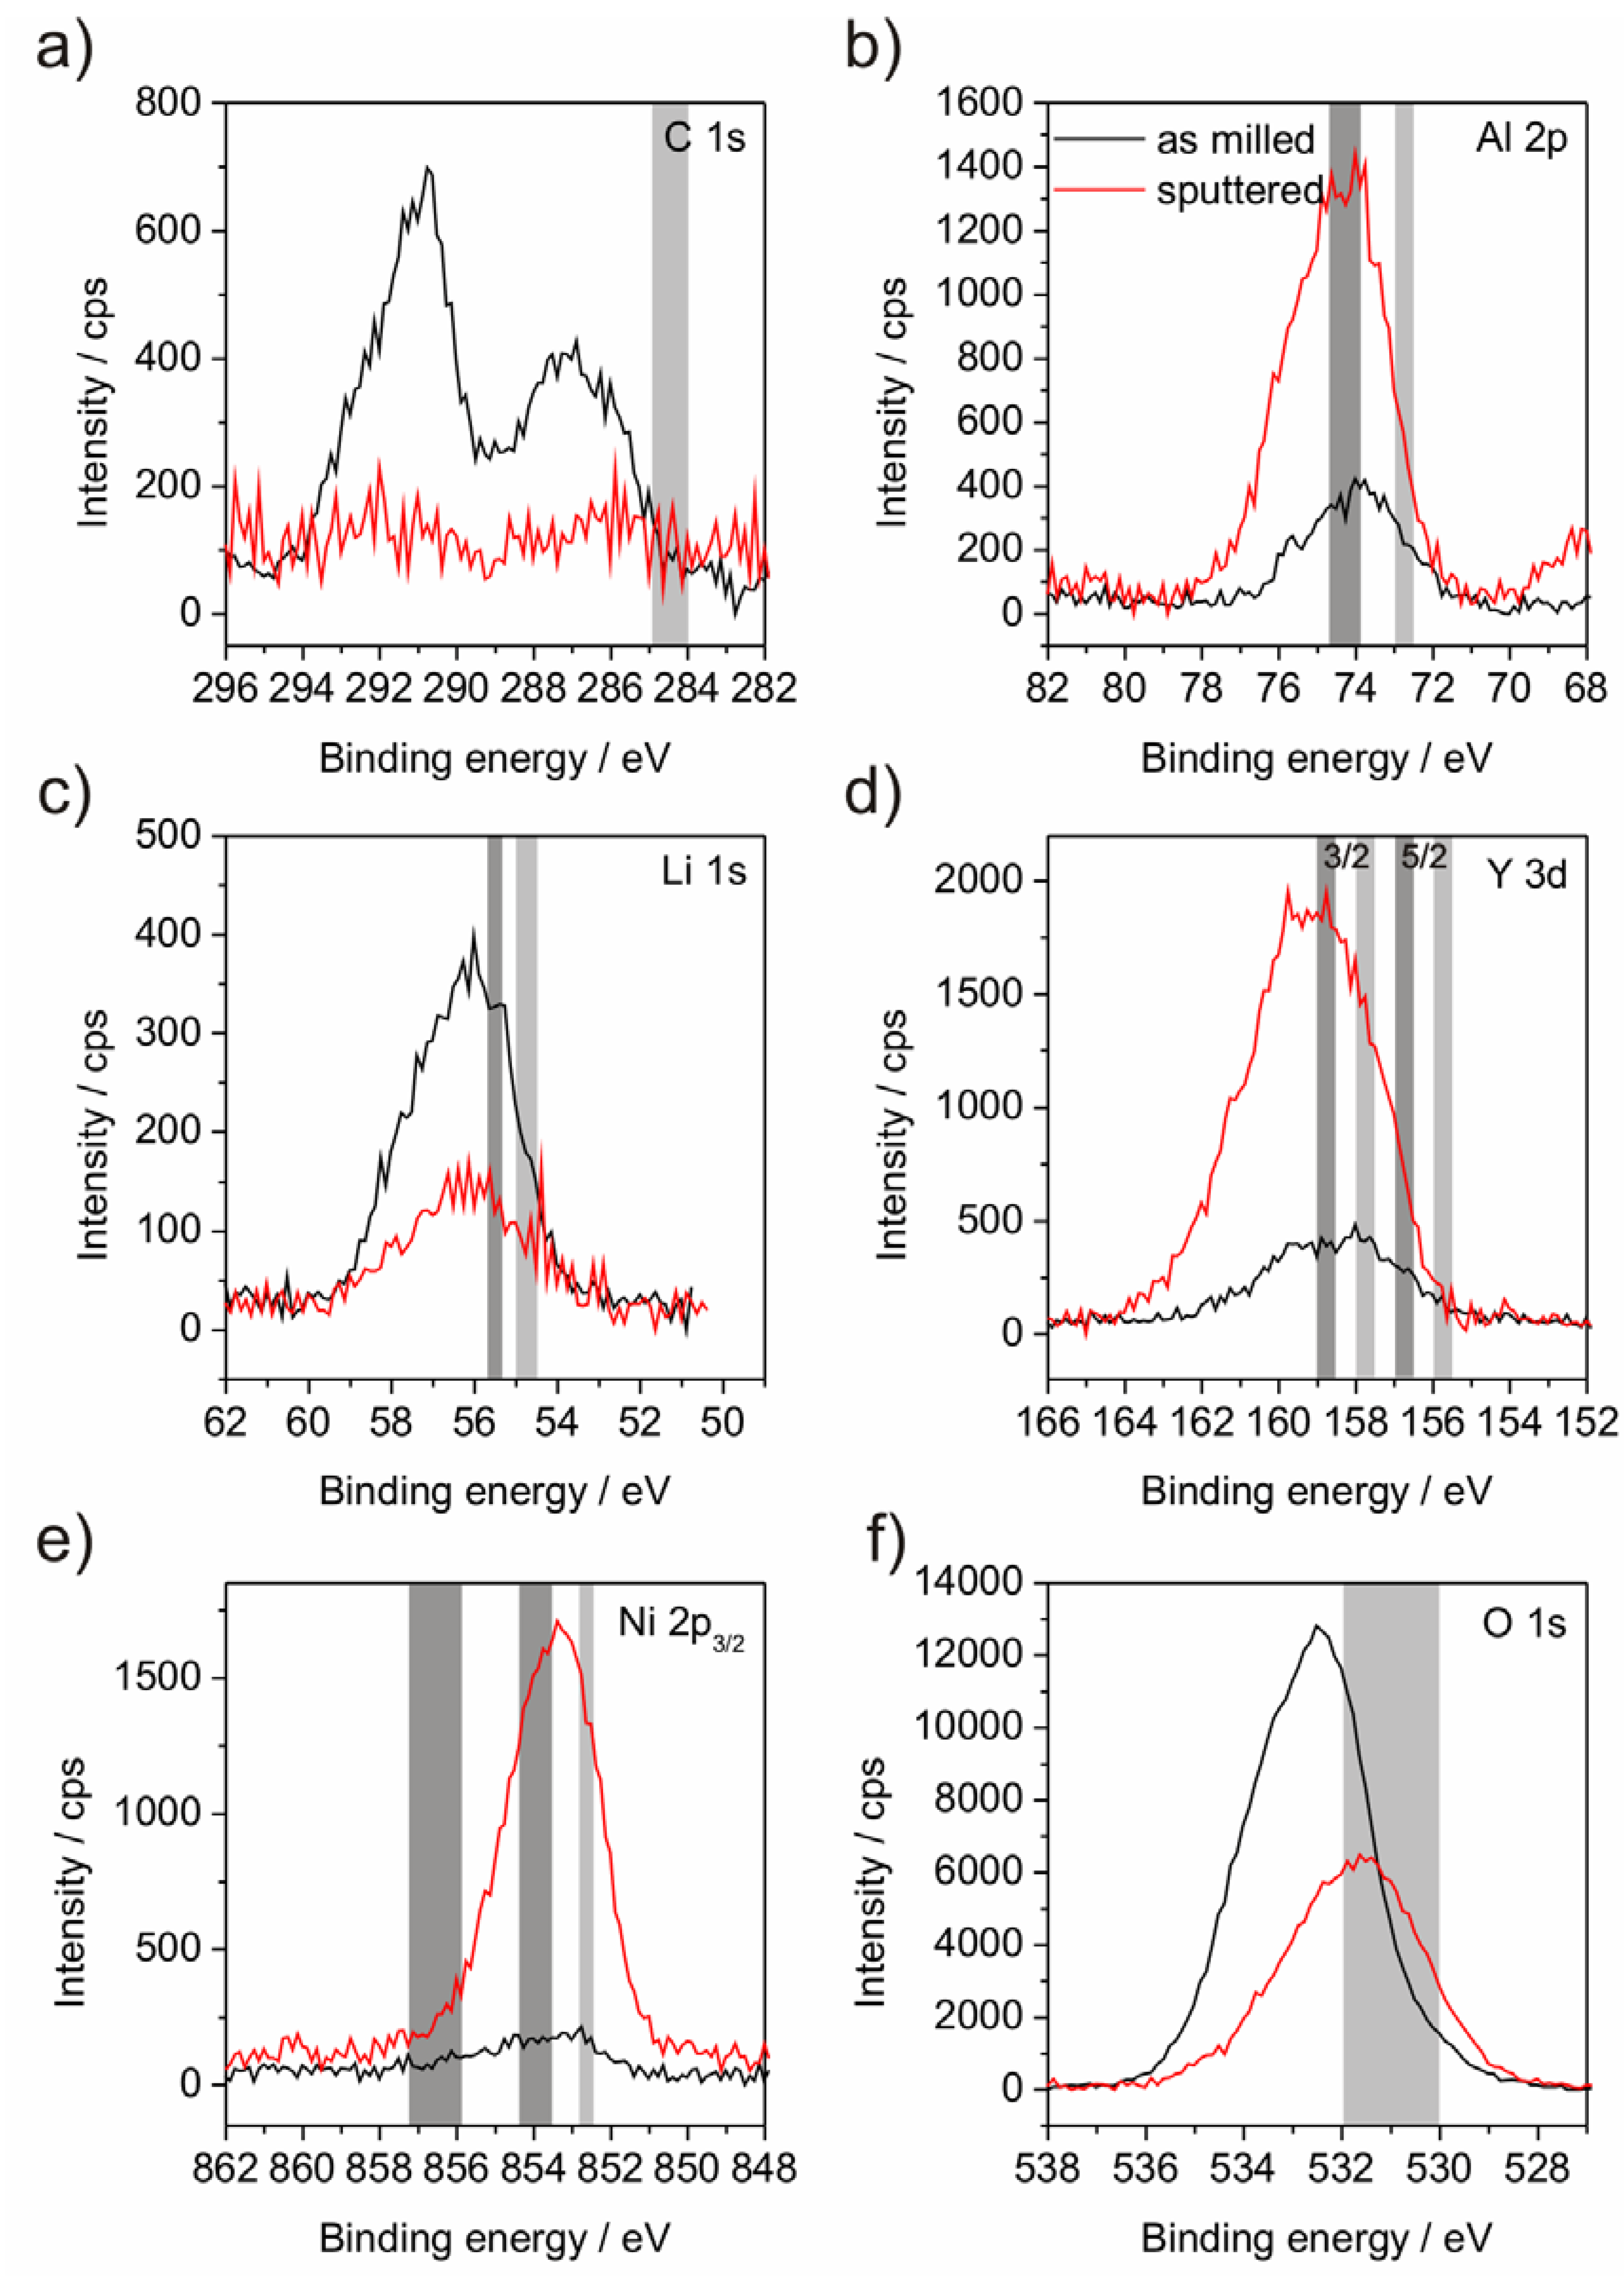
Figure 5.
XPS diagrams of powder P2 including the binding energy lines of the elements C (
a); Al (
b); Li (
c); Y (
d); Ni (
e) and O (
f). The grey areas mark the theoretic energy ranges as referenced by Moulder
et al. [
24]. The right, light grey areas indicate the position of the elemental line; left positioned, dark grey areas indicate oxide states.
Figure 6.
Mössbauer spectra and fitting subspectra for powder P1.
Figure 6.
Mössbauer spectra and fitting subspectra for powder P1.
2.2. Electrochemical Characterization
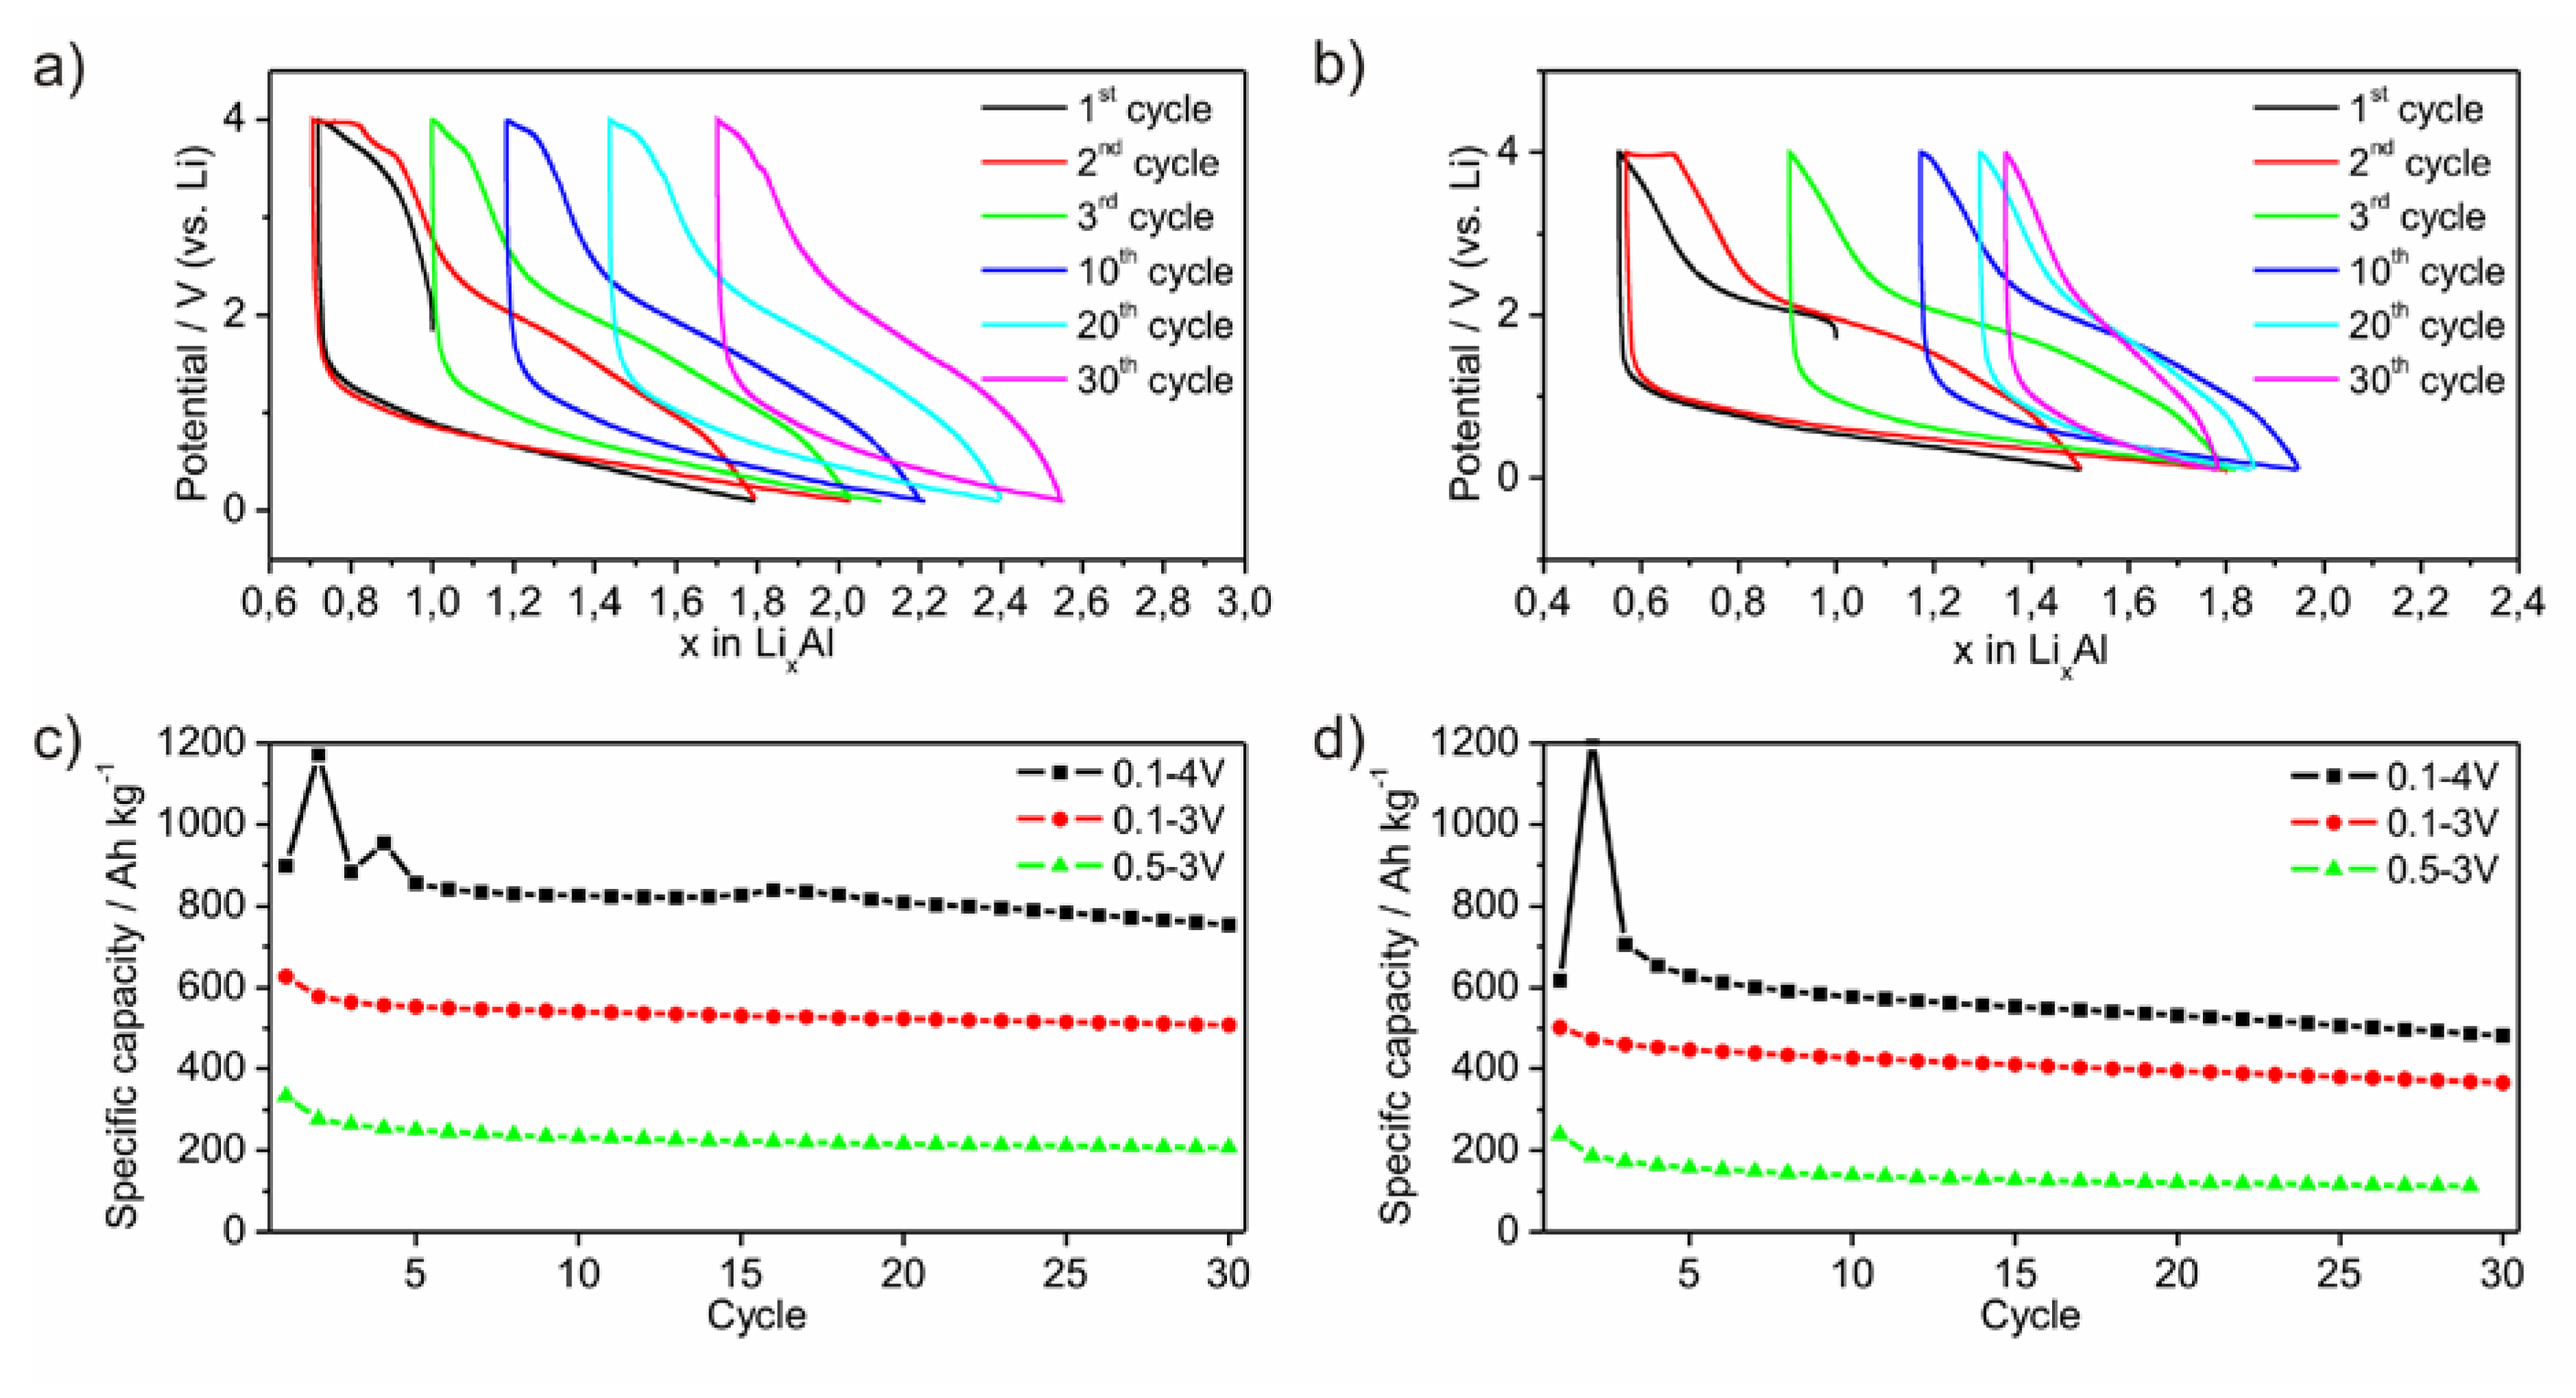
Electrodes of the two powders were galvanostatically cycled. The lithiation process occurs mainly between 1.5 V and the low voltage limit of 0.1 V (
Figure 7a,b). No plateau at a certain potential is observed indicating that no crystalline phase is formed upon lithiation. In contrast, the potential upon delithiation ranges between 0.1 V and the upper potential limit of 4.0 V. Around 60% of the delithiation is passed until the potential reaches 2.5 V. Between 2.5 V and 3.8 V the slope of the curve is enhanced, which may be caused by the formation of Li-compounds hindering a further Li-diffusion. Fixing this potential range to a lower or upper limit results in a loss of specific capacity (
Figure 7c,d). As a conclusion, the electrode is electrochemically active in a wide potential range. This limits on the one hand the specific capacity while choosing a certain smaller potential range, but on the other hand qualifies the material as versatilely applicable electrode. This behavior may originate from the high amount of non-metallic elements. For this experiment, the cycles are started with the delithiation process (
Figure 7a,b). During the following lithiation process, a significantly higher amount of Li can be inserted than extracted before. Furthermore, it is also possible, to start the cycling process with the lithiation process. Hence, the amorphous material includes already a certain free volume or a diffusion process of Li through the amorphous framework occurs without fracturing.
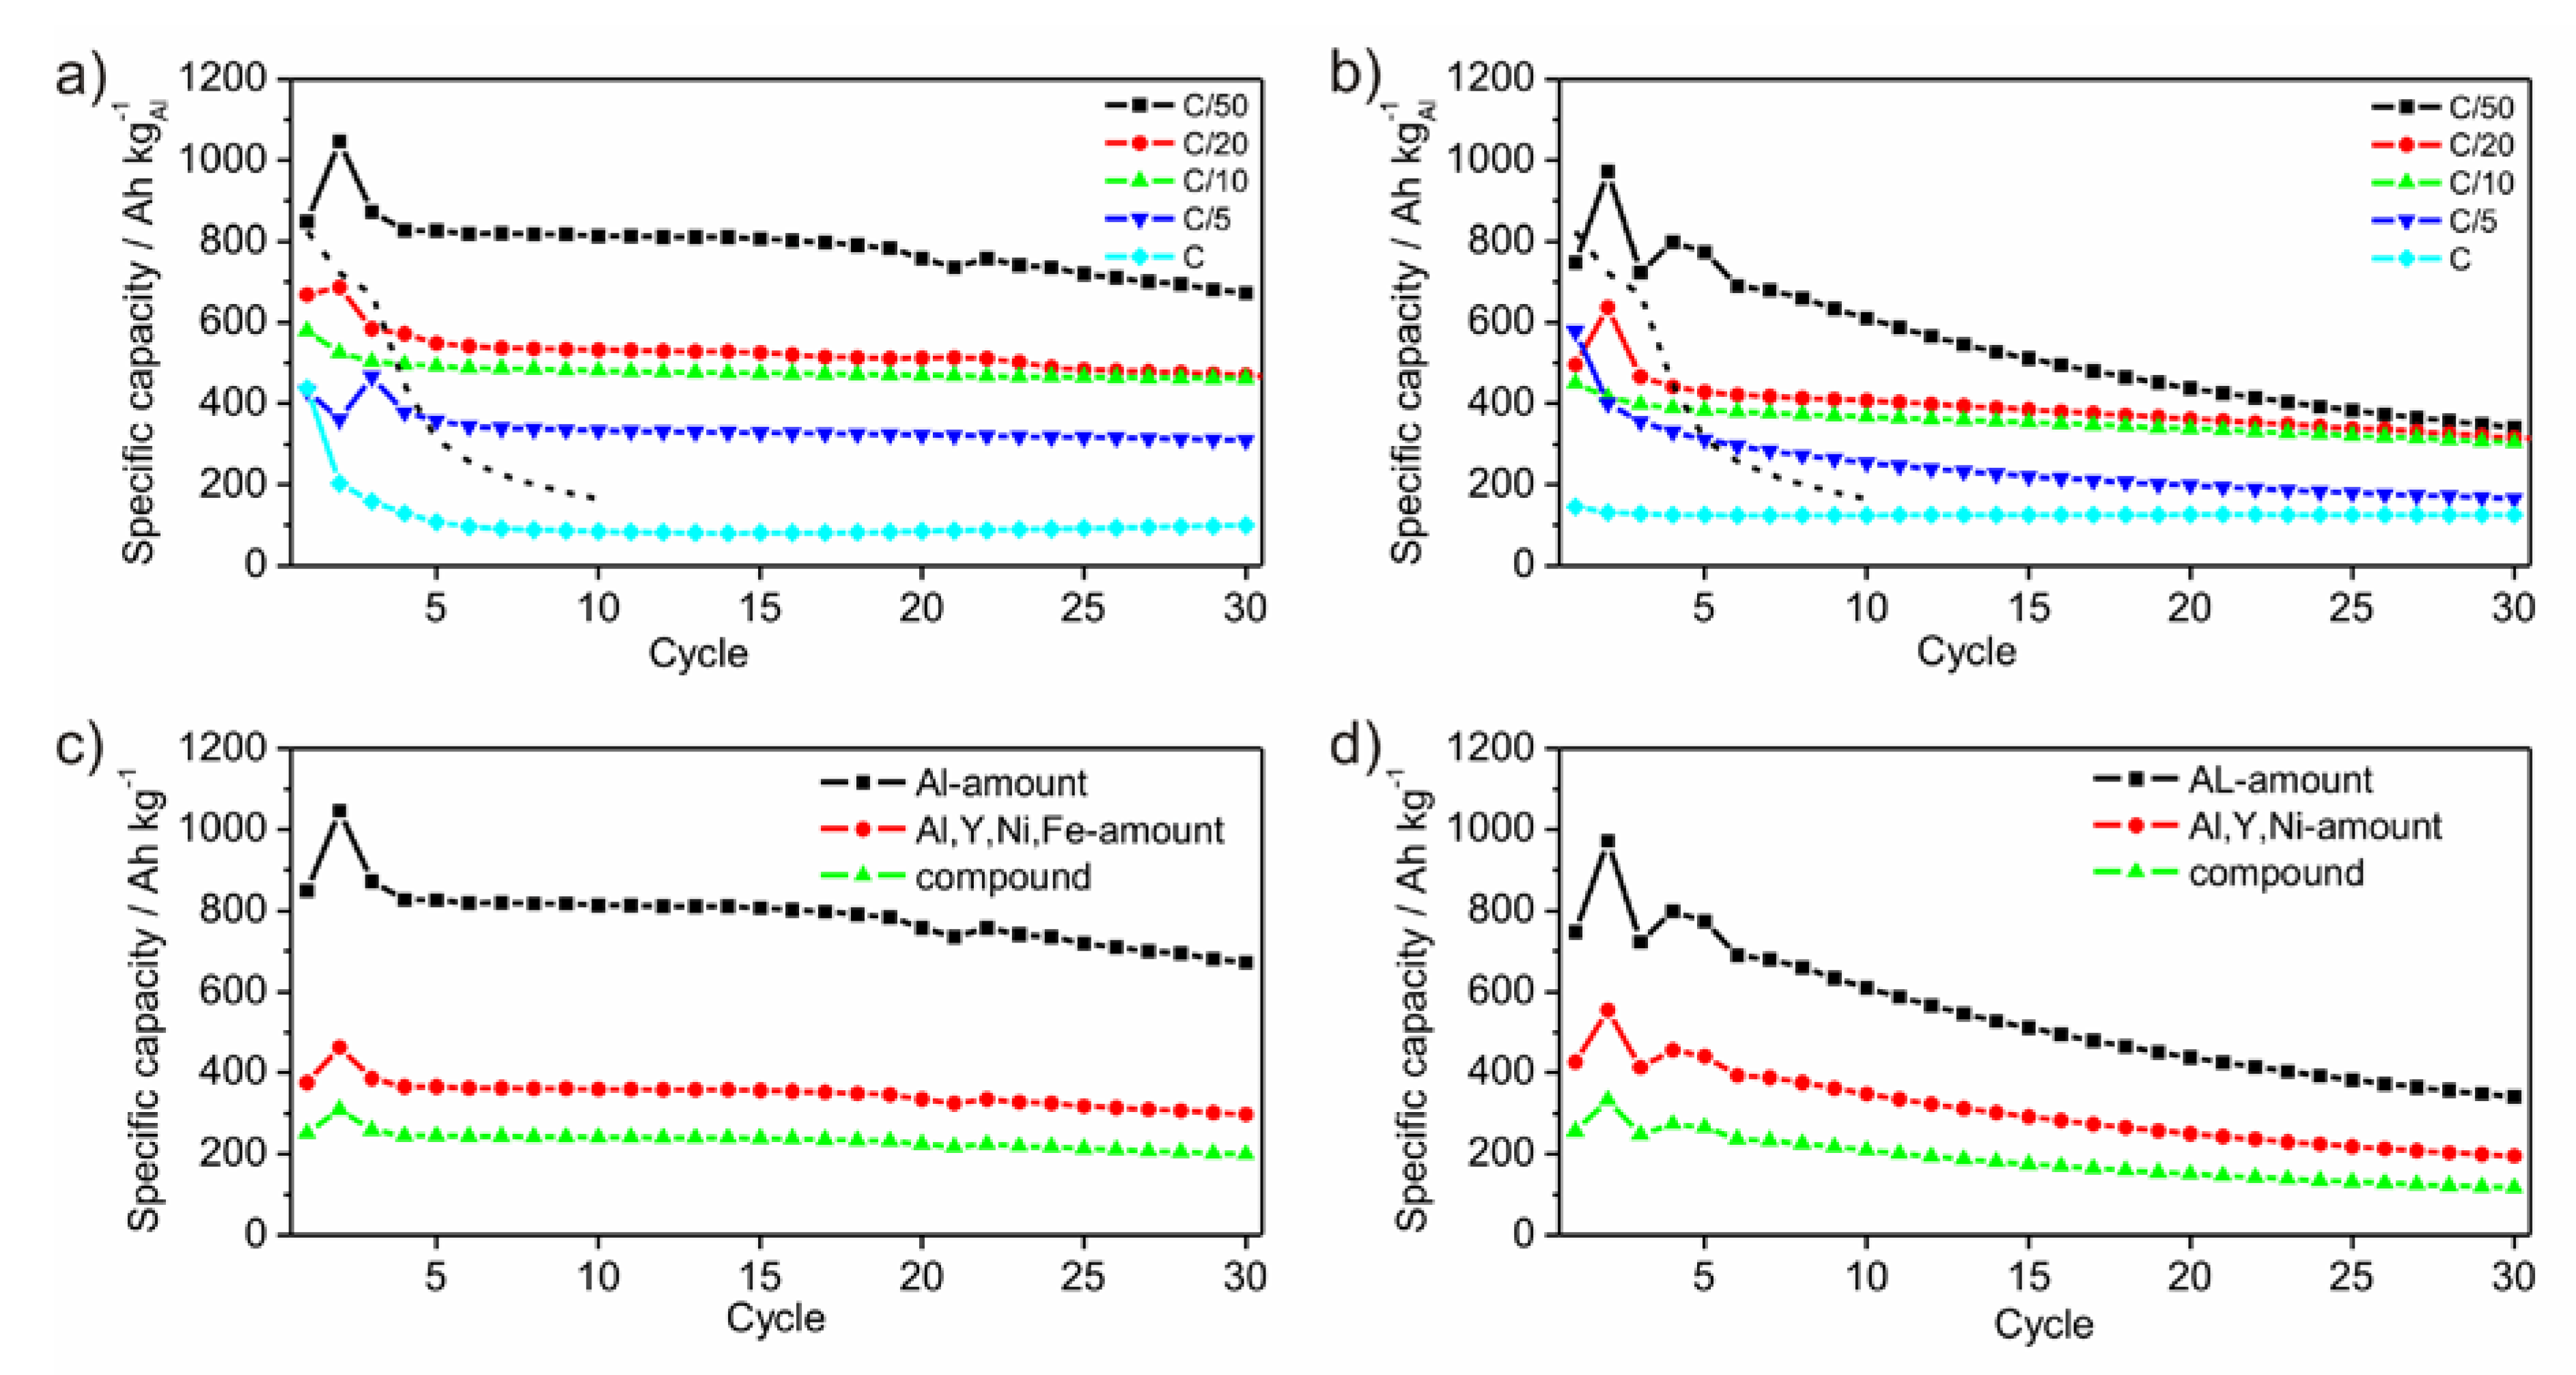
Figure 8a,b show the development of the specific capacities after each cycle for different C-rates calculated to the amount of Al. As expected, the specific capacity reaches different values as a function of the C-rates. The slower the battery is charged, the higher is the specific capacity. Generally, this rule applies to the performed electrochemical tests. The first cycle shows an irreversible charge capacity loss, which is associated with SEI (solid electrolyte interface) formation [
1]. This behavior appears only for the measurements with C-rates of C/10 and lower. The measurements with C-rates of C/20 and C/50, respectively, show a capacity enhancement after the first cycle, which is followed by a capacity loss after the second cycle. As origin an activation process of the surface or the overcoming of a kinetic limitation, which only appears in case of slow lithiation, is possible. Comparing the electrochemical results of P1 and P2 both powders shows very small differences in the specific capacities of the measurements with the C-rates of C/20 and C/10. Generally, the capacities of powder P1 are higher than those of P2. Powder P1 differs from P2 by containing a certain amount of Fe. While no Li-compounds are known for Fe, Ni and Y, Fe oxides are able to form Li-containing compounds [
27,
28,
29]. However, the presence of Fe or Fe-oxides influences the lithiation process positively, since powder P1 achieves enlarged specific capacities compared to P2. Similar promoting effects of Fe or Fe compounds are well documented in disciplines beside battery or electrochemical research such as heterogeneous catalysis [
30,
31].
Figure 8c,d show the development of the specific capacities after each cycle at a C-rate of C/50 calculated for different active masses. Within an amorphous framework contributing components are hardly relatable to a certain electrochemical activity due to the absence of crystalline phases upon the lithiation process. In principle, Ni and Y are electrochemically inactive. Due to their function as glassformers they may be considered as a kind of active, because the amorphous state would otherwise not exist. As a result, the mass of all participating components should be considered giving a practical value for the specific capacity.
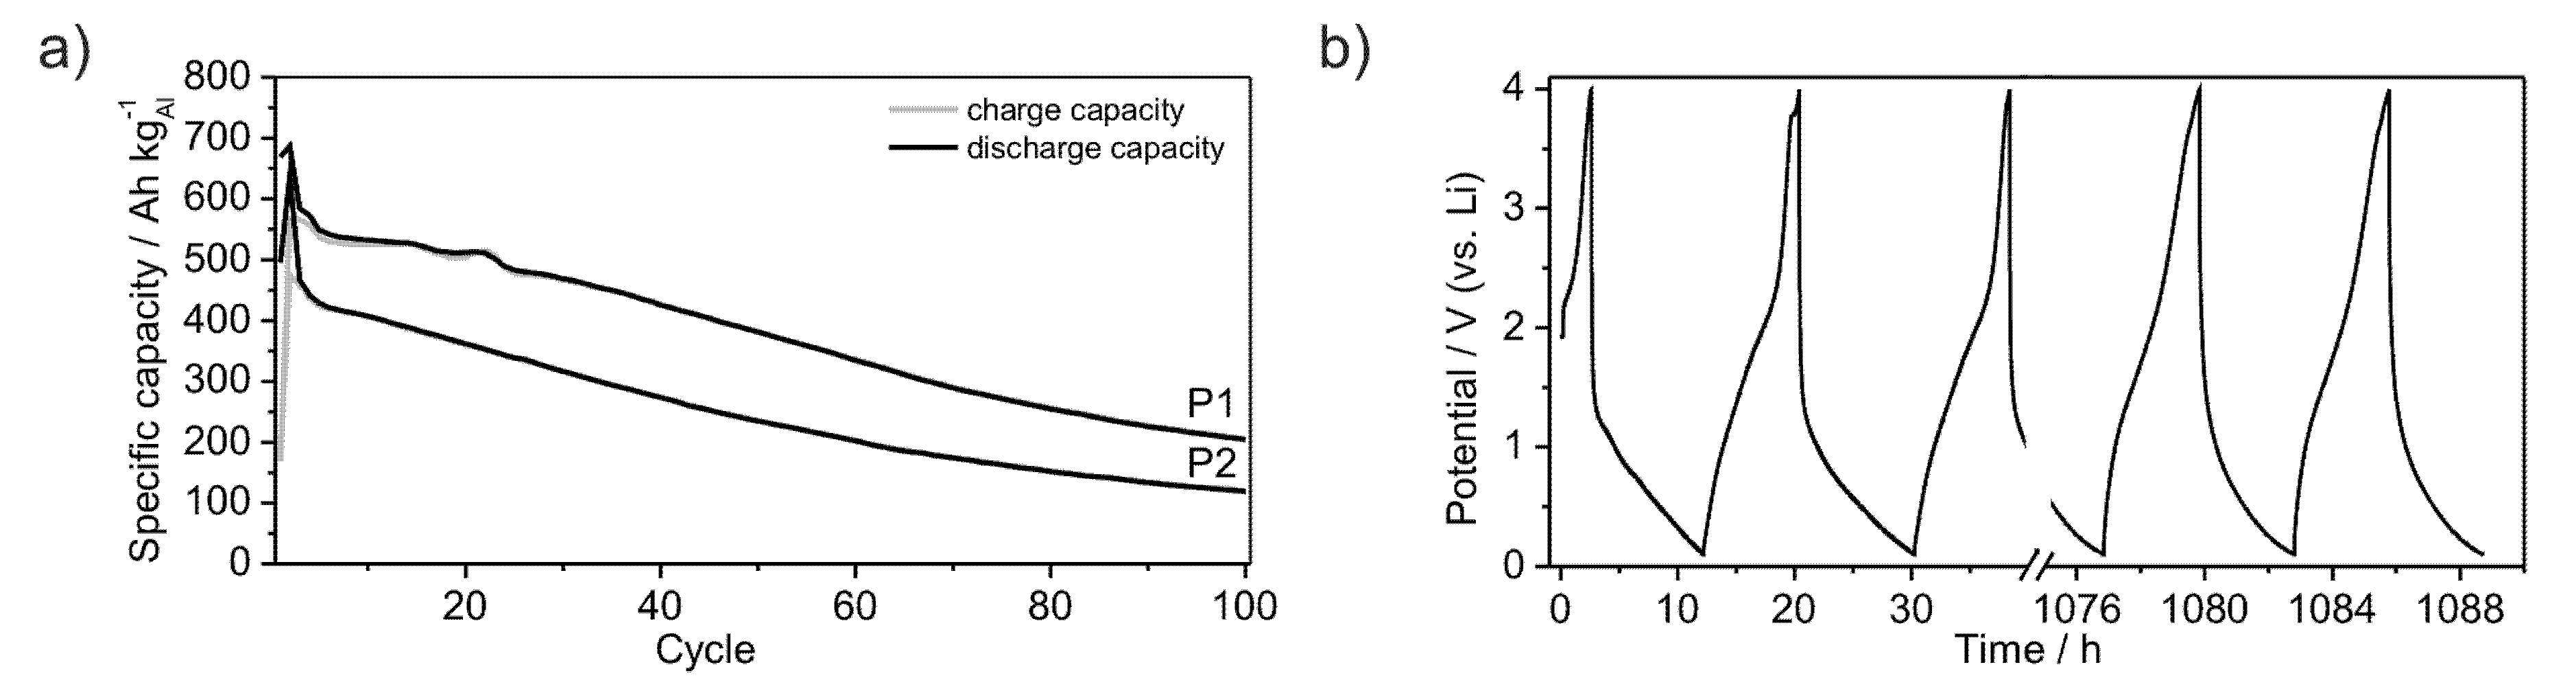
Furthermore, the powders P1 and P2 were subjected to long-term measurements in order to estimate their cycle life-time.
Figure 9a shows the development of the specific capacities over 100 cycles at a rate of C/20. The capacity of powder P2 continuously decreases after the second cycle, starting at a value of 420 Ah kg
−1. In contrast, the capacity of powder P1 starts at a value of 550 Ah kg
−1 and decreases discontinuously, reaching a plateau between the 4th and 14th cycle. After the 22nd cycle the capacity continuously decreases as observed for powder P2. The lithiation and delithiation processes occur quasi-continuously between the lower potential limit of 0.1 V and 2.5 V in the case of lithiation and between 1.5 V and 0.1 V in the case of delithiation, as no plateau is observed at a certain potential (
Figure 9b). Therewith, no new crystalline phases are formed. Both powders remain in an amorphous state as evidenced by XRD (
Figure 1a). While galvanostatic cycling Li is reversibly inserted and removed into or out of the material without a significant capacity loss after the first cycles (
Figure 3a,b). Compared to crystalline Al (dashed line in graphs) amorphous Li-compounds offer stable electrochemical properties for the application in Li-ion batteries (Figure 1a,b). After 100 cycles the herein investigated materials still achieve specific capacities of 150 Ah kg
−1 in the case of powder P2 and 220 Ah kg
−1 for powder P1. Indeed, those coulomb efficiencies of 35% and 40%, respectively, do not give a glamorous electrochemical long term performance. However, the constant curve voltage profile demonstrates in principle the ongoing of unchanged electrochemical processes during the cycling procedure (
Figure 9b). The quicker Li-insertion processes can be caused by pinning of Li within the material or by plating at the surface, thus leading to a loss of specific capacity [
32]. Further investigations should help to optimize the capacity during long term cycling.
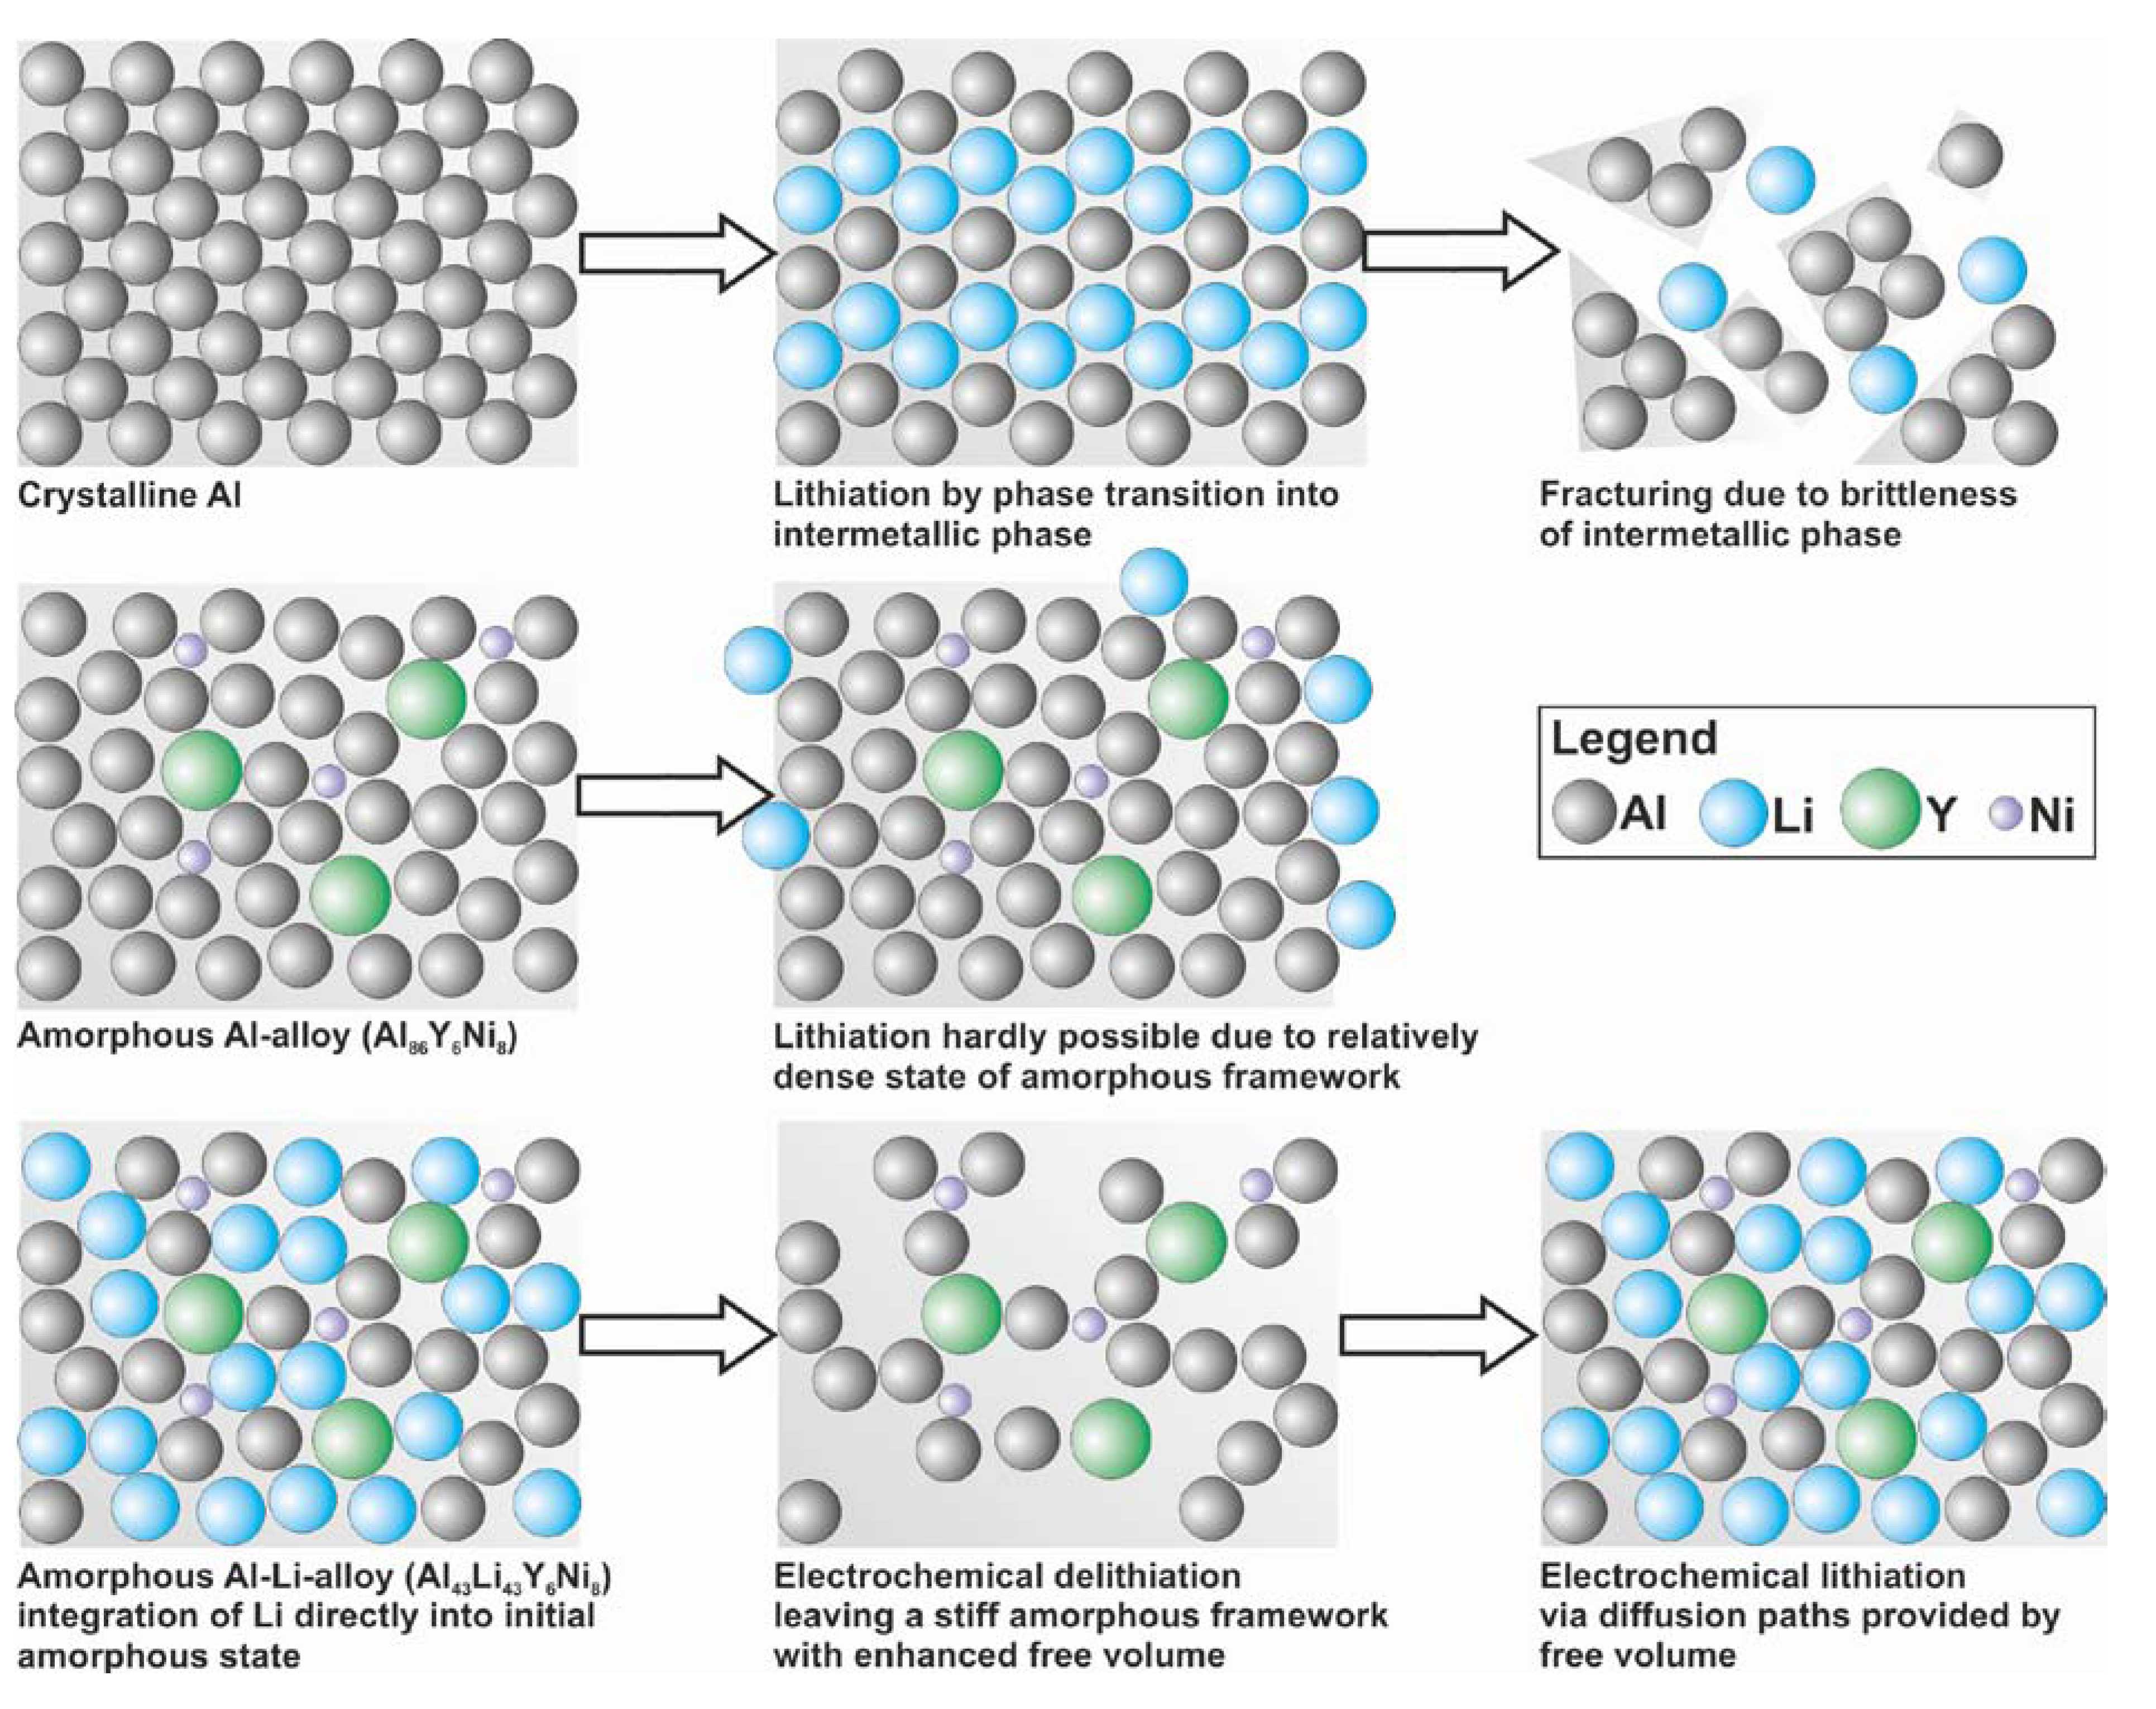
In general, crystalline intermetallic phases achieve increased specific capacities compared to the well-known properties of graphite. Disadvantageously, the decomposition after a few cycles caused by huge volume changes during lithiation turn them unsuitable for a battery application [
2]. This circumstance is avoided by the application of amorphous compounds. Conventional amorphous alloys do not provide sufficient free volume for Li-migration [
13]. The novelty of the herein presented amorphous compound Al
43Li
43Y
6Ni
8 is the combination of the advantages of electronegative elements and their high specific capacities, here Al, with the stiffness of an amorphous framework which cannot undergo phase transitions, but provides Li-migration paths by integrating Li into the master alloy. This new lithiation mechanism is introduced in contrast to the phase transition mechanism of crystalline intermetallics and furthermore the intercalation mechanism of Li into layered structures like graphite. The mechanism may be promoted by the non-metallic elements and Fe-oxides at the particle surfaces allowing faster migration at the grain boundaries.
Figure 7.
Lithiation process of ball milled amorphous Al43 Li43Ni8Y6 powders P1 (a) and P2 (b) versus potential. Development of specific capacities in dependency of different potential ranges for P1 (c) and P2 (d).
Figure 7.
Lithiation process of ball milled amorphous Al43 Li43Ni8Y6 powders P1 (a) and P2 (b) versus potential. Development of specific capacities in dependency of different potential ranges for P1 (c) and P2 (d).
Figure 8.
Development of specific capacities of ball milled amorphous Al43Li43Ni8Y6 powders P1 (a) and P2 (b), galvanostatically cycled between 0.1 V and 4 V with C-rates of C/50, C/20, C/10, C/5 and C, respectively. The dashed lines give the development of the specific capacity of crystalline Al-powder taken as reference with a particle size of 18 µm, cycled between 0.1 V and 2 V with a rate of C/50. Specific capacities at the C-rate of C/50 calculated for different active masses for P1 (c) and P2 (d).
Figure 9.
Development of specific capacities of amorphous Al43Li43Ni8Y6 powders P1 and P2, galvanostatically cycled between 0.1 V and 4 V with a rate of C/20 over 100 cycles (a); Voltage profile of powder P1 (b).
Figure 9.
Development of specific capacities of amorphous Al43Li43Ni8Y6 powders P1 and P2, galvanostatically cycled between 0.1 V and 4 V with a rate of C/20 over 100 cycles (a); Voltage profile of powder P1 (b).

 ,
, 
