
URVA and Local Mode Analysis of an Iridium Pincer Complex Efficiently Catalyzing the Hydrogenation of Carbon Dioxide
Chemistry Department, Southern Methodist University, 3215 Daniel Avenue, Dallas, TX 75275-0314, USA
*
Author to whom correspondence should be addressed.
†
These authors contributed equally to this work.
Inorganics 2022, 10(12), 234; https://doi.org/10.3390/inorganics10120234
Submission received: 29 October 2022
/
Revised: 23 November 2022
/
Accepted: 28 November 2022
/
Published: 1 December 2022
(This article belongs to the Special Issue Organometallic Complexes for Small Molecule Activation)
Abstract
:The catalytic effects of iridium pincer complexes for the hydrogenation of carbon dioxide were investigated with the Unified Reaction Valley Approach (URVA), exploring the reaction mechanism along the reaction path traced out by the reacting species on the potential energy surface. Further details were obtained with the Local Mode Analysis performed at all stationary points, complemented by the Natural Bond Orbital and Bader’s Quantum Atoms in Molecules analyses. Each of the five reaction paths forming the catalytic cycle were calculated at the DFT level complemented with DLPNO-CCSD(T) single point calculations at the stationary points. For comparison, the non-catalytic reaction was also investigated. URVA curvature profiles identified all important chemical events taking place in the non-catalyzed reaction and in the five reactions forming the catalytic cycle, and their contribution to the activation energy was disclosed. The non-catalytic reaction has a large unfavorable activation energy of 76.3 kcal/mol, predominately caused by HH bond cleave in the H reactant. As shown by our study, the main function of the iridium pincer catalyst is to split up the one–step non-catalytic reaction into an energy efficient multistep cycle, where HH bond cleavage is replaced by the cleavage of a weaker IrH bond with a small contribution to the activation energy. The dissociation of the final product from the catalyst requires the cleavage of an IrO bond, which is also weak, and contributes only to a minor extent to the activation energy. This, in summary, leads to the substantial lowering of the overall activation barrier by about 50 kcal/mol for the catalyzed reaction. We hope that this study inspires the community to add URVA to their repertoire for the investigation of catalysis reactions.
1. Introduction
One of the key causes of global warming is our excessive production of CO [1,2,3,4]. Therefore, a lot of efforts have been put into the exploration of the use of this free carbon source for the commercial synthesis of chemicals and for fuel production [5,6,7,8,9,10,11], as well as the transformation of CO into functional organic molecules [12,13,14,15,16,17,18,19,20,21,22,23]. Formic acid is one of the target molecules obtained via CO hydrogenation, because of its importance in organic synthesis and its applications in hydrogen storage. Recent research has shown that formic acid can serve as a H storage reservoir via its decomposition into CO and H and the reverse transformation [24,25,26,27]. A substantial number of investigations on CO hydrogenation in homogenous catalysis have been reported over the last two decades [28,29,30,31,32,33,34,35,36,37,38,39,40,41,42].
The Nozaki group identified six-coordinate Ir(III)–PNP trihydride (PNP = 2,6–bis(di–isopropylphosphinomethyl)pyridine) as a highly active catalyst with high turn over frequencies (TOF) and turnover number (TON), reflecting the stability of the active site for the CO hydrogenation [41,43,44]. The original mechanism of the CO hydrogenation to formic acid was reported to include three major steps, (i) CO addition to the catalyst, (ii) formic acid dissociation, and (iii) H addition in order to regenerate the catalyst [43]. In the following years, the mechanism was extended including, e.g., basic conditions leading to a more complex catalytic cycle and a larger number of intermediates confirmed by DFT calculations [44,45,46]. Because the insertion of CO into the metal hydride is the crucial step of the catalysis [47,48], possible CO insertion into a five-coordinate Iridium(III) dihydride complex as alternative was experimentally investigated [49], showing the formation of –bound formate monohydride products by selective electro-catalytic reduction of CO. The mechanism of the CO insertion into five-coordinate Iridium(III) dihydrides and four-coordinate Iridium(I) hydrides was also analyzed theoretically [50], exploring the different reactivity of these complexes with different iridium oxidation states. The catalytic reduction of CO to methane with silanes using Brookhart’s cationic Ir(III) pincer complex was investigated theoretically [51], focusing on the transfer of silane hydrogens to CO and the formation of silylformate, bis(silyl)acetal, methoxysilane and methane. The importance of a hydrogen bond donor in the secondary coordination sphere of the Ir(III)–PNP catalyst was analyzed theoretically [52], finding that the isolation of the formate product from the reaction is straight forward and therefore makes this reaction favorable. CO hydrogenation was also investigated using a series of modifications of the Iridium complexes bearing sophisticated NN–bidentate ligands [53] showing importance of hydroxy groups as proton-responsive substituents in CO hydrogenation reactions. Other modifications of the iridium complexes included amide–based ligands, showing that the electron-donating effects of an anionic nitrogen atom and the presence of an OH group near the metal center improves the catalytic activity for CO hydrogenation [54]. Although these studies provide valuable insights, a clear understanding of the mechanistic details of each reaction step of the CO hydrogenation catalytic cycle and how the catalyst actually lowers the activation barrier has been missing so far.
Therefore, we investigated in this study all major chemical events taking place during the CO hydrogenation to formic acid, for the original catalytic cycle proposed by Nozaki [43], using as computational tools the Unified Reaction Valley Approach (URVA) and the Local Modes Analysis (LMA) developed in our group, which are both based on vibrational spectroscopy. URVA requires the accurate and precise determination of the reaction path starting at the transition state (TS) and moving far down into both the entrance and exit channels, a time consuming enterprise. Therefore, we simplified the original Ir(III)-PNP complex in our study by replacing the isopropyl groups with hydrogen atoms. The catalytic cycle involves the five reaction steps R1–R5 shown in Figure 1. For comparison we also included the non-catalyzed reaction R0. Reaction movies illustrating the movements of all atoms of the complexes along the reaction path together with the Cartesian coordinates of the stationary points for each of the five reaction paths R1–R5 of the catalytic cycle and the non-catalyzed reaction R0, both investigated in the gas phase, are presented in the Supplementary Materials.
2. Materials and Methods
The theoretical background of URVA is provided in a comprehensive review article [55], therefore only some highlights are summarized. URVA explores the reaction complex (RC, i.e., the union of reacting molecules) along the path it traces out on the potential energy surface (PES) starting from the TS down into the entrance and exit channels, described by a large amplitude motion [56,57,58,59] as well as in the close vicinity of the reaction path, the so-called reaction valley being spanned by the vibrations perpendicular to the reaction path [60,61]. The major focus of URVA is on the curvature of the reaction path. Since the reaction path is a curved line in dimensional space with internal coordinates (L = 6 for a non-linear N-atomic RC and 5 for an N-atomic linear RC), its direction and curvature can be derived with the Frenet-Serret formalism [62]. The reaction path direction at a path point s is given by the unit vector :
where the derivative of the mass-weighted reaction coordinate with regard to s is the normalized mass-weighted gradient vector and is a diagonal matrix of atomic masses. c(s) is the normalization constant being equal to the length of the gradient vector . The curvature vector is given by [63,64]
where is the mass-weighted Hessian matrix in Cartesian coordinates x.
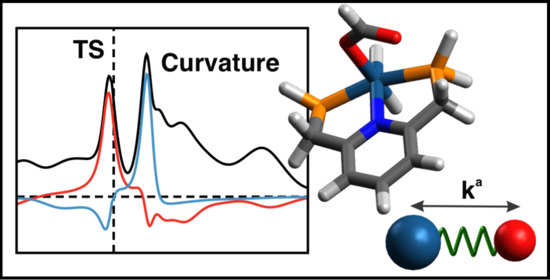
Any electronic structure change, e.g., bond breaking/forming processes, but also re-hybridization, charge polarization and transfer, etc. leads to distinct curvature peaks, which are directly reflected in the scalar reaction path curvature in contrast to regions of minimal electronic change, which are reflected by curvature minima as sketched in Figure 2 showing the scalar curvature as a function of the reaction path parameter s. We call the region from one curvature minimum to the next embedding a curvature peak a reaction phase. Each chemical reaction has a unique pattern of curvature maxima and minima and as such a different number of reaction phases leading to a specific reaction profile, the so-called fingerprint of the reaction [55]. Deeper insights into the nature of a chemical event reflected by a curvature peak are obtained from the decomposition of the scalar reaction curvature into individual components [65] such bond lengths, bond angles, and dihedral angles or other components such as puckering coordinates [66] denoted by the colored lines in Figure 2. Interesting to note is that even for complex catalytic reactions a curvature peak is most likely composed of a few components, which facilitates the analysis of the mechanistic details considerably. The sign of a component indicates if the parameter in question supports the chemical event (positive sign) or if it resists the chemical change (negative sign) [65]. For a detailed mathematical derivation, its connection to the work of Miller, Handy and Adams [67] and Kato and Morokuma [68] on the reaction path Hamiltonian, and recent advances of URVA, interested readers are referred to Refs [55,69]. Applications of URVA can be found, e.g., in Refs [69,70,71,72,73,74,75,76,77,78,79,80,81,82,83,84].
Similar as URVA, LMA is based on vibrational spectroscopy and it refines the use of normal vibrational force constants and frequencies derived from normal vibrational modes to characterize chemical bonds and/or weak chemical interactions. Normal vibrational modes of a polyatomic molecule are generally delocalized, as already stated by Wilson in 1941 via his proof that the associated normal mode coordinates are a linear combination of internal coordinates q or Cartesian coordinates x [85]. Therefore, normal mode stretching frequencies and associated stretching force constants are of limited use as individual bond strength descriptors. Konkoli and Cremer solved this problem via the transformation of normal vibrational modes into their local mode counterparts [86,87,88,89,90] (for details the reader may refer to two comprehensive review articles [91,92]). A local vibrational mode is defined as
implying the important result that all what is needed for the local mode analysis are the diagonal normal mode force constant matrix in normal mode coordinates and the normal mode vectors in internal coordinates, which can be obtained from a standard vibrational frequency calculation via the Wilson GF formalism [93,94,95], a routine part of most modern quantum chemistry packages.
Once the local mode vector is known, one can define molecular properties corresponding to this local motion, such as local mode force constant, local mass and local frequency [86,87,88,89,90].
The corresponding local force constant of local mode n (superscript a denotes an adiabatically relaxed, i.e., local mode) [96] can be expressed as
As has been shown by Zou et al., local mode stretching force constants reflect the intrinsic strength of a chemical bond and/or weak chemical interaction [97].
The associated local mass is defined as
where is a diagonal element of Wilson’s inverse kinetic energy matrix matrix and the Wilson matrix provides the important relationship between internal and Cartesian coordinates via the first derivatives of the internal coordinates ) with regard to the Cartesian coordinates ) [93],
From the local mode force constant and local mode mass the local mode frequency can be calculated
with c being the speed of light. In addition, the local mode infrared intensity has been defined which can be related to bond dipole moments [98].
LMA has been successfully applied to characterize covalent bonds [83,97,99,100,101,102,103,104,105,106,107,108] and weak chemical interactions such as hydrogen bonding [109,110,111,112,113,114,115,116,117,118], halogen bonding [119,120,121,122,123,124,125], pnicogen bonding [125,126,127,128], chalcogen bonding [107,125,129], tetrel bonding [130], metal bonding [115,121,131,132,133,134,135,136] as well as protein–ligand interactions [79,118,137,138].
It is convenient to transform local mode stretching force constants k into relative bond strength order (BSO) via a power relationship being being based on the generalized Badger rule [83,139]. The dimensionless parameters A and B are obtained from two reference molecules with known BSO and k values for the bond in question and the requirement that for a zero k the BSO is zero too. We used different reference molecules for different bond types investigated in our study, for the Ir-ligand bonds we used Mayer’s bond orders [140,141,142]. Details of the reference bonds and reference molecules are summarized in Table 1. The resulting A and B parameters for each bond are documented in the corresponding plots of the results and discussion part.
Bader’s quantum theory of atoms-in-molecules (QTAIM) characterizes of chemical bonds based on the topological features of the total electron density [143,144,145,146]. According to QTAIM a chemical bond between two atoms A and B is characterized by a bond path and a bond critical point . The covalent character of the bond AB can be determined via the Cremer–Kraka criterion of covalent bonding [147,148,149]. According to this criterion, a chemical bond has covalent character when the energy density H, i.e., the energy density H(r) taken at the at the bond critical point is negative, while a positive value of H indicates an electrostatic character. H(r) = G(r) + V(r); the positive kinetic energy density G(r) describes electron density depletion and the negative potential energy density V(r) describes electron density accumulation. Therefore, a chemical bond has covalent character when the potential energy density dominates.
We used in this study as a reaction path the intrinsic coordinate (IRC) path of Fukui [150,151] combined with the improved reaction path following procedure of Hratchian and Kraka, enabling the tracking of a chemical reaction far out into the entrance and exit channel [151]. We employed an IRC step size of 0.03 amu1/2Bohr and an ultrafine grid for numerical DFT integrations. IRC calculations and the investigation of all stationary points were performed with the B3LYP density functional [152,153,154] utilizing Pople’s 6-31G(d,p) basis set [155,156,157] and the Stuttgart–Dresden (SDD) effective core potential for iridium [158]. The energetics of the investigated chemical reactions was additionally recalculated via single energy point calculations with the coupled cluster DLPNO-CCSD(T) method [159] utilizing the def2-TZVP basis set [160] and the def2-ECP pseudo potential for iridium [158]. The DLPNO-CCSD(T) calculations were based on the DFT geometries and applying thermochemical corrections from the DFT frequency calculations. DFT calculations were performed with Gaussian program package [161], and DLPNO-CCSD(T) calculations with ORCA [162]. URVA was carried out using the program pURVA [163], and LMA analysis was performed using the LModeA program [164]. The Natural Bond Orbital (NBO) analysis [165,166,167,168] was applied for calculating NBO atomic charges along the reaction path. The QTAIM analysis was performed with the AIMALL program package [169].
3. Results and Discussion
3.1. Energetics
Table 2 presents the activation and reaction energies E, E and activation and reaction enthalpies H, H of reactions R0–R5 calculated at the B3LYP/6-31G(d,p)/SDD(Ir) and DLPNO-CCSD(T)/def2-TZVP/def2-ECP(Ir) levels of theory. The energy and enthalpy values in Table 2 are taken for each reaction relative to the energy of first point on the IRC (i.e., first point in the entrance channel corresponding to a van der Waals complex). The following discussion is based on the DLPNO-CCSD(T) results. According to Table 2, the activation energy E of the non-catalyzed reaction with a value of 76.3 kcal/mol is considerably larger then that for all reactions of the catalytic cycle, ranging between 1.7 kcal/mol for reaction R4, and 23.9 kcal/mol for reaction R2. Figure 3 displays the overall energetics of the catalytic cycle being composed of reactions R1–R5. All energies are relative to the energy of the van der Waals complex formed between the catalyst and CO 1 in the entrance channel. All energies in Figure 3 are based on the DLPNO-CCSD(T) calculations performed at the end points of the DFT IRC calculations and for simplicity they have been calculated by adding the activation and reaction energy of the next reaction step of the cycle, to the product energy of the previous reaction step.
According to Table 2 and Figure 3, reactions R1—CO addition (E = 17.6 kcal/mol), R2—hydrogen transfer (E = 23.9 kcal/mol), and R5—catalyst regeneration (E = 23.5 kcal/mol), have the largest activation energies, i.e., they are the decisive steps of the overall catalytic cycle. The values of the activation enthalpies H for reactions R1 (18.9 kcal/mol), R2 (22.7 kcal/mol), and R5 (21.3 kcal/mol) show a similar trend as seen from the activation energies E of these reactions, which indicates small thermal energy contributions to the overall reaction energies. Although information about the energetics is useful, it does not disclose the actual mechanism taking place in each reaction step forming the catalytic cycle. This is explored in the next section.
3.2. Reaction Mechanism
Reaction R0Figure 4a presents the energy profile of the non-catalyzed reaction R0 along the reaction path. The decomposition of the reaction curvature into selected components is presented in Figure 4b, selected geometrical parameters in Figure 4c and atomic NBO charges along the reaction path are presented in Figure 4d. According to Figure 4b, the reaction starts with initial formation of the OaHa bond in reaction phase 2 (green line), with a resisting contribution of the OaCaOb bond angle (purple line). Bending of CO molecule is also reflected in Figure 4c. The OaCaOb bond angle starts to decrease in phase 2. As shown in Figure 4a, both events the initial OaHa bond formation and the OaCaOb bending, contribute 6.8 kcal/mol to the activation energy in this reaction phase. As revealed in Figure 4b, breaking of the HaHb bond takes place in phase 4, which is confirmed by a strong supporting contribution of the HaHb component (blue line). HH bond cleavage is also reflected by the change of HaHb bond length (see Figure 4c), which starts to elongate in phase 4, making H positively charged (see Figure 4d). HaHb bond breaking is supported by the start of CaHb bond formation (red line in Figure 4b), which is also confirmed by changes of C and H atomic charges (see Figure 4d). As shown in Figure 4a, the chemical events happening in phase 4, in particular the energy demanding breakage of the hydrogen bond, contributing 40.8 kcal/mol to the activation energy is the major cause of the high barrier. Finalization of OH and CH bonds takes place in phases 5 and 6 after TS (see Figure 4b),which is also reflected by OH and CH bond length changes (Figure 4c) and the NBO charge changes (Figure 4d). Obviously, the catalyzed reactions circumvents direct HH bond breakage, which is explored next.
Reaction R1 Properties of reaction R1 of the catalytic cycle along the reaction path are presented in Figure 5a–d. Reaction R1 involves addition of CO to the coordination sphere of iridium and hydrogen atom transfer from Ir to one of the CO carbon atoms. According to Figure 5b the reaction starts in phase 3 with the initial stage of the IrO bond formation (blue line) first resisting, followed by the next stage in phase 4 where it becomes supporting, whereas the final step of IrO bond formation occurs after TS in phase 9. The different stages of IrO bond formation are in line with changes in IrO bond lengths shown in Figure 5c. In phase 3 the IrO bond distance starts to decrease, reaching its final value in phase 9. Figure 5d presents the corresponding changes of Ir and O NBO charges taking place between reaction phases 4 and 9. The accompanying transfer of the H atom from Ir to the C carbon of CO implies IrH bond cleavage and CH bond formation. According to Figure 5b, the transfer process (red line) starts at the end of phase 4, where the formation of the new CH bond (green line) is still resisting, changing into a large supporting contribution in phase 5.
The next stage of H transfer from Ir to C occurs in phase 5, being finalized far out in the exit channel in phases 8–10. Figure 5c,d confirm these processes. Largest CH bond length changes are found in phases 8 and 9 after the TS, as well as the changes in the C and H NBO charges. Figure 5b also reveals the involvement of the OCO bond angle (purple line) in the reaction mechanism, with largest contribution between phases 4 and 9, in line with the OCO bond angle changes from 180° to 120° occurring between phases 4 and 9 (see Figure 5c) which is facilitated by the coordination of C to the metal atom. According to Figure 5a, the two largest energy contributions to TS energy are 4.6 kcal/mol in phase 4, caused by IrO and CH bond formation, together with changes of the OCO bond angle, and 6.2 kcal/mol in phase 8, connected with IrH bond cleavage and IrO bond formation, which in summary is far less than the direct cleavage of the HH bond in reaction R0.
Reaction R2 Reaction R2 of the catalytic cycle is characterized by the H atom transfer from the C carbon atom of the catalyst to the O atom of CO. This is a necessary step for formation of the formic acid product, which goes along with elongation of the intermediate IrO bond. Figure 6a–d show the corresponding URVA analysis. According to Figure 6b, CH bond cleavage (orange line) takes place in phase 5, strongly supporting, and in phase 6, strongly resisting. The CH distance starts to increase in phase 5, however it takes until the end of phase 10 to reach its final distance of 3.1 Å (see Figure 6c).
The formation of the new OH bond starts in phase 4 (red line), as depicted in Figure 6b and is finalized in phase 6, also reflected by the corresponding change of the OH distance shown in Figure 6c. What is intersting to note is that the changes of OH and CH distances complement each other. A secondary contribution to the mechanism is the change of CO from double to single bond character (purple line in Figure 6b) in phases 5 and 6. Overall, changes in the atomic charges are only marginal (see Figure 6d). According to Figure 6a, the largest contributions to the activation energy are (i) OH bond formation and elongation of the IrO bond in phase 4 (3.8 kcal/mol) and (ii) hydrogen atom transfer accompanied by the change of the CO bond from double to single bond in phase 5 (9.8 kcal/mol).
Reaction R3 In reaction R3 of the catalytic cycle, formic acid is released, accompanied by a cleavage of the intermediate IrO bond (already weakened in R2), reducing the metal coordination number from 6 to 5, which leads to a reorganization the Ir coordination sphere, in particular a change in the H and H ligand positions. The URVA results of R3 are summarized in Figure 7a–d. The curvature profile Figure 7b shows that IrO bond cleavage (blue line) starts in phase 2, with a supporting contribution. This is also reflected by a steep increase in the IrO distance starting in that phase, (see Figure 7c) and an increase of the Ir charge (see Figure 7d). The next stages of IrO bond cleavage occur in phases 3 and 4 (see IrO) first resisting and then supporting (phase 5, after the TS) with the final IrO distance of 4.1 Å reached at the end of the reaction (see Figure 7c).
According to Figure 7b, there is also a contribution from the NH hydrogen bond cleavage (pink line) in phase 3 (the NH hydrogen bond is not shown in Figure 1 for simplicity), which starts in phase 2 and is finalized in phase 6. The cleavage of the NH bond is also reflected in Figure 7c showing a steady increase of the NH bond distance from 1.75 Å to 3.2 Å. The change of the metal coordination sphere being related to the change of the H and H ligand positions is reflected by IrH (orange line) and IrH (red line) curvature components in phases 3 and 4. The contribution of the IrH component is larger, indicating a stronger electronic structure change of the metal caused by displacement of this equatorial ligand. As shown in Figure 7a, the largest energy contribution of 7.0 kcal/mol to the activation energy results from the first stage of IrO bond cleavage occurring in phase 2. The second stage of IrO bond cleavage in phase 3, together with IrH and IrH ligand reorganization and NH hydrogen bond cleavage contribute 5.3 kcal/mol to the activation energy.
Reaction R4Figure 8a–d illustrate the change of the reaction properties along the reaction path for reaction R4 of the catalytic cycle, which involves the addition of diatomic hydrogen to the coordination sphere of the metal via –H coordination; the first part of restoring the catalyst, which implies an increase of the Ir coordination number from 5 to 6. According to Figure 8b the IrH (green line) and IrH (blue line) bond components contribute to the reaction curvature in phases 2, 3, and 5. As depicted in Figure 8c IrH and IrH distances start to decrease in phase 2. Although the starting H distance is 4.2 Å, considerably larger than the H distance of 3.45 Å, both bonds are finalized simultaneously at the end of phase 5. There is also a minor contribution of the HH component (red line) to the reaction curvature in phase 5 (see Figure 8b), reflecting changes of the HH bond in this phase, where the –H complexation to the metal is finalized. The change of the metal coordination sphere in this reaction phase leads to an increase of negative charge on Ir atomic atom, as shown in Figure 8d. The activation energy of reaction R4 is relatively small, (DFT result: E = 1.2 kcal/mol, Figure 8a), mainly resulting from electronic structure reorganization of the IrH and IrH bonds taking place in phase 3.
Reaction R5 In reaction R5 the initial catalyst is recovered, which implies HH bond cleavage of the –H coordinated H ligand, IrH bond cleavage, migration of H to C and CH bond formation. The corresponding URVA analysis is illustrated in Figure 9a–d. Figure 9b shows that IrH bond cleavage (orange line) starts in phase 4 and proceeds through the following phases until phase 10. As reflected in Figure 9b, the initial IrH distance of 1.8 Å starts to increase in phase 4 until its final value of 3.5 Å is reached at the end of the reaction. HH bond cleavage (red line) starts at the border between phases 3 and 4, dominates phase 6 shortly before the TS with a large supporting contribution and proceeds parallel to IrH bond cleavage until phase 10. It is interesting to note that elongation of the HH bond starts in phase 6 (see Figure 9c) which parallels charge separation, H migrating to the C carbon atom to form a CH bond becomes more positively charged and H forming a stronger IrH bond, more negatively charged (see Figure 9d). According to Figure 9b, CH bond formation (green line) starts in phase 3 and is finalized in phase 7, after the TS and is revealed by a large curvature contribution.
In phase 7 the CH bond length reached its final value, as shown in Figure 9c. According to Figure 9a, the largest energy contributions to the activation energy occur in reaction phases 4 (5.5 kcal/mol) and 5 (7.1 kcal/mol), corresponding to IrH bond cleavage and strengthening of the IrH bond (see Figure 9b). In addition, it is important to note that HH bond cleavage contributes only 4.2 kcal/mol to the activation energy in the reaction phase 6, assisted by the charge polarization of both H atoms.
3.3. Chemical Bond Analysis
The URVA analysis was complemented with LMA and QTAIM bond analyses for all stationary points of reactions R0–R5 in order provide further insides into the mechanism and to confirm the URVA analysis. Table 3 presents bond length R, local mode force constant k and related bond strength order BSO and energy density H for those bonds of reactants RE, transition states TS and products PR which change their character during the reaction. In order to limit the number of entries reported in this table, we assumed that the product of the previous catalyzed reaction is the same as the reactant of the next reaction in the catalytic cycle, although the IRC calculations did finish at slightly different geometries.
Reaction R0 Reaction R0 includes HH bond cleavage, formation of a new CH and OH bond, and the change of CO bond character in CO. There are five bonds involved in this reaction, namely CO, CO, CH, OH, and HH (see Table 3). The CO bond of CO is changing its character from a double bond in RE to a single bond in PR, which is confirmed by the decreasing value of k (16.364, 10.621, and 5.972 mDyn/Å for RE, TS and PR, respectively) which is in line with a bond length increase (1.169, 1.260, and 1.353 Å for RE, TS and PR, respectively) and the decreasing covalent character (−0.7594, −0.6537, and −0.4670, Hr/Bohr for RE, TS and PR, respectively). In contrast, the CO bond of CO keeps its double character during this reaction, however, its strength is slightly decreasing (16.402, 14.830, and 13.994 mDyn/Å, for RE, TS and PR, respectively), the bond length is slightly increasing (1.169, 1.176, and 1.198 Å for RE, TS and PR, respectively), and the covalent character is slightly decreasing (−0.7597, −0.7484, and −0.7315 Hr/Bohr for RE, TS and PR, respectively). Two bonds are formed in this reaction, namely CH and OH, while the HH bond is cleaved. Consequently, the strength of the CH bond is increasing (0.019, 0.865, and 4.805 mDyn/Å for RE, TS and PR, respectively), its length is decreasing (3.128, 1.447, and 1.108 Å for RE, TS and PR, respectively), and its covalent character is increasing (−0.0666 and −0.2896 Hr/Bohr, for TS and PR, respectively). Similarly, the strength of the OH bond is increasing (0.017, 1.686, and 8.005 mDyn/Å for RE, TS and PR, respectively), its length is decreasing (2.959, 1.308, and 0.969 Å for RE, TS and PR, respectively), and its covalent character is increasing (0.0010, −0.1021, and −0.5918 Hr/Bohr for RE, TS and PR, respectively). Finally, the HH bond is cleaved in this reaction, which is confirmed by its decreasing strength (5.898, 1.210, and 0.469 mDyn/Å for RE, TS and PR, respectively), by its increasing length (0.743, 1.030, and 2.120 Å for RE, TS and PR, respectively), and by its decreasing covalent character (−0.3364 and −0.0861 Hr/Bohr for RE and TS, respectively). In summary, the LMA and QTAIM analyses taken at the stationary points are completely in line with the URVA analysis.
Reaction R1 Reaction R1 involves addition of CO to the metal center forming the IrO bond, H atom transfer from the metal to the CO ligand via cleavage of the IrH bond, and the formation of the CH bond. Five bonds are involved in this process, namely CO, CO, CH, IrO, and IrH (see Table 3). The CO bond of CO keeps more or less its double character during reaction R1, although its strength is somewhat decreasing as reflected by the k values (16.098, 9.679, and 10.562 mDyn/Å for RE, TS and PR, respectively), increasing bond length (1.170, 1.242, and 1.240 Å for RE, TS and PR, respectively) and decreasing covalent character (−0.7449, −0.6444, −0.6432 Hr/Bohr for RE, TS and PR, respectively). In contrast, the CO bond of CO is changing its character from a double to a single bond upon CO addition to the metal. The strength of the CO bond is decreasing (16.039, 8.344, and 8.253 mDyn/Å for RE, TS and PR, respectively), the bond length is increasing (1.170 1.268, and 1.283 Å for RE, TS and PR, respectively) and the covalent character is decreasing (−0.7436, −0.6083, and −0.5787 Hr/Bohr for RE, TS and PR, respectively). The changes of the CO bond are a consequences of the IrO bond formation in this reaction. The strength of the IrO bond is consequently increasing (k = 0.049, 0.415, and 1.184 mDyn/Å for RE, TS and PR, respectively) and its length is decreasing (4.262, 2.893, and 2.222 Å for RE, TS and PR, respectively). We observed only for the PR IrO bond a bond critical with a small covalent character (−0.0038 Hr/Bohr). The reaction R1 also involves a H atom transfer from the catalyst to the incoming CO ligand, where the IrH bond of the catalyst is cleaved, and the new CH bond is formed. Consequently, the strength of the IrH bond is decreasing (k = 1.983 and 0.415 mDyn/Å for RE and TS, respectively), its length is increasing (1.679, 2.359, and 4.079 Å for RE, TS and PR, respectively), and its covalent character is decreasing (−0.0574 and −0.0003 Hr/Bohr for RE and TS, respectively). The formation of the CH bond is reflected by increasing bond strength (0.041, 3.090, and 4.692 mDyn/Å for RE, TS and PR, respectively), decreasing bond length (2.769 1.153, and 1.111 Å for RE, TS and PR, respectively) and increasing covalent character (0.0014, −0.2259, and −0.2828 Hr/Bohr for RE, TS and PR, respectively). In conclusion, we observe that the results of the LMA and QTAIM analyses of the reaction R1 are in support of the results of the URVA analysis, similarly as for the reaction R0.
Reaction R2 Reaction R2 involves H atom transfer from the catalyst to the CO ligand and subsequent OH bond formation implying the cleavage of a catalyst CH bond. There are six bonds involved in this process, CO, CO, CH, CH, OH, and IrO (see Table 3). As the H atom is transferred from C to the CO ligand, the strength of the CH bond is decreasing (k = 5.237, 0.138, and 0.117 mDyn/Å for RE, TS and PR, respectively), and its length is consequently increasing (1.094, 2.623, and 3.084 Å for RE, TS and PR, respectively). We observed only a bond critical point for the RE CH bond with a relatively large covalent character (−0.2896 Hr/Bohr). The change of OH bond properties are going into the opposite direction. The OH bond strength is increasing (k = 0.029, 6.893, and 4.053 mDyn/Å for RE, TS and PR, respectively), the bond length is decreasing (2.403, 0.985, and 1.011 Å for RE, TS and PR, respectively), and the covalent character is increasing (0.0020, −0.5652, and −0.4934 Hr/Bohr for RE, TS and PR, respectively). It is interesting to note that at the TS the OH bond is stronger (6.893 mDyn/Å), shorter (0.985 Å) and more covalent (−0.5652 Hr/Bohr) than in the PR. As the reaction proceeds, the CO bond is changing its character from double bond to a single bond, which is reflected in the RE, TS, and PR bond properties. The strength of the CO bond is decreasing (k = 10.562, 7.086, and 7.134 mDyn/Å for RE, TS and PR, respectively), its length is increasing (1.240, 1.318, and 1.311
Å for RE, TS and PR, respectively), and its covalent character is decreasing (−0.6432, −0.5196, and −0.5320 Hr/Bohr for RE, TS and PR, respectively). CO bond properties are going in the opposite direction, as the character of this bond is changing from a single to a double bond. The strength of the CO bond is increasing (k = 8.253, 11.827, and 11.316 mDyn/Å for RE, TS and PR, respectively), its length is decreasing (1.283 1.224, and 1.229
Å RE, TS and PR, respectively), and its covalent character is increasing (−0.5787, −0.6731, and −0.6671 Hr/Bohr for RE, TS and PR, respectively). The change of the CO bond properties, affects in turn the properties of the IrO bond. The IrO bond becomes weaker (k = 1.184, 0.573, and 0.635 mDyn/Å for RE, TS and PR, respectively), longer (2.222, 2.351, and 2.333 Å for RE, TS and PR, respectively), and less covalent (−0.0038, 0.0002, and −0.0002 Hr/Bohr for RE, TS and PR, respectively). The strength of the CH bond increases only slightly, as reflected by its k values (4.692, 5.302, and 5.270 mDyn/Å for RE, TS and PR, respectively), its bond length (1.111, 1.096, and 1.097 Å for RE, TS and PR, respectively), and its covalent character (−0.2828, −0.3133, and −0.3115 Hr/Bohr for RE, TS and PR, respectively). Again, these results are in line with the URVA analysis.
Reaction R3 Reaction R3 involves the dissociation of the HCOOH product from the metal coordination sphere via IrO bond cleavage, affecting also the properties of both CO and CO bonds. In addition, this process changes the metal coordination numbers from 6 to 5, which is accompanied by the change of H and H atomic positions and the change of IrH and IrH bond properties. As such, six bonds are involved, CO, CO, IrO, IrH, IrH, and NH (see Table 3). The IrO bond strength is decreasing (k = 0.635, 0.076, and 0.050 mDyn/Å for RE, TS and PR, respectively), the bond becomes longer (2.333, 3.476, and 4.085
Å for RE, TS and PR, respectively) and less covalent (−0.0002 and 0.0004 Hr/Bohr for RE and TS, respectively; no bond critical point was found for PR). Cleavage of the IrO bond affects the properties of the CO bond, which becomes stronger (k = 11.316, 12.883, and 13.069 mDyn/Å for RE, TS and PR, respectively), shorter (1.229, 1.210, and 1.209 Å for RE, TS and PR, respectively), and more covalent (−0.6671, −0.6978, and −0.6967 Hr/Bohr for RE, TS and PR, respectively). In contrast, the CO bond becomes weaker (k = 7.134, 6.260, and 6.280 mDyn/Å for RE, TS and PR, respectively), longer (1.311, 1.337, and 1.338 Å for RE, TS and PR, respectively) and less covalent (−0.5320, −0.4924, and −0.4907 Hr/Bohr for RE, TS and PR, respectively), although the overall changes of CO bond properties are smaller than those for the CO bond. Change of the metal coordination number from 6 to 5 during this reaction implies a change of the H and H ligand positions in the metal coordination sphere, which affects the IrH and IrH bond properties. The IrH bond becomes weaker (3.139, 3.129, and 2.758 mDyn/Å for RE, TS and PR, respectively), longer (1.564, 1.548, and 1.576
Å for RE, TS and PR, respectively), and less covalent (−0.0981, −0.1078, and −0.0949 Hr/Bohr for RE, TS and PR, respectively). However, although the IrH bond becomes somewhat weaker (k = 2.833, 2.737, and 2.728 mDyn/Å for RE, TS and PR, respectively), it becomes shorter (1.590, 1.586, and 1.578 Å for RE, TS and PR, respectively), and slightly more covalent (−0.0874, −0.0900, and −0.0939 Hr/Bohr for RE, TS and PR, respectively). The values of the IrH and IrH PR bond properties are similar (k = 2.758 and 2.728 mDyn/Å, R = 1.576 and 1.578 Å, and H = −0.0949 and −0.0939 Hr/Bohr, for IrH and IrH, respectively), which is consistent with their similar positions in the metal coordination sphere. There is an additional NH bond involved in reaction R3 with hydrogen bond character N…HO, which is cleaved during the reaction. The strength of the NH bond continuously decreases (k = 0.219, 0.129, and 0.029 mDyn/Å for RE, TS and PR, respectively), the length increases (1.747, 2.031, and 3.225 Å for RE, TS and PR, respectively), and the covalent character decreases (−0.0040 and −0.0007 Hr/Bohr for RE and TS R, respectively, no bond critical point was found for PR. In conclusion, the results of the LMA and QTAIM analyses are consistent with the results of the URVA analysis.
Reaction R4 Reaction R4 involves the –H coordination of H to the metal center, the first step of catalyst recovery. The coordination number of the metal is changed back from 5 to 6 and two new bonds are formed between the metal and H, i.e., IrH and IrH, changing the properties of the HH bond from the incoming H ligand. H addition also changes properties of the IrH and IrH bonds caused by the change of the H and H ligand positions in the coordination sphere. Five bonds are involved in this process, HH, IrH, IrH, IrH and IrH (see Table 3). The strength of the IrH bond is increasing (k = 0.004, 0.071, and 0.730 mDyn/Å) for RE, TS and PR, respectively) and its length is decreasing (4.201, 3.210, and 1.829 Å for RE, TS and PR, respectively). No bond critical point could be found for any of the three stationary points. Similarly, the strength of the IrH bond is increasing as well (k = 0.004, 0.050, and 0.807 mDyn/Å for RE, TS and PR, respectively), the length is decreasing (3.461 2.597, and 1.787 mDyn/Å for RE, TS and PR, respectively), and its covalent character is increasing (0.0004, 0.0001, and −0.0275 Hr/Bohr for RE, TS and PR, respectively). The H addition to the metal changes properties of the HH bond, which becomes weaker (k = 5.744, 5.371, and 1.826 mDyn/Å for RE, TS and PR, respectively), longer (0.745 0.750, and 0.842 Å for RE, TS and PR, respectively) and less covalent (−0.3330, −0.3225, and −0.2020 Hr/Bohr for RE, TS and PR, respectively). This is important for the final step of the catalytic cycle, in which the HH bond has to be cleaved. The H and H atoms are moving into new positions, affecting the IrH bond which becomes slightly stronger (k = 2.758, 3.318, and 2.783 mDyn/Å for RE, TS and PR, respectively), slightly longer (1.576, 1.545, and 1.589 Å for RE, TS and PR, respectively), and less covalent (−0.0949, −0.1091, and −0.0889 Hr/Bohr for RE, TS and PR, respectively). Similar changes were found for the IrH bond.The bond strength is increasing (k = 2.728, 2.760, and 2.762 mDyn/Å for RE, TS and PR, respectively), the bond length is increasing (1.578, 1.595, and 1.604 Å for RE, TS and PR, respectively), and the covalent character is decreasing (−0.0939, −0.0859, and −0.0829 Hr/Bohr for RE, TS and PR, respectively). These results fully support the URVA analysis.
Reaction R5 The last reaction of the catalytic cycle involves the dissociation of the HH bond from the H ligand, the transfer of the H atom from the metal center to the C carbon atom of the catalyst accompanied by the cleavage of the IrH bond, and the strengthening of the two IrH and CH bonds, regenerating the original catalyst. Six bonds are involved in this process, HH, IrH, IrH, IrH, IrH and CH (see Table 3). The strength of the already weakened HH bond decreases further (k = 1.826, 0.707, and 0.037 mDyn/Å for RE, TS and PR, respectively), its length increases (0.842, 0.986, and 3.182 Å for RE, TS and PR, respectively), and its covalent character decreases (−0.2020 and −0.0907 Hr/Bohr for RE and TS, respectively, no bond critical point was found for PR). The strength of the IrH bond is decreasing (k = 0.730, 0.355, and 0.107 mDyn/Å or for RE, TS and PR, respectively) and its length is increasing (1.829, 2.335, and 3.588 Å for RE, TS and PR, respectively) without bond critical points in this reaction. CH bond formation is confirmed by increasing bond strength (k = 0.105, 0.932, and 5.118 mDyn/Å for RE, TS and PR, respectively)), decreasing bond length (3.481, 1.580, and 1.098
Å for RE, TS and PR, respectively)) and increasing covalent character (−0.0371 and −0.2792 Hr/Bohr for TS and PR, respectively, no bond critical point was found for RE). Strengthening of the IrH bond is reflected by increasing k values ( 0.807, 0.567, and 1.987 mDyn/Å or RE, TS and PR, respectively), decreasing bond length (1.787, 1.909, and 1.679 Å or RE, TS and PR, respectively), and increasing covalent character (−0.0275, −0.0202, and −0.0581 Hr/Bohr or RE, TS and PR, respectively). The strength of the IrH bond is decreasing (k = 2.783, 2.737, and 1.988 mDyn/Å for RE, TS and PR, respectively), the length is increasing (1.589, 1.591, and 1.679
Å for RE, TS and PR, respectively), and the covalent character is decreasing (−0.0889, −0.0863, and −0.0581 Hr/Bohr for RE, TS and PR, respectively) whereas the properties of the IrH bond are changing in the opposite direction. The strength of this bond increases (k = 2.762, 2.842, and 2.914 mDyn/Å for RE, TS and PR, respectively), the length decreases (1.604, 1.592, and 1.585 Å for RE, TS and PR, respectively), and the covalent character increases (−0.0829, −0.0869, and −0.0894 Hr/Bohr RE, TS and PR, respectively). Again, these results fully support the URVA analysis.
In conclusion, the LMA and QTAIM analyses performed at all stationary points of reactions R0–R5 deepen the insights obtained with URVA by adding bond specific details. In the last section, overall trends of the LMA and QTAIM bond properties based on Table 3 data are presented to round up the results and discussion part.
3.4. Comparison of Relative Bond Strength Orders BSO
Local mode force constants k can be transformed into relative bond strength orders BSO, which asses bond strength in a more commonly used language referring to single and multiple bond character of a bond, and in this way offering a more convenient way to compare bond strengths in aseries of molecules. BSO values were obtained described in the computational section, based on the reference molecules summarized in Table 1. Figure 10a–d show BSO values as a function of the local mode force constants k, for the CO, CH, HH, and OH bonds and Figure 11a–b for IrO and IrH bonds. There are two types of CO bonds, CO and CO, which are changing their bond strengths in reactions R0–R3. According to Figure 10a, largest CO BSO values are in the range of 2.2 indicating strong double bond character. The strongest strongest CO bonds were found for the RE of the non-catalyzed reaction R0 with BSO values close to the BSO of 2.271 of the CO bond in the CO molecule (see Table 1). The smallest BSO values are in the range of 1.2 indicating single bond character, with the TS values in between. The weakest CO bond is found again for the PR of the non-catalyzed reaction R0.
Figure 10b shows the BSO values for CH and CH bonds of the catalyst, which are changing in reactions R0–R2, and R5. For example, the dissociating CH bond of reaction R2 starts with an RE BSO value of 0.821, which is close to a single bond bond strength and drops down in the PR to a value of 0.228, indicating a weak CH interaction, already shown in the TS with a BSO value of 0.241. The BSO values for the HH bonds are presented in Figure 10c for reactions R0, R4, and R5. The HH bond of the RE for both non-catalyzed reaction R0 and catalyzed reaction R4 are the strongest with BSO values in the range of 0.85, which are close to the BSO value of 0.855 of the HH bond of the free H molecule (see Table 1. The weakest HH interaction is found for the RE of reaction R5 with a BSO value of 0.575, facilitating the cleavage of this bond. There is one OH formed in reactions R0 and R2. The small RE BSO value of 0.119 reflects that there is only a weak interaction in the RE van der Waals complex. The BSO value increases to 0.560 at the TS and the PR BSO of 0.947 indicates OH single bond character upon OH bond formation. Figure 11a–b present plots of the BSO values for the IrO and IrH bonds. The IrO bonds change in reactions R1–R3. Corresponding BSO values are presented in Figure 11a. For example, in reaction R1 the IrO bond is formed, starting with a small RE BSO value of 0.107, which increases to 0.352 for the TS and to 0.633 for the PR. It is interesting to note that the overall BSO values of all IrO bonds in this study are smaller than 1, indicating relatively weak bond strength character. Figure 11b shows the BSO values of the IrH bonds, such as IrH, IrH, IrH, and IrH, which are formed, cleaved, and changed in reactions R1, and R3–R5. For example, in reaction R3, upon dissociation of the HCOOH ligand, the IrH bond is only changing slightly its character, with a BSO values of 0.772 for the RE, 0.770 for the TS, and 0.710 for the PR.
3.5. Correlations between Bond Properties and Local Mode Force Constants
Figure 12 and Figure 13 present the correlation between bond strength expressed by the local mode force constants and bond length, which according to the Badger rule [139,170] leads to a power relationship. Figure 12a shows the correlation for CO bonds of reactions R0–R3.
According to Figure 12a, stronger CO bonds are connected to shorter CO bonds. The R value of 0.9858 confirms a significant correlation between these two properties. larger divergencies are observed for the CO bond at TS of reaction R0, and CO and CO bonds at the TSs of reaction R1. Figure 12b shows a similar correlation between bond length and bond strength for the CH bonds in reactions R0–R2, and R5. The R factor of this correlation has a somewhat lower value of 0.9310, corresponding to a good correlation. The divergency occurs for the CH bond at the TS of reaction R0. The correlation between bond strength and bond length for the HH bonds are presented in Figure 12c, showing the results for the HH bonds in reactions R0, R4, and R5. This correlation has an R value of 0.8801, with outliers for PRs of reactions R0 and R4 and the RE of reaction R5. Figure 12d shows a significant correlation between bond strength and bond length for the OH bonds of reactions R0 and R2. The value of the R factor of this correlation is 0.9898 with no substantial outlier. The bond strength bond versus length correlation for the IrO bonds in reactions R1–R3 is presented in Figure 13a. The R factor of this correlation has a moderate value 0.9545, with the largest outlier for the TSs of reactions R1 and R2. Figure 13b shows the correlation between bond strength and bond length for the IrH bonds of reactions R1, and R3–R5. The R value of 0.9099 indicates a moderate correlation, smaller than that found for the IrO bonds. Largest outliers are found for the IrH TS bond of reaction R1, the IrH and IrH TS bonds of reactions R5, and for the PR IrH and IrH bonds of reaction R4. In summary, we observed a satisfactory correlation between bond strength and bond length, in line with the popular rule that the stronger bond is also the shorter bond. However, this is not always the case as demonstrated by the increasing number of exceptions from this simple rule, reported in the literature [87,88,90,171,172]. The outliers in the correlations presented in this work are mostly related to the TS stationary points. At the TS, in particular for bond breaking/forming processes, significant electronic structure rearrangements take place, e.g., leading to a stage between two different hybridization forms, which can cause an unusual bonding situation that cannot be captured by such an empirical correlation.
Energy density versus Local mode force constant As outlined above, the energy density H is convenient measure of the covalent character of a chemical bond or weak chemical interaction based on the electron density. Overall, we observed in our study that the stronger bonds have more covalent character, expressed by a more negative value of H. Figure 14 and Figure 15 present the correlations between H and k based on a linear relationship. Figure 14a shows the correlation for the CO and CO bonds of reactions R0–R3. The R factor has a value of 0.9411, with a number of small outliers mostly for TSs. The bond strength-energy density correlation for the CH and CH bonds of reactions R0–R2, is presented in Figure 14b. The R value of 0.9758 reflects a good correlation, with the largest outlier for the TS CH bond of reaction R1. Figure 14c shows the same correlation for the HH bonds of reactions R0, R4, and R5, with a R value of 0.9438. The largest outlier was found for the PR HH bond of reaction R4. The correlation between energy density and bond strength for the OH bonds of reactions R0 and R2 is shown in Figure 14d. The R factor for this reaction, has a value of 0.9256 reflecting a moderate correlation with the largest outlier for the PR OH bond of reaction R2. Figure 15a presents the correlation between H and k for the IrO bonds in reactions R1–R3. As obvious from the R factor of 0.7816, there is only some trend between these two properties. One also has to consider the scarcity of the data points. It is interesting to note that the PR IrO bond of reaction R2 has an H close to zero, indicating a more electrostatic character of this bond. A similar situation occurs for the TS IrO bond of reaction R3. A better correlation between energy density and bond strength is observed for the IrH bonds of reactions R1 and R3–R5 shown in Figure 15b. The R factor of that correlation has a value of 0.9829, with some outlier such as the TS IrH bond of the reaction R1, or the TS IrH bond of reaction R3.
In summary, overall, we observed a good correlation between energy density H and bond strength expressed by the local mode force constant k, which indicates that the strength of the bonds investigated in this work is predominantly based on their covalent character. However, a caveat is appropriate. H reflects bonding at just one point of the electron density, namely the bond critical point, whereas the k as a second order property picks up the electronic environment [91]. As such it is more sensitive in the case of complex bonding situation as, e.g., found for the IrO bonds showing only a trend but not a significant correlation between these two properties.
4. Conclusions and Outlook
We investigated in this study the catalytic cycle (reactions R1–R5) of carbon dioxide hydrogenation catalyzed with an iridium pincer model complex, which reduces the unfavorable activation energy of 76 kcal/mol for the non-catalyzed gas phase reaction R0 by more than 100%. As a computational tool we used URVA to explore the mechanistic features of each reaction step in all detail, shedding new light on which are the most energy consuming events in the non-catalyzed reaction, and how are they avoided in the catalyzed reaction. URVA was complemented by LMA and QTAIM analyses at all stationary points of each reaction. We used the DFT level of theory for URVA, LMA, and QTAIM, whereas for the energetics a dual approach (i.e., single point DLPNO-CCSD(T) energy calculations for all stationary points based on the DFT geometries) was applied. The most important findings of our study showing for the first time how the catalyst effectively manages to keep energy demand at a balance are summarized in the following list:
- According to the URVA analysis, the most energy consuming process of the non-catalyzed reaction R0 is the cleavage of the HH bond of the H reactant, which takes place before TS, and as such contributes to the activation energy with 40.8 kcal/mol.
- In order to avoid direct HH bond cleavage, the catalyst divides the one–step non-catalytic reaction into a multistep catalytic cycle; CO addition to the catalyst, H atom transfer between catalyst and CO ligand, release of HCOOH product, addition of H, reorganization of the coordination sphere of the catalyst to achieve its original form. Each of these decisive steps could be clearly identified in the characteristic curvature profiles for the first time.
- The expensive cleavage of the HH bond in the non-catalyzed reaction, is replaced in the catalyzed reaction by H transfer (reaction R2) requiring the cleavage of an IrH bond with a significantly smaller contribution of 9.8 kcal/mol to the activation energy, which is revealed by both energy and curvature profiles.
- The dissociation of the final product from the catalyst (reaction R3) is characterized by the cleavage of an IrO bond and an intermediate NH hydrogen bond, and according to our URVA analysis, both contribute to the activation energy with a moderate amount of 12.3 kcal/mol.
- As unravelled by the URVA curvature profiles most of the events related to the reorganization of the catalyst to restore its original form (reaction R5) occur after the TS, i.e., they do not contribute to the activation energy.
In summary, the URVA analysis complimented with the LMA and QTAIM methods provided new comprehensive mechanistic details of all reaction steps forming the catalytic cycle of the hydrogenation of carbon dioxide, which hopefully will stimulate and inspire the community working on this important topic. Experiments suggest that the catalytic activity of iridium pincer complexes for the hydrogenation of carbon dioxide can be considerably increased under basic reaction conditions [43,44]. A follow-up URVA study is planned to explore this.
Supplementary Materials
The following supporting information can be downloaded at: https://www.mdpi.com/article/10.3390/inorganics10120234/s1, containing reaction movies R0–R5 and the Cartesian coordinates of the stationary point, i.e, the reactant complex, TS and product complex for all six reactions R0–R5.
Author Contributions
Conceptualization, E.K. and M.F.; methodology, M.F. and E.K.; validation, E.K. and M.F.; formal analysis, M.F. and E.K.; investigation, M.F. and E.K.; resources, E.K.; data curation, M.F.; writing—original draft preparation, M.F.; writing—review and editing, E.K.; funding acquisition, E.K. All authors have read and agreed to the published version of the manuscript.
Funding
This research was funded by the National Science Foundation NSF, grant CHE 2102461.
Data Availability Statement
All data supporting the results of this work are presented in tables and figure of the manuscript and in the Supplementary Materials.
Acknowledgments
We thank Juliana Antonio for many useful comments and suggestions. This work was supported by the National Science Foundation, Grant CHE 2102461. We thank the Center for Research Computation at SMU for providing generous high-performance computational resources.
Conflicts of Interest
The authors declare no conflict of interest.
Abbreviations
The following abbreviations are used in this manuscript:
| URVA | unified reaction valley approach |
| DFT | density functional theory |
| DLPNO-CCSD(T) | domain–based local pair natural orbital of coupled cluster single and double with perturbative triple excitations |
| PNP | 2,6–bis(di–isopropylphosphinomethyl)pyridine |
| TOF | turnover frequency |
| TON | turnover number |
| LMA | Local Modes Analysis |
| PES | potential energy surface |
| RC | reaction complex |
| QTAIM | quantum theory of atoms-in-molecules |
| IRC | intrinsic reaction coordinate |
| NBO | natural bond orbital |
| BSO | bond strength order |
| Hr | hartree |
| RE | reactant |
| TS | transition state |
| PR | product |
References
- Zhu, S.; Tang, Y.; Qiao, X.; You, W.; Peng, C. Spatial Effects of Participation in Global Value Chains on CO2 Emissions: A Global Spillover Perspective. Emerg. Mark. Financ. Trade 2022, 58, 776–789. [Google Scholar] [CrossRef]
- García, J.; Galán, B. Integrating greenhouse gas capture and C1 biotechnology: A key challenge for circular economy. Microb. Biotechnol. 2022, 15, 228–239. [Google Scholar] [CrossRef]
- Lindsey, R. Climate Change: Atmospheric Carbon Dioxide. Climate Change Report. 2022. Available online: https://www.climate.gov/news-features/understanding-climate/climate-change-atmospheric-carbon-dioxide (accessed on 27 November 2022).
- Betts, R. Met Office: Atmospheric CO2 Now Hitting 50% Higher Than Pre-Industrial Levels. CarbonBrief. 2021. Available online: https://www.carbonbrief.org/met-office-atmospheric-co2-now-hitting-50-higher-than-pre-industrial-levels (accessed on 27 November 2022).
- Heffernan, J.K.; Valgepea, K.; de Souza Pinto Lemgruber, R.; Casini, I.; Plan, M.; Tappel, R.; Simpson, S.D.; Köpke, M.; Nielsen, L.K.; Marcellin, E. Enhancing CO2–Valorization Using Clostridium autoethanogenum for Sustainable Fuel and Chemicals Production. Front. Bioeng. Biotechnol. 2020, 8, 204. [Google Scholar] [CrossRef] [PubMed] [Green Version]
- Gabrielli, P.; Gazzani, M.; Mazzotti, M. The Role of Carbon Capture and Utilization, Carbon Capture and Storage, and Biomass to Enable a Net–Zero–CO2 Emissions Chemical Industry. Ind. Eng. Chem. Res. 2020, 59, 7033–7045. [Google Scholar] [CrossRef] [Green Version]
- Aresta, M. Carbon Dioxide as a Chemical Feedstock; John Wiley & Sons: Hoboken, NJ, USA, 2010. [Google Scholar]
- Sakakura, T.; Choi, J.C.; Yasuda, H. Transformation of Carbon Dioxide. Chem. Rev. 2007, 107, 2365–2387. [Google Scholar] [CrossRef]
- Wang, W.; Wang, S.; Ma, X.; Gong, J. Recent advances in catalytic hydrogenation of carbon dioxide. Chem. Soc. Rev. 2011, 40, 3703–3727. [Google Scholar] [CrossRef] [Green Version]
- Benson, E.E.; Kubiak, C.P.; Sathrum, A.J.; Smieja, J.M. Electrocatalytic and homogeneous approaches to conversion of CO2 to liquid fuels. Chem. Soc. Rev. 2009, 38, 89–99. [Google Scholar] [CrossRef]
- Riduan, S.N.; Zhang, Y. Recent developments in carbon dioxide utilization under mild conditions. Dalton Trans. 2010, 39, 3347–3357. [Google Scholar] [CrossRef]
- Liew, F.E.; Nogle, R.; Abdalla, T.; Rasor, B.J.; Canter, C.; Jensen, R.O.; Wang, L.; Strutz, J.; Chirania, P.; De Tissera, S.; et al. Carbon–negative production of acetone and isopropanol by gas fermentation at industrial pilot scale. Nat. Biotechnol. 2022, 40, 335–344. [Google Scholar] [CrossRef] [PubMed]
- Köpke, M.; Simpson, S.D. Pollution to products: Recycling of above ground carbon by gas fermentation. Curr. Opin. Biotechnol. 2020, 65, 180–189. [Google Scholar] [CrossRef]
- Kato, J.; Takemura, K.; Kato, S.; Fujii, T.; Wada, K.; Iwasaki, Y.; Aoi, Y.; Matsushika, A.; Murakami, K.; Nakashimada, Y. Metabolic engineering of Moorella thermoacetica for thermophilic bioconversion of gaseous substrates to a volatile chemical. AMB Express 2021, 11, 59. [Google Scholar] [CrossRef]
- Garrigues, L.; Maignien, L.; Lombard, E.; Singh, J.; Guillouet, S.E. Isopropanol production from carbon dioxide in Cupriavidus necator in a pressurized bioreactor. New Biotechnol. 2020, 56, 16–20. [Google Scholar] [CrossRef] [PubMed]
- Bontemps, S.; Vendier, L.; Sabo-Etienne, S. Ruthenium–Catalyzed Reduction of Carbon Dioxide to Formaldehyde. J. Am. Chem. Soc. 2014, 136, 4419–4425. [Google Scholar] [CrossRef] [PubMed]
- LeBlanc, F.A.; Piers, W.E.; Parvez, M. Selective Hydrosilation of CO2 to a Bis(silylacetal) Using an Anilido Bipyridyl–Ligated Organoscandium Catalyst. Angew. Chem. Int. Ed. 2014, 53, 789–792. [Google Scholar] [CrossRef] [PubMed]
- Graciani, J.; Mudiyanselage, K.; Xu, F.; Baber, A.E.; Evans, J.; Senanayake, S.D.; Stacchiola, D.J.; Liu, P.; Hrbek, J.; Sanz, J.F.; et al. Highly active copper–ceria and copper–ceria–titania catalysts for methanol synthesis from CO2. Science 2014, 345, 546–550. [Google Scholar] [CrossRef]
- Declercq, R.; Bouhadir, G.; Bourissou, D.; Légaré, M.A.; Courtemanche, M.A.; Nahi, K.S.; Bouchard, N.; Fontaine, F.G.; Maron, L. Hydroboration of Carbon Dioxide Using Ambiphilic Phosphine–Borane Catalysts: On the Role of the Formaldehyde Adduct. ACS Catal. 2015, 5, 2513–2520. [Google Scholar] [CrossRef] [Green Version]
- Rodriguez, J.; Liu, P.; Stacchiola, D.J.; Senanayake, S.D.; White, M.G.; Chen, J.G. Hydrogenation of CO2 to Methanol: Importance of Metal–Oxide and Metal–Carbide Interfaces in the Activation of CO2. ACS Catal. 2015, 5, 6696–6706. [Google Scholar] [CrossRef]
- Jaseer, E.A.; Akhtar, M.N.; Osman, M.; Al-Shammari, A.; Oladipo, H.B.; Garcés, K.; Fernández-Alvarez, F.J.; Al-Khattaf, S.; Oro, L.A. Solvent–free iridium–catalyzed CO2 hydrosilylation: Experiments and kinetic modeling. Cat. Sci. Technol. 2015, 5, 274–279. [Google Scholar] [CrossRef] [Green Version]
- Porosoff, M.D.; Yan, B.; Chen, J.G. Catalytic reduction of CO2 by H2 for synthesis of CO, methanol and hydrocarbons: Challenges and opportunities. Energy Environ. Sci. 2016, 9, 62–73. [Google Scholar] [CrossRef]
- Ríos, P.; Rodríguez, A.; López-Serrano, J. Mechanistic Studies on the Selective Reduction of CO2 to the Aldehyde Level by a Bis(phosphino)boryl (PBP)–Supported Nickel Complex. ACS Catal. 2016, 6, 5715–5723. [Google Scholar] [CrossRef]
- Grasemann, M.; Laurenczy, G. Formic acid as a hydrogen source–recent developments and future trends. Energy Environ. Sci. 2012, 5, 8171–8181. [Google Scholar] [CrossRef]
- Wang, W.H.; Himeda, Y.; Muckerman, J.T.; Manbeck, G.F.; Fujita, E. CO2 Hydrogenation to Formate and Methanol as an Alternative to Photo- and Electrochemical CO2 Reduction. Chem. Rev. 2015, 115, 12936–12973. [Google Scholar] [CrossRef]
- Sordakis, K.; Tang, C.; Vogt, L.K.; Junge, H.; Dyson, P.J.; Beller, M.; Laurenczy, G. Homogeneous Catalysis for Sustainable Hydrogen Storage in Formic Acid and Alcohols. Chem. Rev. 2018, 118, 372–433. [Google Scholar] [CrossRef]
- Onishi, N.; Iguchi, M.; Yang, X.; Kanega, R.; Kawanami, H.; Xu, Q.; Himeda, Y. Hydrogen Storage Technology: Development of Effective Catalysts for Hydrogen Storage Technology Using Formic Acid. Adv. Energy Mat. 2019, 9, 1970090. [Google Scholar] [CrossRef] [Green Version]
- Hayashi, H.; Ogo, S.; Fukuzumi, S. Aqueous hydrogenation of carbon dioxide catalysed by water–soluble ruthenium aqua complexes under acidic conditions. Chem. Commun. 2004, 2004, 2714–2715. [Google Scholar] [CrossRef]
- Himeda, Y.; Onozawa-Komatsuzaki, N.; Sugihara, H.; Arakawa, H.; Kasuga, K. Half-Sandwich Complexes with 4,7-Dihydroxy-1,10-phenanthroline: Water-Soluble, Highly Efficient Catalysts for Hydrogenation of Bicarbonate Attributable to the Generation of an Oxyanion on the Catalyst Ligand. Organometallics 2004, 23, 1480–1483. [Google Scholar] [CrossRef]
- Himeda, Y.; Onozawa-Komatsuzaki, N.; Sugihara, H.; Kasuga, K. Simultaneous Tuning of Activity and Water Solubility of Complex Catalysts by Acid–Base Equilibrium of Ligands for Conversion of Carbon Dioxide. Organometallics 2007, 26, 702–712. [Google Scholar] [CrossRef]
- Federsel, C.; Jackstell, R.; Beller, M. State–of–the–Art Catalysts for Hydrogenation of Carbon Dioxide. Angew. Chem. Int. Ed. 2010, 49, 6254–6257. [Google Scholar] [CrossRef]
- Langer, R.; Diskin-Posner, Y.; Leitus, G.; Shimon, L.J.W.; Ben-David, Y.; Milstein, D. Low-Pressure Hydrogenation of Carbon Dioxide Catalyzed by an Iron Pincer Complex Exhibiting Noble Metal Activity. Angew. Chem. Int. Ed. 2011, 50, 9948–9952. [Google Scholar] [CrossRef]
- Maenaka, Y.; Suenobu, T.; Fukuzumi, S. Catalytic interconversion between hydrogen and formic acid at ambient temperature and pressure. Energy Environ. Sci. 2012, 5, 7360–7367. [Google Scholar] [CrossRef]
- Jeletic, M.S.; Mock, M.T.; Appel, A.M.; Linehan, J.C. A Cobalt-Based Catalyst for the Hydrogenation of CO2 under Ambient Conditions. J. Am. Chem. Soc. 2013, 135, 11533–11536. [Google Scholar] [CrossRef]
- Huff, C.A.; Sanford, M.S. Catalytic CO2 Hydrogenation to Formate by a Ruthenium Pincer Complex. ACS Catal. 2013, 3, 2412–2416. [Google Scholar] [CrossRef]
- Filonenko, G.A.; van Putten, R.; Schulpen, E.N.; Hensen, E.J.M.; Pidko, E.A. Highly Efficient Reversible Hydrogenation of Carbon Dioxide to Formates Using a Ruthenium PNP-Pincer Catalyst. ChemCatChem 2014, 6, 1526–1530. [Google Scholar] [CrossRef]
- Kothandaraman, J.; Czaun, M.; Goeppert, A.; Haiges, R.; Jones, J.P.; May, R.B.; Prakash, G.K.S.; Olah, G.A. Amine-Free Reversible Hydrogen Storage in Formate Salts Catalyzed by Ruthenium Pincer Complex without pH Control or Solvent Change. ChemSusChem 2015, 8, 1442–1451. [Google Scholar] [CrossRef] [PubMed]
- Bertini, F.; Gorgas, N.; Stöger, B.; Peruzzini, M.; Veiros, L.F.; Kirchner, K.; Gonsalvi, L. Efficient and Mild Carbon Dioxide Hydrogenation to Formate Catalyzed by Fe(II) Hydrido Carbonyl Complexes Bearing 2,6-(Diaminopyridyl)diphosphine Pincer Ligands. ACS Catal. 2016, 6, 2889–2893. [Google Scholar] [CrossRef]
- Lu, S.M.; Wang, Z.; Li, J.; Xiao, J.; Li, C. Base-free hydrogenation of CO2 to formic acid in water with an iridium complex bearing a N,N’-diimine ligand. Green Chem. 2016, 18, 4553–4558. [Google Scholar] [CrossRef]
- Jantke, D.; Pardatscher, L.; Drees, M.; Cokoja, M.; Herrmann, W.A.; Kühn, F.E. Hydrogen Production and Storage on a Formic Acid/Bicarbonate Platform using Water-Soluble N-Heterocyclic Carbene Complexes of Late Transition Metals. ChemSusChem 2016, 9, 2849–2854. [Google Scholar] [CrossRef] [PubMed]
- Aoki, W.; Wattanavinin, N.; Kusumoto, S.; Nozaki, K. Development of Highly Active Ir–PNP Catalysts for Hydrogenation of Carbon Dioxide with Organic Bases. Bull. Chem. Soc. Jpn. 2016, 89, 113–124. [Google Scholar] [CrossRef]
- Oldenhof, S.; van der Vlugt, J.I.; Reek, J.N.H. Hydrogenation of CO2 to formic acid with iridiumIII(bisMETAMORPhos)(hydride): The role of a dormant fac-IrIII(trihydride) and an active trans-IrIII(dihydride) species. Cat. Sci. Technol. 2016, 6, 404–408. [Google Scholar] [CrossRef] [Green Version]
- Tanaka, R.; Yamashita, M.; Nozaki, K. Catalytic Hydrogenation of Carbon Dioxide Using Ir(III)–Pincer Complexes. J. Am. Chem. Soc. 2009, 131, 14168–14169. [Google Scholar] [CrossRef]
- Tanaka, R.; Yamashita, M.; Chung, L.W.; Morokuma, K.; Nozaki, K. Mechanistic Studies on the Reversible Hydrogenation of Carbon Dioxide Catalyzed by an Ir–PNP Complex. Organometallics 2011, 30, 6742–6750. [Google Scholar] [CrossRef]
- Ahlquist, M.S.G. Iridium catalyzed hydrogenation of CO2 under basic conditions—Mechanistic insight from theory. J. Mol. Catal. A 2010, 324, 3–8. [Google Scholar] [CrossRef]
- Yang, X. Hydrogenation of Carbon Dioxide Catalyzed by PNP Pincer Iridium, Iron, and Cobalt Complexes: A Computational Design of Base Metal Catalysts. ACS Catal. 2011, 1, 849–854. [Google Scholar] [CrossRef]
- Hruszkewycz, D.P.; Wu, J.; Hazari, N.; Incarvito, C.D. Palladium(I)-Bridging Allyl Dimers for the Catalytic Functionalization of CO2. J. Am. Chem. Soc. 2011, 133, 3280–3283. [Google Scholar] [CrossRef]
- Fan, T.; Chen, X.; Lin, Z. Theoretical studies of reactions of carbon dioxide mediated and catalysed by transition metal complexes. Chem. Commun. 2012, 48, 10808–10828. [Google Scholar] [CrossRef]
- Kang, P.; Cheng, C.; Chen, Z.; Schauer, C.K.; Meyer, T.J.; Brookhart, M. Selective Electrocatalytic Reduction of CO2 to Formate by Water–Stable Iridium Dihydride Pincer Complexes. J. Am. Chem. Soc. 2012, 134, 5500–5503. [Google Scholar] [CrossRef]
- Bernskoetter, W.H.; Hazari, N. A Computational Investigation of the Insertion of Carbon Dioxide into Four- and Five-coordinate Iridium Hydrides. Eur. J. Inorg. Chem. 2013, 2013, 4032–4041. [Google Scholar] [CrossRef]
- Fang, S.; Chen, H.; Wei, H. Insight into catalytic reduction of CO2 to methane with silanes using Brookhart’s cationic Ir(III) pincer complex. RSC Adv. 2018, 8, 9232–9242. [Google Scholar] [CrossRef] [Green Version]
- Schmeier, T.J.; Dobereiner, G.E.; Crabtree, R.H.; Hazari, N. Secondary Coordination Sphere Interactions Facilitate the Insertion Step in an Iridium(III) CO2 Reduction Catalyst. J. Am. Chem. Soc. 2011, 133, 9274–9277. [Google Scholar] [CrossRef]
- Onishi, N.; Xu, S.; Manaka, Y.; Suna, Y.; Wang, W.H.; Muckerman, J.T.; Fujita, E.; Himeda, Y. CO2 Hydrogenation Catalyzed by Iridium Complexes with a Proton–Responsive Ligand. Inorg. Chem. 2015, 54, 5114–5123. [Google Scholar] [CrossRef]
- Kanega, R.; Ertem, M.Z.; Onishi, N.; Szalda, D.J.; Fujita, E.; Himeda, Y. CO2 Hydrogenation and Formic Acid Dehydrogenation Using Ir Catalysts with Amide–Based Ligands. Organometallics 2020, 39, 1519–1531. [Google Scholar] [CrossRef]
- Kraka, E.; Zou, W.; Tao, Y.; Freindorf, M. Exploring the Mechanism of Catalysis with the Unified Reaction Valley Approach (URVA)—A Review. Catalysts 2020, 10, 691. [Google Scholar] [CrossRef]
- Marcus, R. On analytical mechanics of chemical reactions. Quantum mechanics of linear collisions. J. Chem. Phys. 1966, 45, 4449–4493. [Google Scholar] [CrossRef] [Green Version]
- Marcus, R. On analytical mechanics of chemical reactions. Classical mechanics of linear collisions. J. Chem. Phys. 1966, 45, 4500–4504. [Google Scholar] [CrossRef] [Green Version]
- Marcus, R. Analytical mechanics of chemical reactions. 3. Natural collision coordinates. J. Chem. Phys. 1968, 49, 2610–2616. [Google Scholar] [CrossRef]
- Hofacker, L. Quantentheorie Chemischer Reaktionen. Z. Naturforsch. A 1963, 18, 60–619. [Google Scholar] [CrossRef] [Green Version]
- Kraka, E.; Dunning, T.H., Jr. Characterization of Molecular Potential Energy Surfaces: Critical Points, Reaction Paths and Reaction Valleys. In Advances in Molecular Electronic Structure Theory: The Calculation and Characterization of Molecular Potential Energy Surfaces; Dunning, T.H., Ed.; JAI Press, Inc.: Greenwich, UK, 1990; pp. 129–173. [Google Scholar]
- Dunning, T.H., Jr.; Harding, L.B.; Kraka, E. Calculation and Characterization of Reaction Valleys for Chemical Reactions. In Supercomputer Algorithms for Reactivity, Dynamcis and Kinetics of Small Molecules; Kluwer Academic Publishers: Dordrecht, The Netherlands, 1989; p. 57. [Google Scholar]
- Kühnel, W. Differential Geometry: Curves-Surfaces-Manifolds; American Mathematics Society, AMS: New York, NY, USA, 2005. [Google Scholar]
- Page, M.; McIver, J.W., Jr. On evaluating the Reaction path Hamiltonian. J. Chem. Phys. 1988, 88, 922–935. [Google Scholar] [CrossRef]
- Konkoli, Z.; Kraka, E.; Cremer, D. Unified Reaction Valley Approach Mechanism of the Reaction CH3 + H2→CH4 + H. J. Phys. Chem. A 1997, 101, 1742–1757. [Google Scholar] [CrossRef]
- Zou, W.; Sexton, T.; Kraka, E.; Freindorf, M.; Cremer, D. A New Method for Describing the Mechanism of a Chemical Reaction Based on the Unified Reaction Valley Approach. J. Chem. Theory Comput. 2016, 12, 650–663. [Google Scholar] [CrossRef]
- Cremer, D.; Pople, J.A. General Definition of Ring Puckering Coordinates. J. Am. Chem. Soc. 1975, 97, 1354–1358. [Google Scholar] [CrossRef]
- Miller, W.H.; Handy, N.C.; Adams, J.E. Reaction path Hamiltonian for polyatomic molecules. J. Chem. Phys. 1980, 72, 99–112. [Google Scholar] [CrossRef] [Green Version]
- Kato, S.; Morokuma, K. Potential energy characteristics and energy partitioning in chemical reactions: Ab initio MO study of four-centered elimination reaction CH3CH2F + CH2→CH2 + HF. J. Chem. Phys. 1980, 73, 3900–3914. [Google Scholar] [CrossRef]
- Kraka, E. Reaction Path Hamiltonian and the Unified Reaction Valley Approach. WIREs Comput. Mol. Sci. 2011, 1, 531–556. [Google Scholar] [CrossRef]
- Freindorf, M.; Kraka, E. Mechanistic Details of the Sharpless Epoxidation of Allylic Alcohols—A combined URVA and Local Mode Study. Catalysts 2022, 12, 789. [Google Scholar] [CrossRef]
- Freindorf, M.; Kraka, E. BF3–Catalyzed Diels–Alder Reaction between Butadiene and Methyl Acrylate in Aqueous Solution–An URVA and Local Vibrational Mode Study. Catalysts 2022, 12, 415. [Google Scholar] [CrossRef]
- Freindorf, M.; Tao, Y.; Kraka, E. A Closer Look at the Isomerization of 5–androstene–3,17–dione to 4–androstene–3,17–dione in Ketosteroid Isomerase. J. Comp. Biophys. Chem. 2022, 21, 313–333. [Google Scholar] [CrossRef]
- Kraka, E.; Freindorf, M. Chemical Bonding in Homogenous Catalysis - Seen Through the Eyes of Vibrational Spectroscopy. In Reference Module in Chemistry, Molecular Sciences and Chemical Engineering—Comprehensive Computational Chemistry; Elsevier: Amsterdam, The Netherlands, 2022; pp. 1–27. [Google Scholar] [CrossRef]
- Freindorf, M.; Beiranvand, N.; Delgado, A.A.A.; Tao, Y.; Kraka, E. On the formation of CN bonds in Titan’s atmosphere—A Unified Reaction Valley Approach study. J. Mol. Model. 2021, 27, 320. [Google Scholar] [CrossRef]
- Makoś, M.Z.; Freindorf, M.; Tao, Y.; Kraka, E. Theoretical Insights into [NHC]Au(I) Catalyzed Hydroalkoxylation of Allenes: A Unified Reaction Valley Approach Study. J. Org. Chem. 2021, 86, 5714–5726. [Google Scholar] [CrossRef]
- Nanayakkara, S.; Freindorf, M.; Tao, Y.; Kraka, E. Modeling Hydrogen release from water with Borane and Alane catalysts: A Unified Reaction Valley Approach. J. Phys. Chem. A 2020, 124, 8978–8993. [Google Scholar] [CrossRef]
- Tao, Y.; Zou, W.; Nanayakkara, S.; Kraka, E. PyVibMS: A PyMOL plugin for visualizing vibrations in molecules and solids. J. Mol. Model. 2020, 26, 290. [Google Scholar] [CrossRef]
- Nanayakkara, S.; Kraka, E. A New Way of Studying Chemical Reactions: A Hand-in-hand URVA and QTAIM Approach. Phys. Chem. Chem. Phys. 2019, 21, 15007–15018. [Google Scholar] [CrossRef] [PubMed]
- Freindorf, M.; Tao, Y.; Sethio, D.; Cremer, D.; Kraka, E. New Mechanistic Insights into the Claisen Rearrangement of Chorismate—A Unified Reaction Valley Approach Study. Mol. Phys. 2018, 117, 1172–1192. [Google Scholar] [CrossRef]
- Freindorf, M.; Cremer, D.; Kraka, E. Gold(I)-Assisted Catalysis—A Comprehensive View on the [3,3]-Sigmatropic Rearrangement of Allyl Acetate. Mol. Phys. 2017, 116, 611–630. [Google Scholar] [CrossRef]
- Reis, M.C.; López, C.S.; Kraka, E.; Cremer, D.; Faza, O.N. Rational Design in Catalysis: A Mechanistic Study of β-Hydride Eliminations in Gold(I) and Gold(III) Complexes Based on Features of the Reaction Valley. Inorg. Chem. 2016, 55, 8636–8645. [Google Scholar] [CrossRef] [PubMed]
- Sexton, T.; Kraka, E.; Cremer, D. Extraordinary Mechanism of the Diels-Alder Reaction: Investigation of Stereochemistry, Charge Transfer, Charge Polarization, and Biradicaloid Formation. J. Phys. Chem. A 2016, 120, 1097–1111. [Google Scholar] [CrossRef] [PubMed]
- Cremer, D.; Kraka, E. From Molecular Vibrations to Bonding, Chemical Reactions, and Reaction Mechanism. Curr. Org. Chem. 2010, 14, 1524–1560. [Google Scholar] [CrossRef]
- Kraka, E.; Cremer, D. Computational Analysis of the Mechanism of Chemical Reactions in Terms of Reaction Phases: Hidden Intermediates and Hidden Transition States. Acc. Chem. Res. 2010, 43, 591–601. [Google Scholar] [CrossRef]
- Wilson, E.B. Some Mathematical Methods for the Study of Molecular Vibrations. J. Chem. Phys. 1941, 9, 76–84. [Google Scholar] [CrossRef]
- Konkoli, Z.; Cremer, D. A New Way of Analyzing Vibrational Spectra. I. Derivation of Adiabatic Internal Modes. Int. J. Quantum Chem. 1998, 67, 1–9. [Google Scholar] [CrossRef]
- Konkoli, Z.; Larsson, J.A.; Cremer, D. A New Way of Analyzing Vibrational Spectra. II. Comparison of Internal Mode Frequencies. Int. J. Quantum Chem. 1998, 67, 11–27. [Google Scholar] [CrossRef]
- Konkoli, Z.; Cremer, D. A New Way of Analyzing Vibrational Spectra. III. Characterization of Normal Vibrational Modes in terms of Internal Vibrational Modes. Int. J. Quantum Chem. 1998, 67, 29–40. [Google Scholar] [CrossRef]
- Konkoli, Z.; Larsson, J.A.; Cremer, D. A New Way of Analyzing Vibrational Spectra. IV. Application and Testing of Adiabatic Modes within the Concept of the Characterization of Normal Modes. Int. J. Quantum Chem. 1998, 67, 41–55. [Google Scholar] [CrossRef]
- Cremer, D.; Larsson, J.A.; Kraka, E. New Developments in the Analysis of Vibrational Spectra on the Use of Adiabatic Internal Vibrational Modes. In Theoretical and Computational Chemistry; Parkanyi, C., Ed.; Elsevier: Amsterdam, The Netherlands, 1998; pp. 259–327. [Google Scholar]
- Kraka, E.; Zou, W.; Tao, Y. Decoding Chemical Information from Vibrational Spectroscopy Data: Local Vibrational Mode Theory. WIREs Comput. Mol. Sci. 2020, 10, 1480. [Google Scholar] [CrossRef]
- Kraka, E.; Quintano, M.; Force, H.W.L.; Antonio, J.J.; Freindorf, M. Feature Article: The Local Vibrational Mode Theory and Its Place in the Vibrational Spectroscopy Arena. J. Phys. Chem. A 2022, 126, 8781–8798. [Google Scholar] [CrossRef]
- Wilson, E.; Decius, J.; Cross, P. Molecular Vibrations. The Theory of Infrared and Raman Vibrational Spectra; McGraw-Hill: New York, NY, USA, 1955. [Google Scholar]
- Woodward, L.A. Introduction to the Theory of Molecular Vibrations and Vibrational Spectroscopy; Oxford University Press: Oxford, UK, 1972. [Google Scholar]
- Califano, S. Vibrational States; Wiley: London, UK, 1976. [Google Scholar]
- Zou, W.; Kalescky, R.; Kraka, E.; Cremer, D. Relating Normal Vibrational Modes to Local Vibrational Modes with the Help of an Adiabatic Connection Scheme. J. Chem. Phys. 2012, 137, 084114. [Google Scholar] [CrossRef] [Green Version]
- Zou, W.; Cremer, D. C2 in a Box: Determining its Intrinsic Bond Strength for the X1Σ+g Ground State. Chem. Eur. J. 2016, 22, 4087–4097. [Google Scholar] [CrossRef]
- Zou, W.; Cremer, D. Properties of Local Vibrational Modes: The Infrared Intensity. Theor. Chem. Acc. 2014, 133, 1451–1466. [Google Scholar] [CrossRef]
- Larsson, J.A.; Cremer, D. Theoretical Verification and Extension of the Mckean Relationship between Bond Lengths and Stretching Frequencies. J. Mol. Struct. 1999, 485–486, 385–407. [Google Scholar] [CrossRef]
- Kalescky, R.; Kraka, E.; Cremer, D. Identification of the Strongest Bonds in Chemistry. J. Phys. Chem. A 2013, 117, 8981–8995. [Google Scholar] [CrossRef]
- Setiawan, D.; Sethio, D.; Cremer, D.; Kraka, E. From Strong to Weak NF Bonds: On the Design of a New Class of Fluorinating Agents. Phys. Chem. Chem. Phys. 2018, 20, 23913–23927. [Google Scholar] [CrossRef]
- Humason, A.; Zou, W.; Cremer, D. 11,11-Dimethyl-1,6-methano[10]annulene-An Annulene with an Ultralong CC Bond or a Fluxional Molecule? J. Phys. Chem. A 2014, 119, 1666–1682. [Google Scholar] [CrossRef]
- Kalescky, R.; Kraka, E.; Cremer, D. Are Carbon-Halogen Double and Triple Bonds Possible? Int. J. Quantum Chem. 2014, 114, 1060–1072. [Google Scholar] [CrossRef]
- Kalescky, R.; Zou, W.; Kraka, E.; Cremer, D. Quantitative Assessment of the Multiplicity of Carbon-Halogen Bonds: Carbenium and Halonium Ions with F, Cl, Br, and I. J. Phys. Chem. A 2014, 118, 1948–1963. [Google Scholar] [CrossRef]
- Cremer, D.; Wu, A.; Larsson, J.A.; Kraka, E. Some Thoughts about Bond Energies, Bond Lengths, and Force Constants. J. Mol. Model. 2000, 6, 396–412. [Google Scholar] [CrossRef]
- Kraka, E.; Cremer, D. Weaker Bonds with Shorter Bond Lengths. Rev. Proc. Quim. 2012, 39–42. [Google Scholar] [CrossRef]
- Setiawan, D.; Kraka, E.; Cremer, D. Hidden Bond Anomalies: The Peculiar Case of the Fluorinated Amine Chalcogenides. J. Phys. Chem. A 2015, 119, 9541–9556. [Google Scholar] [CrossRef] [PubMed]
- Kraka, E.; Setiawan, D.; Cremer, D. Re-Evaluation of the Bond Length-Bond Strength Rule: The Stronger Bond Is not Always the Shorter Bond. J. Comput. Chem. 2015, 37, 130–142. [Google Scholar] [CrossRef]
- Kalescky, R.; Zou, W.; Kraka, E.; Cremer, D. Local Vibrational Modes of the Water Dimer—Comparison of Theory and Experiment. Chem. Phys. Lett. 2012, 554, 243–247. [Google Scholar] [CrossRef]
- Kalescky, R.; Kraka, E.; Cremer, D. Local Vibrational Modes of the Formic Acid Dimer—The Strength of the Double H-Bond. Mol. Phys. 2013, 111, 1497–1510. [Google Scholar] [CrossRef]
- Freindorf, M.; Kraka, E.; Cremer, D. A Comprehensive Analysis of Hydrogen Bond Interactions Based on Local Vibrational Modes. Int. J. Quantum Chem. 2012, 112, 3174–3187. [Google Scholar] [CrossRef]
- Kalescky, R.; Zou, W.; Kraka, E.; Cremer, D. Vibrational Properties of the Isotopomers of the Water Dimer Derived from Experiment and Computations. Aust. J. Chem. 2014, 67, 426. [Google Scholar] [CrossRef] [Green Version]
- Tao, Y.; Zou, W.; Jia, J.; Li, W.; Cremer, D. Different Ways of Hydrogen Bonding in Water—Why Does Warm Water Freeze Faster than Cold Water? J. Chem. Theory Comput. 2017, 13, 55–76. [Google Scholar] [CrossRef] [PubMed]
- Tao, Y.; Zou, W.; Kraka, E. Strengthening of Hydrogen Bonding With the Push-Pull Effect. Chem. Phys. Lett. 2017, 685, 251–258. [Google Scholar] [CrossRef]
- Makoś, M.Z.; Freindorf, M.; Sethio, D.; Kraka, E. New Insights into Fe–H2 and Fe–H- Bonding of a [NiFe] Hydrogenase Mimic—A Local Vibrational Mode Study. Theor. Chem. Acc. 2019, 138, 76. [Google Scholar] [CrossRef]
- Lyu, S.; Beiranvand, N.; Freindorf, M.; Kraka, E. Interplay of Ring Puckering and Hydrogen Bonding in Deoxyribonucleosides. J. Phys. Chem. A 2019, 123, 7087–7103. [Google Scholar] [CrossRef] [PubMed]
- Yannacone, S.; Sethio, D.; Kraka, E. Quantitative Assessment of Intramolecular Hydrogen Bonds in Neutral Histidine. Theor. Chem. Acc. 2020, 139, 125. [Google Scholar] [CrossRef]
- Beiranvand, N.; Freindorf, M.; Kraka, E. Hydrogen Bonding in Natural and Unnatural Base Pairs - Explored with Vibrational Spectroscopy. Molecules 2021, 26, 2268. [Google Scholar] [CrossRef]
- Oliveira, V.; Kraka, E.; Cremer, D. The Intrinsic Strength of the Halogen Bond: Electrostatic and Covalent Contributions Described by Coupled Cluster Theory. Phys. Chem. Chem. Phys. 2016, 18, 33031–33046. [Google Scholar] [CrossRef]
- Oliveira, V.; Kraka, E.; Cremer, D. Quantitative Assessment of Halogen Bonding Utilizing Vibrational Spectroscopy. Inorg. Chem. 2016, 56, 488–502. [Google Scholar] [CrossRef]
- Oliveira, V.; Cremer, D. Transition from Metal-Ligand Bonding to Halogen Bonding Involving a Metal as Halogen Acceptor: A Study of Cu, Ag, Au, Pt, and Hg Complexes. Chem. Phys. Lett. 2017, 681, 56–63. [Google Scholar] [CrossRef]
- Yannacone, S.; Oliveira, V.; Verma, N.; Kraka, E. A Continuum from Halogen Bonds to Covalent Bonds: Where Do λ3 Iodanes Fit? Inorganics 2019, 7, 47. [Google Scholar] [CrossRef] [Green Version]
- Oliveira, V.P.; Kraka, E.; Machado, F.B.C. Pushing 3c-4e Bonds to the Limit: A Coupled Cluster Study of Stepwise Fluorination of First-Row Atoms. Inorg. Chem. 2019, 58, 14777–14789. [Google Scholar] [CrossRef] [PubMed]
- Oliveira, V.P.; Marcial, B.L.; Machado, F.B.C.; Kraka, E. Metal-Halogen Bonding Seen through the Eyes of Vibrational Spectroscopy. Materials 2020, 13, 55. [Google Scholar] [CrossRef] [PubMed] [Green Version]
- Oliveira, V.; Kraka, E. Systematic Coupled Cluster Study of Noncovalent Interactions Involving Halogens, Chalcogens, and Pnicogens. J. Phys. Chem. A 2017, 121, 9544–9556. [Google Scholar] [CrossRef] [PubMed]
- Setiawan, D.; Kraka, E.; Cremer, D. Description of Pnicogen Bonding with the help of Vibrational Spectroscopy-The Missing Link Between Theory and Experiment. Chem. Phys. Lett. 2014, 614, 136–142. [Google Scholar] [CrossRef]
- Setiawan, D.; Kraka, E.; Cremer, D. Strength of the Pnicogen Bond in Complexes Involving Group VA Elements N, P, and As. J. Phys. Chem. A 2014, 119, 1642–1656. [Google Scholar] [CrossRef]
- Setiawan, D.; Cremer, D. Super-Pnicogen Bonding in the Radical Anion of the Fluorophosphine Dimer. Chem. Phys. Lett. 2016, 662, 182–187. [Google Scholar] [CrossRef] [Green Version]
- Oliveira, V.; Cremer, D.; Kraka, E. The Many Facets of Chalcogen Bonding: Described by Vibrational Spectroscopy. J. Phys. Chem. A 2017, 121, 6845–6862. [Google Scholar] [CrossRef]
- Sethio, D.; Oliveira, V.; Kraka, E. Quantitative Assessment of Tetrel Bonding Utilizing Vibrational Spectroscopy. Molecules 2018, 23, 2763. [Google Scholar] [CrossRef]
- Li, Y.; Oliveira, V.; Tang, C.; Cremer, D.; Liu, C.; Ma, J. The Peculiar Role of the Au3 Unit in Aum Clusters: σ-Aromaticity of the Au5Zn+ Ion. Inorg. Chem. 2017, 56, 5793–5803. [Google Scholar] [CrossRef]
- Kalescky, R.; Kraka, E.; Cremer, D. New Approach to Tolman’s Electronic Parameter Based on Local Vibrational Modes. Inorg. Chem. 2013, 53, 478–495. [Google Scholar] [CrossRef] [PubMed]
- Setiawan, D.; Kalescky, R.; Kraka, E.; Cremer, D. Direct Measure of Metal-Ligand Bonding Replacing the Tolman Electronic Parameter. Inorg. Chem. 2016, 55, 2332–2344. [Google Scholar] [CrossRef] [PubMed]
- Cremer, D.; Kraka, E. Generalization of the Tolman Electronic Parameter: The Metal-Ligand Electronic Parameter and the Intrinsic Strength of the Metal-Ligand Bond. Dalton Trans. 2017, 46, 8323–8338. [Google Scholar] [CrossRef] [PubMed]
- Li, Y.; Liu, C.; Oliveira, V.; Cremer, D.; Chen, Z.; Ma, J. Odd-even Effect of the Number of Free Valence Electrons on the Electronic Structure Properties of Gold-thiolate Clusters. Mol. Phys. 2018, 117, 1442–1450. [Google Scholar] [CrossRef]
- Kraka, E.; Freindorf, M. Characterizing the Metal Ligand Bond Strength via Vibrational Spectroscopy: The Metal Ligand Electronic Parameter (MLEP). In Topics in Organometallic Chemistry—New Directions in the Modeling of Organometallic Reactions; Lledós, A., Ujaque, G., Eds.; Springer: Berlin/Heidelberg, Germany, 2020; Volume 67, pp. 1–43. [Google Scholar]
- Zou, W.; Tao, Y.; Freindorf, M.; Cremer, D.; Kraka, E. Local Vibrational Force Constants - from the Assessment of Empirical Force Constants to the Description of Bonding in Large Systems. Chem. Phys. Lett. 2020, 478, 137337. [Google Scholar] [CrossRef]
- Freindorf, M.; Kraka, E. Critical Assessment of the FeC and CO Bond strength in Carboxymyoglobin—A QM/MM Local Vibrational Mode Study. J. Mol. Model. 2020, 26, 281. [Google Scholar] [CrossRef]
- Kraka, E.; Larsson, J.A.; Cremer, D. Generalization of the Badger Rule Based on the Use of Adiabatic Vibrational Modes. In Computational Spectroscopy; Grunenberg, J., Ed.; Wiley: New York, NY, USA, 2010; pp. 105–149. [Google Scholar]
- Mayer, I. Charge, bond brder an valence in the ab initio theory. Chem. Phys. Lett. 1983, 97, 270–274. [Google Scholar] [CrossRef]
- Mayer, I. Bond orders and valences from ab initio wave functions. Int. J. Quantum Chem. 1986, 29, 477–483. [Google Scholar] [CrossRef]
- Mayer, I. Bond order and valence indices: A personal account. J. Comput. Chem. 2007, 28, 204–221. [Google Scholar] [CrossRef]
- Bader, R.F.W. A quantum theory of molecular structure and its applications. Chem. Rev. 1991, 91, 893–928. [Google Scholar] [CrossRef]
- Bader, R.F.W. Atoms in Molecules: A Quantum Theory (International Series of Monographs on Chemistry); Clarendon Press: Oxford, UK, 1994. [Google Scholar]
- Bader, R.F.W. The Quantum Mechanical Basis of Conceptual Chemistry. Monatshefte Chem. 2005, 136, 819–854. [Google Scholar] [CrossRef]
- Popelier, P.L. Atoms in Molecules: An Introduction; Prentice Hall: Hoboken, NJ, USA, 2000. [Google Scholar]
- Cremer, D.; Kraka, E. Chemical Bonds without Bonding Electron Density? Does the Difference Electron-Density Analysis Suffice for a Description of the Chemical Bond? Angew. Chem. Int. Ed. 1984, 23, 627–628. [Google Scholar] [CrossRef]
- Cremer, D.; Kraka, E. A Description of the Chemical Bond in Terms of Local Properties of Electron Density and Energy. Croat. Chem. Acta 1984, 57, 1259–1281. [Google Scholar]
- Kraka, E.; Cremer, D. Chemical Implication of Local Features of the Electron Density Distribution. In Theoretical Models of Chemical Bonding. The Concept of the Chemical Bond; Maksic, Z.B., Ed.; Springer: Berlin/Heidelberg, Germany, 1990; Volume 2, pp. 453–542. [Google Scholar]
- Fukui, K. The Path of Chemical Reactions—The IRC Approach. Acc. Chem. Res. 1981, 14, 363–368. [Google Scholar] [CrossRef]
- Hratchian, H.P.; Kraka, E. Improved Predictor-Corrector Integrators For Evaluating Reaction Path Curvature. J. Chem. Theory Comput. 2013, 9, 1481–1488. [Google Scholar] [CrossRef]
- Becke, A.D. Density-Functional Thermochemistry. III. The Role of Exact Exchange. J. Chem. Phys. 1993, 98, 5648–5652. [Google Scholar] [CrossRef] [Green Version]
- Lee, C.; Yang, W.; Parr, R. Development of the Colle-Salvetti correlation-energy formula into a functional of the electron density. Phys. Rev. B 1988, 37, 785–789. [Google Scholar] [CrossRef] [Green Version]
- Vosko, S.; Wilk, L.; Nusair, M. Accurate spin-dependent electron liquid correlation energies for local spin density calculations: A critical analysis. Can. J. Phys. 1980, 58, 1200–1211. [Google Scholar] [CrossRef] [Green Version]
- Stephens, P.; Devlin, F.; Chabalowski, C.; Frisch, M. Ab Initio Calculation of Vibrational Absorption and Circular Dichroism Spectra Using Density Functional Force Fields. J. Phys. Chem. 1994, 98, 11623–11627. [Google Scholar] [CrossRef]
- McLean, A.D.; Chandler, G.S. Contracted Gaussian basis sets for molecular calculations. I. Second row atoms, Z = 11–18. J. Chem. Phys. 1980, 72, 5639–5648. [Google Scholar] [CrossRef]
- Krishnan, R.; Binkley, J.S.; Seeger, R.; Pople, J.A. Self-consistent molecular orbital methods. XX. A basis set for correlated wave functions. J. Chem. Phys. 1980, 72, 650–654. [Google Scholar] [CrossRef]
- Andrae, D.; Häußermann, U.; Dolg, M.; Stoll, H.; Preuß, H. Energy-adjusted ab initio pseudopotentials for the second and third row transition elements. Theoretica Chim. Acta 1990, 77, 123–141. [Google Scholar] [CrossRef]
- Riplinger, C.; Neese, F. An efficient and near linear scaling pair natural orbital based local coupled cluster method. J. Chem. Phys. 2013, 138, 034106. [Google Scholar] [CrossRef] [PubMed]
- Weigend, F.; Ahlrichs, R. Balanced basis sets of split valence, triple zeta valence and quadruple zeta valence quality for H to Rn: Design and assessment of accuracy. Phys. Chem. Chem. Phys. 2005, 7, 3297–3305. [Google Scholar] [CrossRef] [PubMed]
- Frisch, M.J.; Trucks, G.W.; Schlegel, H.B.; Scuseria, G.E.; Robb, M.A.; Cheeseman, J.R.; Scalmani, G.; Barone, V.; Mennucci, B.; Petersson, G.A.; et al. Theoretical Study of 5-HTP. Potential New Drug Resulting from the Complexation of 5-HTP with ATP; Gaussian Inc.: Wallingford, CT, USA, 2009. [Google Scholar]
- Neese, F. The ORCA program system. WIREs Comput. Mol. Sci. 2012, 2, 73–78. [Google Scholar] [CrossRef]
- Tao, Y.; Zou, W.; Freindorf, M.; Cremer, D.; Kraka, E. pURVA; Computational and Theoretical Chemistry Group (CATCO), Southern Methodist University: Dallas, TX, USA, 2021. [Google Scholar]
- Zou, W.; Tao, Y.; Freindorf, M.; Makoś, M.Z.; Verma, N.; Cremer, D.; Kraka, E. Local Vibrational Mode Analysis (LModeA); Computational and Theoretical Chemistry Group (CATCO), Southern Methodist University: Dallas, TX, USA, 2022. [Google Scholar]
- Glendening, E.D.; Landis, C.R.; Weinhold, F. NBO 6.0: Natural bond orbital analysis program. J. Comput. Chem. 2013, 34, 1429–1437. [Google Scholar] [CrossRef]
- Reed, A.E.; Curtiss, L.A.; Weinhold, F. Intermolecular Interactions from a Natural Bond Orbital, Donor-Acceptor Viewpoint. Chem. Rev. 1988, 88, 899–926. [Google Scholar] [CrossRef]
- Weinhold, F.; Landis, C.R. Valency and Bonding: A Natural Bond Orbital Donor-Acceptor Perspective; Cambridge University Press: Cambridge, MA, USA, 2003. [Google Scholar]
- Weinhold, F. The Path to Natural Bond Orbitals. Isr. J. Chem. 2021. [Google Scholar] [CrossRef]
- Keith, T.A. AIMALL; TK Gristmill Software: Overland Park, KS, USA, 2017. [Google Scholar]
- Badger, R.M. A Relation between Internuclear Distances and Bond Force Constants. J. Chem. Phys. 1934, 2, 128–131. [Google Scholar] [CrossRef] [Green Version]
- Kraka, E.; Cremer, D. Characterization of CF Bonds with Multiple-Bond Character: Bond Lengths, Stretching Force Constants, and Bond Dissociation Energies. ChemPhysChem 2009, 10, 686–698. [Google Scholar] [CrossRef]
- Kaupp, M.; Danovich, D.; Shaik, S. Chemistry is about energy and its changes: A critique of bond-length/bond-strength correlations. Coord. Chem. Rev. 2017, 344, 355–362. [Google Scholar] [CrossRef]
Figure 1.
(a) Sketch of the Ir(III)–PNP catalyst; (b) non-catalyzed CO hydrogenation to formic acid (R0); (c) Catalytic cycle of CO hydrogenation reactions (R1–R5) with the model Ir(III)–PNP catalyst investigated in this work.
Figure 1.
(a) Sketch of the Ir(III)–PNP catalyst; (b) non-catalyzed CO hydrogenation to formic acid (R0); (c) Catalytic cycle of CO hydrogenation reactions (R1–R5) with the model Ir(III)–PNP catalyst investigated in this work.

Figure 2.
Schematic representation of the reaction profile for a model reaction defined as the scalar curvature (solid black line) given as a function of the reaction parameter s. Curvature minima M and curvature maxima K are shown. The location of the TS is denoted by a dotted blue line. Start and end of each reaction phase are denoted by dashed black lines. In addition the decomposition of the scalar curvature into four components is shown, blue, red, green and purple colored lines.

Figure 3.
Energy diagram for the catalyzed reactions R1–R5, relative to the initial reactant van der Waals complex of 1. For simplicity, the energies have been calculated by adding the activation and reaction energy of the next reaction step of the cycle, to the product energy of the previous reaction step. DLPNO-CCSD(T)/def2-TZVP/def2-ECP(Ir) level of theory performed at the end points of the DFT IRC calculations with B3LYP/6-31G(d,p)/SDD(Ir).

Figure 4.
Properties of the gas phase reaction R0 along the reaction path. (a) Energy profile, energy contributions of each reaction phase to the activation energy are indicated by italic numbers; (b) decomposition of the reaction curvature into selected components; (c) change of selected bond lengths along s; (d) change of selected NBO atomic charges along s. Positions of the curvature minima are shown as dashed vertical lines and are labeled as M1, M2, and so on. The position of the TS is indicated by a dotted line. Reaction phases are indicated by blue numbers. B3LYP/6-31G(d,p)/SDD(Ir) level of theory.

Figure 5.
Properties of reaction R1 of the catalytic cycle along the reaction path. (a) Energy profile, energy contributions of each reaction phase to the activation energy are indicated by italic numbers; (b) decomposition of the reaction curvature into selected components; (c) change of selected bond lengths along s; (d) change of selected NBO atomic charges along s. Positions of the curvature minima are shown as dashed vertical lines and are labeled as M1, M2, and so on. The position of the TS is indicated by a dotted line. Reaction phases are indicated by blue numbers. B3LYP/6-31G(d,p)/SDD(Ir) level of theory.

Figure 6.
Properties of reaction R2 of the catalytic cycle along the reaction path. (a) Energy profile, energy contributions of each reaction phase to the activation energy are indicated by italic numbers; (b) decomposition of the reaction curvature into selected components; (c) change of selected bond lengths along s; (d) change of selected NBO atomic charges along s. Positions of the curvature minima are shown as dashed vertical lines and are labeled as M1, M2, and so on. The position of the TS is indicated by a dotted line. Reaction phases are indicated by blue numbers. B3LYP/6-31G(d,p)/SDD(Ir) level of theory.

Figure 7.
Properties of reaction R3 of the catalytic cycle along the reaction path. (a) Energy profile, energy contributions of each reaction phase to the activation energy are indicated by italic numbers; (b) decomposition of the reaction curvature into selected components; (c) change of selected bond lengths along s; (d) change of selected NBO atomic charges along s. Positions of the curvature minima are shown as dashed vertical lines and are labeled as M1, M2, and so on. The position of the TS is indicated by a dotted line. Reaction phases are indicated by blue numbers. B3LYP/6-31G(d,p)/SDD(Ir) level of theory.

Figure 8.
Properties of reaction R4 of the catalytic cycle along the reaction path. (a) Energy profile, energy contributions of each reaction phase to the activation energy are indicated by italic numbers; (b) decomposition of the reaction curvature into selected components; (c) change of selected bond lengths along s; (d) change of selected NBO atomic charges along s. Positions of the curvature minima are shown as dashed vertical lines and are labeled as M1, M2, and so on. The position of the TS is indicated by a dotted line. Reaction phases are indicated by blue numbers. B3LYP/6-31G(d,p)/SDD(Ir) level of theory.

Figure 9.
Properties of reaction R5 of the catalytic cycle along the reaction path. (a) Energy profile, energy contributions of each reaction phase to the activation energy are indicated by italic numbers; (b) decomposition of the reaction curvature into selected components; (c) change of selected bond lengths along s; (d) change of selected NBO atomic charges along s. Positions of the curvature minima are shown as dashed vertical lines and are labeled as M1, M2, and so on. The position of the TS is indicated by a dotted line. Reaction phases are indicated by blue numbers. B3LYP/6-31G(d,p)/SDD(Ir) level of theory.

Figure 10.
BSO values as a function of the local mode force constants k, calculated from the power relationship ; for details, see text and Table 1. (a) CO bonds; (b) CH bonds; (c) HH bonds; (d) OH bonds. Labels R0COR, R0COT, and R0COP indicate reactant RE (red color), TS (blue color), and product PR (green color) of the bond involving the C and O atoms of reaction R0. Similarly notation for the reactions R1–R5. For the bond label description see the text. B3LYP/6-31G(d,p)/SDD(Ir) level of theory.

Figure 11.
BSO values as a function of the local mode force constants k, calculated from the power relationship ; for details, see text and Table 1. (a) IrO bonds; (b) IrH bonds. Labels R1IrOR, R1IrOT, and R1IrOO indicate reactant RE (red color), TS (blue color), and product PR (green color) of the bond involving the Ir and O atoms of thereaction R1. Similarly notation for reactions R2–R5. For the bond label description see the text. B3LYP/6-31G(d,p)/SDD(Ir) level of theory.

Figure 12.
Correlation between bond lengths and local mode force constants. (a) CO bonds; (b) CH bonds; (c) HH bonds; (d) OH bonds. Labels such as R0COR, R0COT, and R0COP indicate reactant RE (red color), TS (blue color), and product PR (green color) CO bond in reaction R0. Similarly notation for reactions R1–R5. For the bond label description see the text. B3LYP/6-31G(d,p)/SDD(Ir) level of theory.

Figure 13.
Correlation between bond length and the local mode force constants. (a) IrO bon; (b) IrH bonds. Labels such as R1IrOR, R1IrOT, and R1IrOO indicate reactant RE (red color), TS (blue color), and product PR (green color) IrO bond in reaction R1. Similarly notation for reactions R2–R5. For the bond label description see the text. B3LYP/6-31G(d,p)/SDD(Ir) level of theory.

Figure 14.
Correlation between energy density H and local mode force constant k. (a) CO bonds; (b) CH bonds; (c) HH bonds; (d) OH bonds. Labels such as R0COR, R0COT, and R0COP indicate reactant RE (red color), TS (blue color), and product PR (green color) CO in reaction R0. Similar notation for reactions R1–R5. For the bond label description see the text. B3LYP/6-31G(d,p)/SDD(Ir) level of theory.

Figure 15.
Correlation between energy density H and local mode force constant k. (a) IrO bonds; (b) IrH bonds. label such as R1IrOR, R1IrOT, and R1IrOO indicate reactant RE (red color), TS (blue color), and product PR (green color) IrO bond in R1. Similar notation for reactions R2–R5. For the bond label description see the text. B3LYP/6-31G(d,p)/SDD(Ir) level of theory.


Table 1.
Bond length R, local mode force constant k, bond strength order BSO, and energy density H evaluated at the bond critical point (r) of the reference bonds and reference molecules used in our study. B3LYP/6-31G(d,p)/SDD(Ir) level of theory.
Table 1.
Bond length R, local mode force constant k, bond strength order BSO, and energy density H evaluated at the bond critical point (r) of the reference bonds and reference molecules used in our study. B3LYP/6-31G(d,p)/SDD(Ir) level of theory.
| Bond | R(Å) | k (mDyn/Å) | BSO 1 | H (Hr/Bohr) | Molecule |
|---|---|---|---|---|---|
| CO | 1.418 | 4.905 | 1.000 | −0.3719 | CHOH |
| 1.207 | 13.607 | 2.000 | −0.6883 | CHO | |
| CH, HH, OH | 1.150 | 1.203 | 0.500 | −0.1951 | FH |
| 0.925 | 9.420 | 1.000 | −0.7275 | HF | |
| IrO | 2.034 | 2.829 | 1.030 | −0.0300 | Ir(CO)OH |
| 1.822 | 5.340 | 1.469 | −0.1035 | Ir(CO)O | |
| IrH | 2.095 | 0.370 | 0.197 | −0.0110 | Ir(CO)H |
| 1.857 | 0.764 | 0.313 | −0.0219 | Ir(CO)H | |
| CO 2 | 1.169 | 16.404 | 2.271 | −0.7595 | CO |
| HH 3 | 0.743 | 5.921 | 0.855 | −0.3360 | H |
Table 2.
The activation and reaction energy E, E and the activation and reaction enthalpy H, H of the reactions R0–R5 investigated in this study 1. The thermochemistry corrections of the DLPNO-CCSD(T) method is based on the DFT optimal geometry and frequency calculations. The B3LYP/6-31G(d,p)/SDD(Ir) and DLPNO-CCSD(T)/def2-TZVP/def2-ECP(Ir) levels of theory.
| DFT | DLPNO-CCSD(T) | |||||||
|---|---|---|---|---|---|---|---|---|
| Reaction | E | E | H | H | E | E | H | H |
| R0 | 72.2 | 3.6 | 71.8 | 9.2 | 76.3 | 5.1 | 75.9 | 10.7 |
| R1 | 14.9 | −12.2 | 16.2 | −9.3 | 17.6 | −9.3 | 18.9 | −6.3 |
| R2 | 23.9 | 22.3 | 22.8 | 21.7 | 23.9 | 22.9 | 22.7 | 22.3 |
| R3 | 12.3 | 8.7 | 11.3 | 8.0 | 12.2 | 10.5 | 11.3 | 9.7 |
| R4 | 1.2 | −10.3 | 0.6 | −8.5 | 1.7 | −13.6 | 1.2 | −11.7 |
| R5 | 20.9 | −15.3 | 18.6 | −13.8 | 23.5 | −11.9 | 21.3 | −10.4 |
1 Energy and enthalpy values (kcal/mol) from the end points of IRC and relative to the reactants of the corresponding reaction.
Table 3.
Bond length R, local mode force constant k, bond strength order BSO, and energy density H of the selected bonds for reactant RE, transition state TS, and product PR of reactions R0–R5. For the bond label description, see the text. B3LYP/6-31G(d,p)/SDD(Ir) level of theory.
Table 3.
Bond length R, local mode force constant k, bond strength order BSO, and energy density H of the selected bonds for reactant RE, transition state TS, and product PR of reactions R0–R5. For the bond label description, see the text. B3LYP/6-31G(d,p)/SDD(Ir) level of theory.
| R (Å) | k (mDyn/Å) | BSO | H (Hr/Bohr) | |||||||||
|---|---|---|---|---|---|---|---|---|---|---|---|---|
| Bond | RE | TS | PR | RE | TS | PR | RE | TS | PR | RE | TS | PR |
| R0 | ||||||||||||
| CO | 1.169 | 1.260 | 1.353 | 16.364 | 10.621 | 5.972 | 2.267 | 1.690 | 1.143 | −0.7594 | −0.6537 | −0.4670 |
| CO | 1.169 | 1.176 | 1.198 | 16.402 | 14.830 | 13.994 | 2.271 | 2.120 | 2.039 | −0.7597 | −0.7484 | −0.7315 |
| CH | 3.128 | 1.447 | 1.108 | 0.019 | 0.865 | 4.805 | 0.124 | 0.447 | 0.797 | - | −0.0666 | −0.2896 |
| OH | 2.959 | 1.308 | 0.969 | 0.017 | 1.686 | 8.005 | 0.119 | 0.560 | 0.947 | 0.0010 | −0.1021 | −0.5918 |
| HH | 0.743 | 1.030 | 2.120 | 5.898 | 1.210 | 0.469 | 0.854 | 0.501 | 0.364 | −0.3364 | −0.0861 | - |
| R1 | ||||||||||||
| CO | 1.170 | 1.242 | 1.240 | 16.098 | 9.679 | 10.562 | 2.242 | 1.587 | 1.684 | −0.7449 | −0.6444 | −0.6432 |
| CO | 1.170 | 1.268 | 1.283 | 16.039 | 8.344 | 8.253 | 2.236 | 1.435 | 1.424 | −0.7436 | −0.6083 | −0.5787 |
| CH | 2.769 | 1.153 | 1.111 | 0.041 | 3.090 | 4.692 | 0.160 | 0.687 | 0.791 | 0.0014 | −0.2259 | −0.2828 |
| IrO | 4.262 | 2.893 | 2.222 | 0.049 | 0.415 | 1.184 | 0.107 | 0.352 | 0.633 | - | - | −0.0038 |
| IrH | 1.679 | 2.359 | 4.079 | 1.983 | 0.415 | - | 0.576 | 0.212 | - | −0.0574 | −0.0003 | - |
| R2 | ||||||||||||
| CO | 1.240 | 1.318 | 1.311 | 10.562 | 7.086 | 7.134 | 1.684 | 1.284 | 1.290 | −0.6432 | −0.5196 | −0.5320 |
| CO | 1.283 | 1.224 | 1.229 | 8.253 | 11.827 | 11.316 | 1.424 | 1.818 | 1.765 | −0.5787 | −0.6731 | −0.6671 |
| CH | 1.111 | 1.096 | 1.097 | 4.692 | 5.302 | 5.270 | 0.791 | 0.824 | 0.822 | −0.2828 | −0.3133 | −0.3115 |
| CH | 1.094 | 2.623 | 3.084 | 5.237 | 0.138 | 0.117 | 0.821 | 0.241 | 0.228 | −0.2896 | - | - |
| OH | 2.403 | 0.985 | 1.011 | 0.029 | 6.893 | 4.053 | 0.143 | 0.900 | 0.753 | 0.0020 | −0.5652 | −0.4934 |
| IrO | 2.222 | 2.351 | 2.333 | 1.184 | 0.573 | 0.635 | 0.633 | 0.422 | 0.447 | −0.0038 | 0.0002 | −0.0002 |
| R3 | ||||||||||||
| CO | 1.311 | 1.337 | 1.338 | 7.134 | 6.260 | 6.280 | 1.290 | 1.180 | 1.183 | −0.5320 | −0.4924 | −0.4907 |
| CO | 1.229 | 1.210 | 1.209 | 11.316 | 12.883 | 13.069 | 1.765 | 1.927 | 1.946 | −0.6671 | −0.6978 | −0.6967 |
| IrO | 2.333 | 3.476 | 4.085 | 0.635 | 0.076 | 0.050 | 0.447 | 0.136 | 0.108 | −0.0002 | 0.0004 | - |
| IrH | 1.564 | 1.548 | 1.576 | 3.139 | 3.129 | 2.758 | 0.772 | 0.770 | 0.710 | −0.0981 | −0.1078 | −0.0949 |
| IrH | 1.590 | 1.586 | 1.578 | 2.833 | 2.737 | 2.728 | 0.723 | 0.707 | 0.706 | −0.0874 | −0.0900 | −0.0939 |
| NH | 1.747 | 2.031 | 3.225 | 0.219 | 0.129 | 0.029 | 0.282 | 0.236 | 0.143 | −0.0040 | −0.0007 | - |
| R4 | ||||||||||||
| HH | 0.745 | 0.750 | 0.842 | 5.744 | 5.371 | 1.826 | 0.847 | 0.828 | 0.575 | −0.3330 | −0.3225 | −0.2020 |
| IrH | 4.201 | 3.210 | 1.829 | 0.004 | 0.071 | 0.730 | 0.011 | 0.069 | 0.304 | - | - | - |
| IrH | 3.461 | 2.597 | 1.787 | 0.004 | 0.050 | 0.807 | 0.011 | 0.055 | 0.324 | 0.0004 | 0.0001 | −0.0275 |
| IrH | 1.576 | 1.545 | 1.589 | 2.758 | 3.318 | 2.783 | 0.710 | 0.799 | 0.715 | −0.0949 | −0.1091 | −0.0889 |
| IrH | 1.578 | 1.595 | 1.604 | 2.728 | 2.760 | 2.762 | 0.706 | 0.711 | 0.711 | −0.0939 | −0.0859 | −0.0829 |
| R5 | ||||||||||||
| HH | 0.842 | 0.986 | 3.182 | 1.826 | 0.707 | 0.037 | 0.575 | 0.418 | 0.155 | −0.2020 | −0.0907 | - |
| IrH | 1.829 | 2.335 | 3.588 | 0.730 | 0.355 | 0.107 | 0.304 | 0.192 | 0.089 | - | - | - |
| IrH | 1.787 | 1.909 | 1.679 | 0.807 | 0.567 | 1.987 | 0.324 | 0.259 | 0.576 | −0.0275 | −0.0202 | −0.0581 |
| IrH | 1.589 | 1.591 | 1.679 | 2.783 | 2.737 | 1.988 | 0.715 | 0.707 | 0.576 | −0.0889 | −0.0863 | −0.0581 |
| IrH | 1.604 | 1.592 | 1.585 | 2.762 | 2.842 | 2.914 | 0.711 | 0.724 | 0.736 | −0.0829 | −0.0869 | −0.0894 |
| CH | 3.481 | 1.580 | 1.098 | 0.105 | 0.932 | 5.118 | 0.220 | 0.459 | 0.814 | - | −0.0371 | −0.2792 |
Publisher’s Note: MDPI stays neutral with regard to jurisdictional claims in published maps and institutional affiliations. |
© 2022 by the authors. Licensee MDPI, Basel, Switzerland. This article is an open access article distributed under the terms and conditions of the Creative Commons Attribution (CC BY) license (https://creativecommons.org/licenses/by/4.0/).
Share and Cite
MDPI and ACS Style
Freindorf, M.; Kraka, E. URVA and Local Mode Analysis of an Iridium Pincer Complex Efficiently Catalyzing the Hydrogenation of Carbon Dioxide. Inorganics 2022, 10, 234. https://doi.org/10.3390/inorganics10120234
AMA Style
Freindorf M, Kraka E. URVA and Local Mode Analysis of an Iridium Pincer Complex Efficiently Catalyzing the Hydrogenation of Carbon Dioxide. Inorganics. 2022; 10(12):234. https://doi.org/10.3390/inorganics10120234
Chicago/Turabian StyleFreindorf, Marek, and Elfi Kraka. 2022. "URVA and Local Mode Analysis of an Iridium Pincer Complex Efficiently Catalyzing the Hydrogenation of Carbon Dioxide" Inorganics 10, no. 12: 234. https://doi.org/10.3390/inorganics10120234
Note that from the first issue of 2016, this journal uses article numbers instead of page numbers. See further details here.