
Dissolution Performance of Carbon/Hydroxyapatite Nanocomposite Prepared from Fish Scales

1
Department of Chemistry, Faculty of Science, Kasetsart University, Bangkok 10900, Thailand
2
National Metal and Materials Technology Center, 114 Thailand Science Park, Klong Luang, Pathum Thani 12120, Thailand
*
Author to whom correspondence should be addressed.
Inorganics 2022, 10(12), 242; https://doi.org/10.3390/inorganics10120242
Submission received: 7 October 2022
/
Revised: 20 November 2022
/
Accepted: 28 November 2022
/
Published: 5 December 2022
(This article belongs to the Section Inorganic Materials)
Abstract
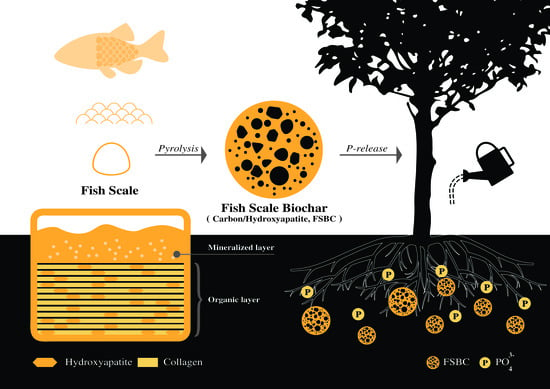
:The utilization of waste as raw materials in the production of functional materials is a growing area of interest to promote global sustainable growth. This work studied the microstructure, chemical properties, and phosphorus (P) dissolution efficiency of carbon/hydroxyapatite (HAP) nanocomposites derived from fish scale wastes, namely FSBCs. Tilapia scales were pyrolyzed at different temperatures (450–600 °C) and the dissolution performance of the biochars in acidic media was evaluated. The pyrolysis of fish scales yielded biochars which are carbon/HAP nanocomposites of which the characteristics, including the specific surface area, carbon content, degree of crystallinity of HAP, and the degree of CO32− substitution in HAP crystals, were dependent on the pyrolysis temperature and had an influence on the dissolution efficiency. P dissolution experiments suggested that the specific surface area and the presence of carbon in the composite played an important role during the dissolution process. The presence of the organic residues on the carbon could potentially block the calcium sites on HAP from citric acid and lower the dissolution efficiency. The ratio of CO32−/PO43− substitution in HAP also affected the dissolubility of FSBCs. The manipulation of their surface area and the CO32−/PO43− ratio of these materials would allow us to increase its solubility, which could benefit a prospective application such as P fertilizer production.
1. Introduction
One of the world’s biggest challenges today is the accumulation of wastes, especially wastes from food ingredients. To deal with waste problems, research on the utilization of wastes as raw materials is becoming of increasing interest. Based on the State of World Fisheries and Aquaculture (SOFIA) report, the total fish production will increase to 204 million tons in 2030, while aquaculture is also expected to surpass its current level of 82 million tons [1]. As a consequence, the amount of fish waste is projected to dramatically increase across the world. Fish scales are one of the fish processing by-products and, together with other fish wastes, are usually discarded by landfill disposal, causing environmental pollution problems. Nonetheless, fish scales are mainly composed of collagen fibers doped with hydroxyapatite crystals [2,3]. They could potentially serve as renewable sources for the production of phosphorus fertilizer, which, in turn, could push a global step towards environmental protection and sustainability. Natural hydroxyapatite (HAP), as in bone, teeth, and fish scales, is the major source of inorganic phosphorus in nature [4]. Several studies have used these natural sources in the production of hydroxyapatite through a variety of methods to synthesize pure and highly crystalline HAP [4,5,6]. The problem is, compared to conventional water-soluble P fertilizers, crystalline HAP has much lower solubility and its solubility greatly depends on a degree of crystallinity—an increase in crystallinity generally worsens its solubility [7]. To overcome this, nanoparticles of HAP have been proposed and studied as an alternative to conventional P fertilizer, especially for acidic soils [8].
Many researchers have reported the synthesis of (nano) hydroxyapatite from fish bone and scales [9,10,11,12] and some have reported the preparations of fish scale-derived biochar for adsorptive [13,14,15,16,17] and catalytic [18] purposes. However, the phosphorus dissolution from fish-scale char has not been published despite the literature on the application of bone char as an alternative P fertilizer are readily available [19,20,21]. Thus, this work aims to investigate the dissolution performance of fish-scale derived biochars in weak acidic media to resemble the conditions of an acidic soil. For this, tilapia scales were pyrolyzed at different temperatures and the chemical and physical properties of the resultant products were examined. The factors that related to the dissolution efficiency of FSBC samples were addressed and the phosphorus release contents of the biochars were determined by carrying out the dissolution studies in citric acid.
2. Results and Discussion
2.1. Elemental and Phase Composition of the Fish Scale Biochars
Fish scales are considered a biocomposite consisting mainly of calcium-deficient hydroxyapatite (HAP) and collagen fibrils type I [3]. The SEM micrographs of the raw tilapia scales in Figure 1 show that a fish scale is composed of two distinctive regions: (1) the mineralized region, which is the external layer of the scales that is in contact with the environment, and (2) the organic-rich region, which is the internal layer of collagen fibers [2]. The pyrolysis of the fish scales at 450–600 °C resulted in the formation of carbon/HAP composite FSBCs, in which three most abundant elements are calcium (Ca, ~55–57%), phosphorus (P, ~18%), and carbon (C, ~23–26%), which account for 98% in FSBC samples as shown in Table 1. In addition to the three main elements, magnesium (Mg), strontium (Sr), and silicon (Si), make up around 1% of the elemental composition of the FSBCs. An increase of the pyrolysis temperature resulted in the decrease of C content in the FSBCs as determined by a CHNS elemental analyzer. This is because at higher temperatures, the devolatilization and degradation of the collagen can occur to a greater extent, consequently leading to lower C and also H and N contents. The TGA curve of the raw fish scales (Figure 1b) revealed that the pyrolytic decomposition of amino acids started to occur at 250 °C. The weight loss during 250–450 °C was associated with a decomposition of amino acids, yielding low molecular weight heterocycles and gaseous products through dehydration, deamination, and decarboxylation [22]. The weight loss in the range of 450–600 °C can be attributed to the successive pyrolysis of the small heterocyclic residues into larger heterocyclic and polycyclic aromatic hydrocarbons having 5- to 7-membered ring structures with polar side functional groups [23].
The HAP quantity was examined using the EDXRF technique and evaluated based on the Ca content. At higher pyrolysis temperatures, the Ca content slightly increased, indicating higher HAP quantity in the FSBC samples, which is in accordance with the reduction of organic components at higher temperatures.
Figure 2 illustrates the XRD patterns of the FSBC products that were derived from different pyrolysis temperatures. Each sample exhibited the diffraction peaks at 2theta of 25.98°, 31.82°, 39.84°, 46.80°, and 49.6°, which correspond to the diffraction planes of (002), (211), (130), (222), and (213), respectively, of hydroxyapatite with hexagonal space group (ICDD PDF: 01-075-9526). The intensities of the peaks are fairly low, indicating the low crystallinity degree of hydroxyapatite (HAP). No peaks due to calcium phosphate (Ca3(PO4)2) (ICDD PDF: 00-009-0348) were found in the diffraction patterns, denoting no HAP transformation to Ca3(PO4)2 during the pyrolysis. It has been shown that crystallinity, which relates to the crystallite size and the degree of order within the crystals, has an influence on dissolubility of HAP particles—the decrease in HAP crystallinity increases its solubility [7]. Therefore, the crystallite size and crystallinity index of FSBC products were calculated. Typically, the crystallinity of HAPs can be studied by analyzing (002) reflection and the reflections in the range of 30 to 35° of 2θ angle [24,25]. Since the resolution of the peaks between 30 and 35° in this work is very poor and could hardly be distinguished, the crystallite size and degree of crystallinity were calculated from the FWHM of the (002) reflection peak and are given in Table 2.
The crystallite size of HAP within the FSBCs varies slightly with the pyrolysis temperature. The crystallite size of FSBC-450, FSBC-500, and FSBC-550 are similar, while that of FSBC-600 is the smallest. Even though the effect of the pyrolysis temperature on the HAP crystallite size is not clearly observed, it should be highlighted that an increase in the pyrolysis temperature does not introduce the growth to the HAP crystallites. This seem to be contradictory to the effect of heat treatment temperature that is commonly observed for the synthetic HAPs, where the increase in the temperature tends to induce the agglomeration of HAP crystals in order to reduce the total energy of the system, causing a larger HAP crystallite size and higher crystallinity [19]. The explanation that is proposed for this difference was associated with the presence of carbon together with HAP in the form of a composite. HAP and collagen in raw tilapia scales are expected to bind through C=O amide of Type I collagen and calcium ions [26]. During the course of pyrolysis, carbon with some organic residues which are linked to HAP crystals could block HAP nucleation sites, and thus prevent the growth and aggregation of HAP crystals even at elevated temperatures such as 600 °C.
The correlation between crystallite size and crystallinity index of HAP is consistent with the general observation, in which the reduction of HAP crystal size causes lower crystallinity index (CI). As a result, FSBC-600 shows the lowest CI.
In order to confirm the composite formation between carbon and HAP and visualize the microstructure of the composites, FSBC products were studied by SEM and TEM. SEM micrographs of FSBC-450 and FSBC-600 (Figure 3) showed that FSBC particles have two distinctive sides: the HAP-rich side and the carbon-rich side, which correspond to the mineralized external layer and the internal collagen layer of a raw fish scale in Figure 1a, respectively. The particle size of FSBC-450 and FSBC-600 are similar, suggesting that there are no significant changes in the particle size with increasing pyrolysis temperature.
On the HAP-rich surface of FSBCs, shown with 2000× magnification in Figure 3, the carbon signals are uniformly distributed among HAP, represented by Ca and P maps in the EDS-SEM elemental mapping images of FSBC-450 and FSBC-600. This confirms the formation of the carbon/HAP composite. However, when the carbon-rich side faces towards the detector, the low intensity of the Ca and P elements was observed, for example the particles marked by the red arrows.
Since the combination of carbon and HAP in the composite at a nanoscale cannot be visualized by SEM, the investigation by TEM was performed to provide further insight into carbon/HAP composite nanostructure. The TEM images of FSBC-450 particles revealed that the feature of collagen fibrils remained after pyrolysis, seen as the rods in Figure 4a, but the fibril diameter was reduced to 3–5 nm due to the decomposition of organic species such as amino acids of the collagen. Similar results were found in the case of FSBC-600 particles (Figure 4b); however, the length of the fibrils became shorter compared to that of FSBC-450. The shortening of the rods that was observed in our results at 600 °C, with respect to that of 450 °C, could be attributed to the successive decomposition of amino acids at higher temperatures.
We were unable to determine the particle size of carbon and HAP from TEM since the HAP crystals were very small and both compositions shared the similar brightness. Meanwhile, the severe aggregation of the carbon and HAP made it even harder to distinguish between carbon and HAP particles. However, the high resolution (HR) TEM images, Figure 4b for FSBC-450 and Figure 4d for FSBC-600, clearly indicated lattice fringes with an interplanar spacing of 0.29 nm and 0.34 nm, which correspond to (211) [27] and (002) diffraction planes of HAP. The lattice fringes also indicate that some of the HAP nanoparticles are single crystals and some are HAP agglomerates. The HAP single crystals can be formed on the carbon-rich side of the FSBCs, since the organic side of the raw fish scale is composed mainly of collagen doped with HAP crystals. On the other hand, the HAP agglomerates can be found on the HAP-rich side of the FSBCs, where the higher content of HAP was observed.
The pyrolysis temperature clearly influenced the BET specific surface area (SSA) of the FSBCs. According to the data in Table 2, the SSA of FSBC-450, FSBC-500, FSBC-550, and FSBC-600 increases from 73.6, 95.5, 100.2, to 111.2 m2 g−1, respectively. The enhancement of SSA when the heating temperature increases is likely related to their crystallite size since the smaller crystal size usually provides greater surface area. However, for FSBC composites, not only HAP but also amorphous carbon is involved in improving or decreasing the SSA. In the case of FSBC-450, even though its crystallite size is comparable to that of FSBC-500 and FSBC-550, more organic residues that are present in FSBC-450 could obstruct the adsorption sites on the surface of FSBC from being reached. Accordingly, the lower specific surface area is observed.
2.2. Dissolution of FSBC Materials in Citric Acid
To investigate the dissolution performance of the carbon/HAP composites, 1.0 g of the FSBC sample was dissolved in 10 cm3 of 0.010 mol·dm−3 citric acid and the amount of phosphate that was released to the solution was analyzed when the samples were dissolved for 1 and 5 days. The FSBC dissolution performance was evaluated based on the amount of released phosphate, which was then converted to P content. The initial P contents and the P that was released into the solution are shown in Table 3. It was found that on Day 1, no significant difference in the dissolution efficiency among all the samples were observed, as they released approximately 0.2% of P to the solution. However, on Day 5, the dissolution efficiency of FSBC-450 was about 2.3 times smaller than that of the other samples, whereas the efficiencies of FSBC-500, FSBC-550, and FSBC-600 were comparable with one another since we found that about 0.6% P was released from FSBC-450 while 1.3% was released from FSBC-500, FSBC-550, and FSBC-600. To date, the literature on the application of char derived from natural source as an alternative P fertilizer is still limited [19,20,21]. The most recent work by Schütza et al. (2015) studying the P release from bone char of a similar particle size reported the percentage of P release as 2.3% compared to P release from vivianite and hydroxyapatite, which was 6.5% and 11.1%, respectively, in 0.01 mol·dm−3 citric acid [20]. Comparing the percentage of P release from the bone char (2.3%) to that from our fish-scale-derived biochars, the dissolubility of FSBC was slightly lower. This could be due to the differences in a specific surface area, degree of crystallinity, ratio of carbon and HAP content, the presence of some impurities such as CO32−, Mg2+, and Sr2+ in HAP crystals, etc., that two sources of the feedstocks could bring.
Since FSBCs are carbon/HAP composites and the phosphorus atoms in the samples are principally in the form of phosphate in HAP crystals, the dissolution efficiency of FSBCs in citric acid is essentially based on how well HAP can be dissolved. To investigate the mechanism of the dissolution of carbon/HAP biochar nanocomposites, FSBC-450 and FSBC-600 were dissolved in 0.0001 mol·dm−3 (pH 5.02), 0.001 mol·dm−3 (pH 4.18), and 0.01 mol·dm−3 (pH 3.20) citric acid solutions and the suspension pH was monitored for 3 h (Figure 5a). From Figure 5a, it was observed that the pH of the solution increased rapidly at the early stage of the experiment, followed by the much slower increase in pH towards the end of the experiment. The gradual increase of the pH at the later stage resulted from the fact that citric acids buffered the solution pH as the dissociated protons are consumed during dissolution. The increase in pH at the initial stage was more pronounced at the lower initial concentration (higher pH), indicating that citric acid or citrate ion species, rather than protons, were involved in the dissolution of the FSBC.
Citric acid or citrate ion species are able to form complexes with calcium ions on the surface, Ref. [28] leading to the dissolution of the FSBC samples. From the pH distribution diagram for citric acid (Figure 5a), as the pH gets higher, citric acid becomes more dissociated. As a result, citrate ions with higher negative charge are present at a higher pH. At pH 3.2, CitH2− and CitH3 dominate, whereas CitH2− and CitH2− predominate at pH 4.2. When the pH is elevated to 5.0, CitH2− and Cit3− prevail. For 0.0001 M citric solution (pH 5.02), the higher negatively charged species such as CitH2− and Cit3− in the solution can act as bi- or tri-dentate ligands when coordinated with Ca2+ ions. Consequently, the reaction between HAP on the surface and citrate ions occurred faster and resulted in a greater pH change at the initial state, compared to the reaction in 0.01 and 0.001 M citric solution.
As the dissolution of FSBC composites occurs at the HAP surface, the factors such as the specific surface area, particle size, and structural defects could affect FSBC solubility. Considering the specific surface area (SSA), an increase in the specific surface area of a material normally increases its solubility, since a higher specific area allows more solid particles to be in contact with molecules in the solution. However, our results showed that while FSBC-450 has the lowest dissolution efficiency, which is consistent with the normal observation, the dissolubility of FSBC-500, FSBC-550, and FSBC-600 are similar despite the difference in their SSAs. This indicates that other factors are also involved in the dissolution process of FSBCs. Crystallite size and degrees of crystallinity were pointed out as important factors governing the dissolution of HAP [20]. Zwetsloot et al. (2015) demonstrated that the higher HAP crystallinity in the bone char caused the water-P solubility to be decreased [19]. Herein, the HAP crystallinity that was obtained from XRD data (Table 2.) followed the order: FSBC-600 (with CI of 0.6) < FSBC-450 ~ FSBC-500 (CI of 0.12) < FSBC-550 (CI of 0.15), implying that by considering this effect alone, the dissolution efficiency should have been the worst for FSBC-550 and the best for FSBC-600. However, the strong and dense collectives of HAP crystallites and carbon within FSBC particles restricted HAP sites to be exposed to citric acid molecules. As a result, the effects of HAP crystallite size and the degrees of crystallinity were not predominant in the dissolution of FSBCs.
The next factor which could possibly play a role in the FSCB dissolution was the presence of carbonate (CO32−) ions in the HAP crystals. As reported for biological HAP, the substitution of CO32− ions either at hydroxide (OH−) sites or phosphate (PO43−) sites in HAP structure tends to increase its solubility in comparison with pure HAP [29,30,31,32]. The carbonate groups substituted in HAP can be characterized by observing the ν3 stretching vibration of CO32− group in FTIR spectra. The band position of ν3 stretching vibration depends on whether the carbonate ion is substituted for the hydroxide or the phosphate ions in the HAP lattice. If the CO32− substitutes the OH− in the HAP lattice, the apatite is “A-Type” and the position of the ν3 stretching band is located at ~1548 cm−1. On the other hand, if the CO32− substitutes the PO43− in the HAP lattice, the apatite is “B-Type” and the position of ν3 stretching bands are located at 1410 and 1450 cm−1 [32].
Figure 6 illustrates the FTIR spectra of FSBC samples compared to the raw tilapia fish scales. The bands due to the vibration of C–O and P–O corresponding to carbonate and phosphate species in these data were not well defined, i.e., both of the peaks of v3 CO32− vibration were poorly resolved while the bands v1 and v3 P–O stretching in PO43– were overlapped. The reasonable way to quantitatively estimate the presence of CO32− in the HAP structures is to use their peak areas instead of peak intensities. We adopted the method that was suggested by Grunenwald et al. (2014) in which the area ratio (rC/P) between v3 (CO32−) and v1 v3 (PO43−) was employed to evaluate the degree of carbonation in HAP [32]. The rC/P ratio is defined as the quotient between the full area of the v3 (CO32−) band (typically in the range 1570–1330 cm−1) and the area of the v1 v3 (PO43−) band (typically in the range of 900–1230 cm−1). The calculations (Figure 7) show that the rC/P ratio tends to decrease with increasing pyrolysis temperature—the rC/P ratios for FSBC-450, FSBC-500, FSBC-550, and FSBC-600 were derived as 0.25, 0.22, 0.17, and 0.077, respectively (Table 2). Since FSBC-600 exhibits the lowest degree of carbonation, it is possible that HAP crystals in this sample had the lowest solubility. Therefore, P release of FSBC-600 was lower than expected and was similar to that of FSBC-500 and FSBC-550 despite its highest specific surface area. For the FSBC-450, even though the largest ratio of CO32−/PO43− was obtained, its lowest SSA as well as the presence of organic residues on the carbon, which decreased the accessible HAP sites that were reached by citric acid molecules, resulted in the lowest P release after 5 days.
Based on the experimental results and discussion, the dissolution process of FSBC carbon/HAP nanocomposites required the interaction between HAP on the solid particles and citrate species in the solution. Therefore, the dissolution performance of these materials depends on their specific surface area and the presence of carbon component. However, the degree of carbonation and crystallinity is also involved in controlling their solubility.
3. Materials and Methods
3.1. Materials
Raw tilapia (Oreochromis niloticus) scales were obtained from a local market (Petchburi, Thailand). Citric acid (C6H8O7·H2O, KemAus, 99.5%) was used for the dissolution study. Ammonium molybdate ((NH4)6Mo7O24·4H2O, KemAus, 81.0–83.0%) sulfuric acid (H2SO4, Merck, 98.0%), potassium dihydrogen phosphate (KH2PO4, Carloeba reagents, 99.5%), and sodium sulfide (Na2S·9H2O, Sigma-Aldrich, St. Louis, MO, USA, 99.99%) were employed in spectroscopic analysis of phosphate species in the solutions.
3.2. Preparation of the Fish Scale Biochar (FSBC)
Raw tilapia scales were washed several times and dried at room temperature. The dried raw scales were placed in an alumina boat and then pylorized at different temperatures (450, 500, 550, and 600 °C) under an N2 atmosphere for 5 h using a quartz tube furnace with a heating and a cooling rate of 5 °C min−1 and an N2 flow rate of 50 cm3 min−1. The obtained products were labeled as FSBC-450, FSBC-500, FSBC-550, and FSBC-600, respectively. Finally, the as-prepared FSBC was passed through 5-mm and then 0.5-mm sieves and the particles were collected on a 0.5-mm sieve.
3.3. Characterization of the Fish Scale Biochar
The FSBC composition was analyzed by determining C, N, and H using the VTF-900 LECO CHNS-932 analyzer (Japan), where the samples were heated in the oxygen flow in a muffle furnace at 950 °C. Other elements, such as Ca, P, Mg, Sr, etc., were measured using an energy-dispersive X-ray fluorescence spectrometer (EDXRF, Bruker S2 Puma, Germany). An X-ray tube with an Ag anode and Be window with a maximum power of 50 W was used to generate the radiation. The samples were analyzed in supplied sample cups that were sealed on one end with 4 µm polypropylene under an He atmosphere. The elemental composition was measured by SMART-QUANT FP, the standardless solution for elemental analysis of unknown samples and samples without available calibration standards. Phases in the samples were identified by a powder X-ray diffraction (XRD) using BRUKER D8 Advance diffractometer (Germany), operated at 40 mA and 40 kV under Cu Kα radiation. A range of scattering angles (2θ) from 5° to 80° and a step size of 0.02° were used.
The morphology was observed using a scanning electron microscope (SEM, Quanta 450, FEI, Japan) equipped with an energy dispersive spectrometer (EDS) with a tungsten filament under vacuum, as well as a transmission electron microscope (TEM, JEM 3100F, JEOL, Japan) operated at 300 kV. Specific surface areas (SSA) were determined with a 3Flex surface characterization analyzer (Micromeritics, Norcross, GA, USA) using a multi-point BET-measurement (Brunauer-Emmett-Teller) and N2 as the adsorptive medium. To remove surface contaminants, the samples were heated to 300 °C under a vacuum prior to the measurements. Surface functional groups were analyzed by Fourier transform infrared spectroscopy (FTIR, Alpha-E, BRUKER, Germany). Thermal gravimetric analysis (TGA), which gave the dependence of the weight loss of a sample as a function of temperature or time, were measured over a temperature range from 25 to 1000 °C with a furnace-heating rate of 10 °C/min using a thermogravimetric analyzer (Pyris 1, PerkinElmer, Waltham, MA, USA).
3.4. Methods to Calculate Crystallinity Index (CI) and Calculate Crystallite Size (L) Using XRD
The XRD spectra of the obtained FSBCs were analyzed by an X-ray diffraction. A CuKα radiation (wavelength: λ = 0.15418 nm) generator worked at 40 kV and 40 mA, with a range of scattering angles (2θ) from 5° to 80° and a step size of 0.02°. Crystallinity indices (CI) were calculated according to Equation (1):
where β002 represents the full width at half maximum (FWHM) of (002) reflections. [24,25]
CI = (0.24/β002)3
The average crystal sizes of the obtained precipitates were calculated using the Scherrer equation [24,25] in Equation (2):
where L is the crystal size, K is the Scherrer constant with a value of 0.89, β002 is the FWHM of the (002) reflection, and λ is the X-ray wavelength used.
L = (K × λ)/(β002 × cos θ)
3.5. Dissolution Study
The dissolution performance of the carbon/HAP composites were investigated. A total of 1.0 g of the FSBC sample was dissolved in 10 cm3 of 0.010 mol·dm−3 citric acid and the amount of phosphate that was released to the solution was analyzed when the samples were dissolved for 1 and 5 days. All the experiments were conducted in triplicate and the flasks were shaken at 150 rpm at 25 °C. The FSBC dissolution performance was evaluated based on the amount of released phosphate, in which the phosphate ion concentrations were determined by spectrophotometry the method that was previously reported by Mahadevaiah et al. (2007) [33]. Briefly, 2 cm3 of the collected solutions were mixed with the 0.5 cm3 of 5.528 × 10⁻³ mol·dm−3 (NH4)6Mo7O24·4H2O, 1 cm3 of 0.125 mol·dm−3 H2SO4, 1 cm3 KH2PO4, 1 cm3 of 2.08 × 10⁻³ mol·dm−3 Na2S, and deionized water to make 10.0 cm3 of solution. Their absorbance was measured using a UV-Vis spectrometer (SHIMADZU UV-1800, Shimadzu, Japan) at the wavelength of 830 nm.
The dissolution mechanism was studied by dissolving 1.0 g of FSBC-450 (or FSBC-600) in 100 cm3 of citric acid solution (0.01, 0.001, and 0.0001 mol·dm−3) under stirring conditions. The pH of the suspension was monitored as a function of time.
4. Conclusions
The microstructure, chemical characteristics, and phosphorus dissolution efficiency of carbon/hydroxyapatite nanocomposites derived from fish scales, namely FSBCs, were studied. Carbon/hydroxyapatite nanocomposites were prepared from the pyrolysis of fish scale waste at different temperatures. The results suggested that as the pyrolysis temperature increased, the carbon composition of the FSBC products decreased. The presence of carbon among HAP impeded the growth of HAP crystals at higher temperature and affected the P dissolubility efficiency of FSBCs in citric acid solution. Besides, it was found that several physical and chemical characteristics of FSBCs, including the specific surface area, HAP crystallite size and crystallinity, and the degree of carbonation of HAP, represented by the term of CO32−/PO43− ratio, contributed to their dissolution process. The specific surface area seemed to be the most predominant factor controlling the degree of P release. Even though the P dissolubility efficiency of FSBCs is still low, the improvement in P dissolution could be achieved if the specific surface area and the degree of carbonation of HAP are modified.
Author Contributions
Conceptualization, U.S., S.S. and R.R.; methodology, U.S.; software, U.S.; validation, R.R., J.J. and S.S.; formal analysis, U.S.; investigation, U.S.; resources, R.R.; data curation, U.S.; writing—original draft preparation, U.S.; writing—review and editing, R.R.; visualization, U.S.; supervision, J.J. and S.S.; project administration, J.J. All authors have read and agreed to the published version of the manuscript.
Funding
This research was funded by the Graduated Program Scholarship from the Graduate School, Kasetsart University, Bangkok, Thailand and National Science and Technology Development Agency, Grant number [FDA-CO-2561-5675-TH].
Data Availability Statement
All data that were generated or analyzed during this study are included in this published article.
Acknowledgments
This work was supported by the Graduated Program Scholarship from the Graduate School, Kasetsart University, Bangkok, Thailand, and Huai Sai Royal Development Study Center, Cha-Am, Petchburi, 76120, Thailand.
Conflicts of Interest
The authors declare no conflict of interest.
References
- FAO. The State of World Fisheries and Aquaculture 2020. In Sustainability in Action; FAO: Rome, Italy, 2020. [Google Scholar] [CrossRef]
- Zhu, D.; Ortega, C.F.; Motamedi, R.; Szewciw, L.; Vernerey, F.; Barthelat, F. Structure and mechanical performance of a “modern” fish scale. Adv. Eng. Mater. 2012, 14, B185–B194. [Google Scholar] [CrossRef]
- Qin, D.; Bi, S.; You, X.; Wang, M.; Cong, X.; Yuan, C.; Yu, M.; Cheng, X.; Chen, X.-G. Development and application of fish scale wastes as versatile natural biomaterials. Chem. Eng. J. 2022, 428, 131102. [Google Scholar] [CrossRef]
- Mohd Pu’Ad, N.A.S.; Koshy, P.; Abdullah, H.Z.; Idris, M.I.; Lee, T.C. Syntheses of hydroxyapatite from natural sources. Heliyon 2019, 5, e01588. [Google Scholar] [CrossRef] [PubMed] [Green Version]
- Modolon, H.B.; Inocente, J.; Bernardin, A.M.; Montedo, O.R.K.; Arcaro, S. Nanostructured biological hydroxyapatite from Tilapia bone: A pathway to control crystallite size and crystallinity. Ceram. Int. 2021, 47, 27685–27693. [Google Scholar] [CrossRef]
- Ayala-Barajas, D.; Gonzalez-Velez, V.; Velez-Tirado, M.; Aguilar-Pliego, J. Hydroxyapatite extraction from fish scales of Tilapia. In Proceedings of the 42nd Annual International Conference of the IEEE Engineering in Medicine & Biology Society (EMBC), Montreal, QC, Canada, 20–24 July 2020. [Google Scholar] [CrossRef]
- Uddin, M.H.; Matsumoto, T.; Ishihara, S.; Nakahira, A.; Okazaki, M.; Sohmura, T. Apatite Containing Aspartic Acid for Selective Protein Loading. J. Dent. Res. 2010, 89, 488–492. [Google Scholar] [CrossRef]
- Maghsoodi, M.R.; Ghodszad, L.; Lajayer, B.A. Dilemma of hydroxyapatite nanoparticles as phosphorus fertilizer: Potentials, challenges and effects on plants. Environ. Technol. Innov. 2020, 19, 100869. [Google Scholar] [CrossRef]
- Kongsri, S.; Janpradit, K.; Buapa, K.; Techawongstien, S.; Chanthai, S. Nanocrystalline hydroxyapatite from fish scale waste: Preparation, characterization and application for selenium adsorption in aqueous solution. Chem. Eng. J. 2013, 215–216, 522–532. [Google Scholar] [CrossRef]
- Sathiyavimal, S.; Vasantharaj, S.; Shanmugavel, M.; Manikandan, E.; Nguyen-Tri, P.; Brindhadevi, K.; Pugazhendhi, A. Facile synthesis and characterization of hydroxyapatite from fish bones: Photocatalytic degradation of industrial dyes (crystal violet and Congo red). Prog. Org. Coat. 2020, 148, 105890. [Google Scholar] [CrossRef]
- Mudhafar, M.; Zainol, I.; Alsailawi, H.A.; Jaafar, C.N.A. Synthesis and characterization of fish scales of hydroxyapatite/collagen–silver nanoparticles composites for the applications of bone filler. J. Korean Ceram. Soc. 2022, 59, 229–239. [Google Scholar] [CrossRef]
- Liu, Y.; Liu, M.; Ji, S.; Zhang, L.; Cao, W.; Wang, H.; Wang, S. Preparation and application of hydroxyapatite extracted from fish scale waste using deep eutectic solvents. J. Food Sci. 2021, 47, 9366–9372. [Google Scholar] [CrossRef]
- Dou, S.; Ke, X.-X.; Shao, Z.-D.; Zhong, L.-B.; Zhao, Q.-B.; Zheng, Y.-M. Fish scale-based biochar with defined pore size and ultrahigh specific surface area for highly efficient adsorption of ciprofloxacin. Chemosphere 2022, 287, 131962. [Google Scholar] [CrossRef] [PubMed]
- Xia, D.; Liu, Y.; Cheng, X.; Gu, P.; Chen, Q.; Zhang, Z. Temperature-tuned fish-scale biochar with two-dimensional homogeneous porous structure: A promising uranium extractant. Appl. Surf. Sci. 2022, 591, 153136. [Google Scholar] [CrossRef]
- Módenes, A.N.; Bazarin, G.; Borba, C.E.; Locatelli, P.P.P.; Borsato, F.P.; Pagno, V.; Pedrini, R.; Trigueros, D.E.G.; Espinoza-Quiñones, F.R.; Scheufele, F.B. Tetracycline adsorption by tilapia fish bone-based biochar: Mass transfer assessment and fixed-bed data prediction by hybrid statistical-phenomenological modeling. J. Clean. Prod. 2021, 279, 123775. [Google Scholar] [CrossRef]
- Khandare, D.; Tembhurkar, A.; Mukherjee, S. Adsorptive Removal of Fluoride from Water Using Non-Conventional Adsorbents; advances in civil engineering and infrastructural development; Springer: Singapore, 2021. [Google Scholar] [CrossRef]
- Achieng’, G.O.; Kowenje, C.O.; Lalah, J.O.; Ojwach, S.O. Synthesis and characterization of FSB@Fe3O4 composites and application in removal of indigo carmine dye from industrial wastewaters. Environ. Sci. Pollut. Res. 2021, 28, 54876–54890. [Google Scholar] [CrossRef]
- Shikhaliyev, K.; Hameed, B.; Okoye, P. Utilization of biochars as sustainable catalysts for upgrading of glycerol from biodiesel production. J. Environ. Chem. Eng. 2021, 9, 104768. [Google Scholar] [CrossRef]
- Zwetsloot, M.J.; Lehmann, J.; Solomon, D. Recycling slaughterhouse waste into fertilizer: How do pyrolysis temperature and biomass additions affect phosphorus availability and chemistry? J. Sci. Food Agric. 2015, 95, 281–288. [Google Scholar] [CrossRef]
- Schütze, E.; Gypser, S.; Freese, D. Kinetics of Phosphorus Release from Vivianite, Hydroxyapatite, and Bone Char Influenced by Organic and Inorganic Compounds. Soil Syst. 2020, 4, 15. [Google Scholar] [CrossRef]
- Zimmer, D.; Panten, K.; Frank, M.; Springer, A.; Leinweber, P. Sulfur-Enriched Bone Char as Alternative P Fertilizer: Spectroscopic, Wet Chemical, and Yield Response Evaluation. Agriculture 2019, 9, 21. [Google Scholar] [CrossRef] [Green Version]
- Sharma, R.K.; Chan, W.G.; Hajaligol, M.R. Product compositions from pyrolysis of some aliphatic α-amino acids. J. Anal. Appl. Pyrolysis 2006, 75, 69–81. [Google Scholar] [CrossRef]
- Choi, S.-S.; Ko, J.-E. Analysis of cyclic pyrolysis products formed from amino acid monomer. J. Chromatogr. A 2011, 1218, 8443–8455. [Google Scholar] [CrossRef]
- Gopi, D.; Kanimozhi, K.; Bhuvaneshwari, N.; Indira, J.; Kavitha, L. Novel banana peel pectin mediated green route for the synthesis of hydroxyapatite nanoparticles and their spectral characterization. J. Archaeol. Sci. 2014, 49, 134–141. [Google Scholar] [CrossRef] [PubMed]
- Sa, Y.; Guo, Y.; Feng, X.; Wang, M.; Li, P.; Gao, Y.; Yang, X.; Jiang, T. Are different crystallinity-index-calculating methods of hydroxyapatite efficient and consistent? New J. Chem. 2017, 41, 5723–5731. [Google Scholar] [CrossRef]
- Huang, Z.L.; Liu, G.Y.; He, Y.; Yi, Z.Z.; Guo, J.M. Interaction between Hydroxyapatite and Collagen. Adv. Mater. Res. Trans. Tech. Publ. 2012, 412, 384–387. [Google Scholar] [CrossRef]
- Athinarayanan, J.; Periasamy, V.S.; Alshatwi, A.A. Simultaneous fabrication of carbon nanodots and hydroxyapatite nanoparticles from fish scale for biomedical applications. Mater. Sci. Eng. C Mater. Biol. Appl. 2022, 117, 111313. [Google Scholar] [CrossRef] [PubMed]
- Wang, D.; Xie, Y.; Jaisi, D.P.; Jin, Y. Effects of low-molecular-weight organic acids on the dissolution of hydroxyapatite nanoparticles. Environ. Sci. Nano 2016, 3, 768–779. [Google Scholar] [CrossRef] [Green Version]
- Pan, H.; Darvell, B.W. Effect of carbonate on hydroxyapatite solubility. Cryst. Growth Des. 2010, 10, 845–850. [Google Scholar] [CrossRef]
- Leventouri, T.; Chakoumakos, B.; Moghaddam, H.; Perdikatsis, V. Powder neutron diffraction studies of a carbonate fluorapatite. J. Mater. Res. 2000, 15, 511–517. [Google Scholar] [CrossRef]
- Bano, N.; Jikan, S.S.; Basri, H.; Adzila, S.; Zago, D.M. XRD and FTIR study of A&B type carbonated hydroxyapatite extracted from bovine bone. AIP Conf. Proc. 2019, 2068, 020100. [Google Scholar] [CrossRef]
- Grunenwald, A.; Keyser, C.; Sautereau, A.; Crubézy, E.; Ludes, B.; Drouet, C. Revisiting carbonate quantification in apatite (bio)minerals: A validated FTIR methodology. J. Archaeol. Sci. 2014, 49, 134–141. [Google Scholar] [CrossRef] [Green Version]
- Mahadevaiah, U.; Kumar, M.S.Y.; Galil, M.S.A.; Suresha, M.S.; Sathish, M.A.; Nagendrappa, G. A Simple Spectrophotometric Determination of Phosphate in Sugarcane Juices, Water and Detergent Samples. J. Chem. 2007, 4, 467–473. [Google Scholar] [CrossRef]
Figure 1.
(a) A cross sectional-view SEM image of a raw fish scale, (b) TGA curve of raw fish scales, (c) a top-view SEM image of a mineralized surface, and (d) a top-view SEM image of an organic surface of the raw fish scale.
Figure 1.
(a) A cross sectional-view SEM image of a raw fish scale, (b) TGA curve of raw fish scales, (c) a top-view SEM image of a mineralized surface, and (d) a top-view SEM image of an organic surface of the raw fish scale.

Figure 2.
XRD patterns of the FSBC products that were derived from different pyrolysis temperatures.
Figure 2.
XRD patterns of the FSBC products that were derived from different pyrolysis temperatures.
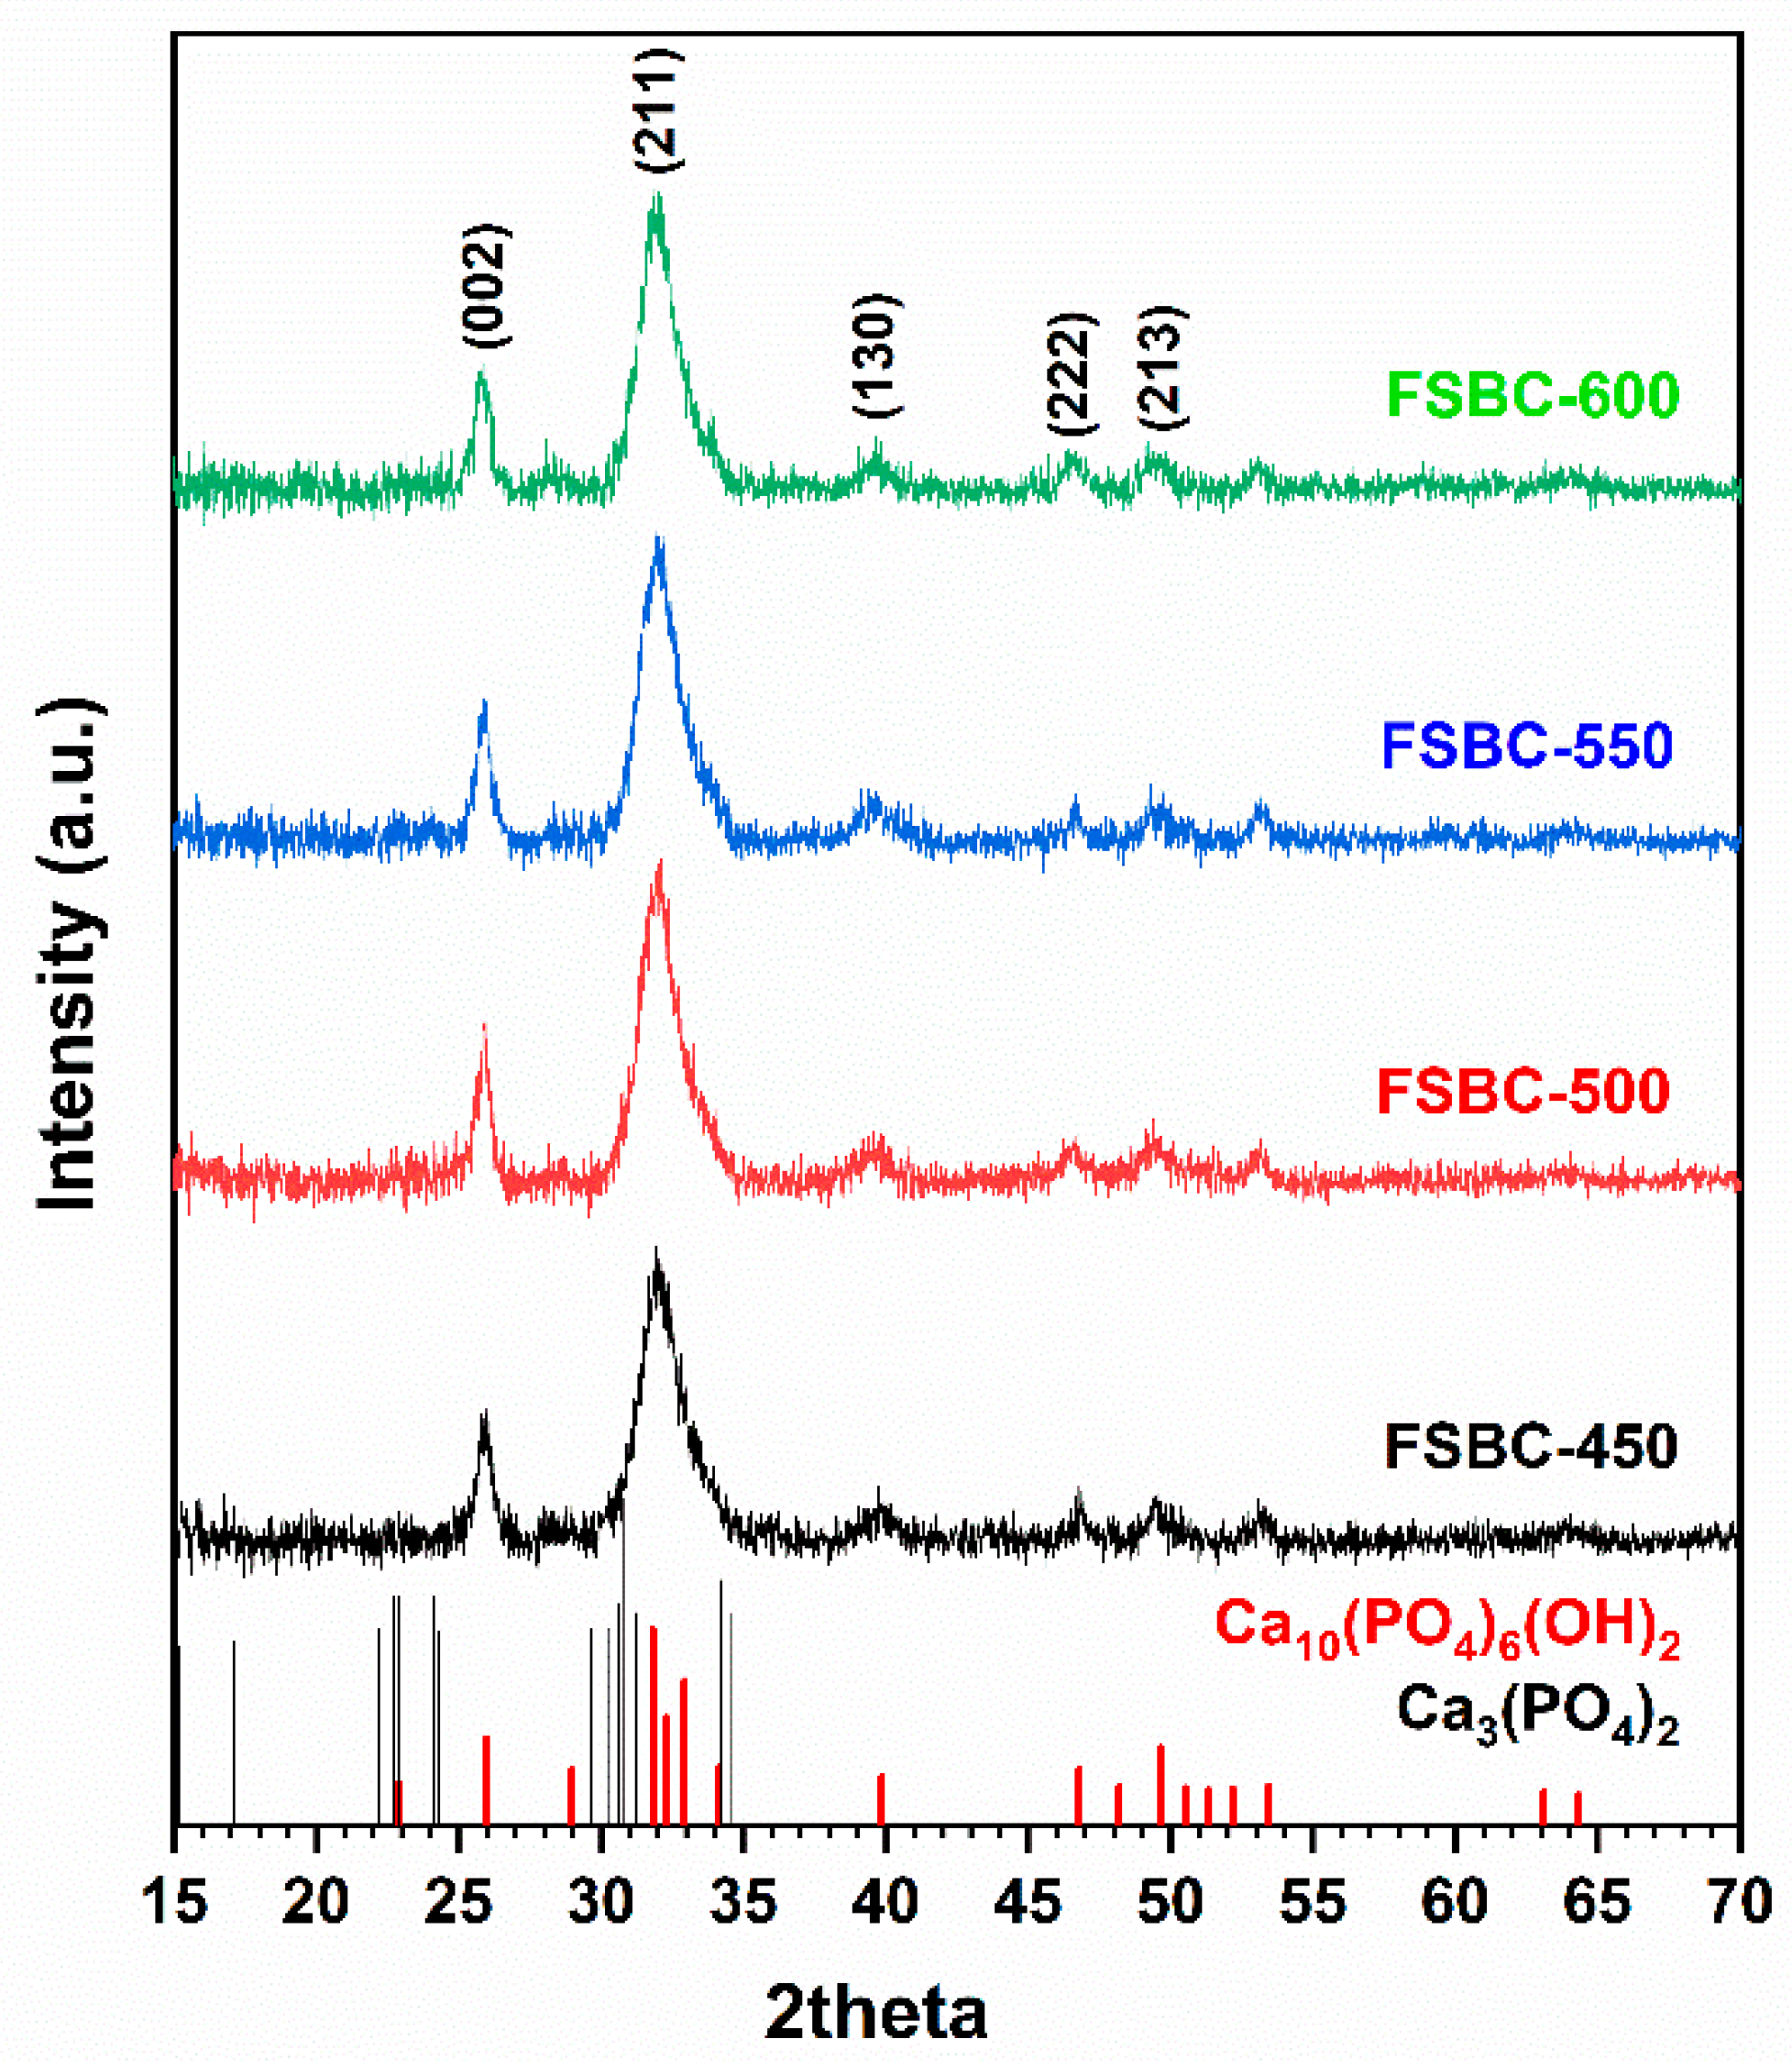
Figure 3.
SEM images of FSBC-450 and FSBC-600 and their corresponding carbon, calcium, and phosphorus maps.
Figure 3.
SEM images of FSBC-450 and FSBC-600 and their corresponding carbon, calcium, and phosphorus maps.

Figure 4.
TEM images of (a) FSBC-450 and (b) FSBC-600 and HR-TEM images of (c) FSBC-450 and (d) FSBC-600.
Figure 4.
TEM images of (a) FSBC-450 and (b) FSBC-600 and HR-TEM images of (c) FSBC-450 and (d) FSBC-600.

Figure 5.
(a) The suspension pH when FSBC-450 and FSBC-600 were dissolved in 0.01, 0.001, and 0.0001 mol·dm−3 citric acid solution. (b) pH distribution diagram for citric acid (CA, CitH3).
Figure 5.
(a) The suspension pH when FSBC-450 and FSBC-600 were dissolved in 0.01, 0.001, and 0.0001 mol·dm−3 citric acid solution. (b) pH distribution diagram for citric acid (CA, CitH3).

Figure 6.
FTIR spectra of the FSBC products that were derived from different pyrolysis temperatures.
Figure 6.
FTIR spectra of the FSBC products that were derived from different pyrolysis temperatures.

Figure 7.
FTIR spectra of the obtained FSBC products showing the calculation of CO32−/PO43− ratios.


Table 1.
Composition of the fish scale biochar products analyzed by EA and EDXRF.
| Elemental Composition (Weight %) | |||||
|---|---|---|---|---|---|
| Element | FSBC-450 | FSBC-500 | FSBC-550 | FSBC-600 | |
| Composition analyzed by EA | C | 25.6 | 23.47 | 23.38 | 22.56 |
| H | 2.77 | 2.16 | 1.88 | 1.67 | |
| N | 5.95 | 4.52 | 4.31 | 4.21 | |
| Others | 65.68 | 69.85 | 70.42 | 71.55 | |
| Composition analyzed by EDXRF | Ca | 54.90 | 56.97 | 56.78 | 57.40 |
| P | 17.49 | 17.62 | 17.90 | 18.11 | |
| C * | 25.60 * | 23.47 * | 23.38 * | 22.56 * | |
| Mg | 0.54 | 0.52 | 0.55 | 0.53 | |
| Sr | 0.34 | 0.38 | 0.38 | 0.38 | |
| Si | 0.37 | 0.34 | 0.34 | 0.34 | |
| Cl | 0.32 | 0.31 | 0.31 | 0.30 | |
| K | 0.20 | 0.14 | 0.14 | 0.14 | |
| Mn | 0.11 | 0.13 | 0.12 | 0.12 | |
| S | 0.05 | 0.04 | 0.03 | 0.03 | |
| Fe | 0.04 | 0.04 | 0.04 | 0.03 | |
| Zn | 0.03 | 0.03 | 0.03 | 0.03 | |
* Carbon (C) contents appearing in EDXRF data were obtained from EA and were input as a fixed value for the calculation of other element contents.
Table 2.
Crystallite size, crystallinity index, BET specific surface area, and the area ratio of carbonate and phosphate bands from FTIR spectra of FSBC products.
Table 2.
Crystallite size, crystallinity index, BET specific surface area, and the area ratio of carbonate and phosphate bands from FTIR spectra of FSBC products.
| Sample ID | Crystal Size (nm) | Crystallinity Index | Specific Surface Area (m2 g−1) | rC/P |
|---|---|---|---|---|
| FSBC-450 | 16.88 | 0.12660 | 73.61 | 0.25 |
| FSBC-500 | 16.91 | 0.12749 | 95.54 | 0.22 |
| FSBC-550 | 17.82 | 0.14902 | 100.27 | 0.17 |
| FSBC-600 | 13.21 | 0.060730 | 111.16 | 0.077 |
Table 3.
Initial P contents of FSBC composites and P release from FSBC composites.
| Sample ID | Initial P Content (mg g−1 FSBC) * | P Release (mg g−1) ** | |
|---|---|---|---|
| 1 Day | 5 Days | ||
| FSBC-450 | 175 | 0.311 ± 0.12 | 1.01 ± 0.07 |
| FSBC-500 | 176 | 0.314 ± 0.17 | 2.39 ± 0.08 |
| FSBC-550 | 179 | 0.371 ± 0.08 | 2.30 ± 0.21 |
| FSBC-600 | 180 | 0.332 ± 0.10 | 2.36 ± 0.12 |
* The initial P content were obtained from XRF. ** Mean ± standard deviation (n = 3).
Publisher’s Note: MDPI stays neutral with regard to jurisdictional claims in published maps and institutional affiliations. |
© 2022 by the authors. Licensee MDPI, Basel, Switzerland. This article is an open access article distributed under the terms and conditions of the Creative Commons Attribution (CC BY) license (https://creativecommons.org/licenses/by/4.0/).
Share and Cite
MDPI and ACS Style
Sittitut, U.; Jettanasen, J.; Supothina, S.; Rattanakam, R. Dissolution Performance of Carbon/Hydroxyapatite Nanocomposite Prepared from Fish Scales. Inorganics 2022, 10, 242. https://doi.org/10.3390/inorganics10120242
AMA Style
Sittitut U, Jettanasen J, Supothina S, Rattanakam R. Dissolution Performance of Carbon/Hydroxyapatite Nanocomposite Prepared from Fish Scales. Inorganics. 2022; 10(12):242. https://doi.org/10.3390/inorganics10120242
Chicago/Turabian StyleSittitut, Umaporn, Junya Jettanasen, Sitthisuntorn Supothina, and Ramida Rattanakam. 2022. "Dissolution Performance of Carbon/Hydroxyapatite Nanocomposite Prepared from Fish Scales" Inorganics 10, no. 12: 242. https://doi.org/10.3390/inorganics10120242
Note that from the first issue of 2016, this journal uses article numbers instead of page numbers. See further details here.