Article

Solution-State Studies, X-ray Structure Determination and Luminescence Properties of an Ag(I) Heteroleptic Complex Containing 2,9-Bis(styryl)-1,10-phenanthroline Derivative and Triphenylphosphine

by
Dimitrios Glykos
1,
John C. Plakatouras
1,2 and
Gerasimos Malandrinos
1,*
1
Laboratory of Inorganic Chemistry, Department of Chemistry, University of Ioannina, 451 10 Ioannina, Greece
2
Institute of Materials Science and Computing, University Research Center of Ioannina, 451 10 Ioannina, Greece
*
Author to whom correspondence should be addressed.
Inorganics 2023, 11(12), 467; https://doi.org/10.3390/inorganics11120467
Submission received: 6 November 2023 / Revised: 18 November 2023 / Accepted: 29 November 2023 / Published: 1 December 2023
(This article belongs to the Section Coordination Chemistry)

Abstract

:
A novel heteroleptic Ag(I) compound, formulated as [AgL(PPh3)]BF4 (1) (where L represents 2,9-bis((E)-4-methoxystyryl)-1,10-phenanthroline and PPh3 stands for triphenylphosphine), was successfully synthesized and thoroughly characterized. The compound’s stability in solution was confirmed through 1D and 2D nuclear magnetic resonance (NMR). The photo-irradiation of the complex in a CDCl3 solution, utilizing a common portable UV lamp emitting at λ = 365 nm, led to the partial transformation of the E,E-geometric isomer to E,Z, ultimately yielding a 1:1.4 molar ratio of isomers. Its molecular structure was determined via X-ray crystallography, while molecular packing was assessed using Hirshfeld calculations. The most notable interactions (51%) within the cationic inner sphere involved H···H bonds. The photophysical characteristics of the complex and L were evaluated both in the solid state and in solution (dichloromethane). Compound 1 is a weak emitter, with photoluminescence quantum yields of 8.6% and 4.3% in solution and the solid state, respectively.

Graphical Abstract

1. Introduction

Recent advancements in transition metal-based luminescent compounds have revolutionized the field of optoelectronics and sensing. Traditionally, heavy second- or third-row transition metals have been the cornerstone of luminescent complexes; however, their rarity and expense have spurred investigations into more cost-effective alternatives [1,2,3,4]. Transition metals with a d10 electron configuration, particularly Cu(I), Ag(I), and Au(I), have emerged as promising candidates. These metals, known for their abundance and affordability, have demonstrated remarkable luminescent properties suitable for various applications. Notably, Cu(I) complexes have shown great potential in light-emitting devices and photovoltaics, signifying a shift toward sustainable and cost-effective technologies [5,6,7,8,9,10].
The research on luminescent single-metal Ag(I) complexes has intensified due to their potential utility in a vast range of applications, including sensing, photocatalysis, and light emission in various devices. Among these compounds, those featuring chelating aromatic diimine ligands (NˆN) and phosphines (P or PˆP) have been extensively investigated. Ag(I) complexes often exhibit phosphorescence originating from excited states centered on the ligands (3LC) and, on occasion, display Thermally Activated Delayed Fluorescence (TADF) [11,12]. The electronic properties of diimine and phosphine ligands, along with the steric hindrance imposed by the insertion of bulky groups near the coordination sites, will influence both the nature of the excited states and the emitting properties (λem, photoluminescence quantum yield (ΦPL)) [13,14,15,16,17,18,19,20].
The literature has provided limited examples of luminescent Ag(I) trigonal complexes. Most of them are bimetallic with a diphosphine bridge [21,22,23,24,25,26,27], while mononuclear ones are even rarer [28,29,30,31]. Durini et al. recently reported several heteroleptic complexes of Ag(I) bearing the N^N ligand 2-(1-(pyridin-2-yl)imidazo[1,5-a]pyridin-3-yl) phenol and various monodentate phosphine ligands. Notably, they successfully manipulated the emission maxima by altering the phosphine ligand. One of their compounds denoted as [Ag(N^N)(PPh3)][NO3] exhibited intriguing photophysical characteristics, both in solid-state and solution environments (cyan to blue emitter) [32].
Moreover, 1,10-phenanthroline-based ligands have been the subject of extensive investigation over the past few decades. The distinctive structural and photophysical characteristics of the phenanthroline core have made ligands derived from it, along with their transition metal complexes, highly valuable scaffolds for a wide range of applications [33,34,35]. More specifically, styryl phenanthroline derivatives have been introduced, particularly for non-linear optics applications. By incorporating π-conjugated groups at the 2,9 positions of the central phenanthroline core, researchers have achieved high fluorescence efficiency. One effective strategy for achieving intriguing photophysical properties involves the use of molecules bearing D-π-A or D-π-A-π-D motifs, where D = electron donor, A = acceptor, and π = spacer. In this class of compounds, the fine-tuning of the optical properties can be easily achieved by the careful choice of electron-donor/-acceptor pairs and the π-conjugated spacer [36].
With the advantages of the above-mentioned derivatives and the promising photophysical characteristics of a simple Ag(I) trigonal complex [32] in mind, we believed it would be of interest to conduct the synthesis, characterization, and investigation of the photophysical attributes of a similar heteroleptic Ag(I) compound utilizing the diimine-type ligand L = 2,9-bis((E)-4-methoxystyryl)-1,10-phenanthroline and triphenylphosphine (PPh3).

2. Results and Discussion

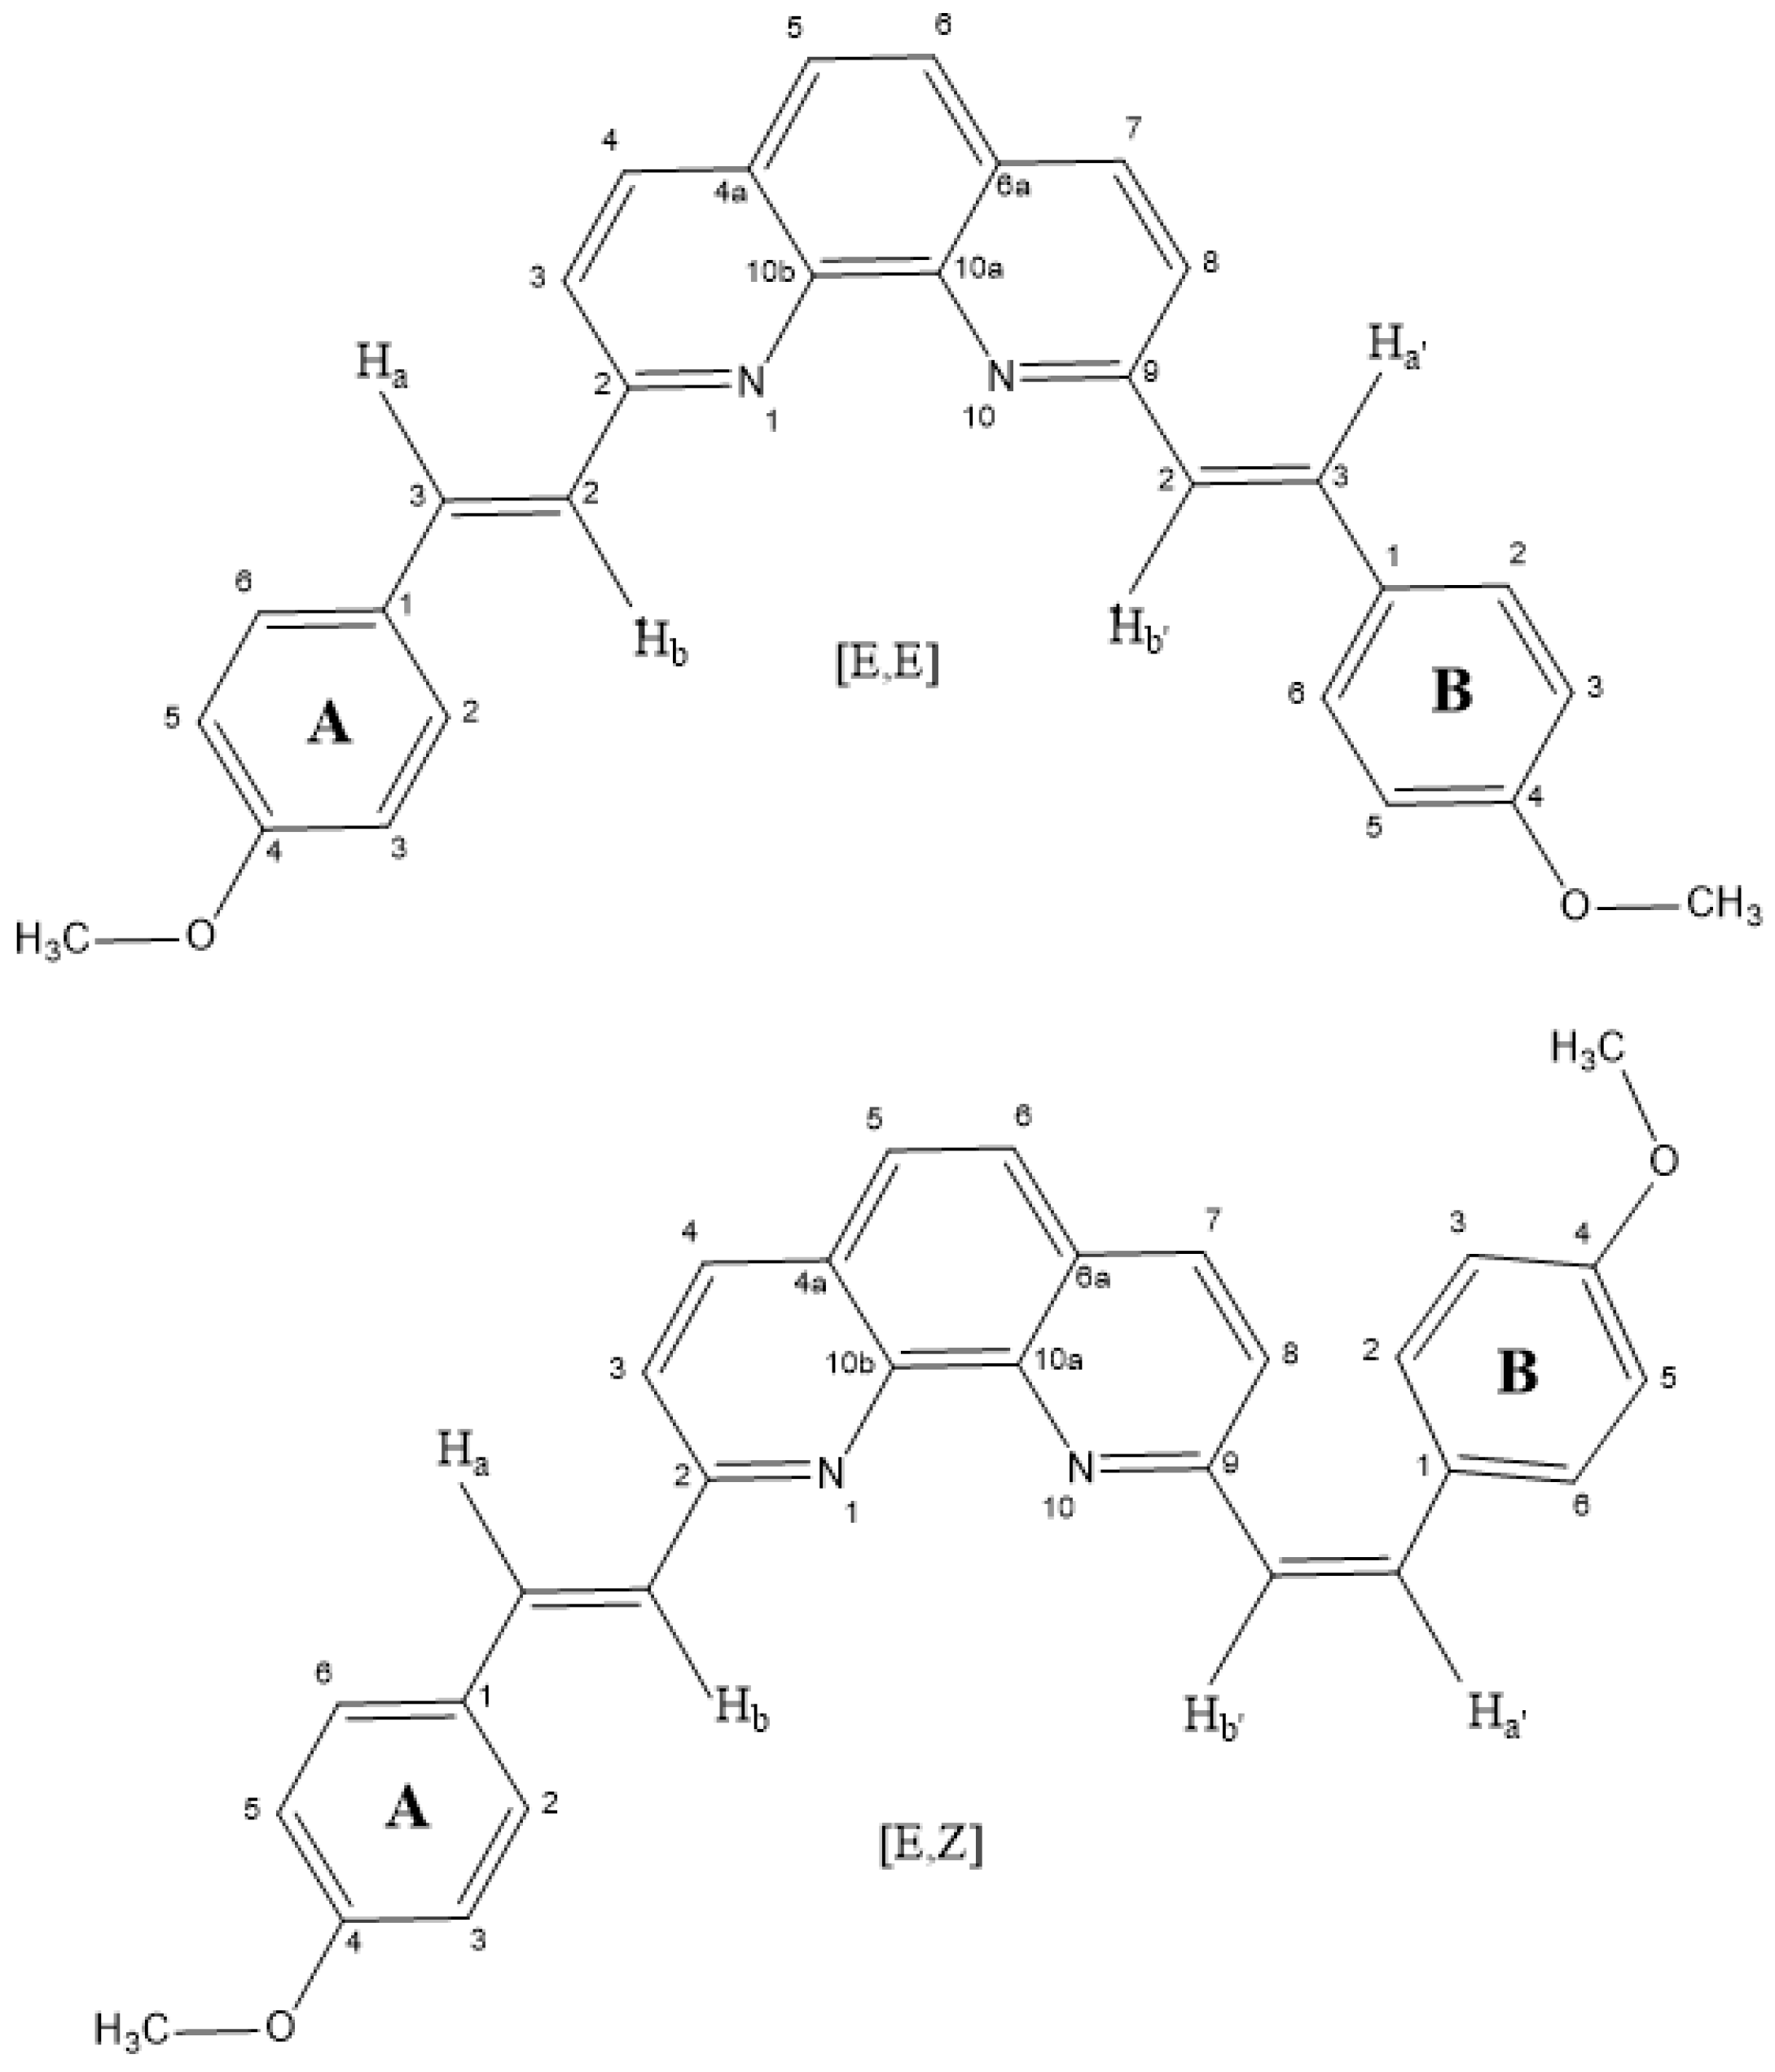
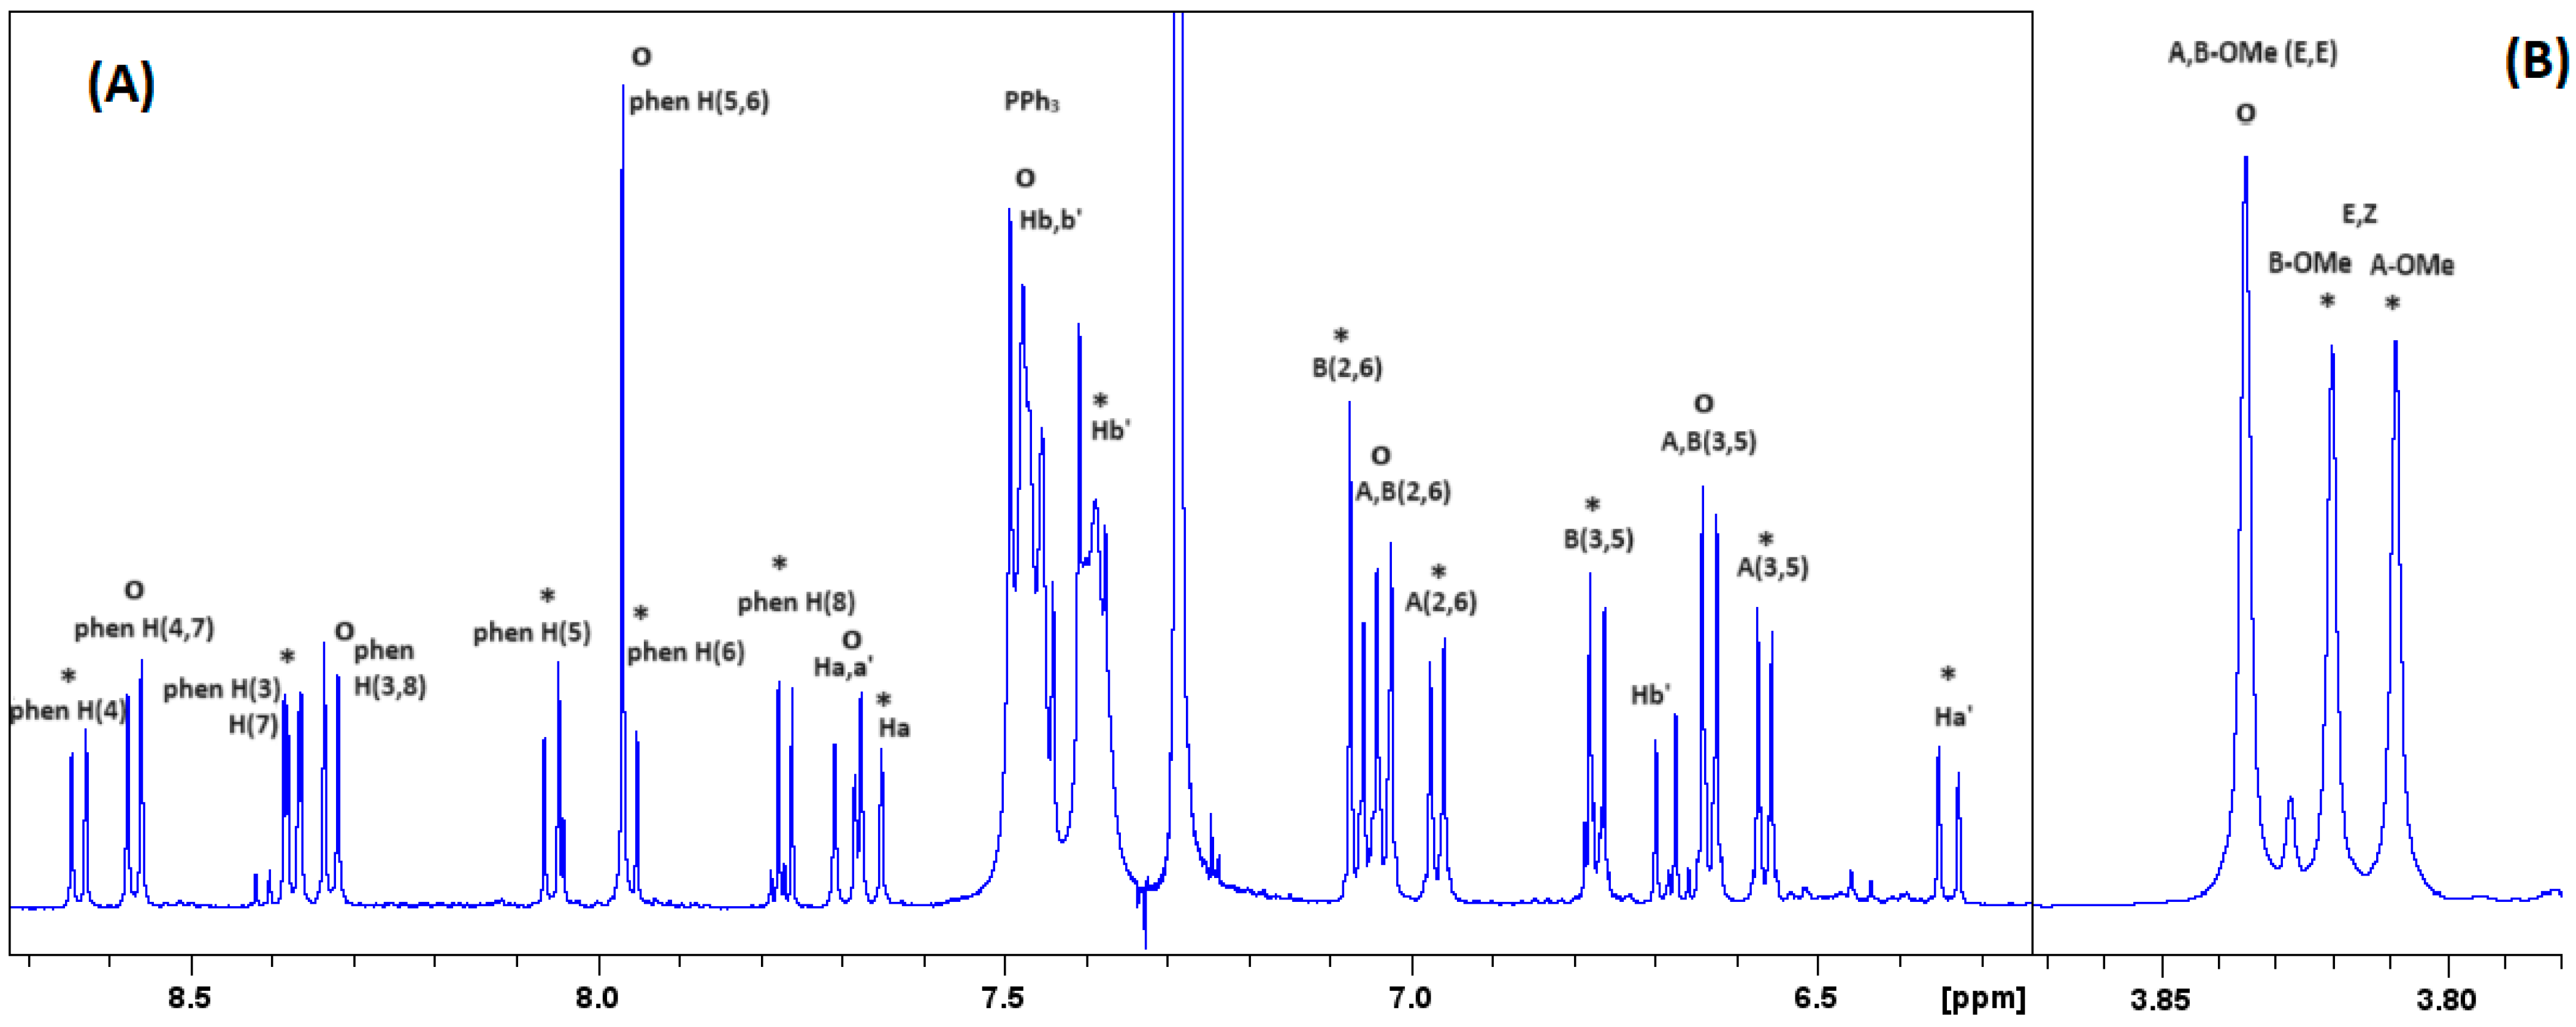
2.1. Characterization with NMR Spectroscopy

The 1H-NMR spectrum, as shown in Figure 1, was recorded using a CDCl3 solution of the crystalline material, which had been used for X-ray studies. It exhibits a set of sharp and well-resolved signals, indicating the compound’s integrity in the solution and the retention of C2 symmetry on the NMR timescale. The sample was left in the NMR tube overnight, and a full set of 2D NMR experiments was scheduled for the next day.
Surprisingly, in the 1H-NMR spectrum of the “aged” sample (Figure S1a), some low-intensity peaks became apparent. Initially, we suspected a partial decomposition of the complex, potentially yielding L and/or the homoleptic species [AgL2]+. However, an overlay of the spectra of this sample, the ligand, and [AgL2]+ (prepared in situ by mixing AgBF4 with 2 eq of L) (Figure S2) ruled out this possibility.
Considering the photosensitivity of silver compounds, we decided to irradiate the CDCl3 solution with a portable UV lamp emitting at λ = 365 nm for a short period (10 min). The 1H-NMR spectrum in Figure S1b clearly shows a notable increase in the intensity of these extra peaks. An additional 30 min sample irradiation followed, resulting in the spectrum shown in Figure S1c.
An analysis of the 1–2D NMR data (1H, 13C, COSY, NOESY, HSQC, HMBC) (Figures S1c, S3–S7) revealed that the E to Z photo-isomerization of one of the two C=C bonds took place, converting part of the complex from the (E,E) geometric isomer to the (E,Z) isomer. The E,E/E,Z molar ratio was calculated using the integral values of methoxy protons and found to be 1:1.43 (41:59%). This phenomenon is well-documented in organic styryl compounds [37,38,39,40], bis hydrazone [41], and metal complexes containing azo heteroarenes [42]. While there is one report in the literature for this ligand suggesting the presence of conformational isomers ([CuL2]+ species) [43], the detection of metallated 2,9-bis((E)-4-methoxystyryl)-1,10-phenanthroline geometric isomers due to photo-irradiation has never been reported.
The partial photo-isomerization of [AgL(PPh3)]+ (1) (E,E → E,Z) results in a C2-symmetry breaking for the E,Z isomer and, consequently, (i) the presence of two 4-methoxystyryl environments and (ii) the chemical shift differentiation of all 1H and 13C atoms of the 1,10-phenanthroline core. Assigning the E,E isomer was straightforward, but the E,Z case was more challenging. The most important correlations (2D NMR) that aided in accomplishing this task are provided in Figures S8–S11, with the 1H-NMR spectrum, including a complete assignment of all peaks, presented in Figure 2 (the atom labels used for the assignments are shown in Scheme 1).
The 1H and 13C chemical shifts (δ, ppm) and chemical shift differences (Δδ = δcomplexδL) derived from the above analysis are listed in Table 1 and Table S1, respectively. These data, particularly the Δδ values, clearly illustrate that the complexation of both ligands with Ag(I) causes a significant perturbation of the chemical shift for all protons belonging to either the phen core (downfield) or the 4-methoxy rings A and B (upfield). In the latter case, the observed shifts should be attributed to the anisotropic shielding effect created by the aromatic PPh3 rings. When comparing the Δδ values of 1-(E,E) and 1-(E,Z), the most significant difference is observed for phen H(8) (0.4 vs. −0.16 ppm, see Table 1), which was expected due to the conformational change (E → Z) of the double bond linking the phen-4-methoxyphenyl B ring.
Additional information concerning the Ag(I) coordination sphere and geometry was obtained through 31P-NMR spectroscopy. The spectrum of 1, recorded in CDCl3, is shown in Figure 3.
A well-resolved doublet of doublets centered at 15.75 ppm appears, from which the J(109Ag-31P) and J(107Ag-31P) couplings can be calculated (721, 628 Hz, respectively). The values of J couplings imply that Ag(I) adopts a trigonal geometry employing the diimine ligand and the phosphine [32]. The irradiation process causes no significant change in the 31P chemical shift (16.44 ppm). The signal appears now broad and unstructured, possibly due to the slightly different 31P chemical environments of the two isomers (Figure S12).
Lastly, we decided to investigate if the photo-isomerization reaction could proceed further. An additional 2 h irradiation produced no significant spectral changes (Figure S13). Only a 2% increment of the E,Z percentage in the mixture was observed (new E,E/E,Z molar ratio: 1:1.54). Thus, we assume that under the reaction conditions used, the equilibrium state has been reached.

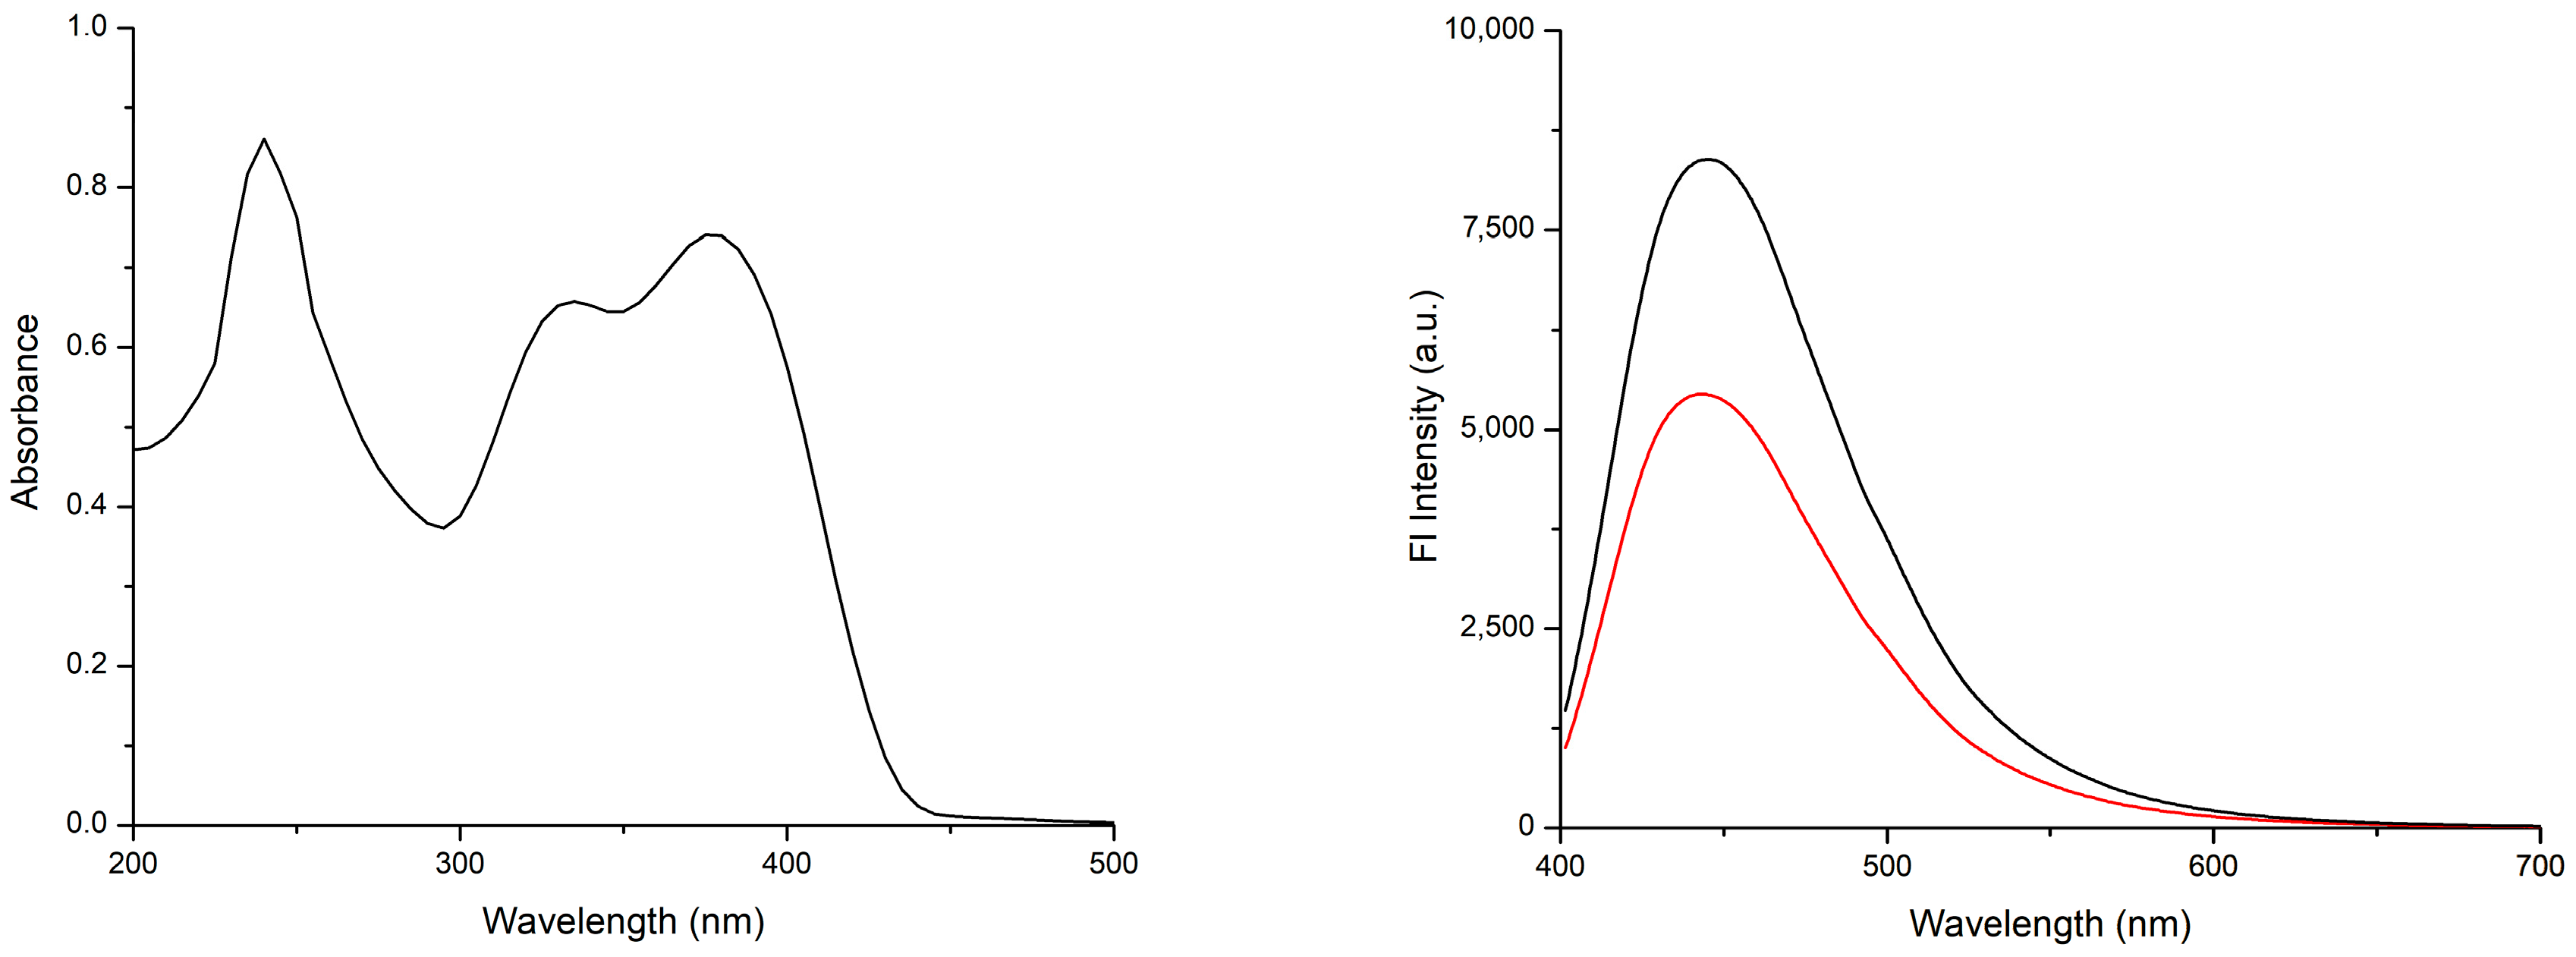
2.2. Optical Properties in Solution

The UV-vis and emission spectra of complex 1 in CH2Cl2 are both depicted in Figure 4, with detailed photophysical data available in Table 2. It exhibits absorption bands at around 240 nm and within the 330–380 nm wavelength range, with no noticeable absorption observed beyond 450 nm. The former is attributed to ligand-centered (LC) π → π* transitions, while the bands observed in the 330–380 nm spectral range are expected to have a combined character of L-to-L Charge Transfer (LLCT) and M-to-L Charge Transfer (MLCT). This behavior is commonly observed in complexes of the type M[(NˆN)(P)] (where M represents Ag(I) or Cu(I)) [13,16,44,45].
The relative photoluminescent quantum yield (ΦPL) calculated for 1 in solution is 8.6%. Notably, this value does not significantly differ from the quantum yield obtained for the ligand L, which is 6%.

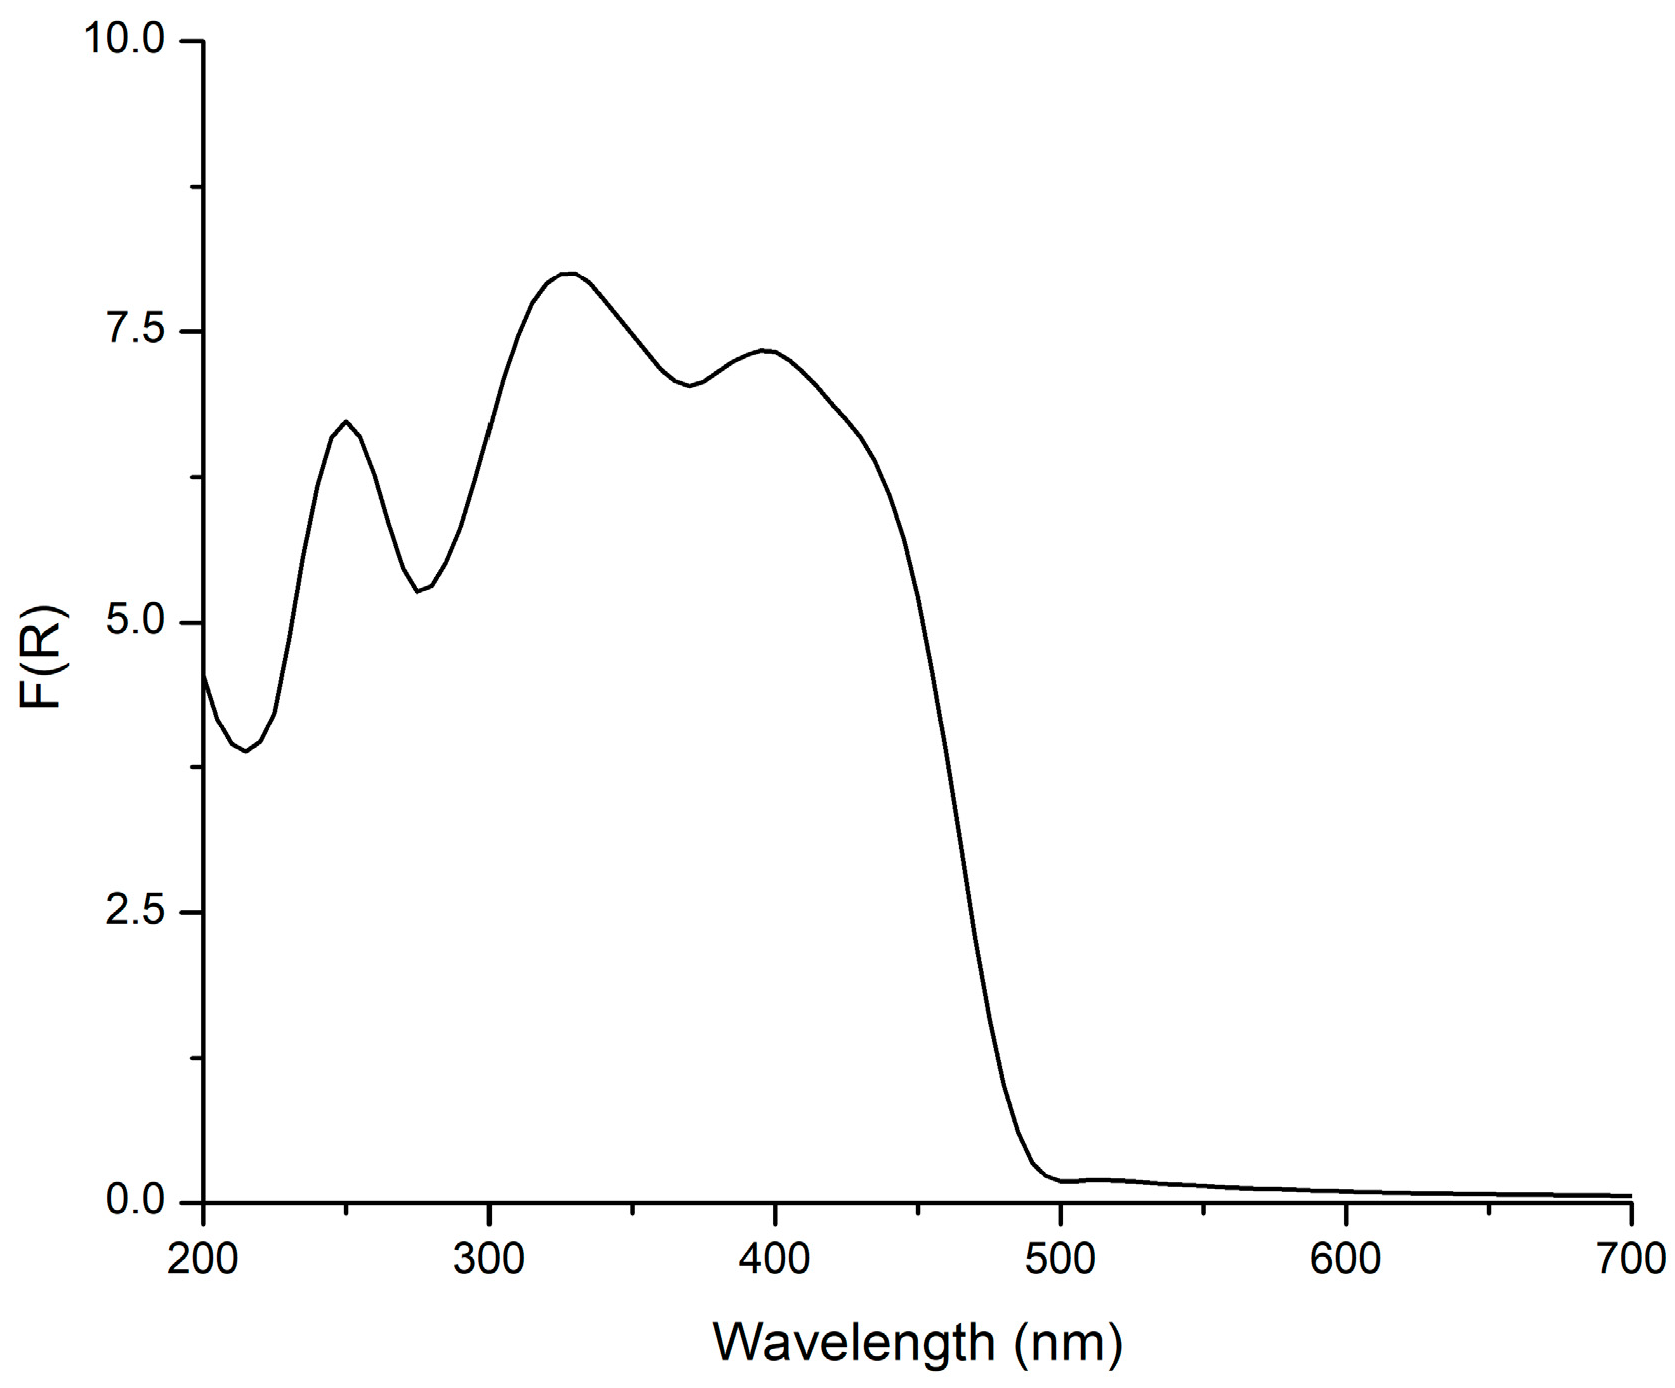
2.3. Absorption Spectrum (DRS)

Figure 5 depicts the diffuse reflectance spectrum (DRS) of 1. The broad spectral pattern ranging from 240 to 480 nm is commonly found in such complexes. Electronic transitions associated with ligand-centered (LC) π → π* and n → π* transitions are expected within the 240–350 nm range, while lower-energy bands (above 350 nm) can be ascribed to LLCT and MLCT transitions [46,47,48].

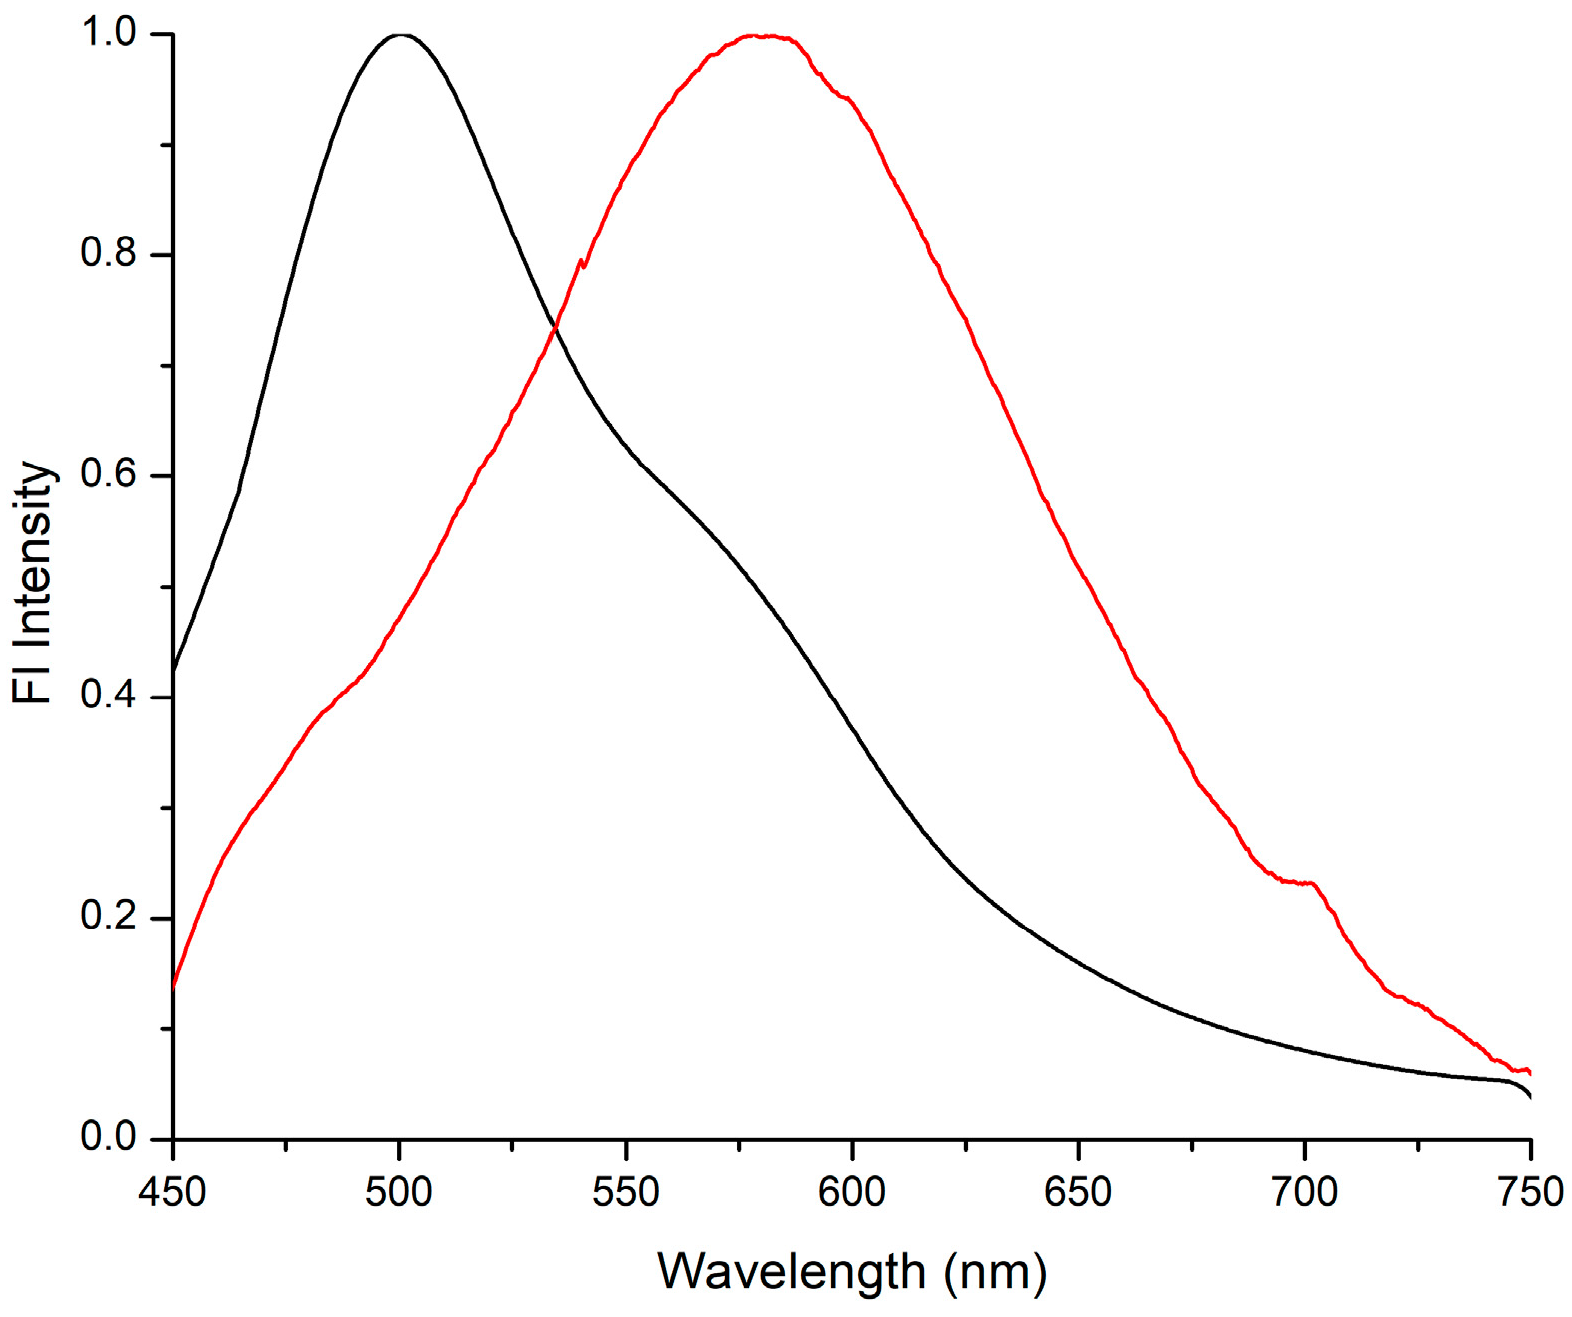
2.4. Luminescent Behavior in the Solid State

The emission spectrum of compound 1 in the solid state is displayed in Figure 6. It shows a hypsochromic shift in the emission maxima compared to the ligand L, with a shift of Δλ = 70 nm. The absolute photoluminescent quantum yield (ΦPL) for 1 is relatively low at 4.3%, closely resembling that of L (3.8%). However, the noted hypsochromic shift mentioned earlier suggests that Ag(I)-L interaction may have an impact on the nature of the excited state.

2.5. IR Spectroscopy

In the ATR-IR spectrum of compound 1, as depicted in Figure S14, the characteristic bands assigned to C=N, B-F and C-P stretching vibrations (1580, 1050 and 517 cm−1 respectively) are clearly observable, indicating the presence of L, PPh3 and BF4 [17].

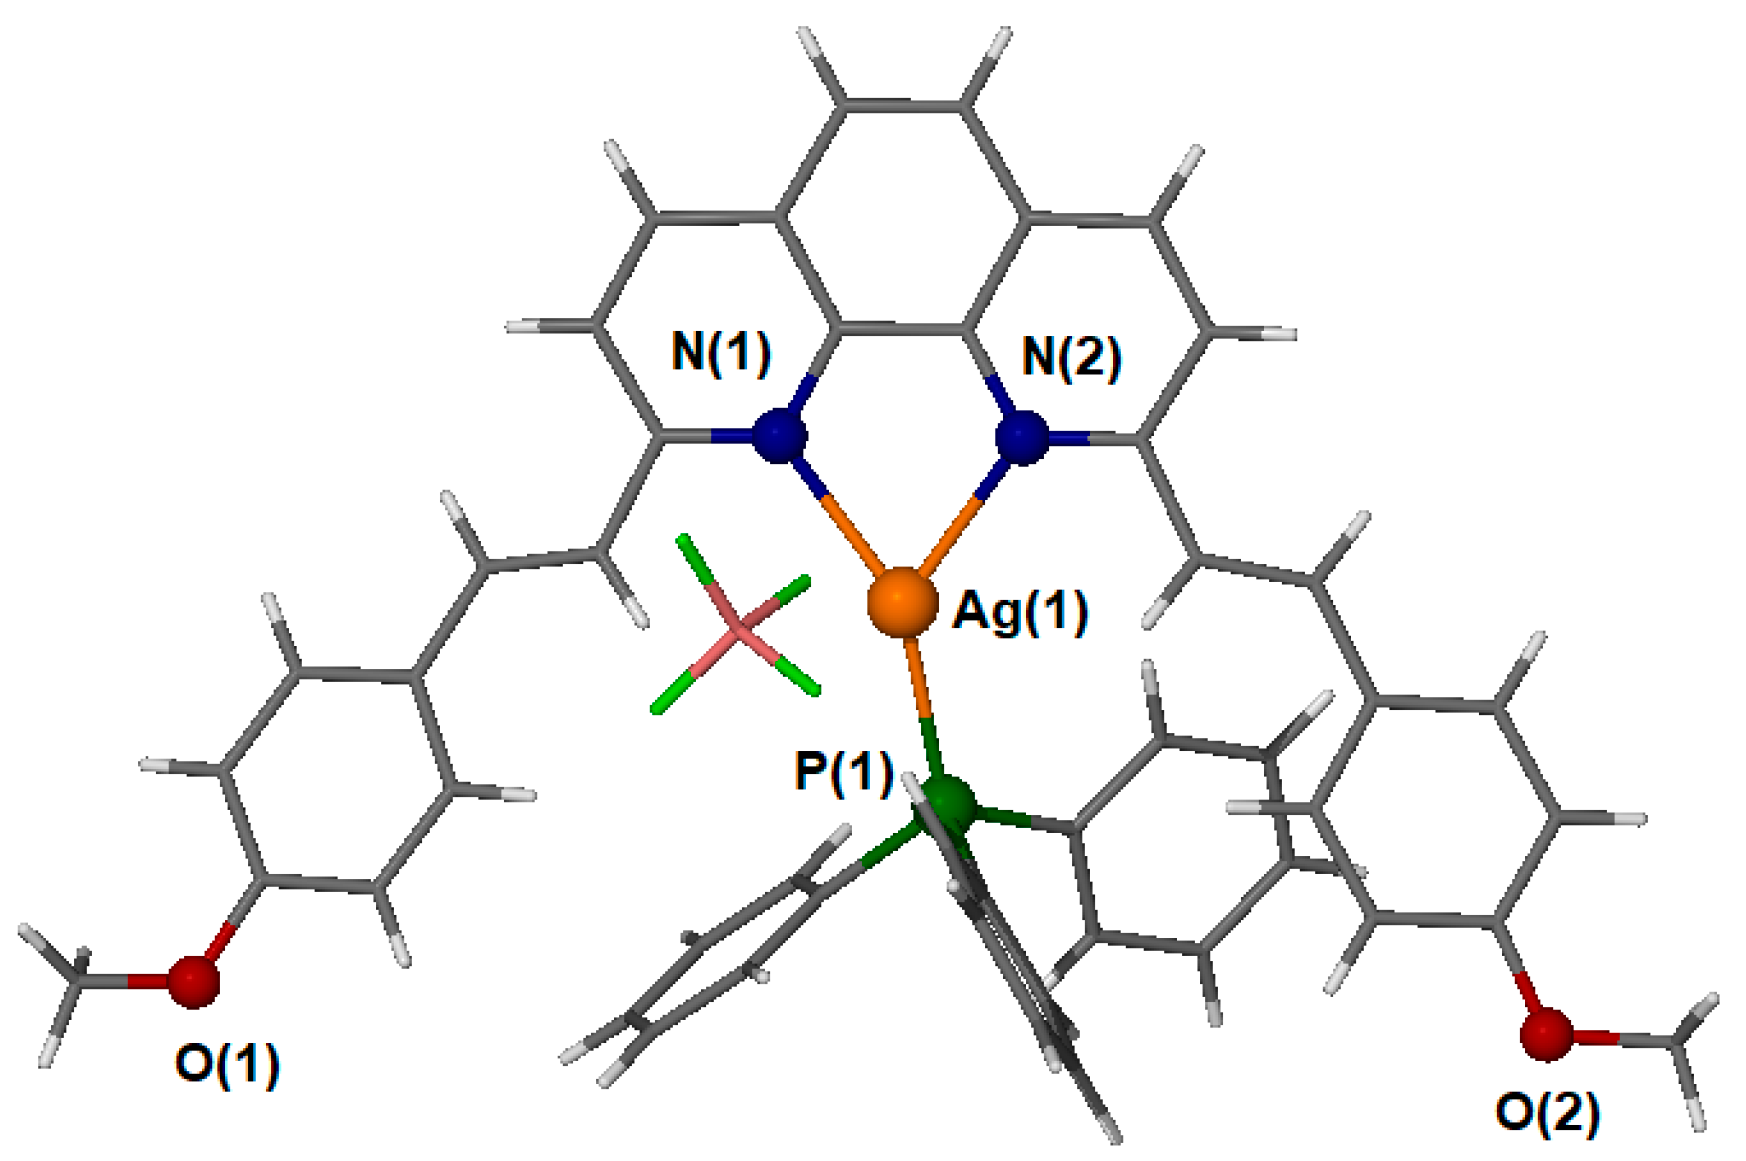
2.6. Description of the Structure

Compound 1 crystallizes in the triclinic space group P-1. The asymmetric unit consists of a positively charged cation [AgL(PPh3)]+ and the corresponding counter-anion, BF4. The visual representation of this cation’s structure can be found in Figure 7. Selected bond distances (in Ångstroms) and angles (in degrees) for the coordination sphere of Ag(I) in the cation are presented in Table 3.
Compound 1 belongs to a limited group of compounds that have undergone structural analysis and are described by the formula [Ag(N-N chelate)(unidentate phosphine)](counter anion) [30,31,49]. Notably, it stands out as the first known example containing the ligand 2,9-bis((E)-4-methoxystyryl)-1,10-phenanthroline. In the cationic part of the structure, Ag(1) is positioned at the center of a distorted trigonal planar geometry. This geometry is formed by two nitrogen atoms, N(1) and N(2), belonging to a chelating ligand, and one phosphorus atom, P(1), which is part of a coordinated PPh3 molecule. The deviations from the ideal trigonal planar arrangement are evident in the relatively wide N(1)-Ag(1)-P(1) angle of 151.34(6)°, primarily due to the substantial steric hindrance imposed by the phenyl groups. Additionally, the acute N(1)-Ag(1)-N(2) angle of 73.26(8)° arises from the small bite angle of chelation. The bond distances between Ag and P, as well as Ag and N, align with values previously reported in the literature [30,49]. The weaker interaction of the ligand with silver(I), compared to that of the literature complex [Ag(phen)(PPh3)]CF3SO3, was confirmed by inspecting the difference in Ag-N(2) bond length (mean values: Ag-N(2)phen, 2.280; Ag-N(2)L, 2.336 Å).
The compound displays an offset face-to-face π-stacking motif between phenanthroline rings. The corresponding distances from centroid-to-centroid and centroid-to-plane are 3.61 and 3.43 Å, respectively, with a ring offset of 1.15 Å [50,51].
A packing diagram illustrating the π-stacking and phenyl embraces between two independent PPh3 molecules is shown in Figure 8.

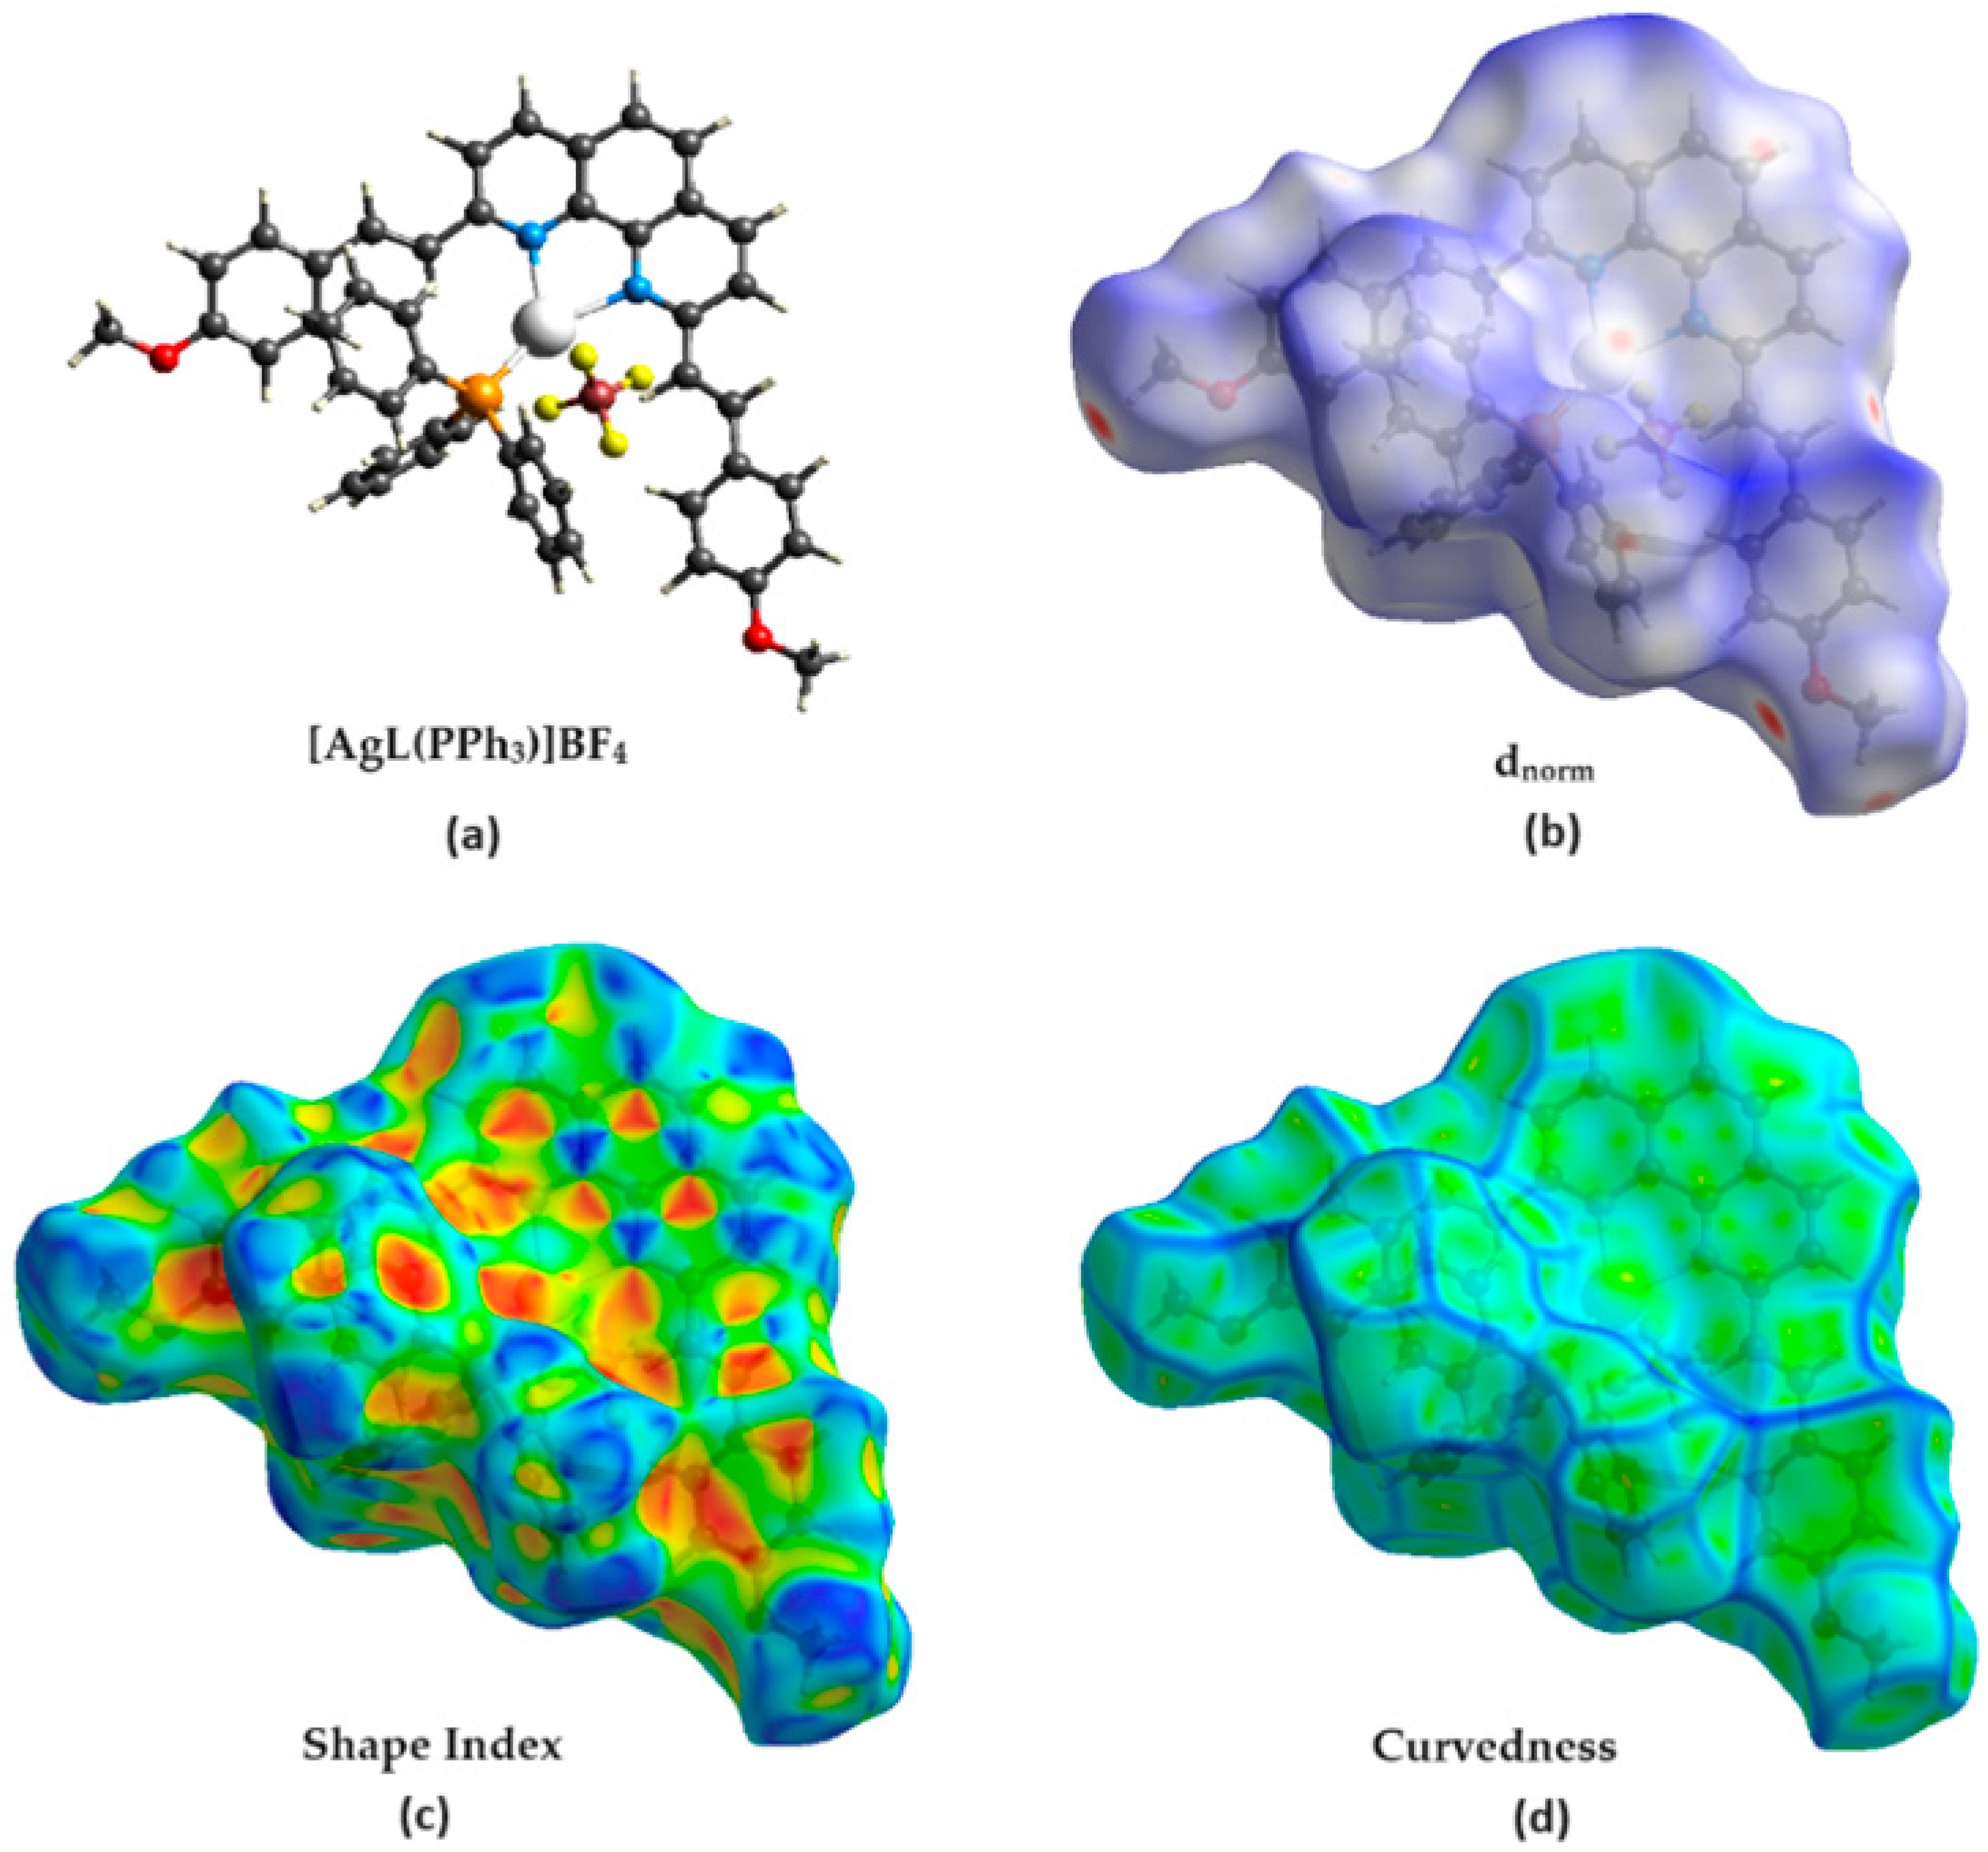
2.7. Hirshfeld Surface Analysis

A convenient and accurate method for discerning the various interactions among atoms in a crystal structure is Hirshfeld Surface Analysis [52]. This method was employed to dissect the intermolecular interactions within the crystal structure of the [AgL(PPh3)]BF4 complex. The generated Hirshfeld maps are depicted in Figure 9. Interestingly, even though the tetrafluoroborate counter anion was not directly involved in the Ag(I) coordination sphere, it plays a significant role in intermolecular contact.
The 2D fingerprint plots for 1, shown in Figure S15, demonstrate that H···H contacts contribute the largest portion (50.1%) to the total Hirshfeld surface at the range of de + di ≈ 2.2 Å. The second-largest contribution belongs to C···H/H···C contacts with the tips at de + di ≈ 3.2 Å. The contribution of O···H/H···O contacts appears as a diffuse shape with de + di ≈ 2.6 Å. In the shape index map, the presence of red and blue triangles indicates aromatic stacking interactions.
Furthermore, the flat green areas in the curvedness map further support the existence of π-stacking interactions. The percentage of C···C interactions was calculated to be 6.4%. The other weak contacts (Ag···H/H···Ag) and (Ag···C/C···Ag) are identified as low-density scattered points in 2D fingerprint plots. Lastly, the crystal holds BF4 through strong intermolecular interactions, including non-conventional C-H···F hydrogen bonds.

3. Materials and Methods

3.1. Materials

All solvents were of analytical purity and used as received. AgBF4, PPh3 and 4-anisaldehyde were purchased from Sigma-Aldrich (Burlington, MA, USA), while neocuproine was purchased from TCI Chemicals (Tokyo, Japan). All reactions were carried out under an inert atmosphere unless otherwise stated.

3.2. Methods

Unless otherwise stated, all spectroscopic work was conducted using crystals of the isolated compound (E,E-isomer). The crystalline material was dissolved in the appropriate solvent, and the spectra were recorded immediately. To check if the excitation radiation used in the emission spectrum could promote the partial transformation of the E,E isomer to E,Z, a 1H-NMR spectrum was acquired. The spectrum is depicted in Figure S16 and shows that the compound remains intact (please compare with Figure 1).
A high-resolution–electrospray ionization–mass spectrum (HR-ESI-MS) was acquired using a Thermo Scientific LTQ Orbitrap XL™ system. One-dimensional (1H, 13C) and two-dimensional (COSY, NOESY, HMBC, HSQC) nuclear magnetic resonance (NMR) experiments were conducted on a Bruker Avance spectrometer (Bruker Biospin GmbH, Ettlingen, Germany) with proton and carbon frequencies of 500.13 MHz and 125.03 MHz, respectively. Additionally, 31P{1H} NMR spectra (101.25 MHz) were recorded at room temperature on a Bruker Avance spectrometer (Bruker Biospin GmbH, Ettlingen, Germany) with a proton frequency of 250.13 MHz. The chemical shifts for 1H and 13C were referenced to the residual solvent peak (CDCl3), while 31P shifts were referenced to an external standard (85% H3PO4). NMR data were processed using Topspin 4.07 (Bruker Biospin GmbH, Ettlingen, Germany). An Agilent Cary 630 ATR-IR (Harrick Scientific Products, Inc., New York, NY, USA) spectrometer was utilized to record the infrared spectrum, and an Agilent Cary 60 UV–vis spectrophotometer (Harrick Scientific Products, Inc., New York, NY, USA) was employed to register both the solution and solid-state (DRS) spectra of the compound. Emission studies were conducted using the infrastructure and procedures outlined in previous works [44,53].

3.3. Crystal Structure Determination

For the collection of the diffraction data, an appropriately sized yellow prism-shaped crystal (dimensions: 0.45 × 0.22 × 0.18 mm3) was mounted on the goniometer of a Bruker D8 Quest Eco diffractometer (Ettlinger, Germany) equipped with a Photon II detector and a TRIUMPH (curved graphite) monochromator, utilizing Mo Kα radiation (wavelength λ = 0.71073 Å) [54]. A wide-frame method was used to integrate the gathered frames, which included φ and ω scans. The multi-scan approach (SADABS (Version 2.03)) [55] was applied to rectify the data (correction for absorption effects). The structure was solved by direct methods, and the ShelXle interface (Version Qt5-64-1.0.1506) enabled full-matrix least-squares methodology to be used on F2 (SHELXL 2018/3) [56,57]. Non-H atoms were subjected to anisotropic treatment, and organic H atoms were positioned in the ideal positions based on calculations and then refined as riding on their respective carbon atoms. PLATON (Version 2023.1) was utilized for geometric computations [58], while X-Seed (Version 4.10) was employed to produce molecular visualizations [59].
Crystal data for C48H39AgN2O2PBF4 (M = 901.46 g/mol) are summarized as follows: triclinic, space group P-1 (no. 2), a = 10.2795(3) Å, b = 11.8100(3) Å, c = 18.7503(4) Å, α = 98.070(2), β = 103.124(2), γ = 106.865(2), V = 2068.90(10) Å3, Z = 2, T = 296(2) K, μ(MoKα) = 0.576 mm−1, Dcalc = 1.447 g/cm3, 68,781 reflections measured (2.50 < θ < 27.54), 7274 unique (Rint = 0.0578), which were used in all calculations. The final R1 was 0.0324 (I > 2σ(I)), and wR2 was 0.0790 (all data) (Table S2).
CCDC2303493 contains the supplementary crystallographic data for this paper. These data can be obtained free of charge via https://www.ccdc.cam.ac.uk/structures/? (accessed on 25 October 2023).

3.4. Synthesis

3.4.1. Synthesis of Ligand L

The ligand L 2,9-bis((E)-4-methoxystyryl)-1,10-phenanthroline was prepared according to the literature procedure [36]. 1H and 13C data are given in Table S3.

3.4.2. Synthesis of [AgL(PPh3)]BF4 Complex

A 25 mL round-bottom flask containing 10 mL of a 5:2 v/v CH2Cl2/MeOH mixture was charged with 26.2 mg of PPh3 (0.1 mmol) and 19.67 mg of AgBF4 (0.1 mmol). The clear solution was stirred for 2 h under argon at room temperature. Subsequently, 44.45 mg of L (0.1 mmol) was added, and the resulting yellow solution was stirred for an additional 2 h. The crude product, isolated by evaporating to dryness, was washed with diethyl ether, collected, and dried under vacuum, resulting in a yield of 79%. Single crystals suitable for X-ray analysis were obtained by the vapor diffusion of diethyl ether into a CH2Cl2 solution of the compound. The material, verified through X-ray crystallography, is complex 1 (E,E-isomer). Although we did not analyze the solution from which the crystals were obtained, we believe that UV-light absorption by the glass jar used to crystallize the compound (under ambient light) and the higher thermodynamic stability of the E,E-isomer might explain its selective isolation. C48H39AgN2O2PBF4 (E,E isomer): 1H NMR (500 MHz, CDCl3) (ppm): 8.57 (d, J = 8.6 Hz, 2H); 8.33 (d, J = 8.6 Hz, 2H); 7.97 (s, 2H); 7.70 (d, J = 16.3 Hz, 4H); 7.43 (d, J = 16.3 Hz, 4H); 7.04 (d, J = 8.7 Hz, 4H); 6.63 (d, J = 8.7 Hz, 4H); 3.84 (s, 3H); PPh3 7.39–7.47 (m). 13C NMR (125 MHz, CDCl3) (ppm) Table S1: 160.7; 156.4; 142.6; 139.4; 138.5; 129; 127.9; 126.5; 126.4; 121.7; 114.3; 55.4 (L), 129.5; 130.4; 131.5; 133.8 (PPh3).
C48H39AgN2O2PBF4 (E,Z isomer): 1H NMR (500 MHz, CDCl3) (ppm): 8.64 (d, J = 8.6 Hz); 8.37 (d, J = 8.6 Hz); 8.37 (d, J = 8.4 Hz); 8.06 (d, J = 8.7 Hz); 7.96 (d, J = 8.7 Hz); 7.77 (d, J = 8.4 Hz); 7.67 (d, J = 16.2 Hz); 7.39 (d, J = 16.2 Hz); 7.07 (d, J = 8.7 Hz); 6.97 (d, J = 8.7 Hz); 6.77 (d, J = 8.7 Hz); 6.69 (d, J = 12 Hz); 6.56 (d, J = 8.7 Hz); 6.34 (d, J = 12 Hz); 3.82 (s); 3.81 (s) PPh3 7.39–7.47 (m). 13C NMR (125 MHz, CDCl3) (ppm) Table S1: 160.7; 160.2; 157; 156.7; 142.6; 142.3; 139.6; 138.9; 138.7; 136.6; 130.6; 129.1; 128.5; 128.4; 127.8; 127.7; 127.3; 127.2; 126.4; 126.3; 125.5; 122.1; 114.3; 114.2; 55.4; 55.3. (L), 129.5; 130.4; 131.5; 133.8 (PPh3).
31P NMR (101.25 MHz), CDCl3) (ppm): 15.75 (dd, J(109Ag-31P) = 721 Hz, J(107Ag-31P) = 628 Hz).
HR ESI-MS: m/z = 815.1801 for [AgL(PPh3)]+, additional fragments present: m/z = 515.0885 for [AgL]+, and m/z = 997.2723 for [AgL2]+ (Figures S17–S20).

4. Conclusions

In summary, we have successfully synthesized and characterized a novel Ag(I) heteroleptic complex (1) containing the diimine-type ligand 2,9-bis((E)-4-methoxystyryl)-1,10-phenanthroline and triphenylphosphine. X-ray crystallography has revealed that Ag(I) adopts a distorted trigonal planar geometry, formed by the two chelating diimine nitrogen atoms and one phosphorus atom. This structural arrangement is also retained in solution, as indicated by the observable 107/109Ag-31P coupling constants in the 31P{1H}-NMR spectrum.
Photo-irradiation at 365 nm of the compound in CDCl3 induces photo-isomerization, resulting in a mixture of E,E and E,Z geometrical isomers, which have been thoroughly characterized in solution. Notably, 1 is a weak emitter both in the solid state and in solution, exhibiting photoluminescent quantum yields of 4.3% and 8.6%, respectively.
We intend to continue our studies by synthesizing more similar complexes and investigating their photo-reactivity in greater detail.

Supplementary Materials

The following supporting information can be downloaded at: https://www.mdpi.com/article/10.3390/inorganics11120467/s1, Figure S1: 1H-NMR spectra (aromatic region) of 1 in CDCl3 solutions (500 MHz, 298 K): (a) an “aged” sample, (b) irradiated at λ = 365 nm for 10 min, (c) irradiated for an additional 30 min; Figure S2: 1H-NMR spectra (aromatic region) of CDCl3 solutions of: (a) 1 irradiated at λ = 365 nm for 40 min, (b) L, (c) [AgL2]+; Figure S3: 13C{1H}-NMR spectrum of a CDCl3 solution of 1 irradiated at λ = 365 nm for 40 min (125 MHz, 298 K); Figure S4: 1H-1H-COSY NMR spectrum (500 MHz, 298 K) of a CDCl3 solution of 1 irradiated at λ = 365 nm for 40 min; Figure S5: 1H-1H-NOESY NMR spectrum (500 MHz, 298 K) of a CDCl3 solution of 1 irradiated at λ = 365 nm for 40 min; Figure S6: 1H-13C-HSQC NMR spectrum (298 K) of a CDCl3 solution of 1 irradiated at λ = 365 nm for 40 min; Figure S7: 1H−13C-HMBC NMR spectrum (500 MHz, 298 K) of a CDCl3 solution of 1 irradiated at λ = 365 nm for 40 min; Figure S8: Overlay of 1H-1H-COSY (blue) and 1H-1H-NOESY (red-magenta) NMR spectra of a CDCl3 solution of 1 irradiated at λ = 365 nm for 40 min. The most informative correlations toward identification of the phen core 1H’s are circled; Figure S9: Overlay of 1H-1H-COSY (blue) and 1H-1H-NOESY (red-magenta) NMR spectra of a CDCl3 solution of 1 irradiated at λ = 365 nm for 40 min, showing the NOE correlations from ethylenic protons; Figure S10: Part of 1H-1H-NOESY spectrum of 1 irradiated at λ = 365 nm for 40 min, showing the methoxy-A,B(3,5) protons correlations for both isomers. See Scheme 1 for atom labeling; Figure S11: Part of 1H-13C-HSQC spectrum of 1 irradiated at λ = 365 nm for 40 min, showing correlations of H(3)/C(3), H(7)/C(7) for E,Z isomer and H(3,8)/C(3,8) for E,E isomer. See Scheme 1 for atom labeling; Figure S12: 31P{1H}-NMR spectra of CDCl3 solutions of 1 (101.25 MHz, 298 K): (a) using crystals of the compound; (b) irradiated at λ = 365 nm for 40 min; Figure S13: 1H-NMR spectrum (aromatic region) of a CDCl3 solution of 1 irradiated at λ = 365 nm for 2 h (298 K); Figure S14: The ATR-IR spectrum of 1; Figure S15: 2D fingerprint plots of [AgL(PPh3)]BF4; Figure S16: 1H-NMR spectrum (aromatic region) of a CDCl3 solution of 1 acquired immediately after recording the emission spectrum (298 K);Figure S17: HR-ESI-MS spectrum of compound 1 in CHCl3; Figure S18: HR-ESI-MS spectrum of the fragment [AgL]+ (top) and theoretical spectrum; Figure S19: HR-ESI-MS spectrum of the fragment [AgL(PPh3)]+ (top) and theoretical spectrum; Figure S20: HR-ESI-MS spectrum of the fragment [AgL2]+ (top) and theoretical spectrum; Table S1: 13C-NMR data (δ,ppm) for L/PPh3, and complex (E,E and E, Z isomers); Table S2: Crystal data and structure refinement for C48 H39 Ag B F4 N2 O2 P at 296(2) K.; Table S3: 1H and 13C NMR data (δ,ppm) for the ligand; File S1: crystal structure of the compound (*.cif file); File S2 (checkcif, pdf file).

Author Contributions

Conceptualization: G.M.; supervision: G.M.; formal analysis: D.G. and J.C.P.; investigation: D.G.; X-ray crystallography: J.C.P. and D.G.; writing—original draft: D.G.; writing—review and editing: G.M. and J.C.P. All authors have read and agreed to the published version of the manuscript.

Funding

This research received no external funding.

Data Availability Statement

The information provided in this research is accessible in both the article and its Supplementary Materials.

Acknowledgments

The authors would like to thank the Network of Research Supporting Laboratories at the University of Ioannina for providing access to the use of NMR, HR ESI-MS and X-ray diffraction facilities.

Conflicts of Interest

The authors declare no conflict of interest.

References

  1. Zhao, Q.; Huang, C.; Li, F. Phosphorescent Heavy-Metal Complexes for Bioimaging. Chem. Soc. Rev. 2011, 40, 2508. [Google Scholar] [CrossRef]
  2. Abbas, S.; Din, I.; Raheel, A.; Tameez ud Din, A. Cyclometalated Iridium (III) Complexes: Recent Advances in Phosphorescence Bioimaging and Sensing Applications. Appl. Organomet. Chem. 2020, 34, e5413. [Google Scholar] [CrossRef]
  3. Caporale, C.; Massi, M. Cyclometalated Iridium(III) Complexes for Life Science. Coord. Chem. Rev. 2018, 363, 71–91. [Google Scholar] [CrossRef]
  4. Shon, J.-H.; Kim, D.; Rathnayake, M.D.; Sittel, S.; Weaver, J.; Teets, T.S. Photoredox Catalysis on Unactivated Substrates with Strongly Reducing Iridium Photosensitizers. Chem. Sci. 2021, 12, 4069–4078. [Google Scholar] [CrossRef]
  5. Min, J.; Zhang, Q.; Sun, W.; Cheng, Y.; Wang, L. Neutral Copper(i) Phosphorescent Complexes from Their Ionic Counterparts with 2-(2′-Quinolyl)Benzimidazole and Phosphine Mixed Ligands. Dalton Trans. 2011, 40, 686–693. [Google Scholar] [CrossRef] [PubMed]
  6. Zhang, Q.; Ding, J.; Cheng, Y.; Wang, L.; Xie, Z.; Jing, X.; Wang, F. Novel Heteroleptic CuI Complexes with Tunable Emission Color for Efficient Phosphorescent Light-Emitting Diodes. Adv. Funct. Mater. 2007, 17, 2983–2990. [Google Scholar] [CrossRef]
  7. Zhang, Q.; Zhou, Q.; Cheng, Y.; Wang, L.; Ma, D.; Jing, X.; Wang, F. Highly Efficient Electroluminescence from Green-Light-Emitting Electrochemical Cells Based on CuI Complexes. Adv. Funct. Mater. 2006, 16, 1203–1208. [Google Scholar] [CrossRef]
  8. Armaroli, N.; Accorsi, G.; Holler, M.; Moudam, O.; Nierengarten, J.-F.; Zhou, Z.; Wegh, R.T.; Welter, R. Highly Luminescent Cu I Complexes for Light-Emitting Electrochemical Cells. Adv. Mater. 2006, 18, 1313–1316. [Google Scholar] [CrossRef]
  9. Safin, D.A.; Mitoraj, M.P.; Robeyns, K.; Filinchuk, Y.; Vande Velde, C.M.L. Luminescent Mononuclear Mixed Ligand Complexes of Copper(i) with 5-Phenyl-2,2′-Bipyridine and Triphenylphosphine. Dalton Trans. 2015, 44, 16824–16832. [Google Scholar] [CrossRef]
  10. Li, G.F.; Zhang, X.Y.; Li, R.F.; Liu, X.F. Synthesis and Properties of Two New Cu(I) Complexes Based on 5,6-Substituted Imidazole-2,9-Dimethyl-1,10-Phenanthroline and Triphenylphosphine. Russ. J. Gen. Chem. 2016, 86, 387–390. [Google Scholar] [CrossRef]
  11. Takeda, H.; Kobayashi, A.; Tsuge, K. Recent Developments of Photoactive Cu(I) and Ag(I) Complexes with Diphosphine and Related Ligands. Coord. Chem. Rev. 2022, 470, 214700. [Google Scholar] [CrossRef]
  12. Yersin, H.; Czerwieniec, R.; Shafikov, M.Z.; Suleymanova, A.F. TADF Material Design: Photophysical Background and Case Studies Focusing on Cu I and Ag I Complexes. ChemPhysChem 2017, 18, 3508–3535. [Google Scholar] [CrossRef] [PubMed]
  13. Shafikov, M.Z.; Czerwieniec, R.; Yersin, H. Ag(i) Complex Design Affording Intense Phosphorescence with a Landmark Lifetime of over 100 Milliseconds. Dalton Trans. 2019, 48, 2802–2806. [Google Scholar] [CrossRef]
  14. Shafikov, M.Z.; Suleymanova, A.F.; Czerwieniec, R.; Yersin, H. Thermally Activated Delayed Fluorescence from Ag(I) Complexes: A Route to 100% Quantum Yield at Unprecedentedly Short Decay Time. Inorg. Chem. 2017, 56, 13274–13285. [Google Scholar] [CrossRef] [PubMed]
  15. Mahoro, G.U.; Fernandez-Cestau, J.; Renaud, J.; Coto, P.B.; Costa, R.D.; Gaillard, S. Recent Advances in Solid-State Lighting Devices Using Transition Metal Complexes Exhibiting Thermally Activated Delayed Fluorescent Emission Mechanism. Adv. Opt. Mater. 2020, 8, 2000260. [Google Scholar] [CrossRef]
  16. Sun, L.-Z.; Kuang, X.-N.; Lin, S.; Zhao, L.; Yu, X.; Li, Z.-F.; Liu, M.; Xin, X.-L.; Yang, Y.-P.; Jin, Q.-H. Nine Heteroleptic Copper(I)/Silver(I) Complexes Prepared from Phosphine and Diimine Ligands: Syntheses, Structures and Terahertz Spectra. Polyhedron 2020, 175, 114177. [Google Scholar] [CrossRef]
  17. Wang, Y.; Kuang, X.-N.; Cui, Y.-Z.; Xin, X.-L.; Han, H.-L.; Liu, M.; Yang, Y.-P.; Jin, Q.-H. Synthesis, Structure, Luminescent Properties, and Photocatalytic Behavior of 0D–3D Silver(I) Complexes Bearing Both Diphosphine Ligands and 1,10-Phenanthroline Derivatives. Polyhedron 2018, 155, 135–143. [Google Scholar] [CrossRef]
  18. Cui, Y.; Yuan, Y.; Han, H.; Li, Z.; Liu, M.; Jin, Q.; Yang, Y.; Zhang, Z. Synthesis, Characterization, and Luminescent Properties of Silver(I) Complexes Based on Diphosphine Ligands and 2,9-Dimethyl-1,10-phenanthroline. Z. Anorg. Allg. Chem. 2016, 642, 953–959. [Google Scholar] [CrossRef]
  19. Brunner, F.; Prescimone, A.; Constable, E.C.; Housecroft, C.E. Positional Isomerism in the N^N Ligand: How Much Difference Does a Methyl Group Make in [Cu(P^P)(N^N)]+ Complexes? Molecules 2020, 25, 2760. [Google Scholar] [CrossRef] [PubMed]
  20. Keller, S.; Alkan-Zambada, M.; Prescimone, A.; Constable, E.C.; Housecroft, C.E. Extended π-Systems in Diimine Ligands in [Cu(P^P)(N^N)][PF6] Complexes: From 2,2′-Bipyridine to 2-(Pyridin-2-Yl)Quinoline. Crystals 2020, 10, 255. [Google Scholar] [CrossRef]
  21. Zhang, L.; Chen, C.; Zhang, Q.; Zhang, H.; Kang, B. μ-1,4-Bis(Diphenylphosphino)Butane-κ2P:P′-Bis[(2,2′-Bipyridyl)Silver(I)] Ditetrafluoroborate. Acta Crystallogr. Sect. E Struct. Rep. Online 2003, 59, m536–m537. [Google Scholar] [CrossRef]
  22. Wang, X.-J.; Gui, L.-C.; Ni, Q.-L.; Liao, Y.-F.; Jiang, X.-F.; Tang, L.-H.; Zhang, Z.; Wu, Q. π-Stacking Induced Complexes with Z-Shape Motifs Featuring a Complementary Approach between Electron-Rich Arene Diamines and Electron-Deficient Aromatic N-Heterocycles. CrystEngComm 2008, 10, 1003. [Google Scholar] [CrossRef]
  23. Keller, S.; Camenzind, T.N.; Abraham, J.; Prescimone, A.; Häussinger, D.; Constable, E.C.; Housecroft, C.E. Self-Assembly of Heteroleptic Dinuclear Silver(i) Complexes Bridged by Bis(Diphenylphosphino)Ethyne. Dalton Trans. 2018, 47, 946–957. [Google Scholar] [CrossRef] [PubMed]
  24. Gui, L.-C.; Ni, Q.-L.; Jiang, X.-F.; Zeng, J.-Q.; Wang, X.-J. [μ- N, N′-Bis(Diphenylphosphinomethyl)Benzene-1,4-Diamine-κ2 P:P′]Bis[(2,2′-Bipyridine-κ2N,N′)Silver(I)] Bis(Perchlorate) Acetone Disolvate. Acta Crystallogr. Sect. E Struct. Rep. Online 2009, 65, m589–m590. [Google Scholar] [CrossRef]
  25. Effendy; Marchetti, F.; Pettinari, C.; Pettinari, R.; Skelton, B.W.; White, A.H. Synthesis and Structural Characterization of Adducts of Silver(I) Oxyanion Salts, AgX (X=ClO4, NO3), with Ph2E(CH2)XEPh2 (‘Dpex’; E=P, As; X=1–4) and Oligodentate Aromatic N-Bases Derivative of 2,2′-Bipyridyl, ‘L’, AgX:Dpex:L (2:1:2). Inorganica Chim. Acta 2007, 360, 1388–1413. [Google Scholar] [CrossRef]
  26. Sun, Z.-Z.; Hu, F.-Z.; Gao, C.-J.; Mou, W.-L.; Wang, G.; Zhu, N.; Pan, X.; Li, Z.-F.; Han, H.-L.; Fu, H.; et al. One-Dimensional Infinite Chain Ag(i) Complex with High Quantum Yield and TADF Property: Prepared by Metal Ion Adjustment. CrystEngComm 2023, 25, 5405–5412. [Google Scholar] [CrossRef]
  27. Kaeser, A.; Delavaux-Nicot, B.; Duhayon, C.; Coppel, Y.; Nierengarten, J.-F. Heteroleptic Silver(I) Complexes Prepared from Phenanthroline and Bis-Phosphine Ligands. Inorg. Chem. 2013, 52, 14343–14354. [Google Scholar] [CrossRef]
  28. Burgos, M.; Crespo, O.; Gimeno, M.C.; Jones, P.G.; Laguna, A. Gold, Silver and Palladium Complexes with the 2,2′-Dipyridylamine Ligand. Eur. J. Inorg. Chem. 2003, 2003, 2170–2174. [Google Scholar] [CrossRef]
  29. Cui, L.-N.; Hu, K.-Y.; Jin, Q.-H.; Li, Z.-F.; Wu, J.-Q.; Zhang, C.-L. Polynuclear Silver(I) Complexes of Triphenylphosphine and 2-Aminopyrimidine: Synthesis, Structural Characterization and Spectroscopic Properties. Polyhedron 2011, 30, 2253–2259. [Google Scholar] [CrossRef]
  30. Khalaji, A.D.; Amirnasr, M.; Aoki, K. Crystal Structures of [Ag(Bpy)(PPh3)]X (1: X = PF6, 2: X = ClO4) Complexes. Anal. Sci. X-ray Struct. Anal. Online 2006, 22, X87–X88. [Google Scholar] [CrossRef]
  31. Penney, M.K.; Potter, C.; Burroughs, M.A.; Klausmeyer, K.K. Silver Coordination Complexes of 2-(Diphenylphosphinomethyl)Aminopyridine with Weakly Interacting Counterions. Polyhedron 2015, 102, 207–215. [Google Scholar] [CrossRef]
  32. Durini, S.; Ardizzoia, G.A.; Therrien, B.; Brenna, S. Tuning the Fluorescence Emission in Mononuclear Heteroleptic Trigonal Silver(i) Complexes. New J. Chem. 2017, 41, 3006–3014. [Google Scholar] [CrossRef]
  33. Bencini, A.; Lippolis, V. 1,10-Phenanthroline: A Versatile Building Block for the Construction of Ligands for Various Purposes. Coord. Chem. Rev. 2010, 254, 2096–2180. [Google Scholar] [CrossRef]
  34. Accorsi, G.; Listorti, A.; Yoosaf, K.; Armaroli, N. 1,10-Phenanthrolines: Versatile Building Blocks for Luminescent Molecules, Materials and Metal Complexes. Chem. Soc. Rev. 2009, 38, 1690. [Google Scholar] [CrossRef]
  35. Alreja, P.; Kaur, N. Recent Advances in 1,10-Phenanthroline Ligands for Chemosensing of Cations and Anions. RSC Adv. 2016, 6, 23169–23217. [Google Scholar] [CrossRef]
  36. Bonaccorso, C.; Cesaretti, A.; Elisei, F.; Mencaroni, L.; Spalletti, A.; Fortuna, C.G. New Styryl Phenanthroline Derivatives as Model D−π−A−π−D Materials for Non-Linear Optics. ChemPhysChem 2018, 19, 1917–1929. [Google Scholar] [CrossRef] [PubMed]
  37. Jędrzejewska, B.; Gordel, M.; Szeremeta, J.; Kaczorowska, M.A.; Józefowicz, M.; Samoć, M. One- and Two-Photon-Induced Isomerization of Styryl Compounds Possessing A-π-A′ Structure. Dye. Pigment. 2016, 132, 237–247. [Google Scholar] [CrossRef]
  38. Jędrzejewska, B.; Ośmiałowski, B.; Zaleśny, R. Application of Spectroscopic and Theoretical Methods in the Studies of Photoisomerization and Photophysical Properties of the Push—Pull Styryl-Benzimidazole Dyes. Photochem. Photobiol. Sci. 2016, 15, 117–128. [Google Scholar] [CrossRef]
  39. Jędrzejewska, B.; Gordel, M.; Szeremeta, J.; Grela, I.; Samoć, M. Photostability of Push-Pull Phenanthroimidazole Derivative upon One- and Two-Photon Excitation. Dye. Pigment. 2017, 136, 150–160. [Google Scholar] [CrossRef]
  40. Mukherjee, S.; Pal, P.; Maity, D.; Baitalik, S. Photophysics and Luminescence Switching Properties of a Series of Photochromic Styrylbenzene-Terpyridine Conjugate: Experimental and DFT/TD-DFT Investigation. J. Photochem. Photobiol. A Chem. 2019, 378, 94–104. [Google Scholar] [CrossRef]
  41. Gordillo, M.A.; Soto-Monsalve, M.; Carmona-Vargas, C.C.; Gutiérrez, G.; D’vries, R.F.; Lehn, J.; Chaur, M.N. Photochemical and Electrochemical Triggered Bis(Hydrazone) Switch. Chem. A Eur. J. 2017, 23, 14872–14882. [Google Scholar] [CrossRef]
  42. Gupta, D.; Gaur, A.K.; Kumar, H.; Singh, S.; Venkataramani, S. Light-Switchable Metal Complexes: Introducing Photoresponsive Behaviour through Azoheteroarenes. ChemPhotoChem 2023, 7, e202300068. [Google Scholar] [CrossRef]
  43. Valora, G.; Bonaccorso, C.; Cesaretti, A.; Fortuna, C.G.; Spalletti, A.; Elisei, F. Metal Complexes with Sterically Demanding Phenanthroline Ligands: A Combined Spectroscopic Study. Dye. Pigment. 2021, 187, 109150. [Google Scholar] [CrossRef]
  44. Glykos, D.; Plakatouras, J.C.; Malandrinos, G. [4,4′-Bis(4-Fluorophenyl)-6,6′-Dimethyl-2,2′-Bipyridine] [Bis (2-(Diphenylphosphino) Phenyl) Ether] Silver(I) Hexafluorophosphate. Molbank 2023, 2023, M1675. [Google Scholar] [CrossRef]
  45. Moudam, O.; Tsipis, A.C.; Kommanaboyina, S.; Horton, P.N.; Coles, S.J. First Light-Emitting Electrochemical Cell with [Ag(i)(N^N)(P^P)] Type Complex. RSC Adv. 2015, 5, 95047–95053. [Google Scholar] [CrossRef]
  46. Wałęsa-Chorab, M.; Patroniak, V.; Kubicki, M.; Kądziołka, G.; Przepiórski, J.; Michalkiewicz, B. Synthesis, Structure, and Photocatalytic Properties of New Dinuclear Helical Complex of Silver(I) Ions. J. Catal. 2012, 291, 1–8. [Google Scholar] [CrossRef]
  47. Osawa, M.; Kawata, I.; Ishii, R.; Igawa, S.; Hashimoto, M.; Hoshino, M. Application of Neutral D10 Coinage Metal Complexes with an Anionic Bidentate Ligand in Delayed Fluorescence-Type Organic Light-Emitting Diodes. J. Mater. Chem. C 2013, 1, 4375. [Google Scholar] [CrossRef]
  48. Liu, C.; Liu, C.; Ren, Z.; Lang, J. Silver(I)-Based Complexes Used as High-Performance Photocatalysts for the Degradation of Organic Dyes in Water. Eur. J. Inorg. Chem. 2019, 2019, 1816–1824. [Google Scholar] [CrossRef]
  49. Wu, J.-Q.; Jin, Q.-H.; Hu, K.-Y.; Zhang, C.-L. (1,10-Phenanthroline-κ2N,N′)(Triphenylphosphine-κP)Silver(I) Trifluoromethanesulfonate. Acta Crystallogr. Sect. E Struct. Rep. Online 2009, 65, m1096–m1097. [Google Scholar] [CrossRef]
  50. Janiak, C. A Critical Account on π–π Stacking in Metal Complexes with Aromatic Nitrogen-Containing Ligands. J. Chem. Soc. Dalton Trans. 2000, 3885–3896. [Google Scholar] [CrossRef]
  51. Thakuria, R.; Nath, N.K.; Saha, B.K. The Nature and Applications of π–π Interactions: A Perspective. Cryst. Growth Des. 2019, 19, 523–528. [Google Scholar] [CrossRef]
  52. Spackman, M.A.; Jayatilaka, D. Hirshfeld Surface Analysis. CrystEngComm 2009, 11, 19–32. [Google Scholar] [CrossRef]
  53. Ishida, H.; Tobita, S.; Hasegawa, Y.; Katoh, R.; Nozaki, K. Recent Advances in Instrumentation for Absolute Emission Quantum Yield Measurements. Coord. Chem. Rev. 2010, 254, 2449–2458. [Google Scholar] [CrossRef]
  54. Bruker. APEX 3. In SAINT, SHELXT; Bruker AXS Inc.: Fitchburg, WI, USA, 2016. [Google Scholar]
  55. Sheldrick, G.M. SADABS; University of Göttingen: Göttingen, Germany, 1996. [Google Scholar]
  56. Sheldrick, G.M. Crystal Structure Refinement with SHELXL. Acta Crystallogr. C Struct. Chem. 2015, 71, 3–8. [Google Scholar] [CrossRef]
  57. Hübschle, C.B.; Sheldrick, G.M.; Dittrich, B. ShelXle: A Qt Graphical User Interface for SHELXL. J. Appl. Crystallogr. 2011, 44, 1281–1284. [Google Scholar] [CrossRef]
  58. Spek, A.L. Structure Validation in Chemical Crystallography. Acta Crystallogr. D Biol. Crystallogr. 2009, 65, 148–155. [Google Scholar] [CrossRef]
  59. Barbour, L.J. X-Seed—A Software Tool for Supramolecular Crystallography. J. Supramol. Chem. 2001, 1, 189–191. [Google Scholar] [CrossRef]
Figure 1. 1H-NMR spectrum (6.5–8.9 ppm) of 1 in CDCl3 (500 MHz, 298 K) recorded using crystals of the compound.
Inorganics 11 00467 g001
Scheme 1. Atom numbering in L (E,E) and (E,Z) isomers for NMR spectroscopic assignments.
Inorganics 11 00467 sch001
Figure 2. 1H-NMR spectrum of a CDCl3 solution of 1 (E,E and E,Z isomers) including peak assignments. Signals belonging to E,E are marked by a circle while E,Z’s are marked by an asterisk. (A): aromatic region (B): methoxy region. See Scheme 1 for atom labeling.
Inorganics 11 00467 g002
Figure 3. 31P{1H}-NMR spectrum of 1 in CDCl3 (101.25 MHz, 298 K).
Inorganics 11 00467 g003
Figure 4. The UV-vis spectrum of complex 1 (on the left) and the emission spectra of complex 1 (black trace) and ligand L (red trace) in dichloromethane (10−5 M) (on the right).
Inorganics 11 00467 g004
Figure 5. The Kubelka–Munk spectrum of complex 1.
Inorganics 11 00467 g005
Figure 6. Normalized emission spectra of complex 1 (λexc = 375 nm, black trace) and ligand L (λexc = 365 nm, red trace) in the solid state.
Inorganics 11 00467 g006
Figure 7. A ‘’ball and stick’’ presentation of compound 1 with a partial labeling scheme.
Inorganics 11 00467 g007
Figure 8. A part of the packing in the crystal structure of the prepared compound showing the dominant weak interactions present: stacking between the phen moieties (A); phenyl embraces between triphenylphosphines’ phenyl rings (B); non-conventional C–H ··· O hydrogen bonds (C). Symmetry operations to generate equivalent atoms: (A), −x + 1, −y + 1, −z; (B), x, y, z − 1; (C): −x + 1, y + 1, −z + 1. A packing diagram of [3,2,0] direction of the unit cell.
Inorganics 11 00467 g008
Figure 9. Hirshfeld surfaces for complex 1 (a): mapped over dnorm (b); shape index (c); and curvedness (d).
Inorganics 11 00467 g009
Table 1. 1H-NMR data (δ,ppm) for L/PPh3, and complex (E,E and E, Z isomers).
H AtomsL (E,E)/PPh3Complex (E, E)Δδ (Ε,Ε) *H AtomsComplex (E,Z)Δδ (Ε,Ζ) *
H(3)7.938.330.4H(3)8.370.44
H(4)8.228.570.35H(4)8.640.42
H(5)7.747.970.23H(5)8.060.32
H(6)7.747.970.23H(6)7.960.22
H(7)8.228.570.35H(7)8.370.15
H(8)7.938.330.4H(8)7.77−0.16
H(a,a’) (Ε)7.777.70−0.07H(a) (E)7.67−0.1
H(b,b’) (Ε)7.627.43−0.19H(b) (E)7.39−0.23
H(a’) (Z)6.34−1.43
H(b’) (Z)6.69−0.93
A, H(2,6)7.687.04−0.64A H(2,6)6.97−0.71
A, H(3,5)6.996.63−0.36A H(3,5)6.56−0.43
Β, H(2,6)7.687.04−0.64B H(2,6)7.07−0.61
Β, H(3,5)6.996.63−0.36B H(3,5)6.77−0.22
A, (-OMe)3.93.84−0.06A H(-OMe)3.81−0.09
Β, (-OΜe)3.93.84−0.06B H(-OMe)3.82−0.08
o,p-PPh37.32–7.387.47, 7.48-o,p-PPh37.47, 7.48-
m-PPh37.39-m-PPh37.39-
* Δδ = δcomplex (E,E or E,Z) − δligand.
Table 2. Selected photophysical data for compound 1 and the ligand in dichloromethane (10−5 M) and in the solid state.
AbsorptionEmission (Solution)Emission (Solid)
λabs (nm)ε−1cm−1)λexc (nm)λem (nm)ΦPL (%)λexc (nm)λem (nm)ΦPL (%)
Ligand36555,00036543363655703.8
137540083754468.63755004.3
Table 3. Selected structural characteristics of [AgL(PPh3)]BF4.
Bond Distances(Å)Bond Angles(°)
Ag(1)-N(1)2.287(2)N(1)-Ag(1)-N(2)73.26(8)
Ag(1)-N(2)2.336(2)N(1)-Ag(1)-P(1)151.34(6)
Ag(1)-P(1)2.3743(7)N(2)-Ag(1)-P(1)134.03(6)
Disclaimer/Publisher’s Note: The statements, opinions and data contained in all publications are solely those of the individual author(s) and contributor(s) and not of MDPI and/or the editor(s). MDPI and/or the editor(s) disclaim responsibility for any injury to people or property resulting from any ideas, methods, instructions or products referred to in the content.

