
Comparative Spectroscopic and Electrochemical Study of V(V)-Substituted Keggin-Type Phosphomolybdates and -Tungstates

Abstract
:1. Introduction
2. Results and Discussion
3. Materials and Methods
3.1. Chemicals
3.2. Experimental
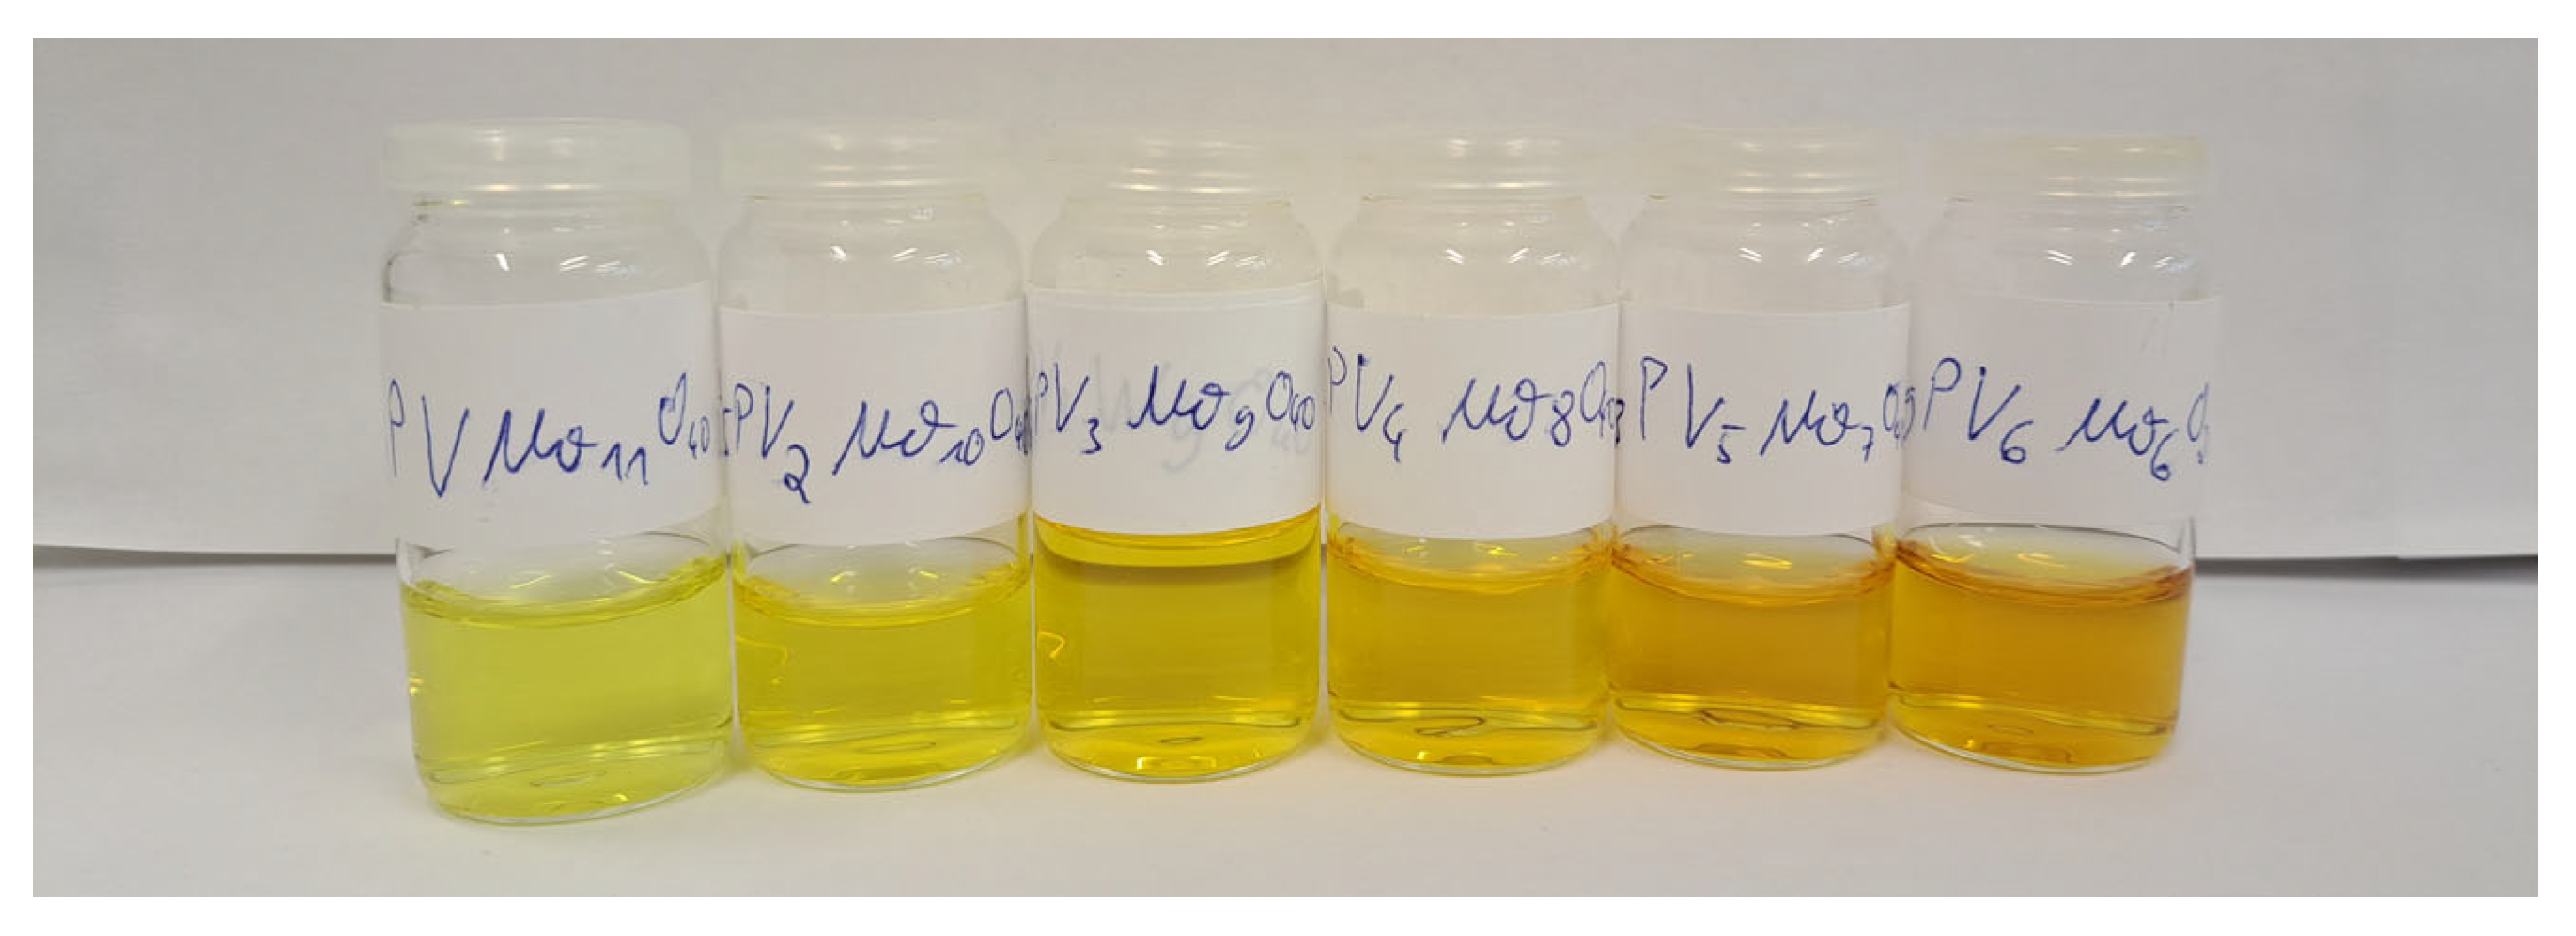
3.3. Synthesis of H3+x [PVxMo12-xO40], according to Odyakov et al. [20,21,22]
3.4. Synthesis of Na9-xHx [PW9O34], according to Domaille et al. [29]
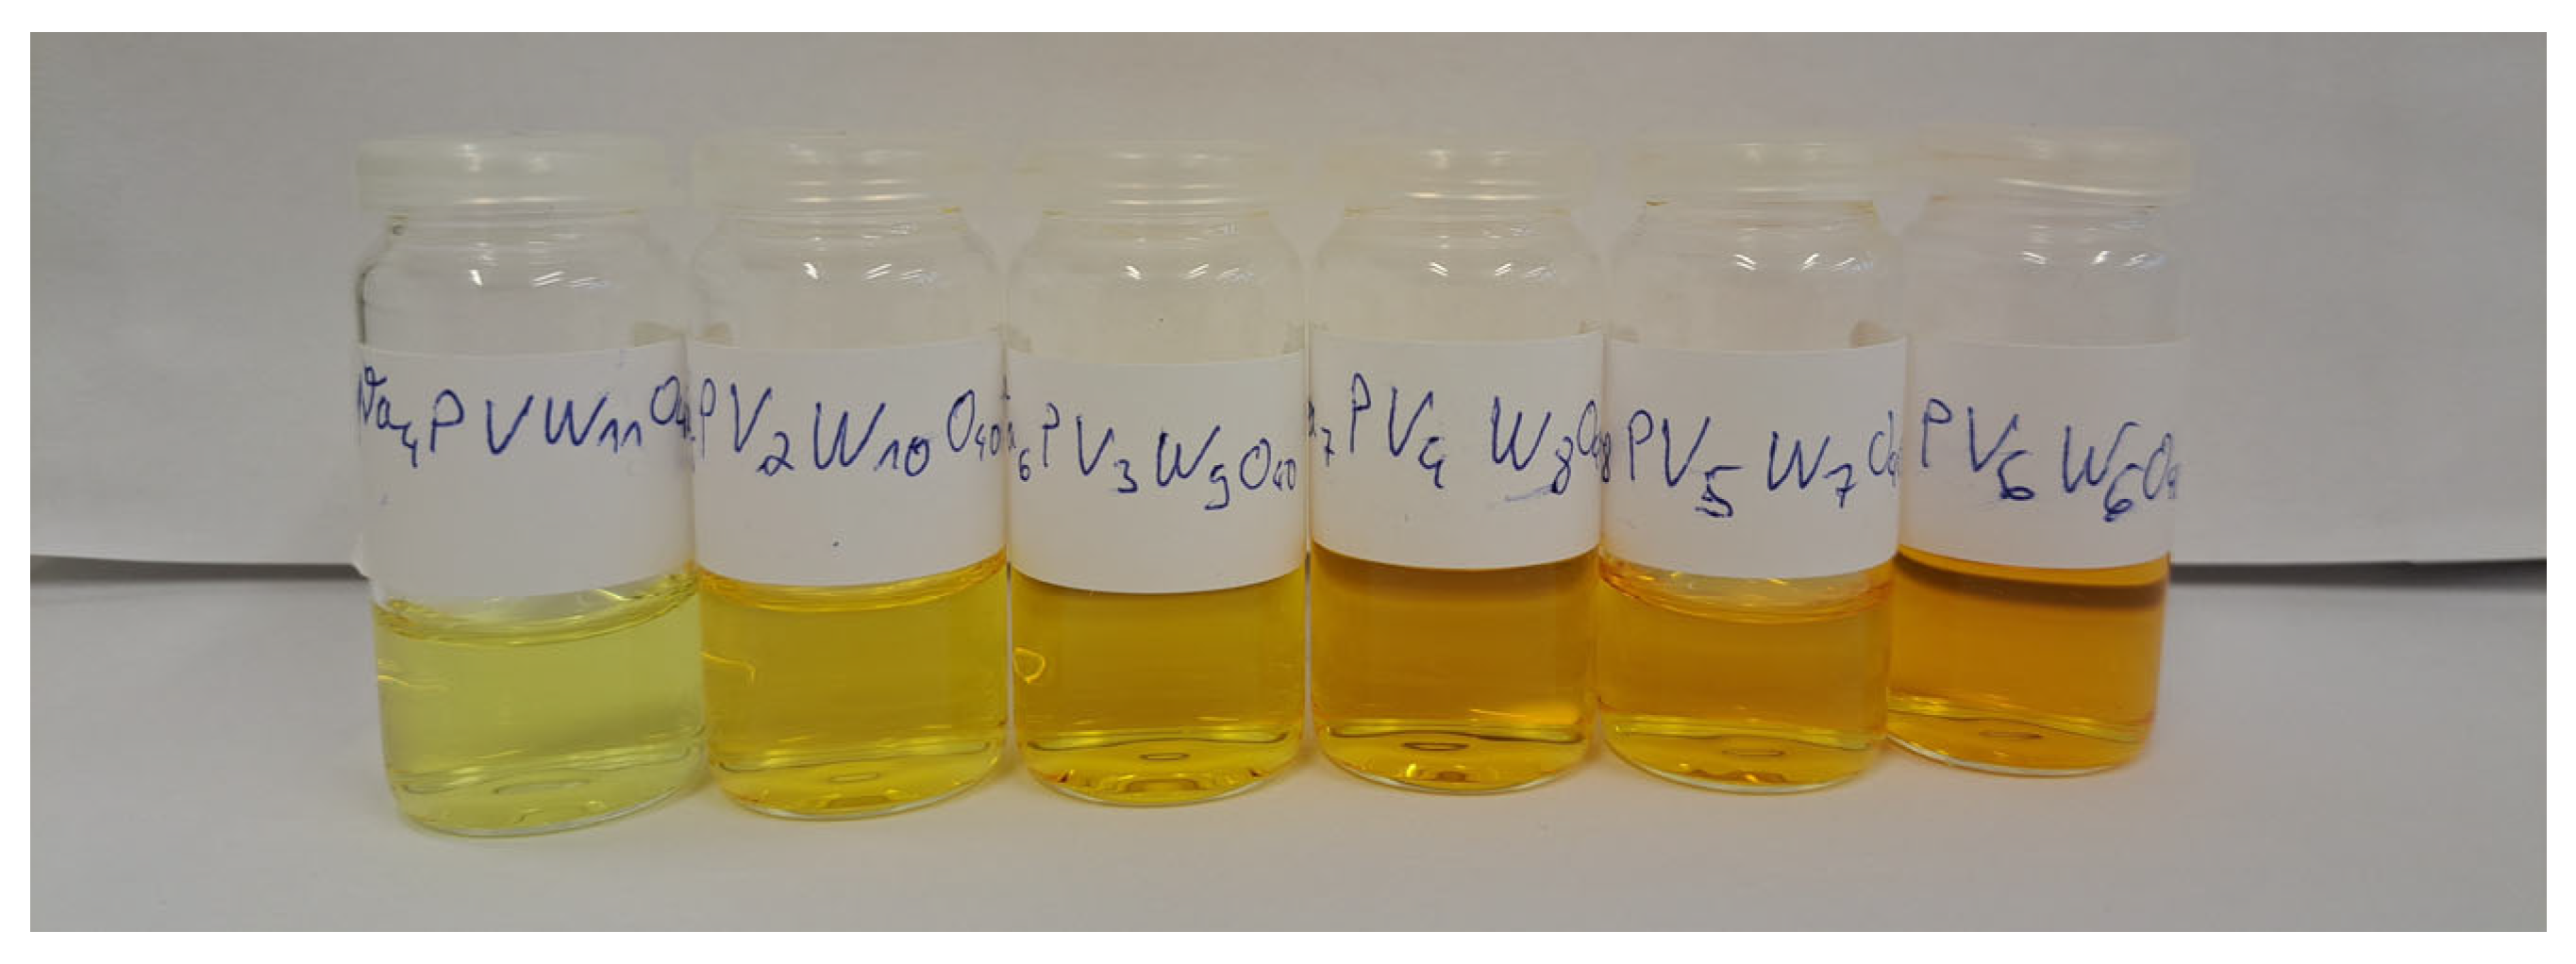
3.5. Synthesis of Na3+x [PVxW12−xO40], with x = 1 to 3, according to Domaille et al. [29]
3.6. Synthesis of NayHz [PVxW12-xO40], with x = 4 to 6, via Self-Assembly, Based on the Procedure of Odyakov et al. [20,21,22]
3.7. Nanofiltration
3.8. Etherate Method
4. Conclusions
Supplementary Materials
Author Contributions
Funding
Data Availability Statement
Acknowledgments
Conflicts of Interest
References
- Reichert, J.; Brunner, B.; Jess, A.; Wasserscheid, P.; Albert, J. Biomass oxidation to formic acid in aqueous media using polyoxometalate catalysts—Boosting FA selectivity by in-situ extraction. Energy Environ. Sci. 2015, 8, 2985–2990. [Google Scholar] [CrossRef]
- Maerten, S.; Kumpidet, C.; Voß, D.; Bukowski, A.; Wasserscheid, P.; Albert, J. Glucose oxidation to formic acid and methyl formate in perfect selectivity. Green Chem. 2020, 22, 4311–4320. [Google Scholar] [CrossRef]
- Albert, J.; Wasserscheid, P. Expanding the scope of biogenic substrates for the selective production of formic acid from water-insoluble and wet waste biomass. Green Chem. 2015, 17, 5164–5171. [Google Scholar] [CrossRef] [Green Version]
- Veith, H.; Voges, M.; Held, C.; Albert, J. Measuring and Predicting the Extraction Behavior of Biogenic Formic Acid in Biphasic Aqueous/Organic Reaction Mixtures. ACS Omega 2017, 2, 8982–8989. [Google Scholar] [CrossRef] [Green Version]
- Albert, J.; Lüders, D.; Bösmann, A.; Guldi, D.M.; Wasserscheid, P. Spectroscopic and electrochemical characterization of heteropoly acids for their optimized application in selective biomass oxidation to formic acid. Green Chem. 2014, 16, 226–237. [Google Scholar] [CrossRef]
- Claußnitzer, J.; Bertleff, B.; Korth, W.; Albert, J.; Wasserscheid, P.; Jess, A. Kinetics of Triphase Extractive Oxidative Desulfurization of Benzothiophene with Molecular Oxygen Catalyzed by HPA-5. Chem. Eng. Technol. 2020, 43, 465–475. [Google Scholar] [CrossRef]
- Bertleff, B.; Claußnitzer, J.; Korth, W.; Wasserscheid, P.; Jess, A.; Albert, J. Catalyst Activation and Influence of the Oil Matrix on Extractive Oxidative Desulfurization Using Aqueous Polyoxometalate Solutions and Molecular Oxygen. Energy Fuels 2018, 32, 8683–8688. [Google Scholar] [CrossRef]
- Bertleff, B.; Goebel, R.; Claußnitzer, J.; Korth, W.; Skiborowski, M.; Wasserscheid, P.; Jess, A.; Albert, J. Investigations on Catalyst Stability and Product Isolation in the Extractive Oxidative Desulfurization of Fuels Using Polyoxometalates and Molecular Oxygen. ChemCatChem 2018, 10, 4602–4609. [Google Scholar] [CrossRef]
- Bertleff, B.; Claußnitzer, J.; Korth, W.; Wasserscheid, P.; Jess, A.; Albert, J. Extraction Coupled Oxidative Desulfurization of Fuels to Sulfate and Water-Soluble Sulfur Compounds Using Polyoxometalate Catalysts and Molecular Oxygen. ACS Sustain. Chem. Eng. 2017, 5, 4110–4118. [Google Scholar] [CrossRef]
- Gumerova, N.I.; Al-Sayed, E.; Krivosudský, L.; Ĉipĉić-Paljetak, H.; Verbanac, D.; Rompel, A. Antibacterial activity of polyoxometalates against Moraxella catarrhalis. Front. Chem. 2018, 6, 336. [Google Scholar] [CrossRef] [Green Version]
- Bijelic, A.; Aureliano, M.; Rompel, A. The antibacterial activity of polyoxometalates: Structures, antibiotic effects and future perspectives. Chem. Commun. 2018, 54, 1153–1169. [Google Scholar] [CrossRef] [Green Version]
- Čolović, M.B.; Lacković, M.; Lalatović, J.; Mougharbel, A.S.; Kortz, U.; Krstić, D.Z. Polyoxometalates in Biomedicine: Update and Overview. Curr. Med. Chem. 2019, 27, 362–379. [Google Scholar] [CrossRef]
- Shigeta, S.; Mori, S.; Kodama, E.; Kodama, J.; Takahashi, K.; Yamase, T. Broad spectrum anti-RNA virus activities of titanium and vanadium substituted polyoxotungstates. Antiviral Res. 2003, 58, 265–271. [Google Scholar] [CrossRef]
- Yamase, T. Anti-tumor, -viral, and -bacterial activities of polyoxometalates for realizing an inorganic drug. J. Mater. Chem. 2005, 15, 4773. [Google Scholar] [CrossRef]
- Tajima, Y.; Nagasawa, Z.; Tadano, J. A Factor Found in Aged Tungstate Solution Enhanced the Antibacterial Effect of β-Lactams on Methicillin-Resistant Staphylococcus aureus. Microbiol. Immunol. 1993, 37, 695–703. [Google Scholar] [CrossRef] [PubMed]
- Shigeta, S.; Mori, S.; Yamase, T.; Yamamoto, N.; Yamamoto, N. Anti-RNA virus activity of polyoxometalates. Biomed. Pharmacother. 2006, 60, 211–219. [Google Scholar] [CrossRef] [PubMed]
- Chen, L.; San, K.A.; Turo, M.J.; Gembicky, M.; Fereidouni, S.; Kalaj, M.; Schimpf, A.M. Tunable Metal Oxide Frameworks via Coordination Assembly of Preyssler-Type Molecular Clusters. J. Am. Chem. Soc. 2019, 141, 20261–20268. [Google Scholar] [CrossRef] [PubMed]
- Chen, L.; Turo, M.J.; Gembicky, M.; Reinicke, R.A.; Schimpf, A.M. Cation-Controlled Assembly of Polyoxotungstate-Based Coordination Networks. Angew. Chem. Int. Ed. 2020, 59, 16609–16615. [Google Scholar] [CrossRef]
- Long, D.-L.; Burkholder, E.; Cronin, L. Polyoxometalate clusters, nanostructures and materials: From self assembly to designer materials and devices. Chem. Soc. Rev. 2007, 36, 105–121. [Google Scholar] [CrossRef]
- Odyakov, V.F.; Zhizhina, E.G.; Maksimovskaya, R.I. Synthesis of molybdovanadophosphoric heteropoly acid solutions having modified composition. Appl. Catal. A Gen. 2008, 342, 126–130. [Google Scholar] [CrossRef]
- Odyakov, V.F.; Zhizhina, E.G. New process for preparing aqueous solutions of Mo-V-phosphoric heteropoly acids. Russ. J. Inorg. Chem. 2009, 54, 361–367. [Google Scholar] [CrossRef]
- Odyakov, V.F.; Zhizhina, E.G. A novel method of the synthesis of molybdovanadophosphoric heteropoly acid solutions. React. Kinet. Catal. Lett. 2008, 95, 21–28. [Google Scholar] [CrossRef]
- Raabe, J.-C.; Albert, J.; Poller, M.J. Spectroscopic, Crystallographic, and Electrochemical Study of Different Manganese(II)-Substituted Keggin-Type Phosphomolybdates. Chem.-A Eur. J. 2022, 28, e202201084. [Google Scholar] [CrossRef]
- Abbessi, M.; Contant, R.; Thouvenot, R.; Hervé, G. Dawson Type Heteropolyanions. 1. Multinuclear (31P, 51V, 183W) NMR Structural Investigations of Octadeca(molybdotungstovanado)diphosphates α-1,2,3-[P2MM’2W15O62]n- (M, M’ = Mo, V, W): Syntheses of New Related Compounds. Inorg. Chem. 1991, 30, 1695–1702. [Google Scholar] [CrossRef]
- Patel, A.; Narkhede, N.; Singh, S.; Pathan, S. Keggin-type lacunary and transition metal substituted polyoxometalates as heterogeneous catalysts: A recent progress. Catal. Rev. 2016, 58, 337–370. [Google Scholar] [CrossRef]
- Himeno, S.; Takamoto, M.; Ueda, T. Synthesis, characterisation and voltammetric study of a β-Keggin-type [PW12O40]3− complex. J. Electroanal. Chem. 1999, 465, 129–135. [Google Scholar] [CrossRef]
- Knoth, W.H.; Domaille, P.J.; Farlee, R.D. Anions of the type (RMOH2)3W18P2O689- and [H2OCo]3W18P2O6812-. A reinvestigation of “B,.beta.-W9PO349-. Organometallics 1985, 4, 62–68. [Google Scholar] [CrossRef]
- Massart, R.; Contant, R.; Fruchart, J.M.; Ciabrini, J.P.; Fournier, M. Phosphorus-31 NMR studies on molybdic and tungstic heteropolyanions. Correlation between structure and chemical shift. Inorg. Chem. 1977, 16, 2916–2921. [Google Scholar] [CrossRef]
- Domaille, P.J.; Watunya, G. Synthesis and tungsten-183 NMR characterization of vanadium-substituted polyoxometalates based on B-type tungstophosphate PW9O349-precursors. Inorg. Chem. 1986, 25, 1239–1242. [Google Scholar] [CrossRef]
- Ginsberg, A.P. (Ed.) Vanadium (V) substituted dodecatungstophosphates. In Inorganic Synthesis; John Wiley & Sons, Ltd.: Hoboken, NJ, USA, 1990; Volume 27. [Google Scholar]
- Tsigdinos, G.A.; Hallada, C.J. Molybdovanadophosphoric Acids and Their Salts. I. Investigation of Methods of Preparation and Characterization. Inorg. Chem. 1968, 7, 437–441. [Google Scholar] [CrossRef]
- Bridgeman, A.J. Computational Study of the Vibrational Spectra of α- and β-Keggin Polyoxometalates. Chem.-A Eur. J. 2004, 10, 2935–2941. [Google Scholar] [CrossRef] [PubMed]
- Lee, J.K.; Melsheimer, J.; Berndt, S.; Mestl, G.; Schlögl, R.; Köhler, K. Transient responses of the local electronic and geometric structures of vanado-molybdo-phoshate catalysts H3+nPVnMo12−nO40 in selective oxidation. Appl. Catal. A Gen. 2001, 214, 125–148. [Google Scholar] [CrossRef]
- Xu, M.X.; Lin, S.; Xu, L.-M.; Zhen, S.-L. Crystal structure and properties of H3[PMo12O40] · 3 C2H6O. Transit. Met. Chem. 2004, 29, 332–335. [Google Scholar] [CrossRef]
- Poller, M.J.; Bönisch, S.; Bertleff, B.; Raabe, J.; Görling, A.; Albert, J. Elucidating activating and deactivating effects of carboxylic acids on polyoxometalate-catalysed three-phase liquid-liquid-gas reactions. Chem. Eng. Sci. 2022, 264, 118143. [Google Scholar] [CrossRef]
- Pope, M.T.; Scully, T.F. Geometrical Isomerism Arising from Partial Substitution of Metal Atoms in Isopoly and Heteropoly Complexes. Possibilities for the Keggin Structure. Inorg. Chem. 1975, 14, 953–954. [Google Scholar] [CrossRef]
- Pettersson, L.; Andersson, I.; Grate, J.H.; Selling, A. Multicomponent Polyanions. 46. Characterization of the Isomeric Keggin Decamolybdodivanadophosphate Ions In Aqueous Solution by 31P and 51V NMR. Inorg. Chem. 1994, 33, 982–993. [Google Scholar] [CrossRef]
- Selling, A.; Andersson, I.; Grate, J.H.; Pettersson, L. A Potentiometric and (31P, 51V) NMR Study of the Aqueous Molybdovanadophosphate System. Eur. J. Inorg. Chem. 2000, 2000, 1509–1521. [Google Scholar] [CrossRef]
- Weinstock, I.A.; Cowan, J.J.; Barbuzzi, E.M.G.; Zeng, H.; Hill, C.L. Equilibria between α and β Isomers of Keggin Heteropolytungstates. J. Am. Chem. Soc. 1999, 121, 4608–4617. [Google Scholar] [CrossRef]
- Sundaram, K.M.; Neiwert, W.A.; Hill, C.L.; Weinstock, I.A. Relative Energies of α and β Isomers of Keggin Dodecatungstogallate. Inorg. Chem. 2006, 45, 958–960. [Google Scholar] [CrossRef]
- Neiwert, W.A.; Cowan, J.J.; Hardcastle, K.I.; Hill, C.L.; Weinstock, I.A. Stability and Structure in α- and β-Keggin Heteropolytungstates, [Xn+W12O40](8-n)-, X = p-Block Cation. Inorg. Chem. 2002, 41, 6950–6952. [Google Scholar] [CrossRef]
- Himeno, S.; Takamoto, M.; Ueda, T. Formation of α- and β-Keggin-Type [PW12O40]3− Complexes in Aqueous Media. Bull. Chem. Soc. Jpn. 2005, 78, 1463–1468. [Google Scholar] [CrossRef]
- Evtuguin, D.V.; Neto, C.P.; Rocha, J.; de Jesus, J.D.P. Oxidative delignification in the presence of molybdovanadophosphate heteropolyanions: Mechanism and kinetic studies. Appl. Catal. A Gen. 1998, 167, 123–139. [Google Scholar] [CrossRef]
- Barteau, K.P.; Lyons, J.E.; Song, I.K.; Barteau, M.A. UV-visible spectroscopy as a probe of heteropolyacid redox properties: Application to liquid phase oxidations. Top. Catal. 2006, 41, 55–62. [Google Scholar] [CrossRef]
- Song, I.K.; Kim, H.S.; Chun, M.S. On the reduction potential of cation-exchanged heteropolyacids (HPAs). Korean J. Chem. Eng. 2003, 20, 844–849. [Google Scholar] [CrossRef]
- Yamase, T. Photo- and electrochromism of polyoxometalates and related materials. Chem. Rev. 1998, 98, 307–325. [Google Scholar] [CrossRef]
- Salavati, H.; Rasouli, N. Synthesis and characterization of supported heteropolymolybdate nanoparticles between silicate layers of Bentonite with enhanced catalytic activity for epoxidation of alkenes. Mater. Res. Bull. 2011, 46, 1853–1859. [Google Scholar] [CrossRef]
- Raj, N.K.K.; Ramaswamy, A.V.; Manikandan, P. Oxidation of norbornene over vanadium-substituted phosphomolybdic acid catalysts and spectroscopic investigations. J. Mol. Catal. A Chem. 2005, 227, 37–45. [Google Scholar] [CrossRef]
- Sadakane, M.; Steckhan, E. Electrochemical Properties of Polyoxometalates as Electrocatalysts. Chem. Rev. 1998, 98, 219–238. [Google Scholar] [CrossRef]
- Hwang, D.Y.; Ha, Y.S.; Kim, S. Electrode-Assisted Wacker Process: Phosphomolybdate-Mediated Oxidation of 1-Butene to Methyl Ethyl Ketone. Bull. Korean Chem. Soc. 2001, 22, 441–442. [Google Scholar]
- Ueda, T. Electrochemistry of Polyoxometalates: From Fundamental Aspects to Applications. ChemElectroChem 2018, 5, 823–838. [Google Scholar] [CrossRef]
- Esser, T.; Huber, M.; Voß, D.; Albert, J. Development of an efficient downstream process for product separation and catalyst recycling of a homogeneous polyoxometalate catalyst by means of nanofiltration membranes and design of experiments. Chem. Eng. Res. Des. 2022, 185, 37–50. [Google Scholar] [CrossRef]
- Dolomanov, O.V.; Bourhis, L.J.; Gildea, R.J.; Howard, J.A.; Puschmann, H. OLEX2: A complete structure solution, refinement and analysis program. J. Appl. Crystallogr. 2009, 42, 339–341. [Google Scholar] [CrossRef]
- SHELX. Available online: https://www.noah-itn.eu/wp-content/uploads/2019/03/shelx-manual.pdf (accessed on 22 February 2023).
- Sheldrick, G.M. A short history of SHELX. Acta Crystallogr. Sec. A: Found. Crystallogr. 2008, 64, 112–122. [Google Scholar] [CrossRef] [Green Version]
- User Guide to Crystal Structure Refinement with SHELXL. 2008.
- Hübschle, C.B.; Sheldrick, G.M.; Dittrich, B. ShelXle: A Qt graphical user interface for SHELXL. J. Appl. Crystallogr. 2011, 44, 1281–1284. [Google Scholar] [CrossRef] [PubMed] [Green Version]
- Available online: https://digital-library.theiet.org/content/journals/10.1049/esn.1987.0025?fmt=text (accessed on 22 February 2023).
- Spek, A.L.J. Single-crystal structure validation with the program PLATON. J. Appl. Crystallogr. 2003, 36, 7–13. [Google Scholar] [CrossRef] [Green Version]
- Spek, A.L. PLATON SQUEEZE: A tool for the calculation of the disordered solvent contribution to the calculated structure factors. Acta Crystallogr. Sec. C: Struct. Chem. 2015, 71, 9–18. [Google Scholar] [CrossRef] [PubMed] [Green Version]


| Compound | Molecular Composition | Element Ratio | Hydration Water [mol/mol-POM] |
|---|---|---|---|
| HPVMo | H4 [PVMo11O40] | P/V/Mo 1.23 a/0.97/11 | 7 |
| HPVW | H4 [PVW11O40] | Na/P/V/W 0/1.08/1.07/11 b | 18 |
| NaPVW | Na4 [PVW11O40] | Na/P/V/W 4.05/1.15 b/1.18 b/11 b | 9 |
| HPV2Mo | H5 [PV2Mo10O40] | P/V/Mo 1.28 a/2.01/10 | 9 |
| HPV2W | H5 [PV2W10O40] | Na/P/V/W 0/1.02/1.78/10 b | 15 |
| NaPV2W | Na5 [PV2W10O40] | Na/P/V/W 6.52 b/1.21 b/2.31 b/10 b | 14 |
| HPV3Mo | H6 [PV3Mo9O40] | P/V/Mo 1.10 a/3.03/9 | 15 |
| NaPV3W | Na6 [PV3W9O40] | Na/P/V/W 7.12 b/1.17 b/3.32 b/9 b | 13 |
| HPV4Mo | H7 [PV4Mo8O40] | P/V/Mo 1.41 a/4.03/8 | 23 |
| NaPV4W | Na7 [PVW8O40] | Na/P/V/W 6.62/1.17 b/4.11 b/8 b | 11 |
| HPV5Mo | H8 [PV5Mo7O40] | P/V/Mo 1.21 a/5.02/7 | 9 |
| NaPV5W | Na8 [PV5W7O40] | Na/P/V/W 6.79/1.10 b/5.13 b/7 b | 11 |
| HPV6Mo | H9 [PV6Mo6O40] | P/V/Mo 1.28 a/6.11/6 | 11 |
| NaPV6W | Na9 [PV6W6O40] | Na/P/V/W 6.71/1.05/6.15 b/6 b | 13 |
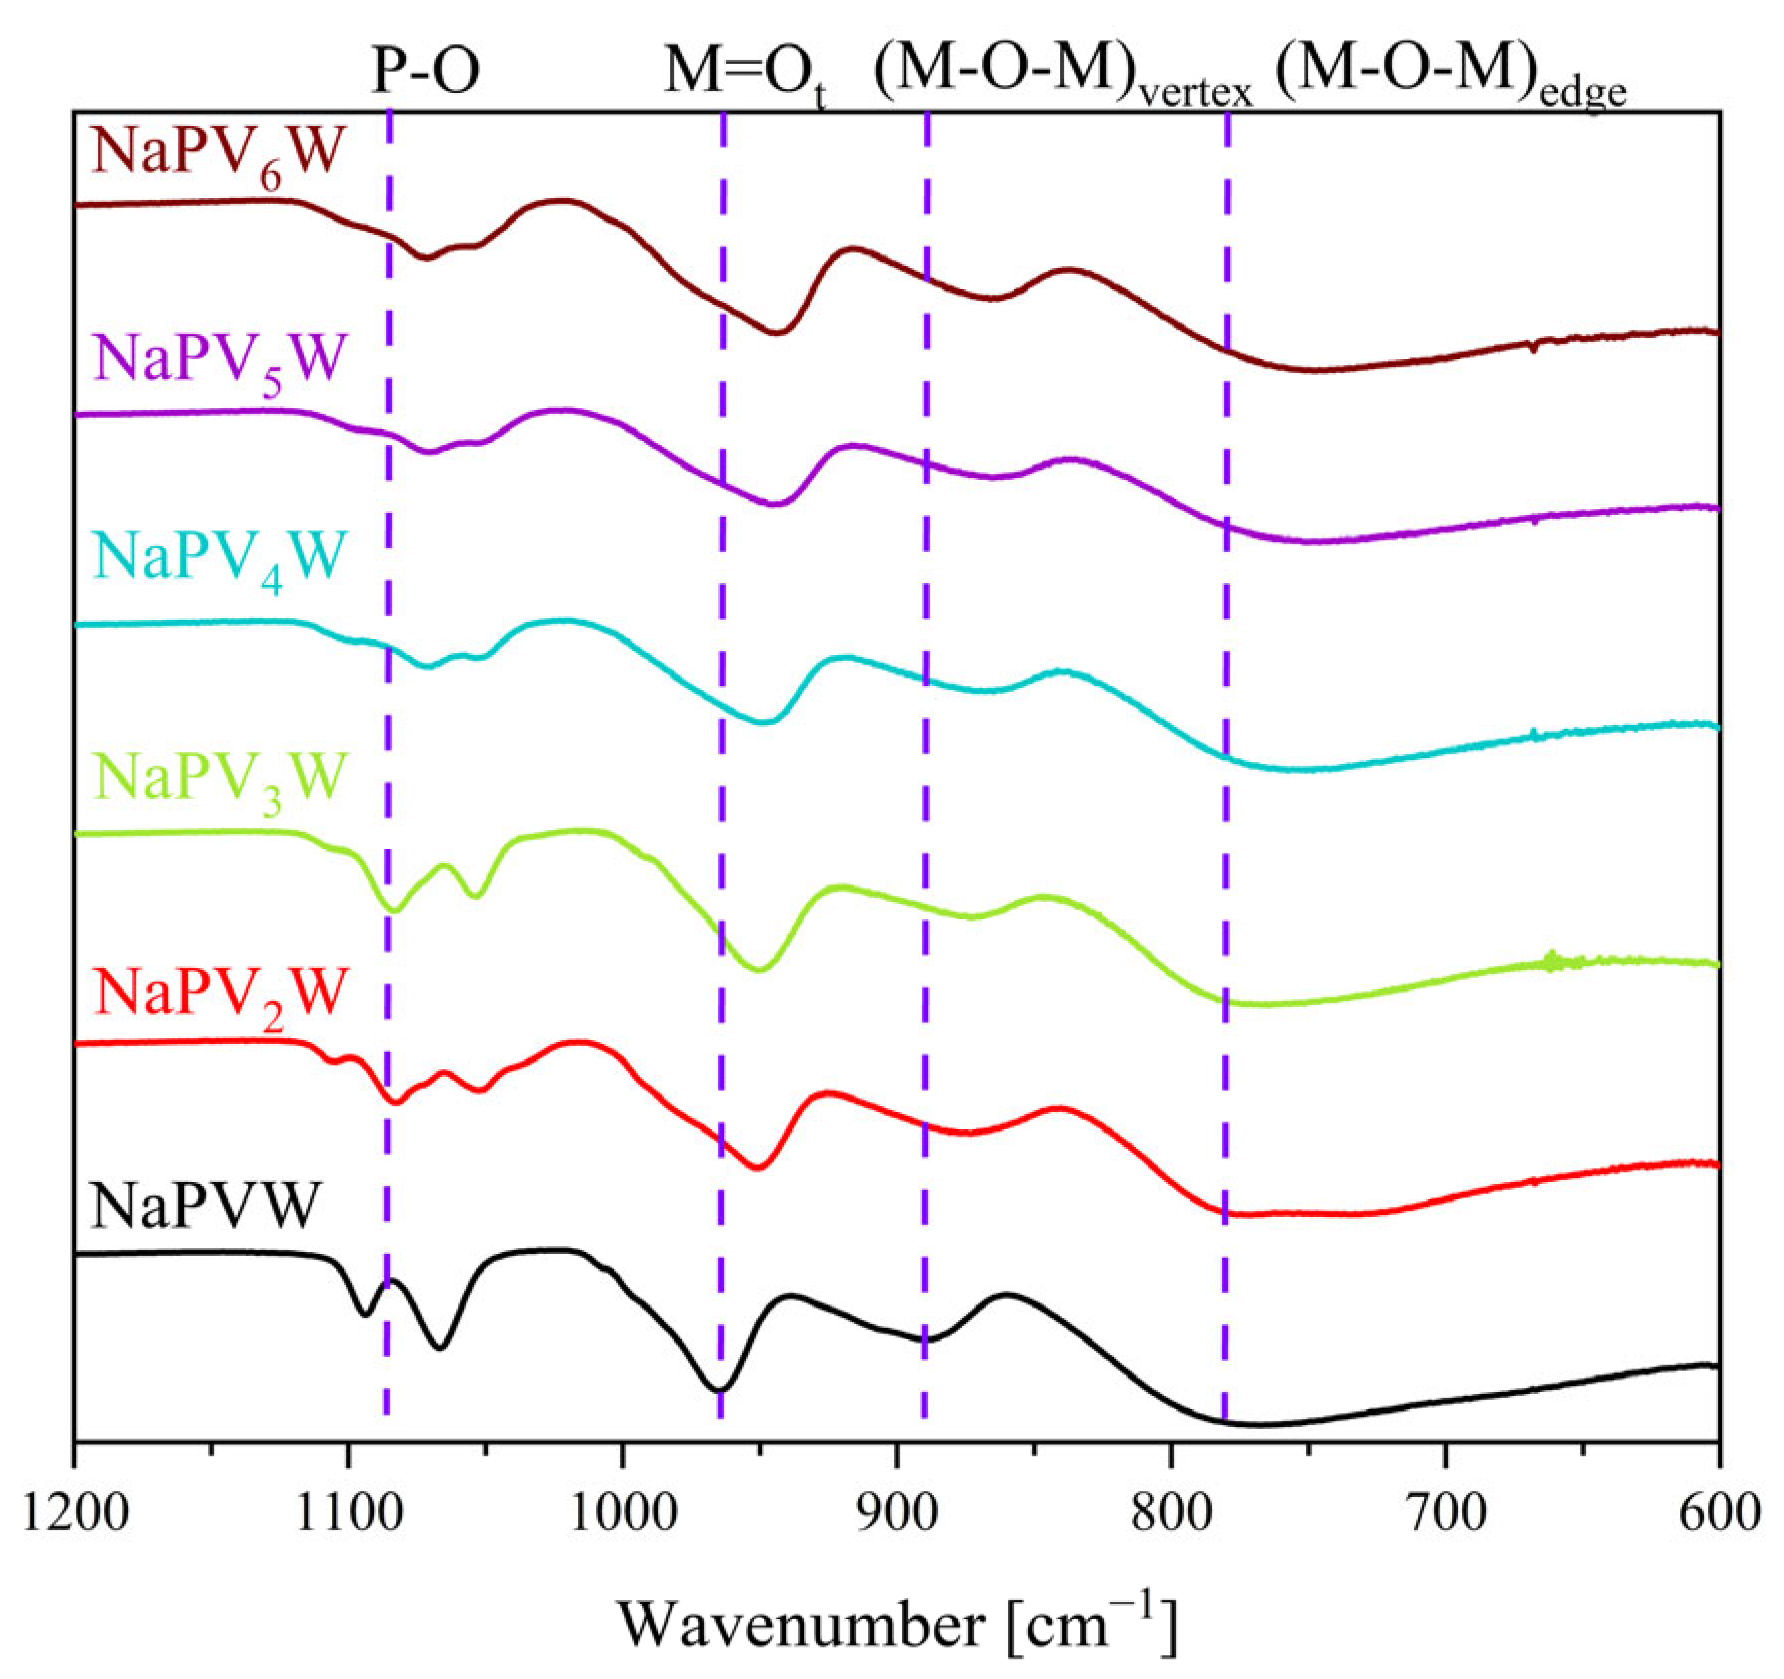
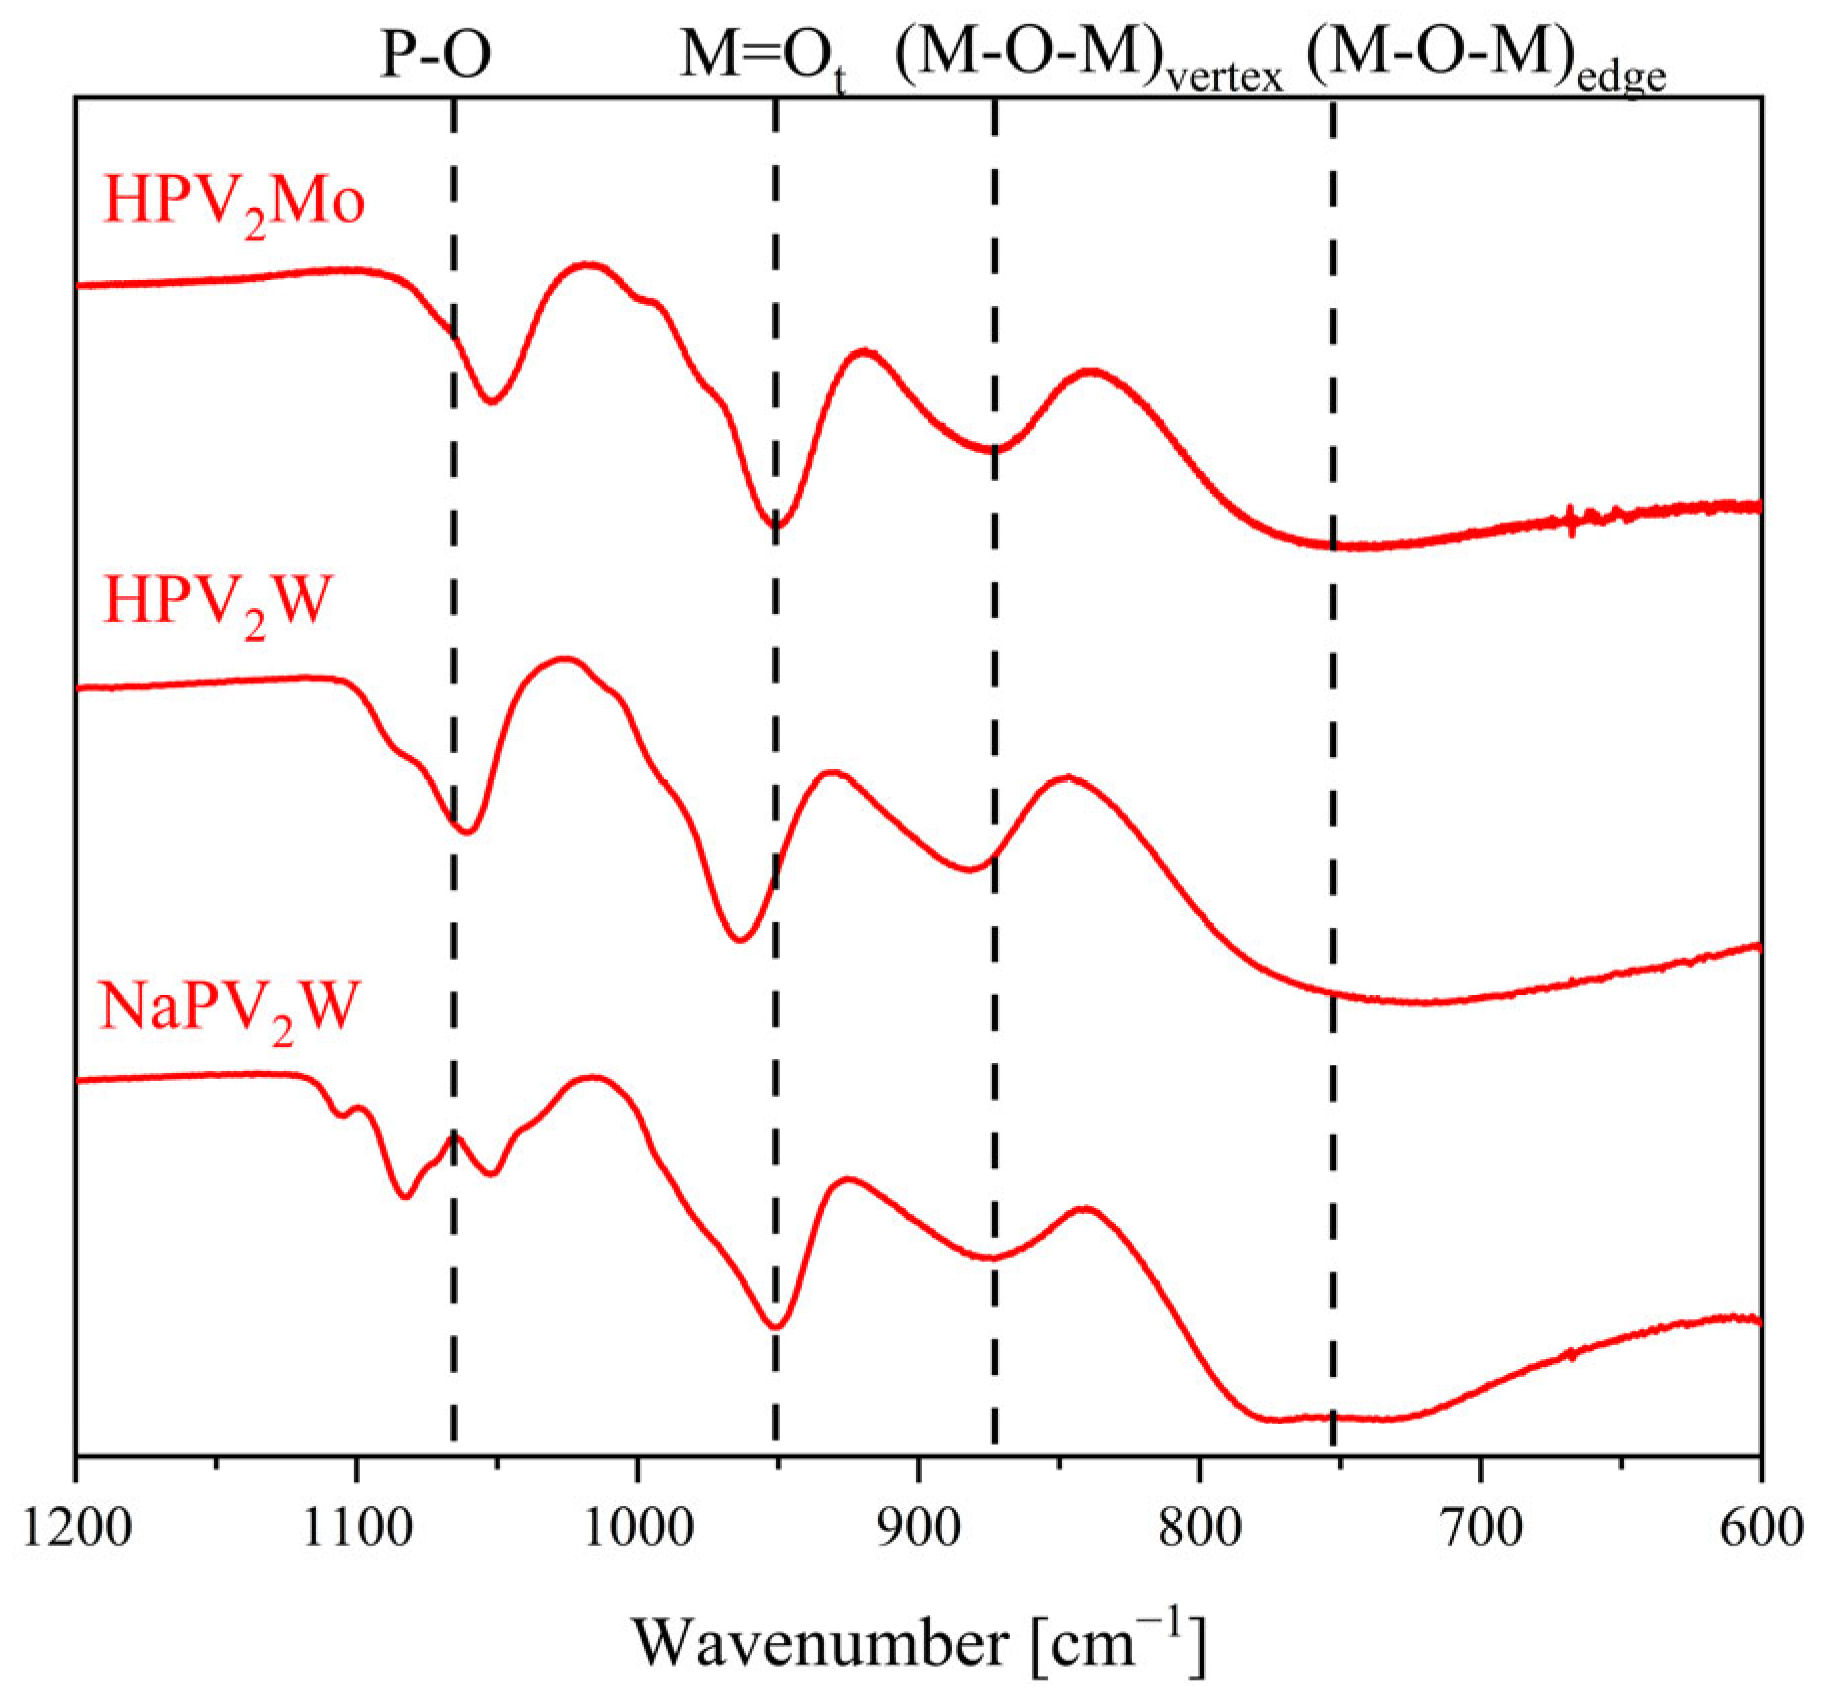
| POM/Vibration Mode | P–O | M = Ot | (M–O–M)vertex | (M–O–M)edge |
|---|---|---|---|---|
| HPMo | 1059 | 962 | 877 | 744 |
| HPW | 1073 | 973 | 904 | 756 |
| NaPVW | 1094, 1066 | 965 | 890 | 764 |
| HPVW | 1070 | 959 | 876 | 735 |
| HPVMo | 1055 | 955 | 872 | 729 |
| NaPV2W | 1083, 1054 | 952 | 875 | 773 |
| HPV2W | 1061 | 964 | 884 | 724 |
| HPV2Mo | 1054 | 955 | 872 | 729 |
| NaPV3W | 1084, 1054 | 950 | 876 | 765 |
| HPV3Mo | 1053 | 954 | 877 | 730 |
| NaPV4W | 1072, 1053 | 948 | 868 | 756 |
| HPV4Mo | 1048 | 951 | 871 | 720 |
| NaPV5W | 1070, 1052 | 945 | 865 | 751 |
| HPV5Mo | 1047 | 949 | 868 | 719 |
| NaPV6W | 1071, 1059 | 944 | 868 | 748 |
| HPV6Mo | 1051 | 949 | 874 | 710 |
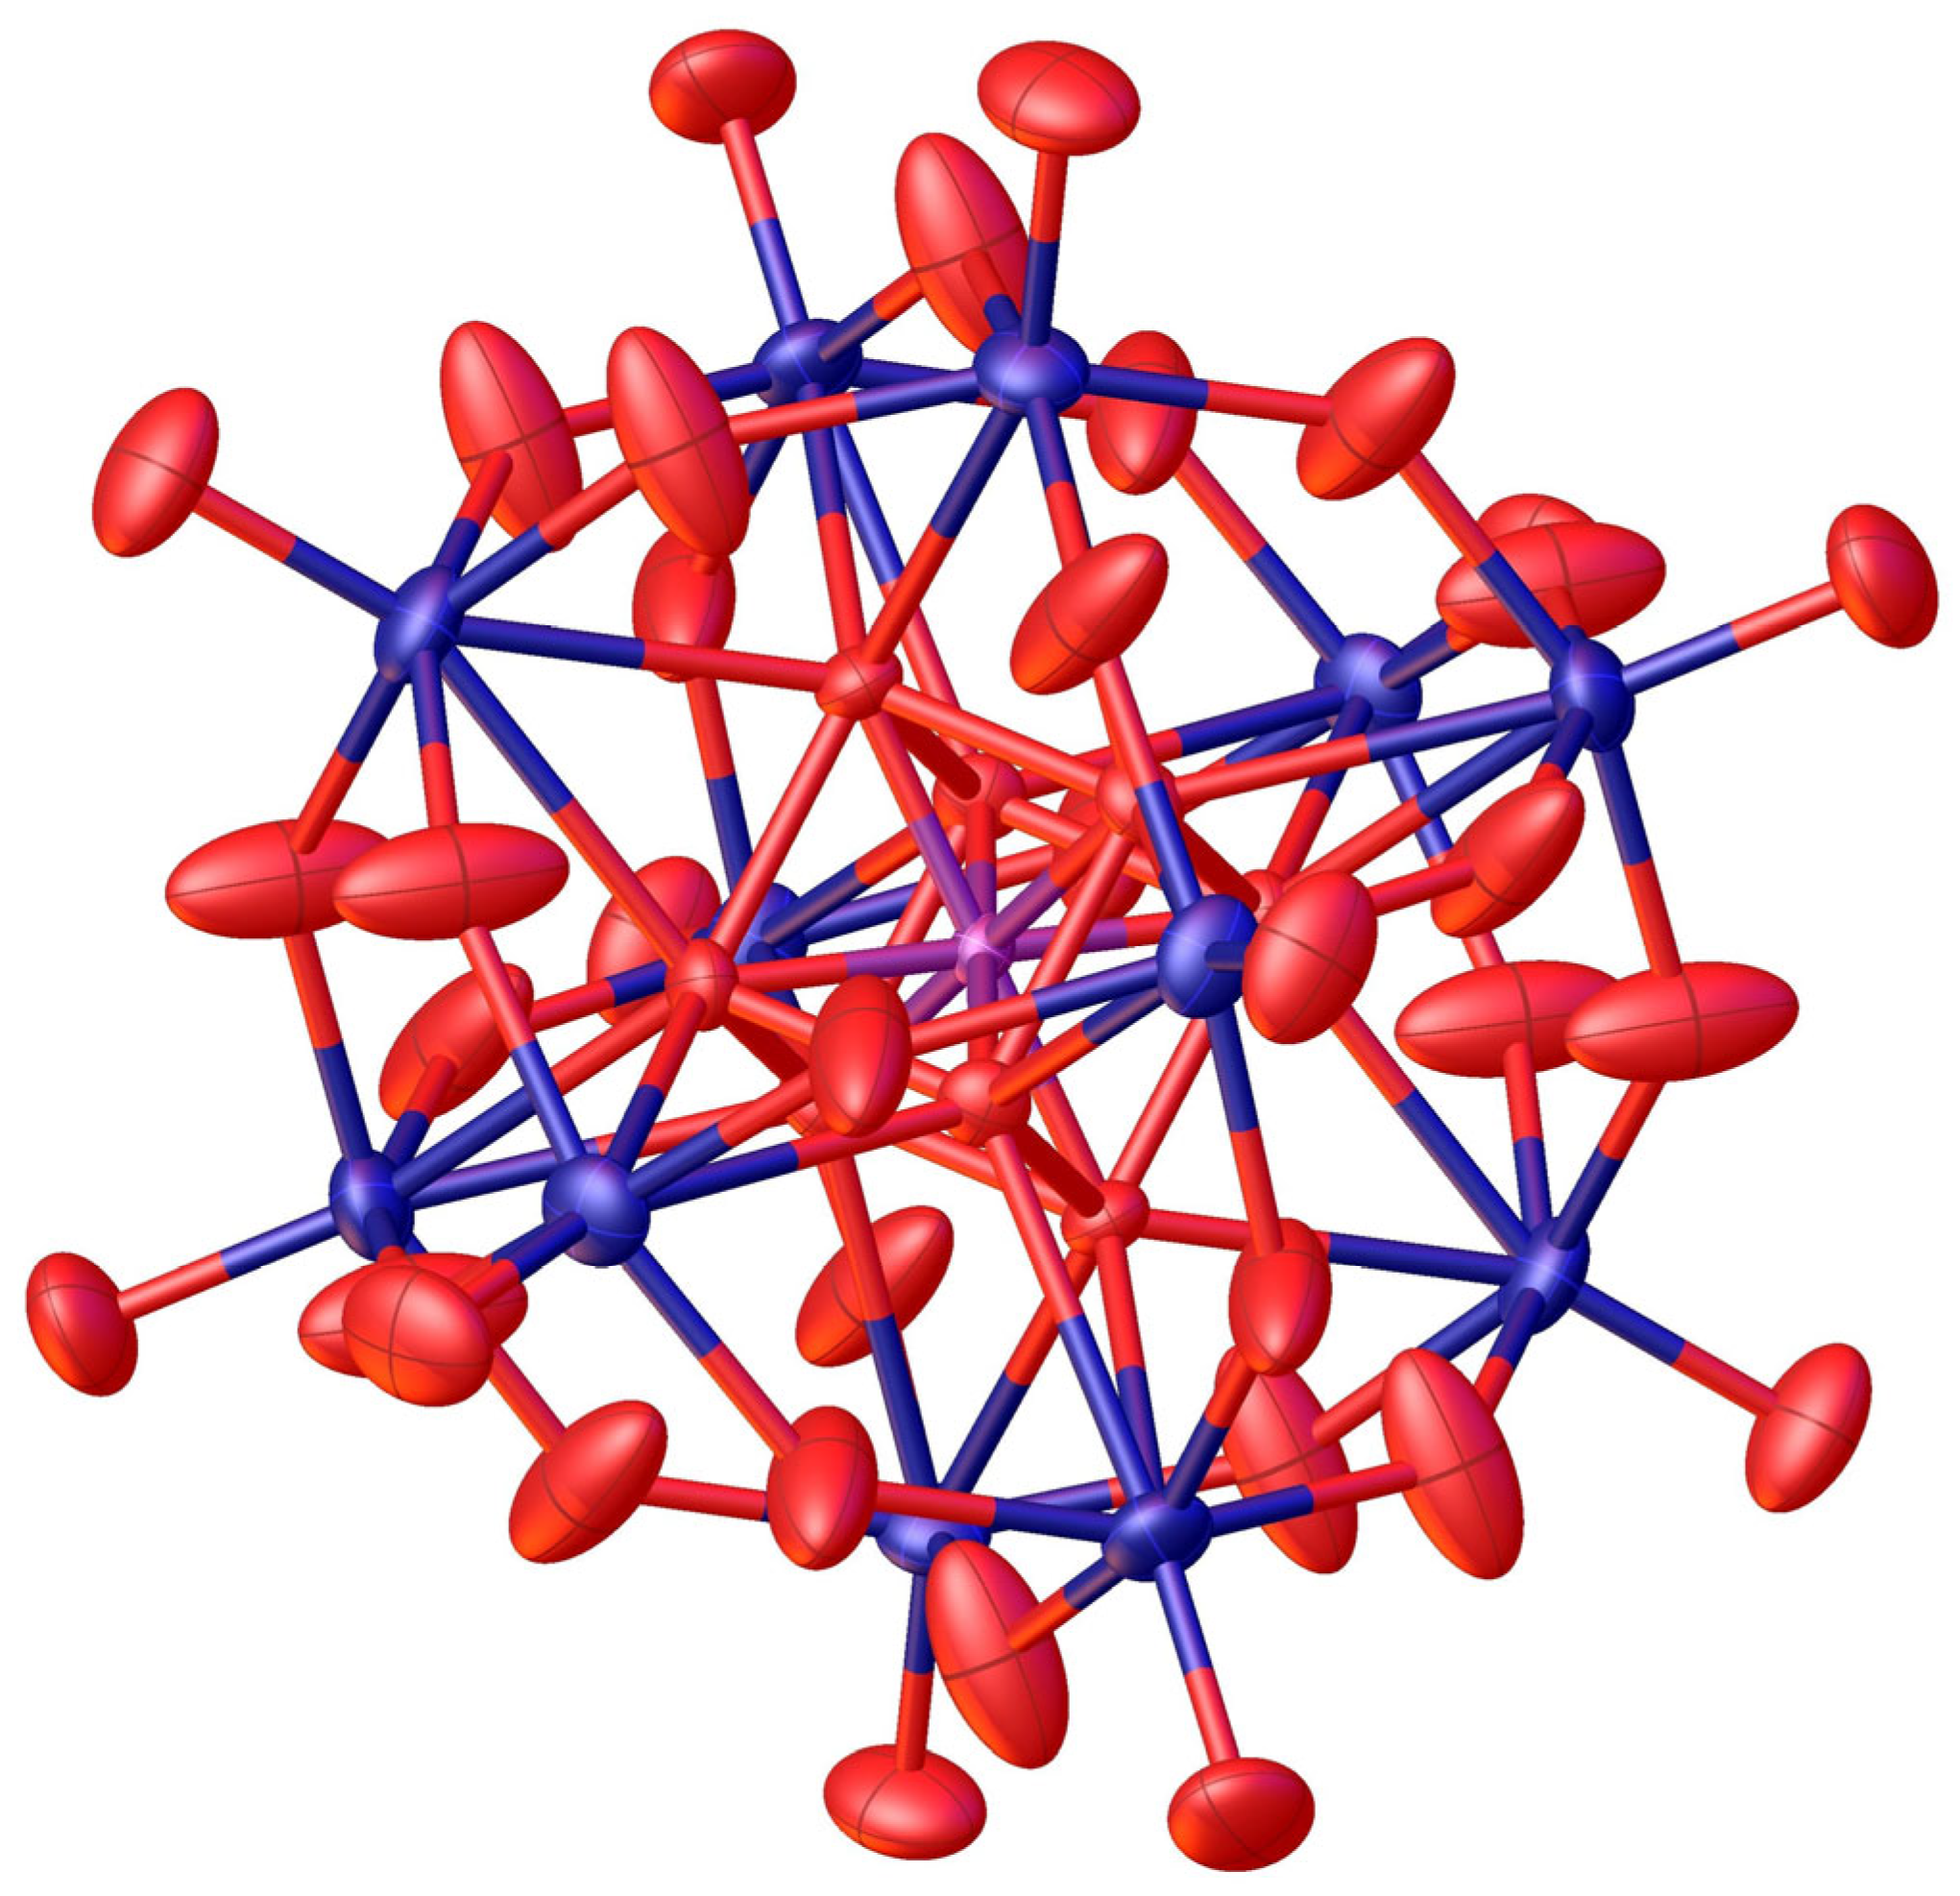
| Bond Type | Found Bond Length [Å] | Weighted Sum of Covalent Radii [Å] | |||
|---|---|---|---|---|---|
| NaPV2W | NaPV5W | HPV5Mo | NaPV2W | NaPV5W | |
| P1–O1 | 1.532 | 1.540 | 1.540 | 1.740 | 1.740 |
| O1–M1,2 | 2.445 | 2.416 | 2.400 | 1.995 | 1.988 |
| M1,2–O2,3,4 | 1.887 | 1.870 | 1.919 | 1.995 | 1.988 |
| M1,2=O5,6 | 1.653 | 1.649 | 1.635 | 1.995 | 1.988 |
| Substitution Degree | Molybdates | Tungstates | ||
|---|---|---|---|---|
| 31P Shift [ppm] | 51V Shift [ppm] | 31P Shift [ppm] | 51V Shift [ppm] | |
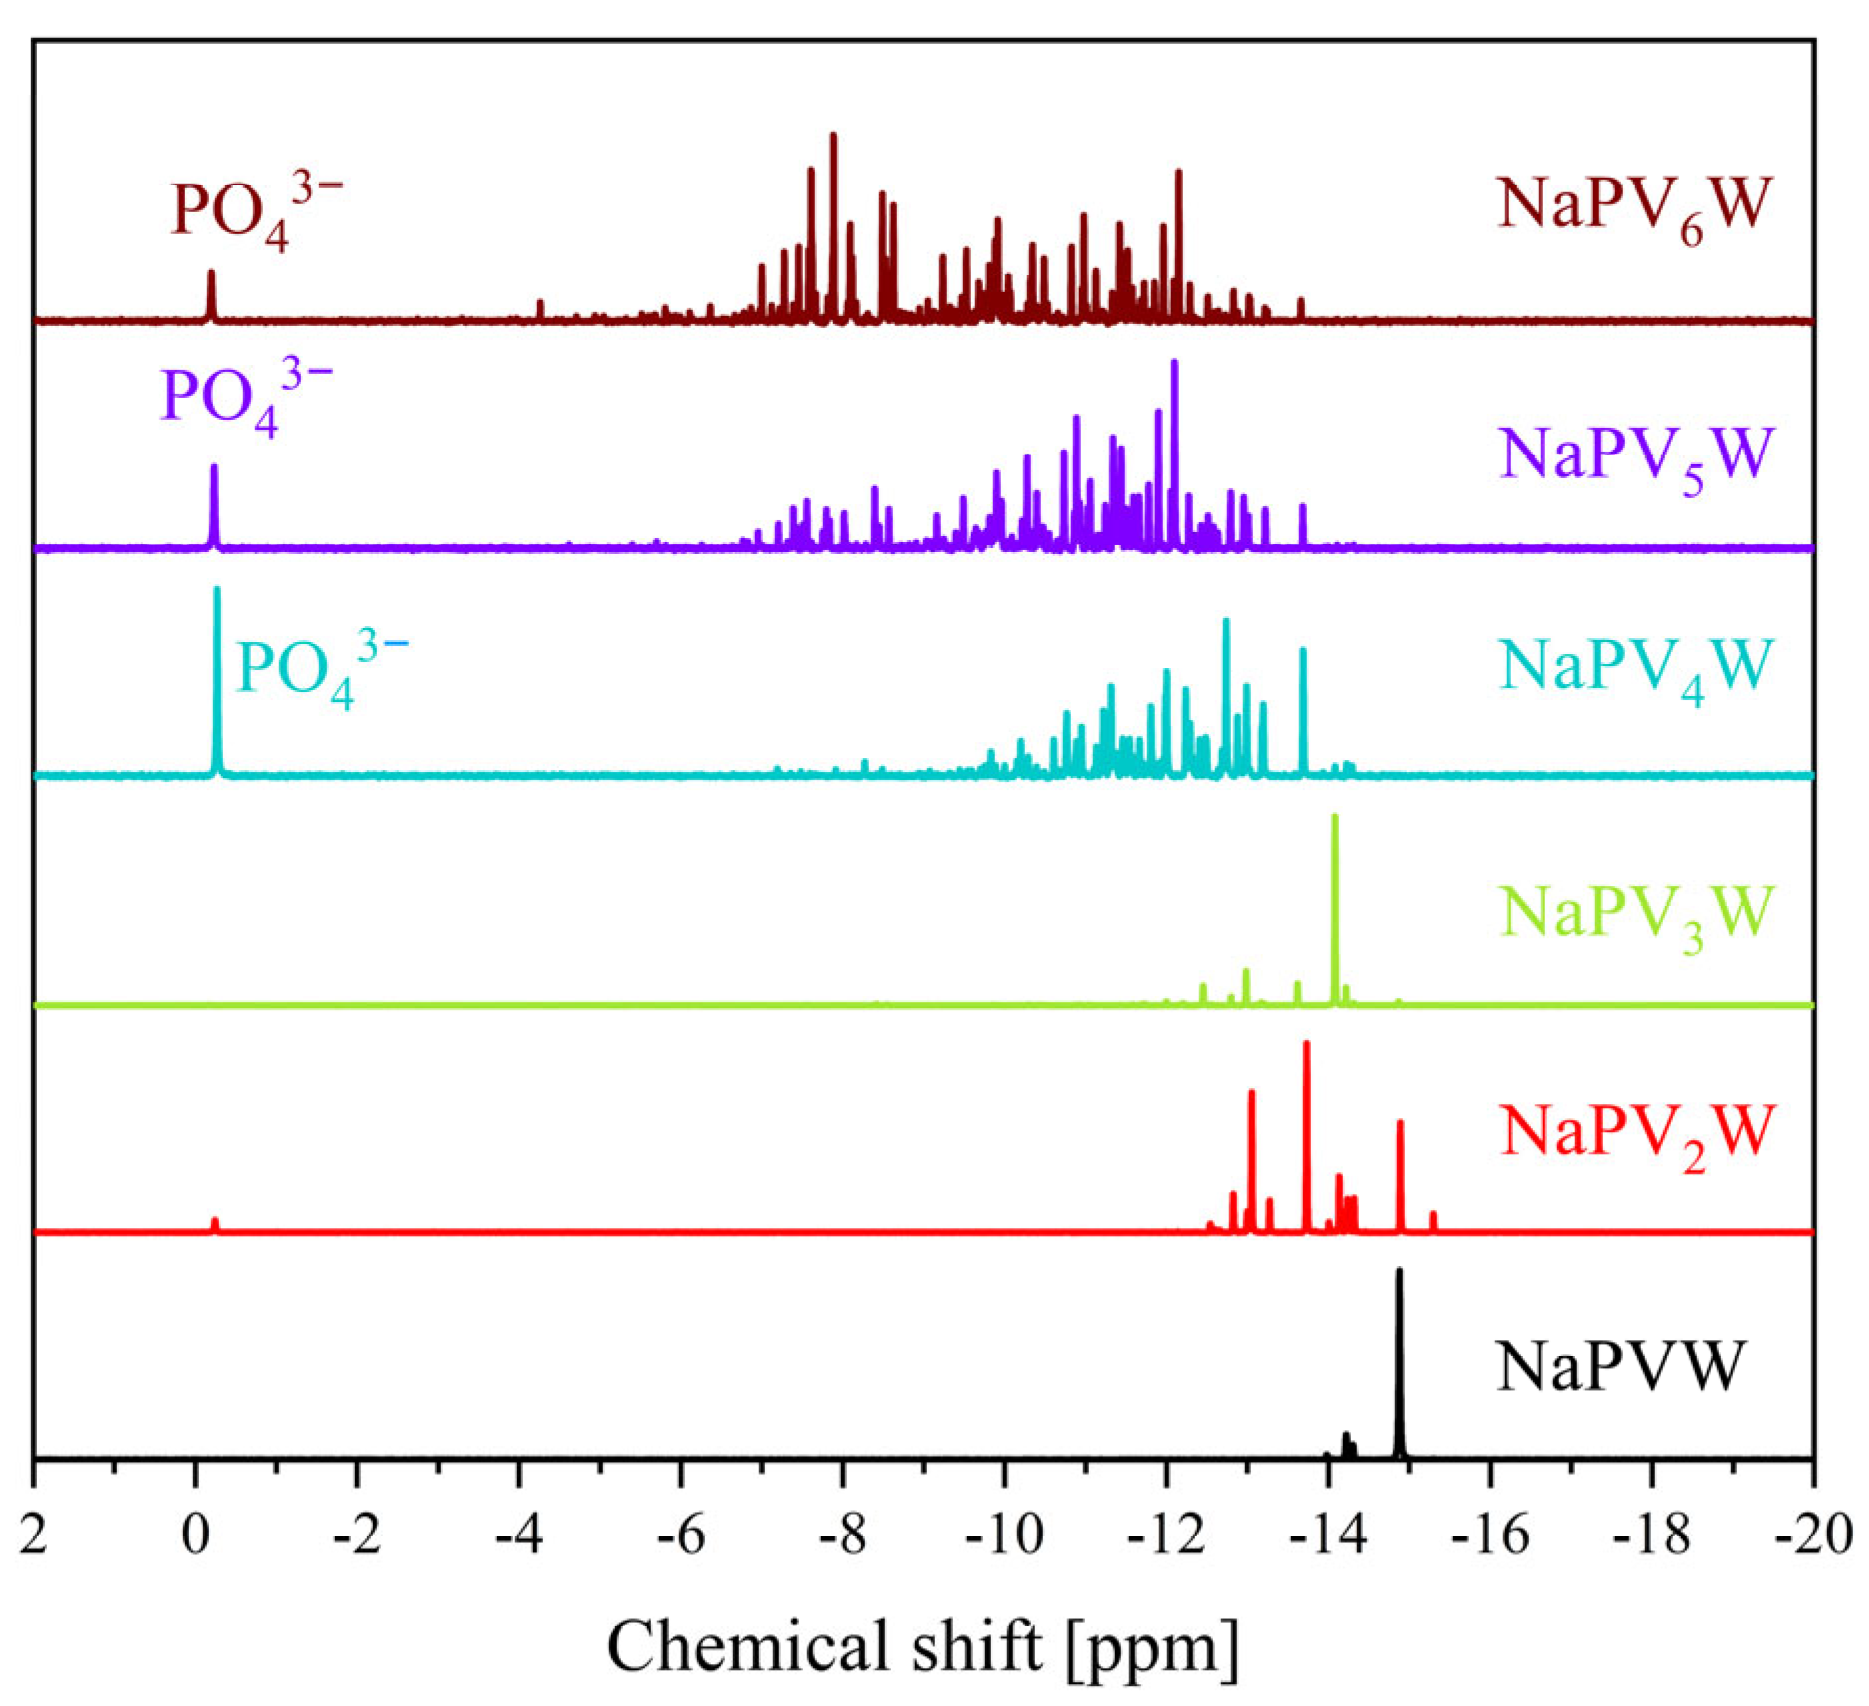
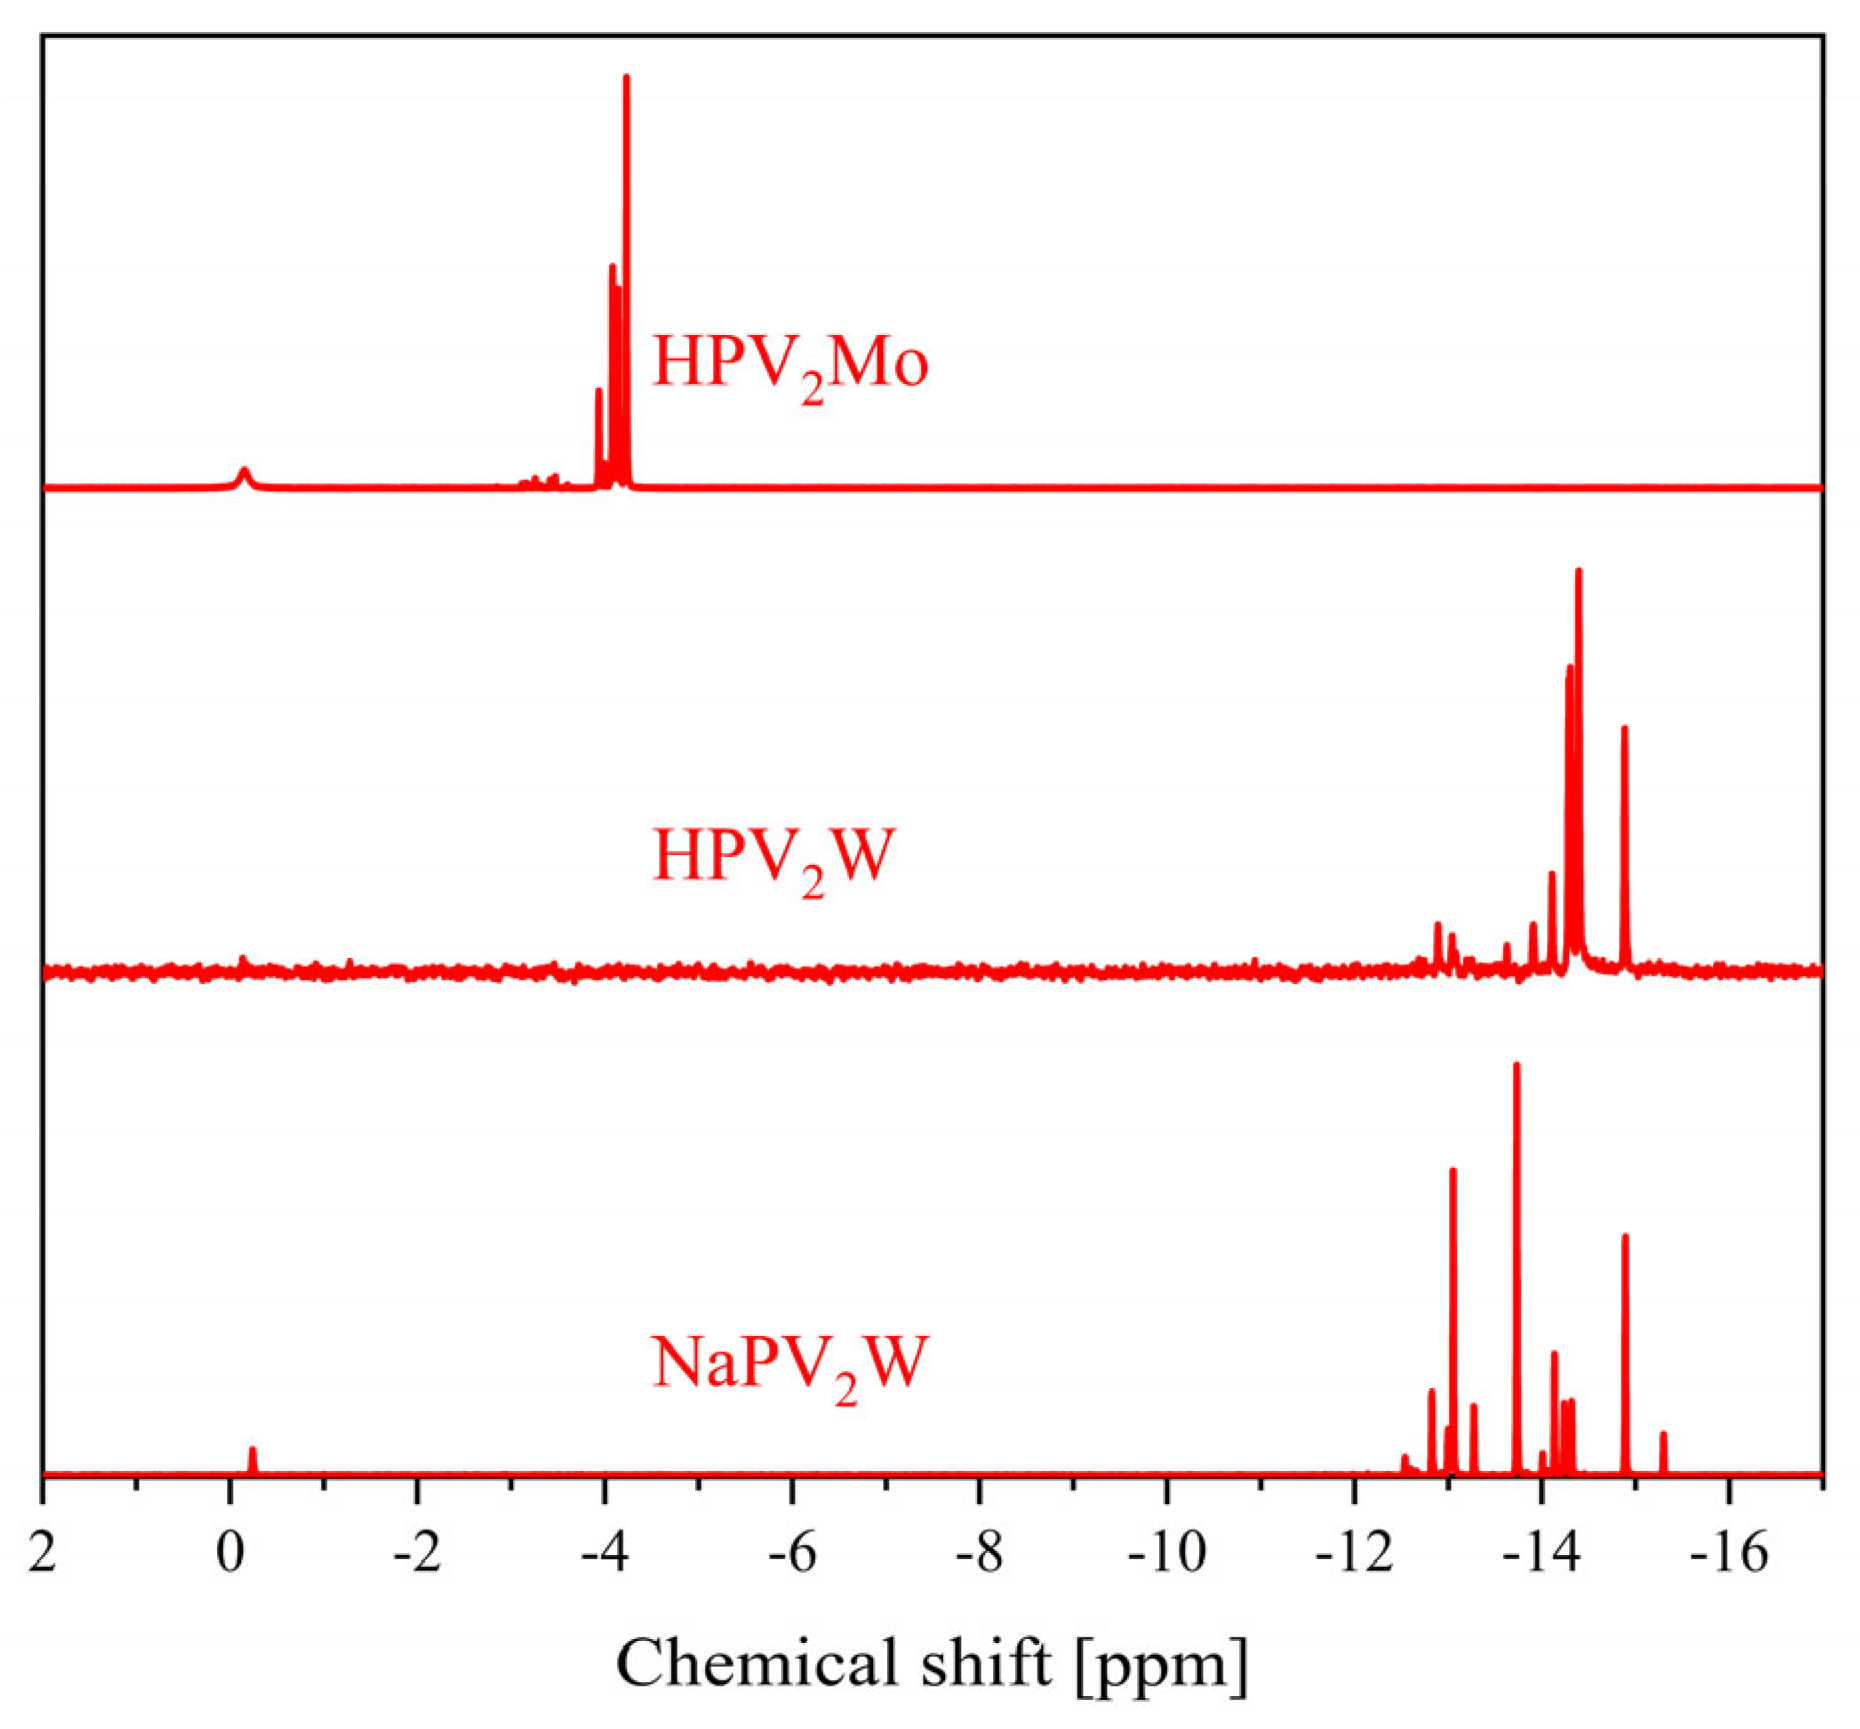
| 0 | −3.75 | - | −15.3 | - |
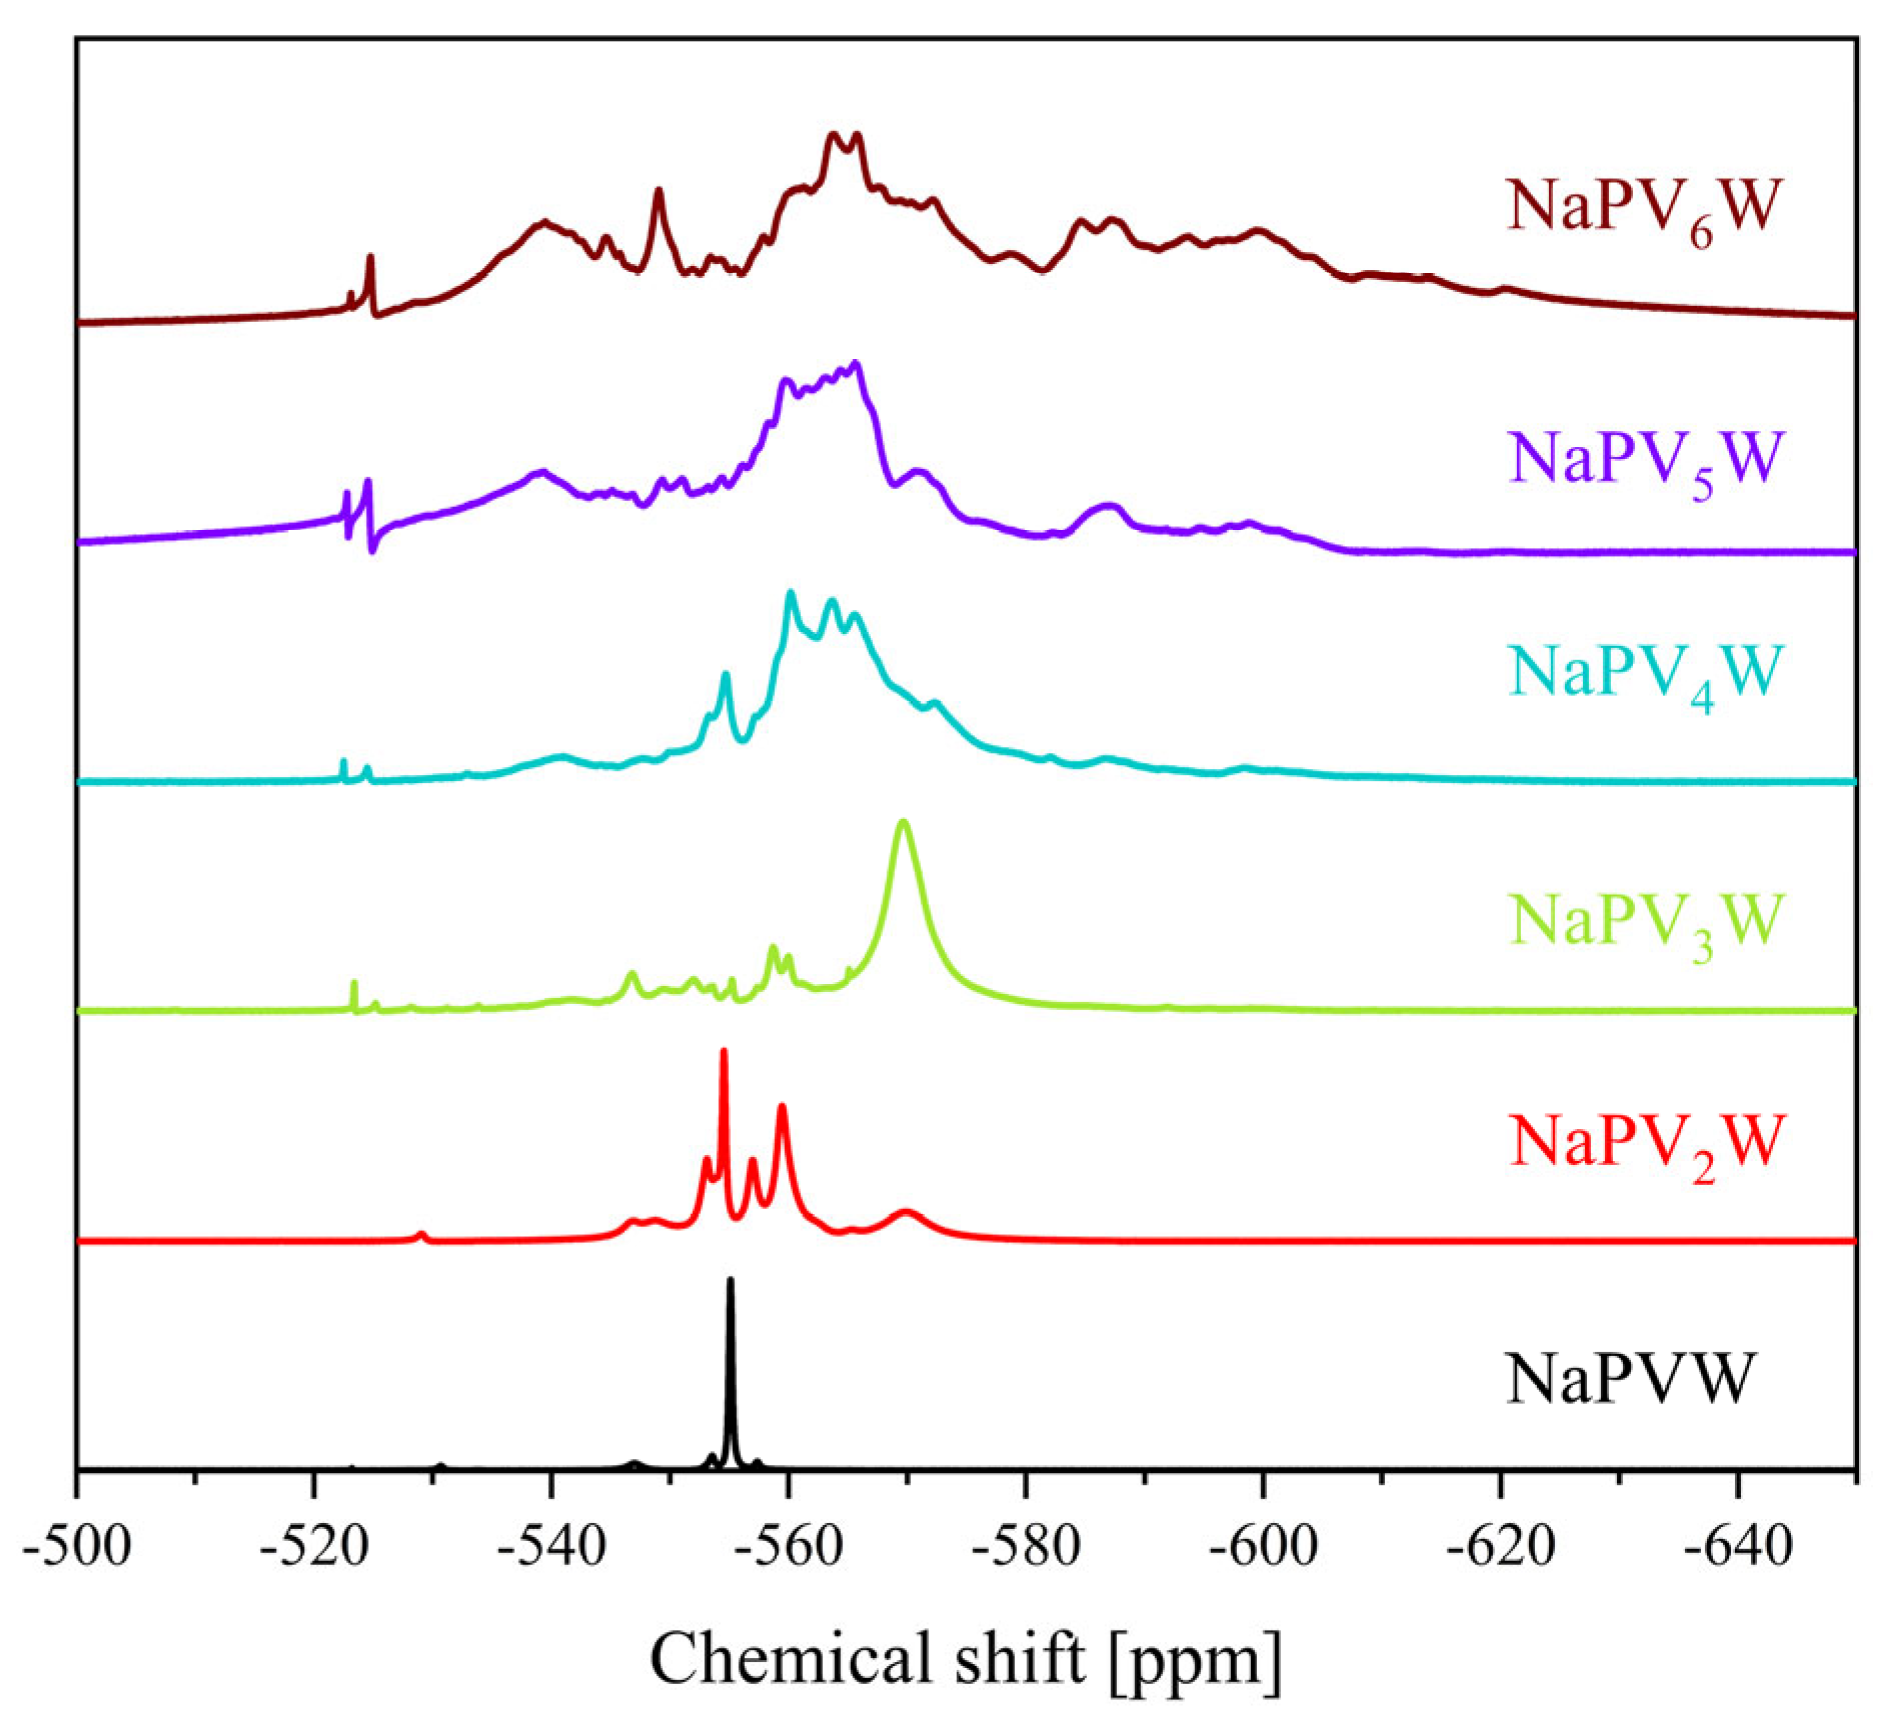
| 1 | −4.22 | −531.6 | −14.9 | −555.1 |
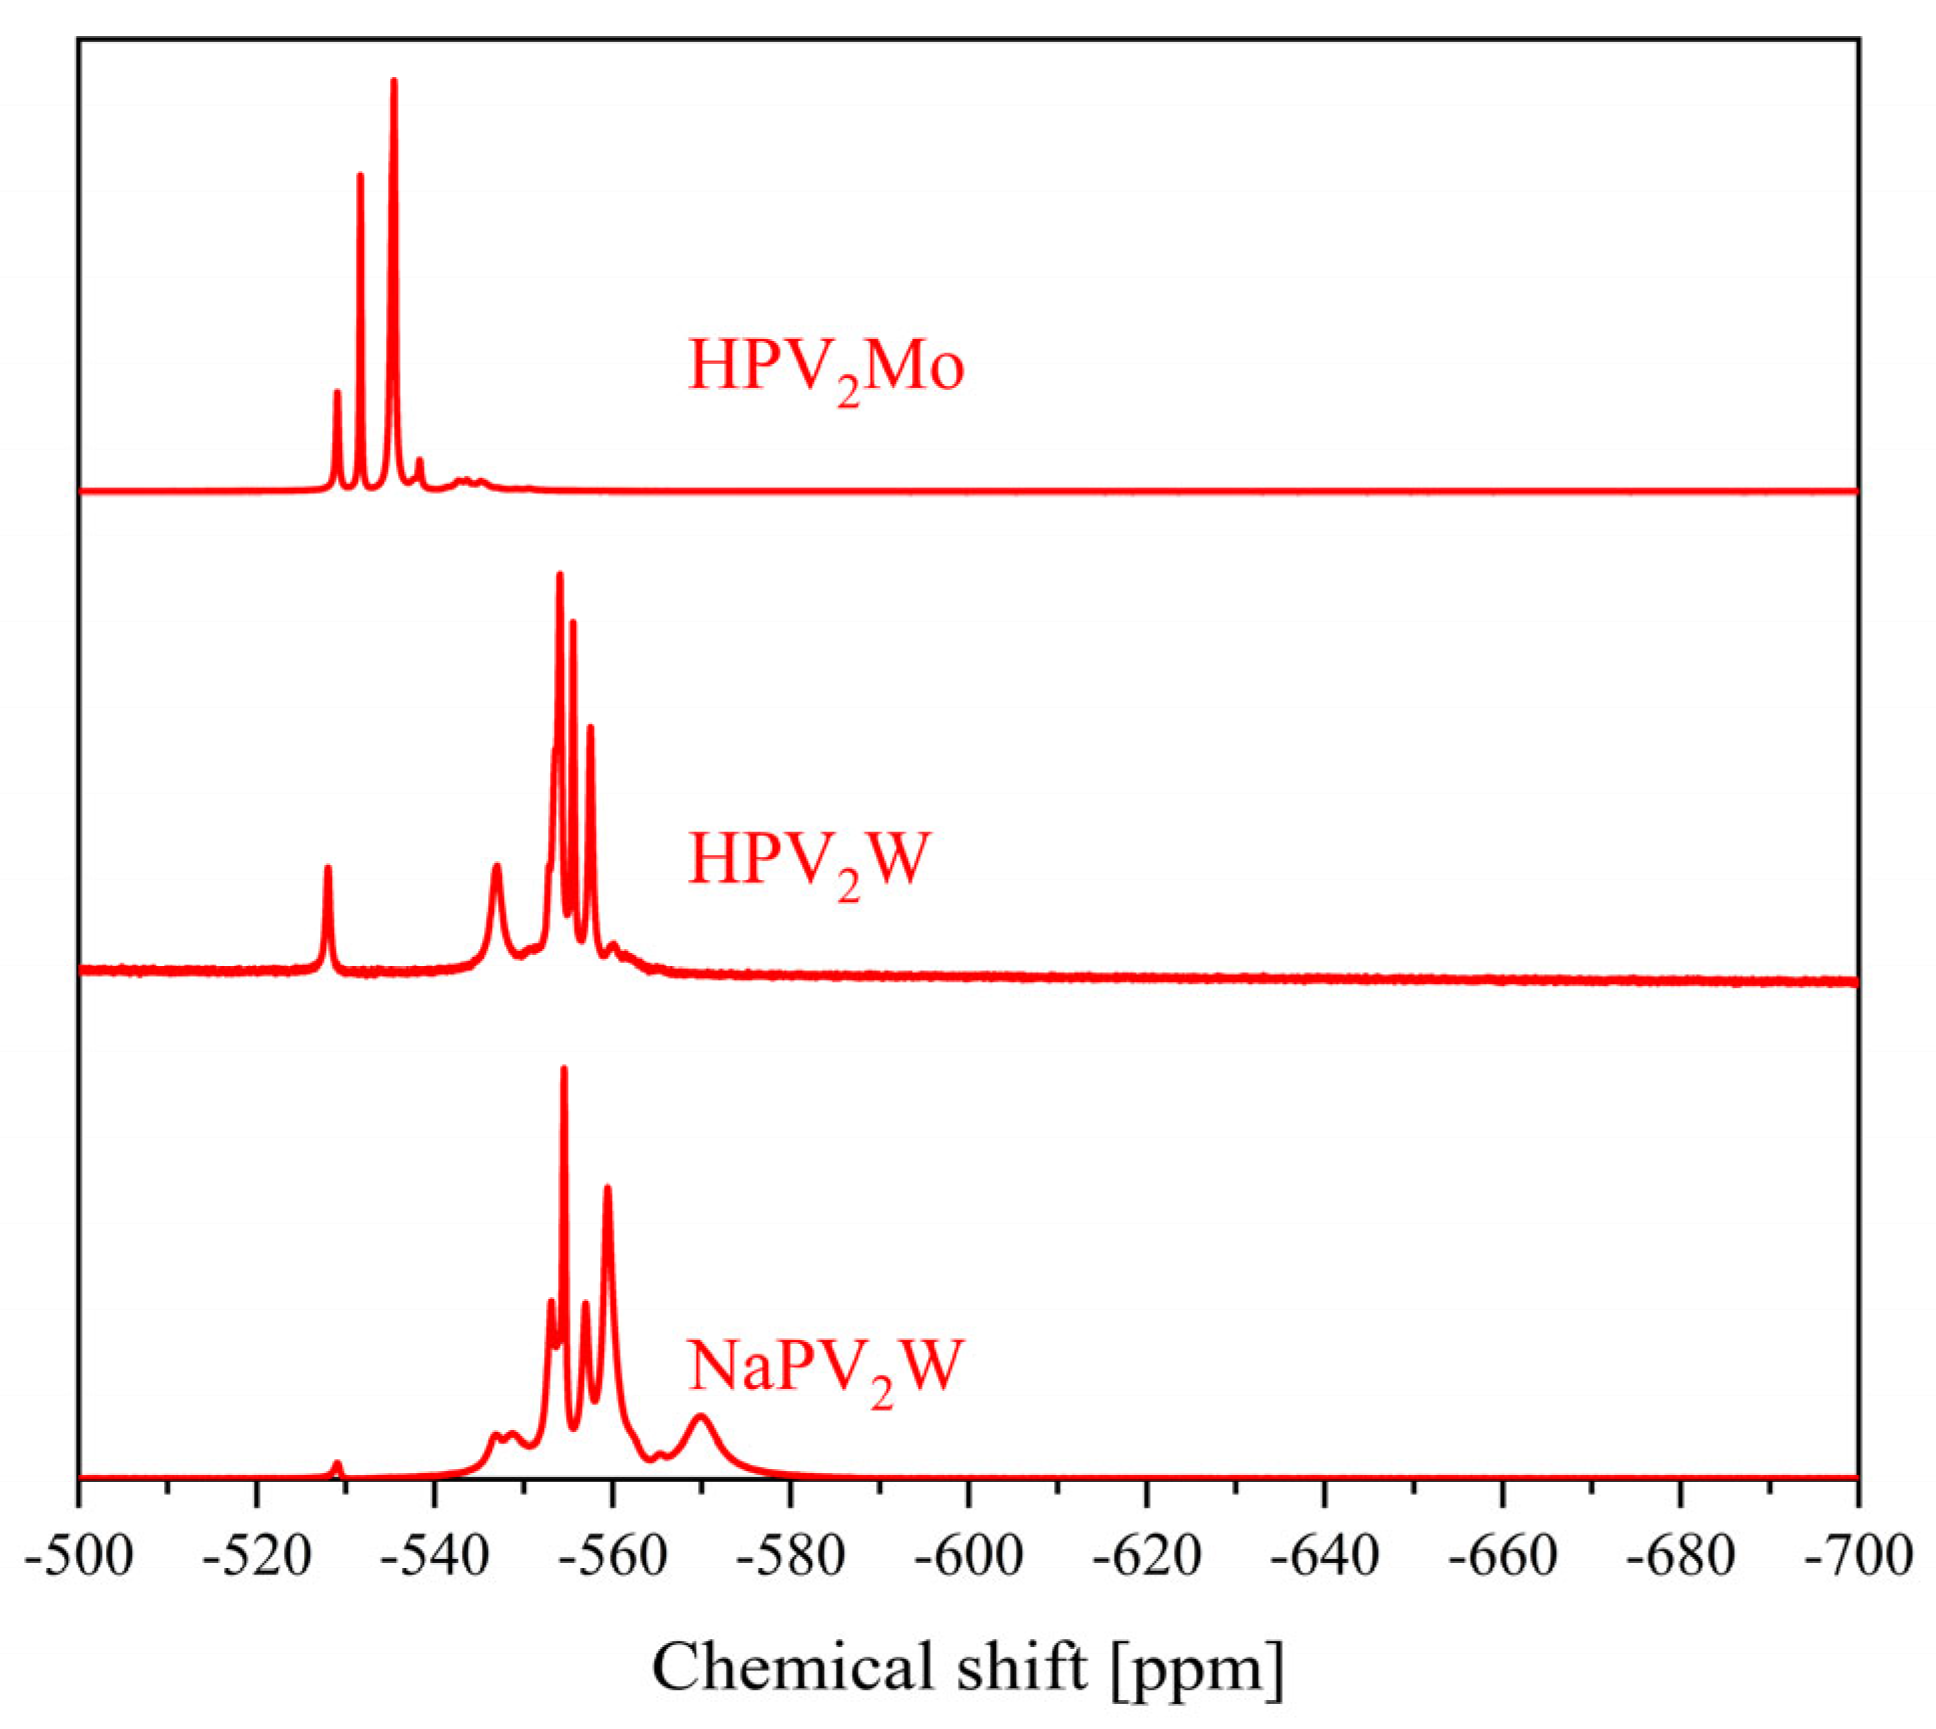
| 2 | −3.94, −4.00, −4.08, −4.14, −4.23 | −529.0, −531.7, −535.4, −538.3 | −12.8 to −14.9 | −538.5 to −578.8 |
| 3 | −3.15 to −3.64 and −3.98 to −4.23 | −526.4, −531.6, −534.0, −534.7, −537.2, −540.2 to −549.7 | −11.6 to −15.0 | −519.5 to −589.7 |
| 4 | −2.47 to −4.24 | −531.2 to −554.4 | −9.1 to −14.5 | −519.0 to −623.6 |
| 5 | −1.00 to −4.25 | −490.0 to −610.0 | −6.4 to −14.2 | −519.0 to −617.9 |
| 6 | −1.50 to −4.50 | −500.0 to −590.0 | −6.6 to −14.2 | −520.2 to −640.8 |
| POM/LMCT | O → M(VI) (M = Mo, W) | O → V(V) |
|---|---|---|
| HPMo | 214.0 | - |
| HPW | 255.5 | - |
| HPVMo | 211.5 | 308.5 |
| HPV2Mo | 214.5 | 308.0 |
| HPV3Mo | 215.0 | 305.0 |
| HPV4Mo | 218.0 | 304.0 |
| HPV5Mo | 217.0 | 308.0 |
| HPV6Mo | 217.0 | 308.0 |
| NaPVW | 260.0 | * |
| NaPV2W | 242.0 | * |
| NaPV3W | 250.0 | * |
| NaPV4W | 240.0 | * |
| NaPV5W | 235.0 | * |
| NaPV6W | 234.0 | * |
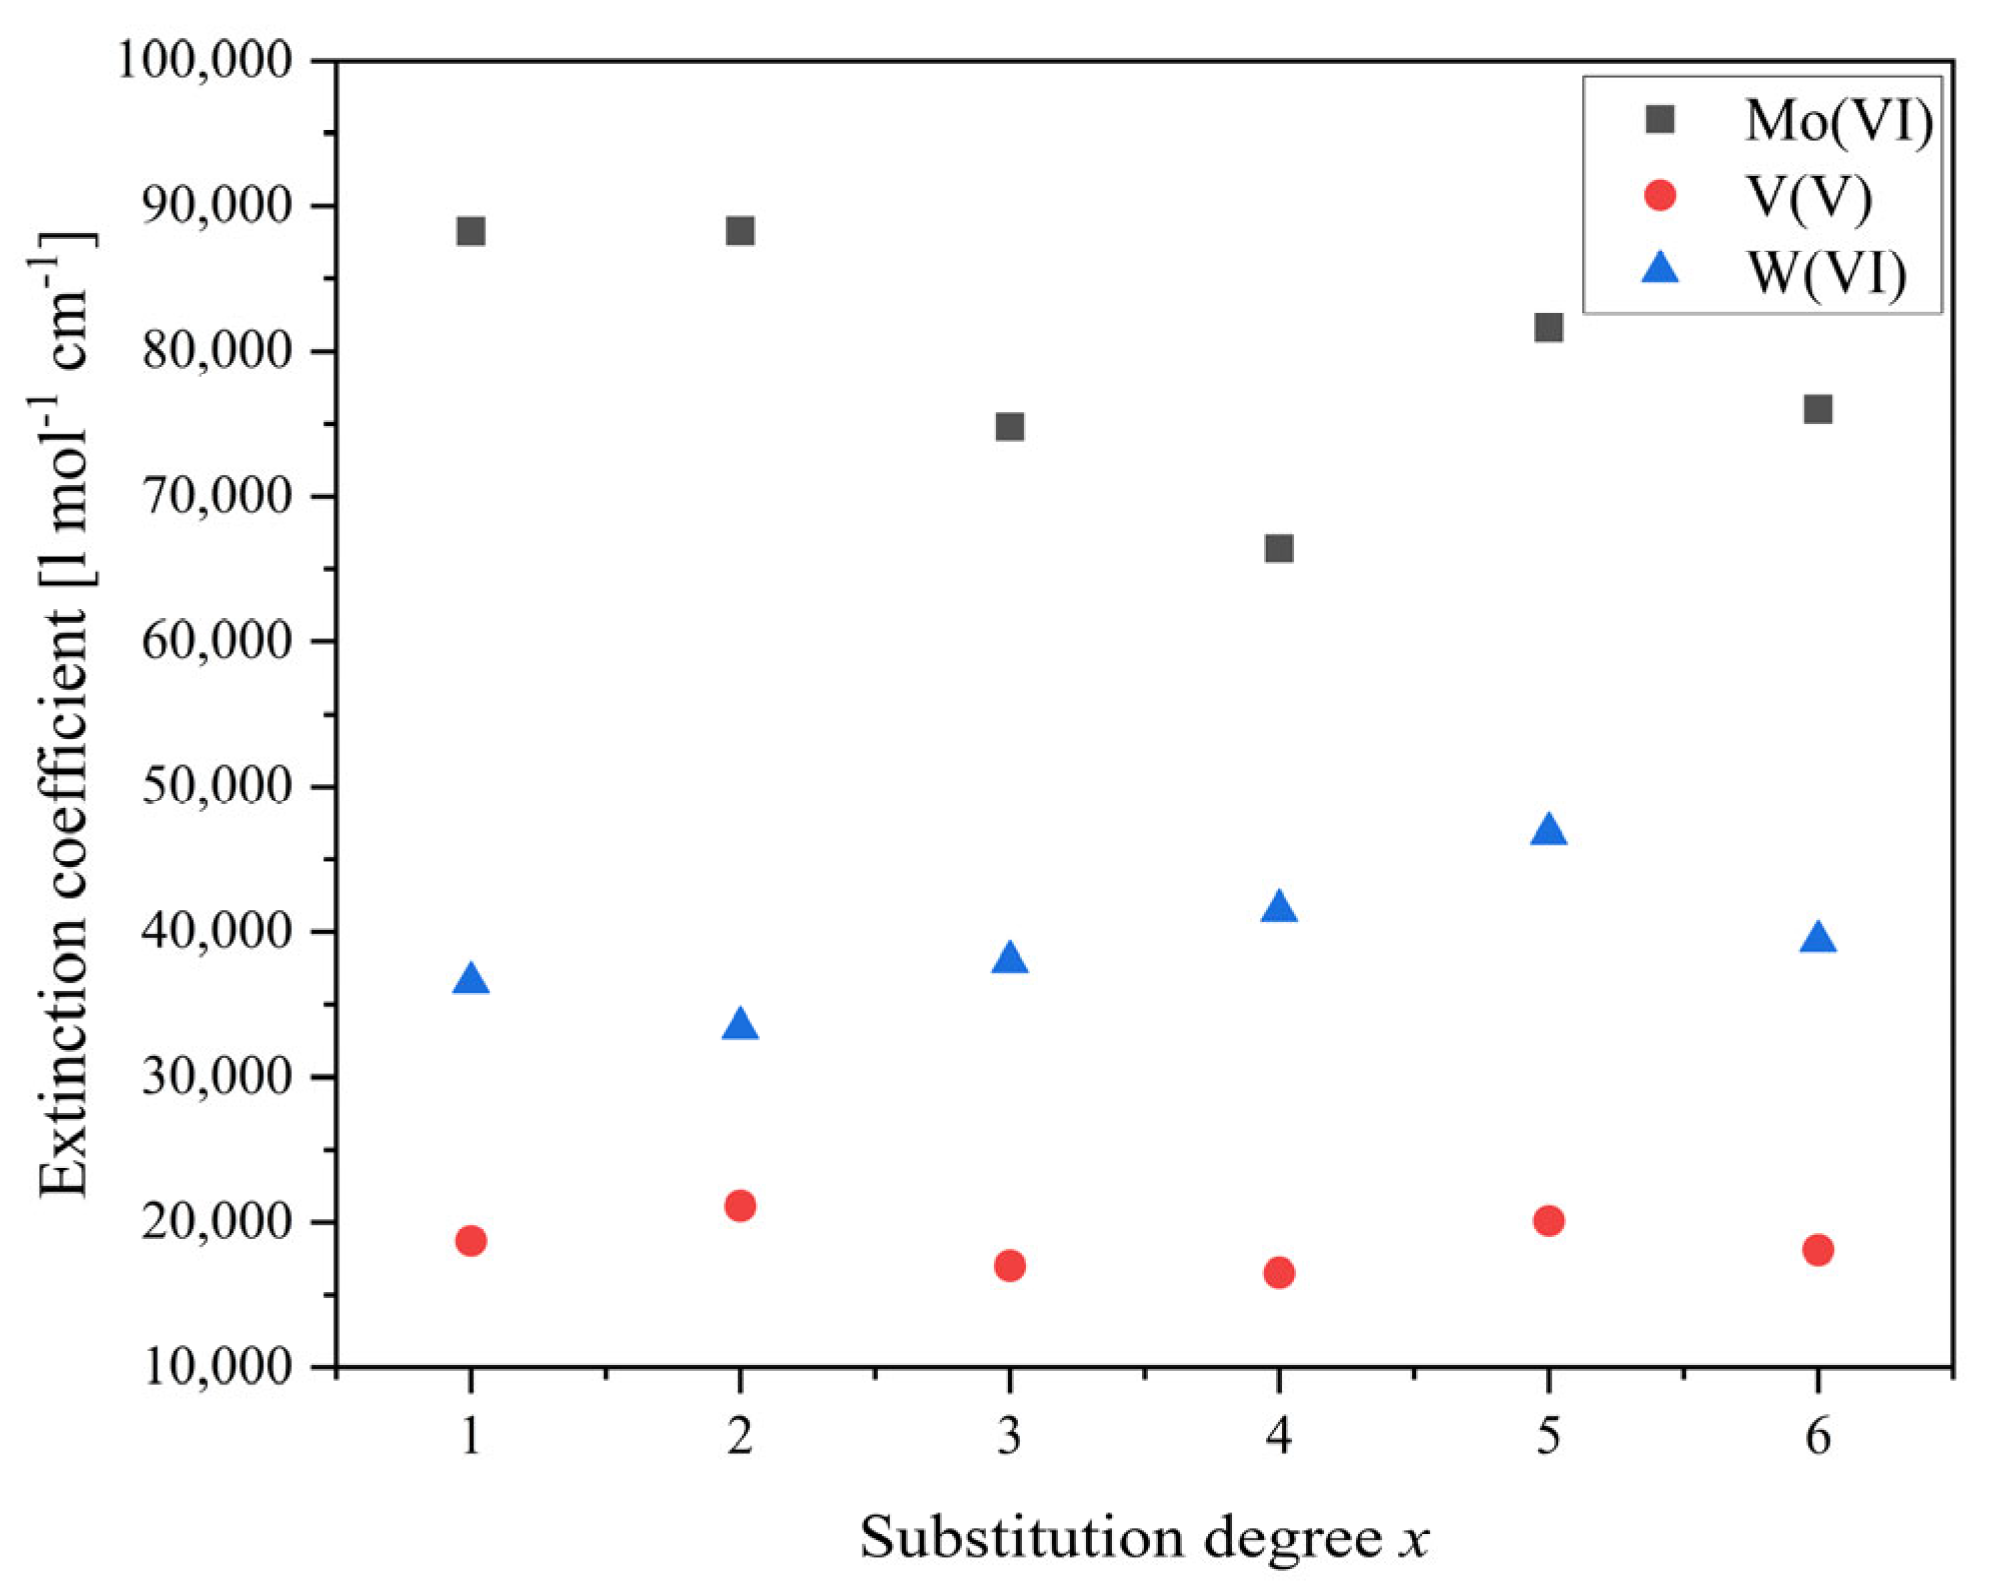
| Substitution Degree, x | HPVxMo | NaPVxW | |
|---|---|---|---|
| Mo(V) [L mol−1 cm−1] | V(V) [L mol−1 cm−1] | W(VI) [L mol−1 cm−1] | |
| 1 | 88,247 | 18,705 | 36,532 |
| 2 | 88,289 | 21,140 | 33,402 |
| 3 | 74,813 | 17,004 | 37,975 |
| 4 | 66,427 | 16,526 | 41,484 |
| 5 | 81,571 | 20,115 | 46,798 |
| 6 | 76,012 | 18,094 | 39,371 |
Disclaimer/Publisher’s Note: The statements, opinions and data contained in all publications are solely those of the individual author(s) and contributor(s) and not of MDPI and/or the editor(s). MDPI and/or the editor(s) disclaim responsibility for any injury to people or property resulting from any ideas, methods, instructions or products referred to in the content. |
© 2023 by the authors. Licensee MDPI, Basel, Switzerland. This article is an open access article distributed under the terms and conditions of the Creative Commons Attribution (CC BY) license (https://creativecommons.org/licenses/by/4.0/).
Share and Cite
Raabe, J.-C.; Aceituno Cruz, J.; Albert, J.; Poller, M.J. Comparative Spectroscopic and Electrochemical Study of V(V)-Substituted Keggin-Type Phosphomolybdates and -Tungstates. Inorganics 2023, 11, 138. https://doi.org/10.3390/inorganics11040138
Raabe J-C, Aceituno Cruz J, Albert J, Poller MJ. Comparative Spectroscopic and Electrochemical Study of V(V)-Substituted Keggin-Type Phosphomolybdates and -Tungstates. Inorganics. 2023; 11(4):138. https://doi.org/10.3390/inorganics11040138
Chicago/Turabian StyleRaabe, Jan-Christian, José Aceituno Cruz, Jakob Albert, and Maximilian J. Poller. 2023. "Comparative Spectroscopic and Electrochemical Study of V(V)-Substituted Keggin-Type Phosphomolybdates and -Tungstates" Inorganics 11, no. 4: 138. https://doi.org/10.3390/inorganics11040138