Article

The Role of Non-Covalent Interactions in the Reactions between Palladium Hydrido Complex with Amidoarylphosphine Pincer Ligand and Brønsted Acids

by
Vladislava A. Kirkina
1,
Vasilisa A. Kulikova
1,
Evgenii I. Gutsul
1,
Zufar N. Gafurov
2,
Ilias F. Sakhapov
2,
Dmitry G. Yakhvarov
2,3,
Yulia V. Nelyubina
1,
Oleg A. Filippov
1,
Elena S. Shubina
1,* and
Natalia V. Belkova
1,*
1
A.N. Nesmeyanov Institute of Organoelement Compounds, Russian Academy of Sciences (INEOS RAS), 28, Vavilov Str., 119334 Moscow, Russia
2
A.E. Arbuzov Institute of Organic and Physical Chemistry, FRC Kazan Scientific Center, Russian Academy of Sciences, Arbuzov Str. 8, 420088 Kazan, Russia
3
A. Butlerov Institute of Chemistry, Kazan Federal University, Kremlyovskaya Str. 18, 420008 Kazan, Russia
*
Authors to whom correspondence should be addressed.
Inorganics 2023, 11(5), 212; https://doi.org/10.3390/inorganics11050212
Submission received: 21 April 2023 / Revised: 9 May 2023 / Accepted: 12 May 2023 / Published: 15 May 2023

Abstract

:
The interaction between (PNP)PdH (1); PNP = bis(2-diisopropylphosphino-4-methylphenyl)amide and different acids (CF3SO3H, HBF4∙Et2O, fluorinated alcohols and formic acid) was studied in benzene or toluene as well as in neat alcohols by IR and NMR spectroscopies. The structures of hydrogen-bonded complexes were also optimized at the DFT/ωB97-XD/def2-TZVP level. The nitrogen atom of the amidophosphine pincer ligand readily accepts proton not only from strong Brønsted acids but from relatively weak fluorinated alcohols. That suggests that binding to palladium(II) increases the diarylamine basicity, making it a strong base. Nevertheless, H+ can be taken from [(PN(H)P)PdH]+ (2) by pyridine or hexamethylphosphoramide (HMPA). These observations confirm the need for a shuttle base to form [(PN(H)P)PdH]+ (2) as the result of the heterolytic splitting of H2 by [(PNP)Pd]+. At that, a stoichiometric amount of formic acid protonates a hydride ligand yielding an unstable η2-H2 complex that rapidly converts into formate (PNP)Pd(OCHO), which loses CO2 to restore (PNP)PdH, whereas the relatively high acid excess hampers this reaction through competitive protonation at nitrogen atom.

1. Introduction

Homogeneous catalysis allows the implementation of many practically important and fundamentally interesting processes under relatively mild conditions. Many systems developed through the years rely on transition metal complexes, and in recent years, a lot of attention has been devoted to complexes based on pincer-type ligands [1,2,3]. Pincer ligands are defined as chelating ligands that bind through three adjacent donor sites in a meridional geometry. Featuring structural and electronic variability and a versatile fine-tuning of chemical properties, they give high thermal stability to transition metal complexes and well-defined reactivity to the available coordination sites. A plethora of complexes described operate using metal–ligand cooperation when the electrophilic metal center and the nucleophilic ligand site allow for the heterolytic splitting of polar (e.g., O–H, N–H) and nonpolar (e.g., H2) bonds [4]. These steps are important for (de)hydrogenative transformations which span from a reduction in multiple bonds to a controlled release and fixation of dihydrogen for sustainable chemical energy storage [5,6].
The title palladium hydride complex with a diarylamido bis(phosphine) pincer ligand—(PNP)PdH, where PNP is bis(2-diisopropylphosphino-4-methylphenyl)amide—has been originally described by Ozerov and coworkers [7]. Its cationic [(PNP)Pd]+ fragment bearing p-lone pair at nitrogen (although delocalized over the diarylamide π-system) and an empty σ-orbital at Pd has been considered as related to the frustrated Lewis pairs [8]. Being interested in transition metal hydrides’ chemistry and transition-metal-based FLPs, we explored the interaction of (PNP)PdH (1) with different acids to gain a deeper understanding of its basicity and its potential as a bifunctional catalyst.

2. Results and Discussion

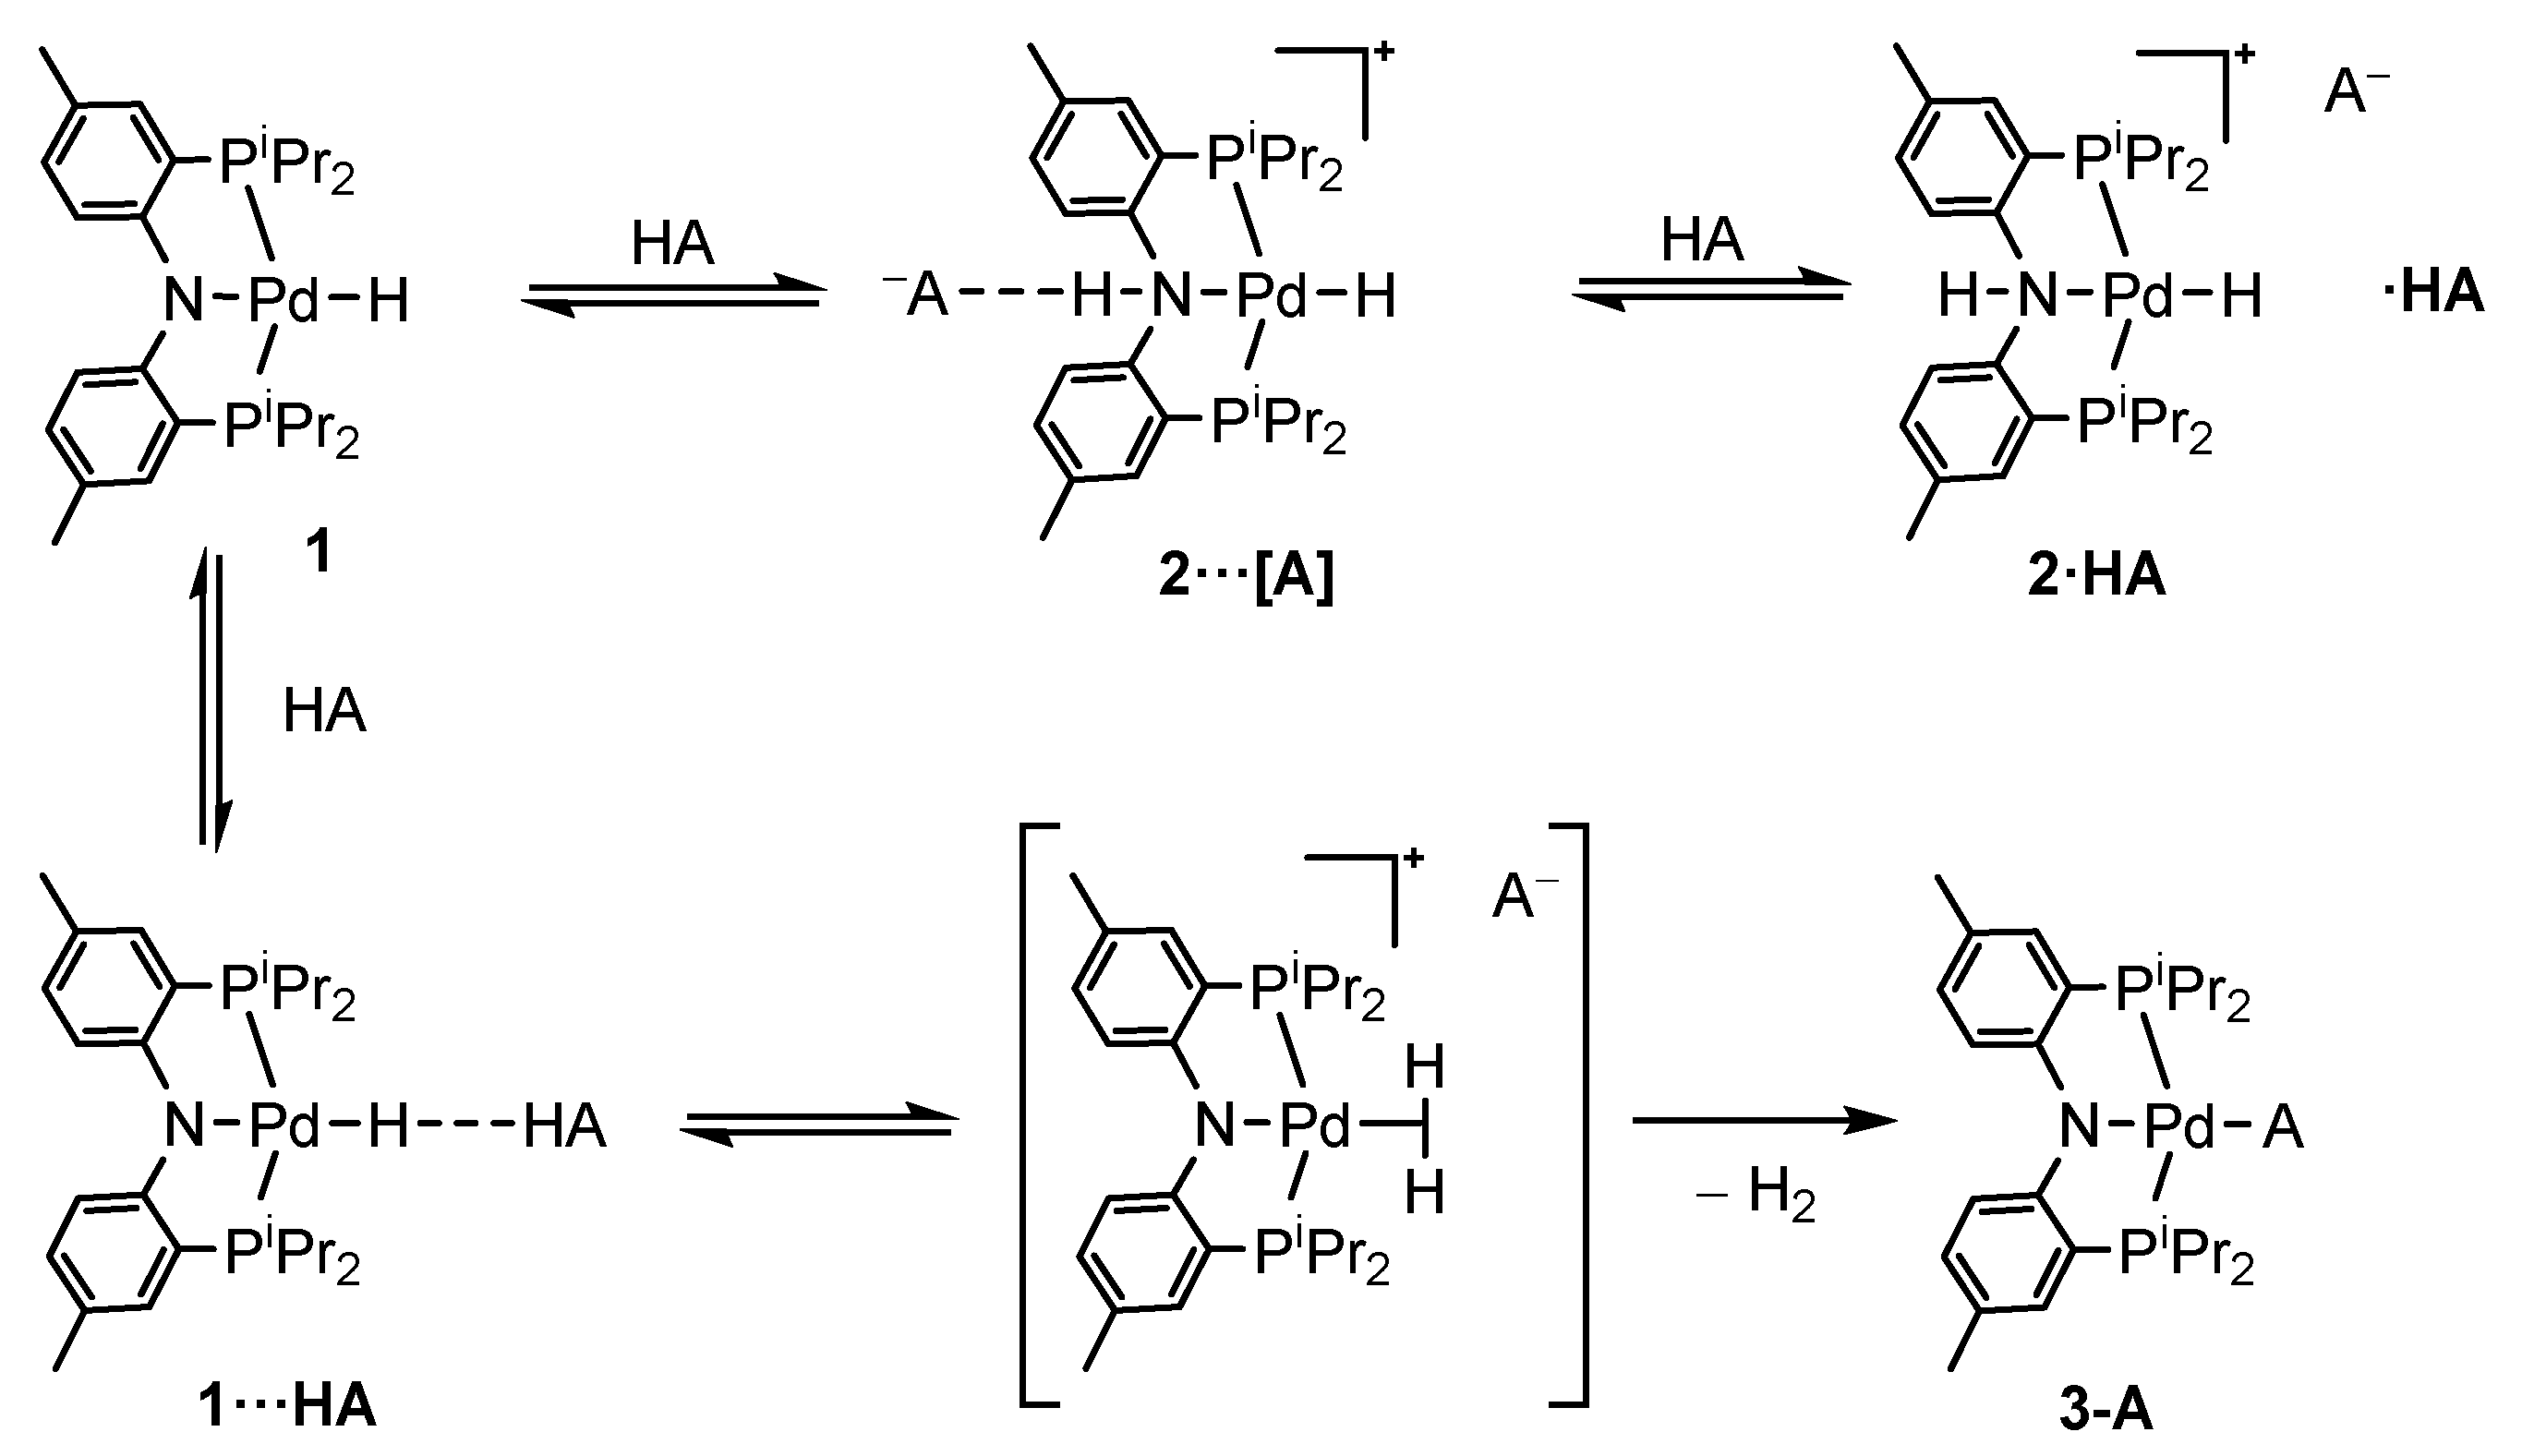
2.1. (PNP)PdH Interaction with Strong Brønsted Acids TfOH and HBF4, Chemical Properties of [(PN(H)P)PdH]+

It has been shown that (PNP)Pd-OTf is able to heterolytically split various X-H bonds including H2, yielding in the latter case [(PN(H)P)PdH]+ species (2, Scheme 1) [8]. According to the accompanying DFT studies, the proton transfer from a coordinated H2 (or another HX) to the amido-nitrogen of the PNP ligand should proceed with the assistance of an exogenous Brønsted base.
Our study showed that cationic complex 2 can be also obtained via the protonation of (PNP)PdH (1) [9] with trifluoromethanesulfonic acid (TfOH; pKa = 0.7 in MeCN [10]) or HBF4·Et2O (pKa = 3.4 in DMF [11]). The NMR signals of the protonation products 2[OTf]PdH = −12.04, δNH = 10.41, δP = 56.7 in C6D6) and 2[BF4]PdH= −12.12, δNH = 9.53, δP = 56.9 in toluene-d8; Tables S1 and S2) are in agreement with that previously reported [8]. In IR, spectra protonation leads to the high-frequency shift of Pd-H stretching vibration from νPdH(1) = 1923 cm−1 to 1992 (2[BF4]) or 1991 cm−1 (2[OTf]). For 2[OTf], the N-H stretching vibration band νNH was also identified at 2811 cm−1 (Figure S1). In the absence of a hydrogen atmosphere, 2[OTf] and 2[BF4] appear moderately stable in solution, slowly evolving H2. According to 31P NMR monitoring, ca. 40% of 2[OTf] converts into (PNP)Pd-OTf (δP = 53.1) in 7 days, whereas 2[BF4] decomposes slower, losing only 20% in six days. As dihydrogen evolution is only possible through the backward shuttling of the proton from nitrogen to hydride and the formation of the η2-H2 complex, these observations evidence the participation of the triflate anion as a proton shuttle [12] in H2 heterolytic splitting and backward transfer from NH to the hydride ligand (Scheme 2).
Cationic complex 2 can be deprotonated not only by a strong base such as Et3N [8] (pKa(Et3N-H+) = 18.83 in MeCN [13]) but by moderately basic ones: the addition of the equimolar amount of pyridine (Py, pKa(Py-H+) = 12.53 in MeCN [13], Figure S2) or 10-fold excess hexamethylphosphoramide (HMPA (pKa(HMPA-H+) = 6.1 in MeNO2 [14]) in toluene completely shifts the equilibrium toward (PNP)PdH (1). Much weaker base acetonitrile is not able to deprotonate 2; the reaction stops at the first step—the formation of the hydrogen-bonded complex with the N-H group of 2 (2···B, Scheme 2), evident from a small higher frequency shift of ∆νPdH(2) vibration (νPdH(NH···B) = 1996 cm−1; ΔνPdH = 4 cm−1; Figure S3). The high-frequency shift of νPdH upon the formation of a hydrogen bond with a base was confirmed by DFT calculations (vide infra).

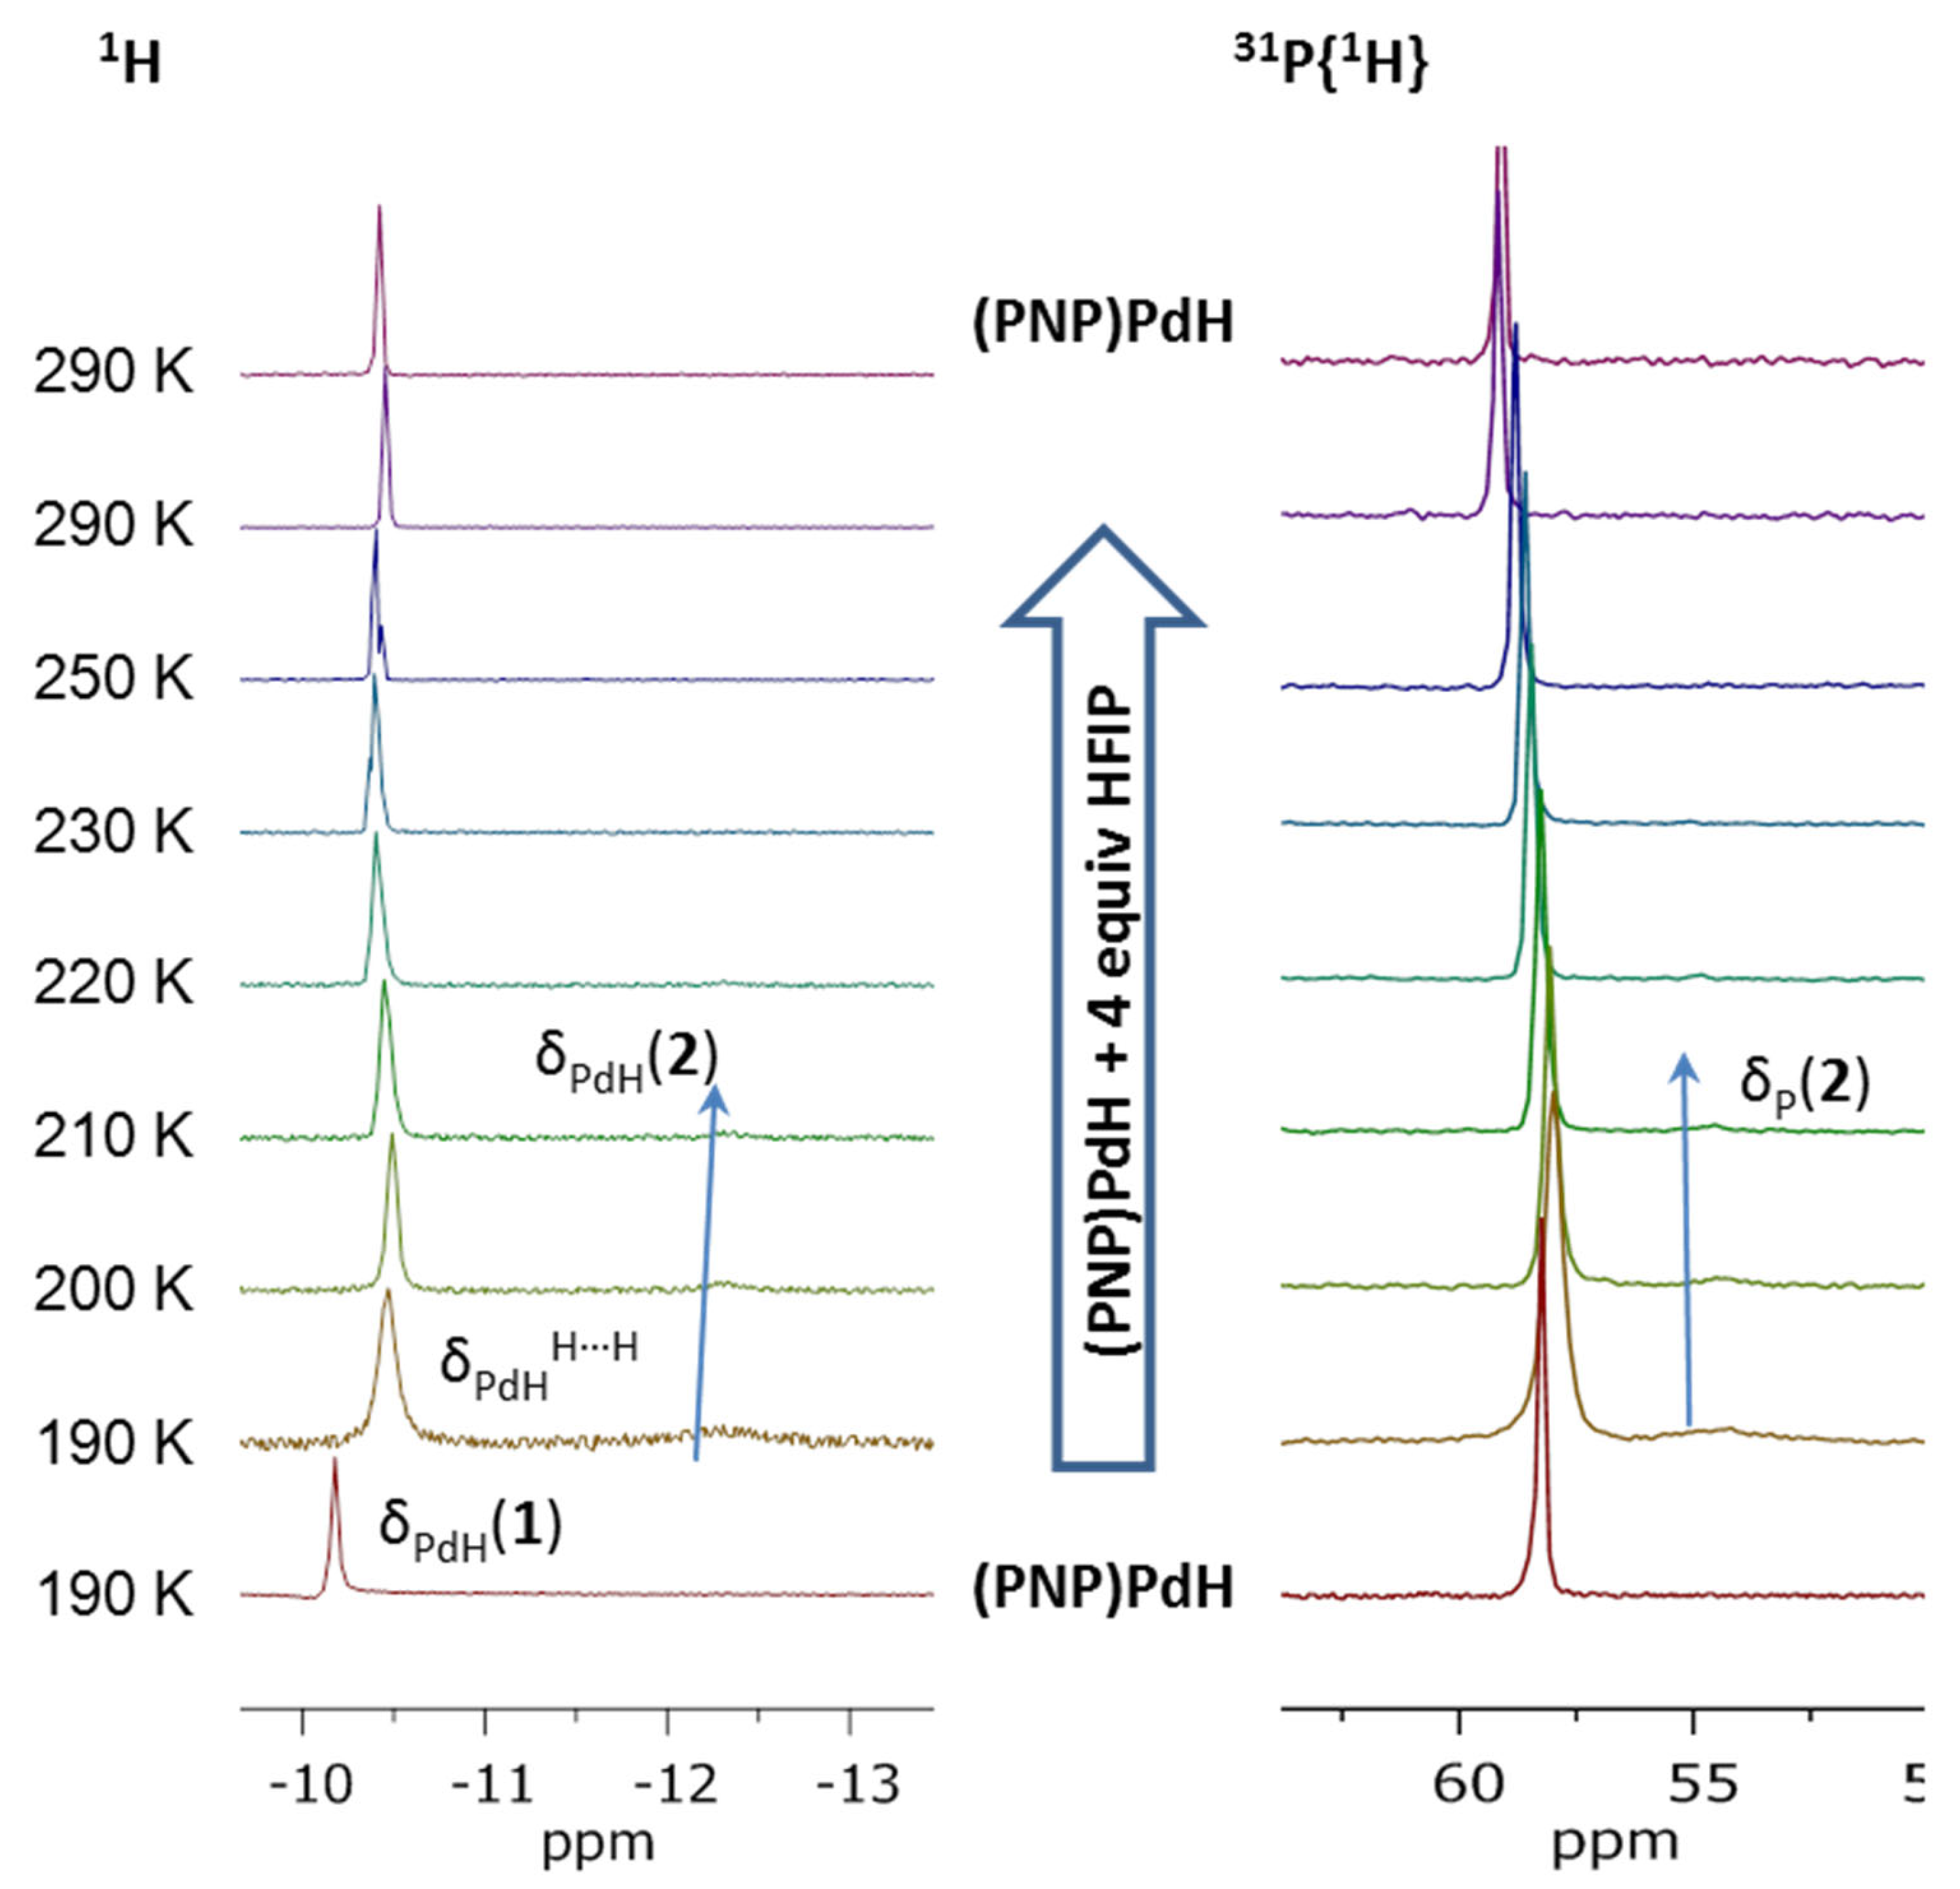
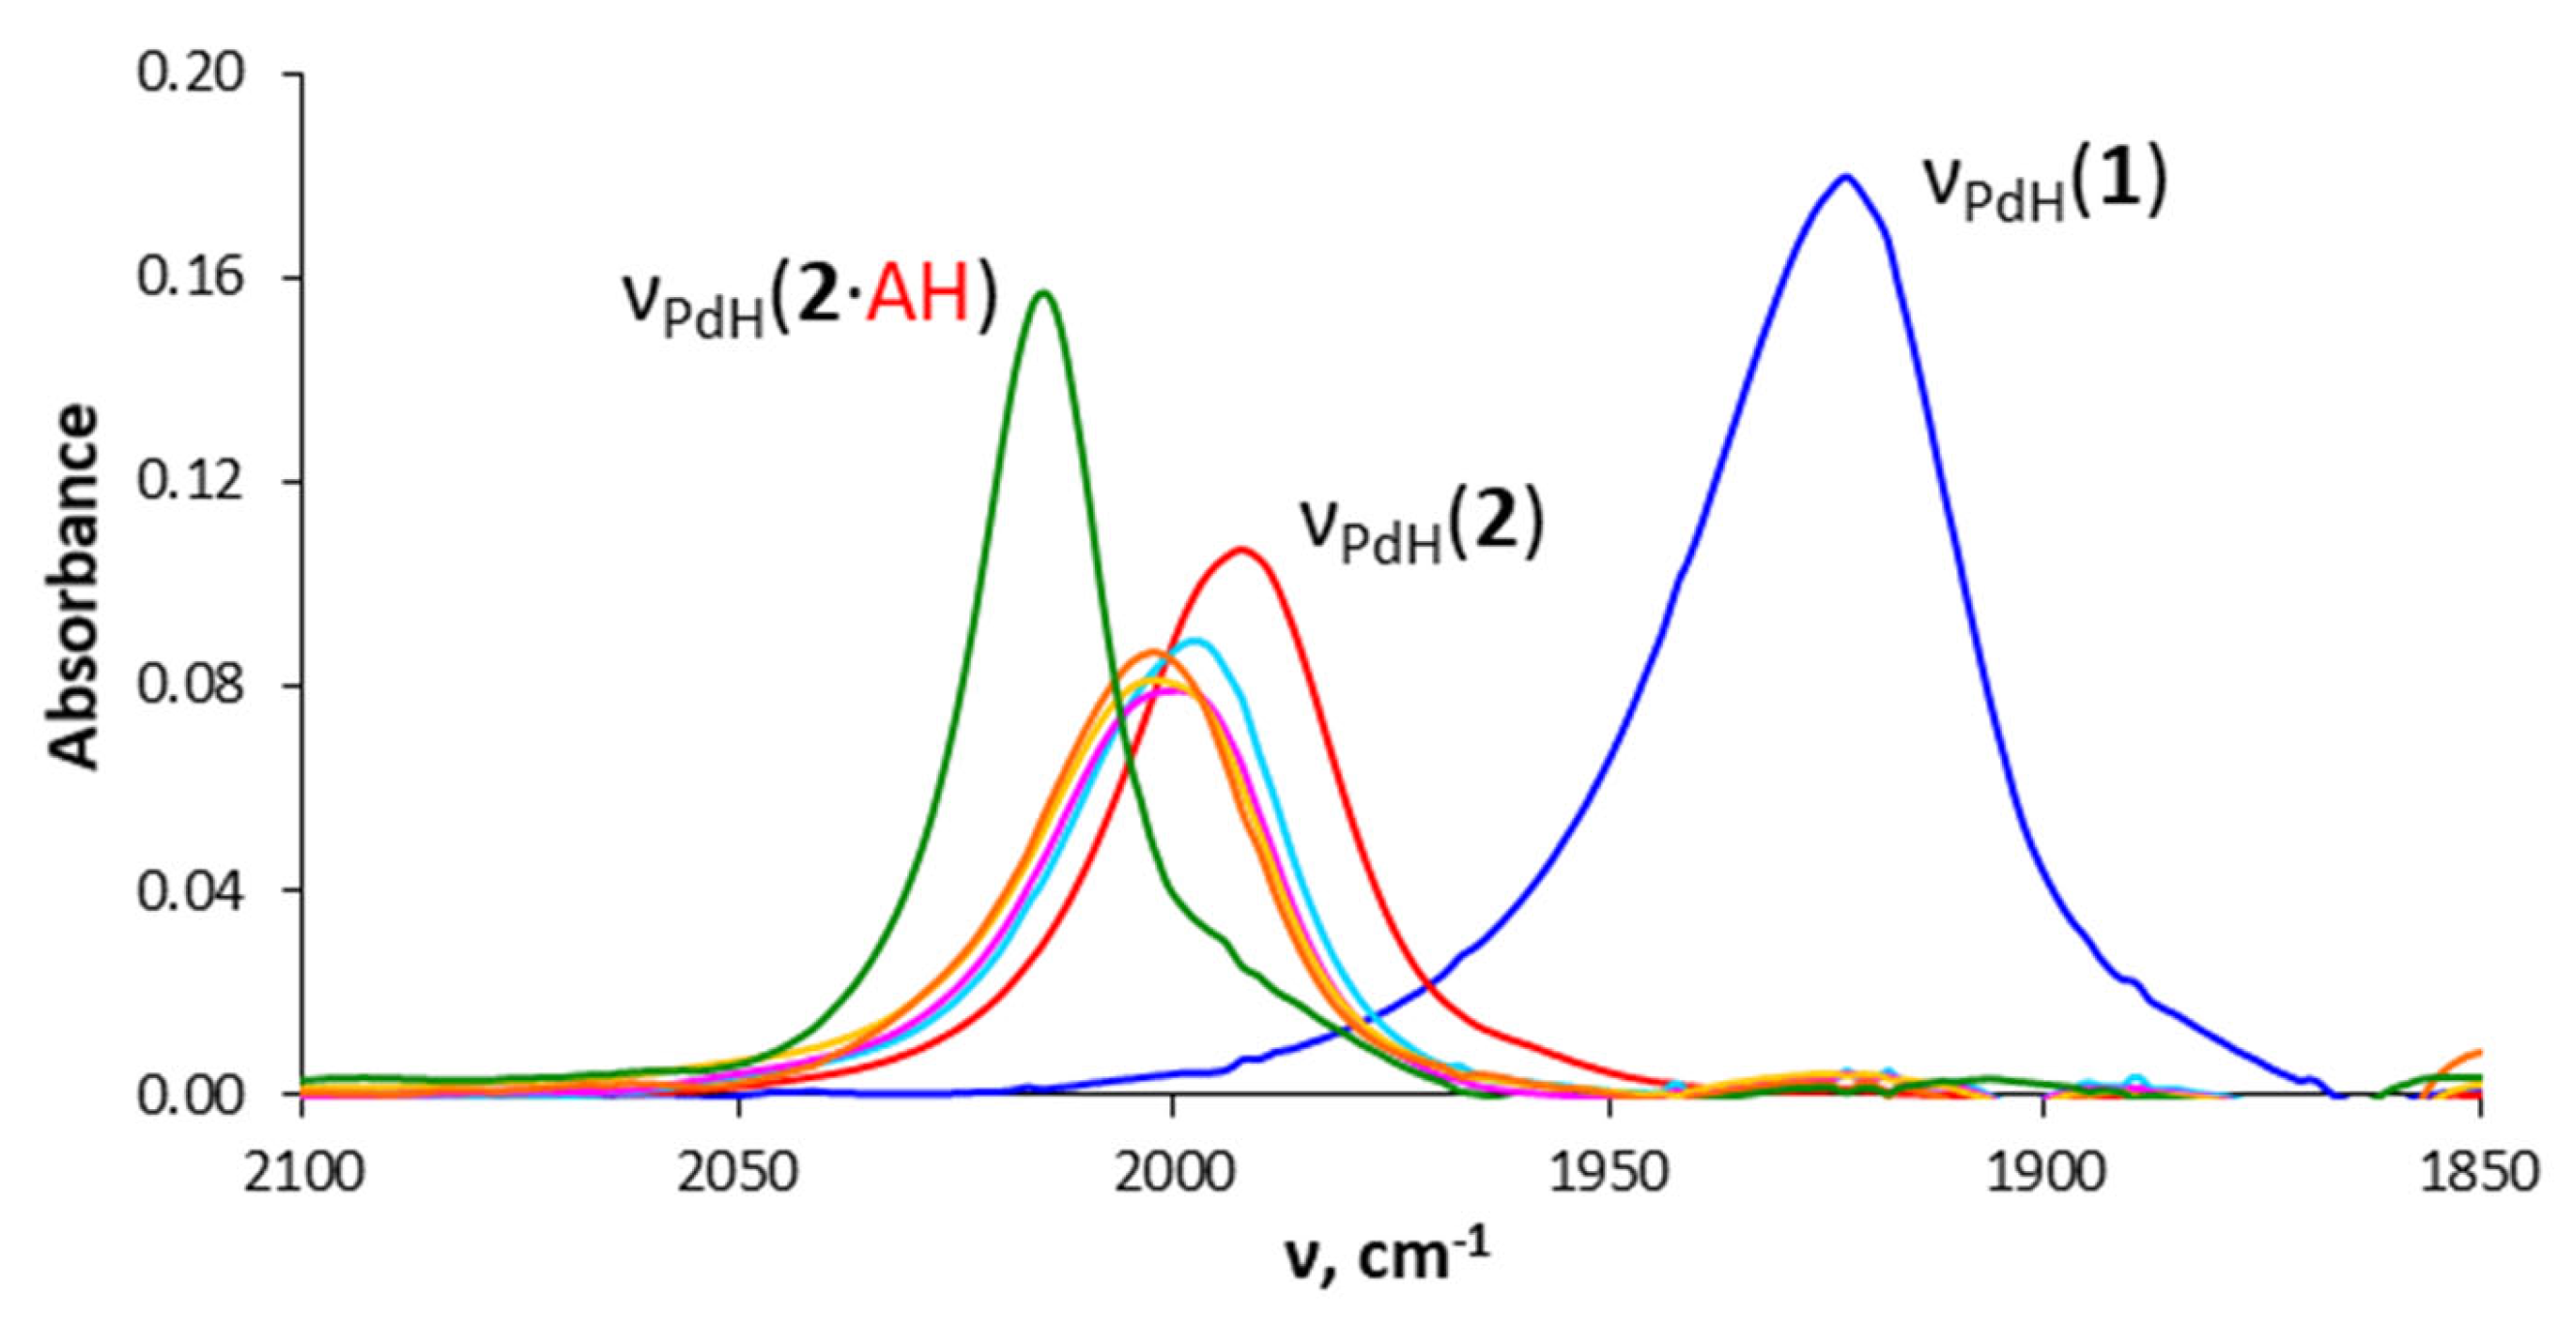
2.2. Interaction with Fluorinated Alcohols

To study the proton transfer equilibria involving 1 in more detail, we used moderately strong acids—fluorinated alcohols (CF3)nCH3-nOH (n = 1–3). The most acidic of them, perfluorinated tert-butanol (CF3)3COH (PFTB, pKa = 20.5 in CH3CN [10]), protonates the nitrogen atom of 1. Taken in a slight excess (5 equiv.) at 190 K in toluene, it creates changes in the IR spectra similar to those observed with TfOH: new hydride (νPdH = 1994 cm−1) and N-H (νNH = 2806 cm−1) stretching vibration bands appear (Figure 1 and Figure S4). Under these conditions, only half of the hydride complex 1 is protonated, and the equilibrium shifts back to the starting compounds upon warming to 250 K, restoring the intensity of the νPdH(1) band (Figure S5). These spectral changes allow the estimation of the equilibrium constant and the calculation of thermodynamic parameters for the proton transfer to the nitrogen atom of the PNP ligand (Figure S6): ΔH° = −2.6 kcal·mol−1, ΔS° = −9.8 cal·mol−1·K−1.
Interestingly, in neat PFTB, we observed a composite band (Figure 1) built by overlapping the νPdH(2[OC(CF3)3]) band at 1994 cm−1 and a new band at even higher frequencies νPdH = 2013 cm−1. The corresponding νOH band at 3268 cm−1 (Figure S4) is shifted to a lower frequency relative to the band of free alcohol νOH(PFTB) = 3470 cm−1 which suggests its involvement in a hydrogen bond [15].
The alcohol of the lowest acidity in the series—2,2,2-trifluoroethanol (TFE; pKa = 35.3 in MeCN [16])—binds to a hydride ligand forming the dihydrogen-bonded complex (PNP)PdH···HOCH2CF3. The addition of the 30-fold excess TFE to the solution of 1 in toluene at 190 K leads to a low-frequency shift of its νPdH band from 1928 cm−1 to 1924 cm−1 (Figure 2). Under similar conditions, 1H NMR spectra reveal a broadening and high-field shift of hydride resonance from δH −10.42 to −10.66 ppm at 295 K typical for dihydrogen bond formation [15]. The use of very large TFE excess (465 equiv., taken as 2/1 v/v mixture with benzene) not only makes these changes more pronounced but also allows us to observe the N-protonated species characterized by the νPdH band at 2009 cm−1 (Figure 2). The latter frequency is again higher than that of the νPdH(2[OTf]) band.
The use of (CF3)2CHOH (HFIP; pKa = 29.9 in MeCN [16]), the acidity of which is intermediate between PFTB and TFE, allows us to observe a whole variety of hydrogen-bonded and protonated species. At four-fold excess HFIP at 190 K, we observe in the IR spectra the lower frequency shoulder for the νPdH(1) band due to dihydrogen bonding (PNP)PdH···HOCH(CF3)2 and a band of the protonated complex νPdH(2[OCH(CF3)2]) at 1998 cm−1 (Figure 3). The formation of a dihydrogen-bonded complex under these conditions is confirmed by NMR spectra. The hydride resonance in 1H NMR spectra broadens and shifts high-field by 0.28 ppm (δPdH(1) = −10.18, δPdHH···H = −10.46 in toluene-d8 at 190 K; Figure 4) while its longitudinal spin-lattice relaxation time T1 decreases from 784.0 ms to 605.4 ms. At the same time, the singlet in the 31P NMR spectrum shifts to a stronger field by −0.26 ppm (δP(1) = 58.25, δPH···H = 57.99; Figure 4). NMR and IR spectra also confirm the presence of a protonated complex 2[OCH(CF3)2], the resonances of which (δPdH −12.33, δP 54.29) disappear at 220 K (Figure 4 and Figure S7).
The increase in the HFIP excess shifts the equilibrium toward species 2 protonated at nitrogen atom: in the presence of 8 equiv. HFIP, the new high-frequency band appears in the IR spectra at 190 K composed of two bands (Figure 3) — νPdH = 1998 cm−1 belonging to [(PN(H)P)PdH]+[OCH(CF3)2] (2[OCH(CF3)2]) and a second band at 2015 cm−1. The latter species become dominant when 1 is dissolved in the neat HFIP (Figure 3).
Thus, (PNP)PdH (1) can form a dihydrogen bond (PNP)PdH···HA with relatively weak proton donors, which should precede the proton transfer to a hydride and the formation of an η2-H2 species and dihydrogen evolution [15,17]. However, this reaction does not occur in the case of fluorinated alcohols, and the proton goes instead to the nitrogen atom of the amidophosphine pincer ligand (Scheme 3). The complexes 2[A] are characterized by a separate hydride resonance at ca. −12 ppm for all HA used, but the signal of their NH proton is clearly visible at ca. 10 ppm only for weakly binding anions—OTf and BF4. Interestingly, the corresponding νPdH band changes its position depending on the acid used shifting from 1991 cm−1 for OTf to 1998 cm−1 for OCH(CF3)2 (Table S1). Such a shift can be explained by hydrogen bonding NH+···A within the ion pair if we recall that the hydrogen bonding of 2[OTf] with acetonitrile, NH+···NCMe, also leads to a small high-frequency shift of νPdH(2[OTf]) (vide supra).
Another puzzling question is the nature of the complexes observed at high alcohol content, in which νPdH bands are observed above 2000 cm−1. We thought this effect could be caused by the hydrogen bonding of NH+ with the oxygen atoms of alcohols. To verify this hypothesis, we studied the interaction of HFIP with [(PN(H)P)PdH]+ (2) obtained by the reaction with HBF4·Et2O. An addition of 10 equiv. HFIP causes a high-frequency shift of νPdH by 5 cm−1PdH(2···AH) = 1997 cm−1) (Figure 5), whereas the progressive increase in HFIP excess shifts the νPdH band further to 2003 cm−1 (Figure 5). Based on DFT calculations on the example of 2TFE·[(PN(H)P)PdH]+ (vide infra), we assign this band to a hydrogen-bonded complex of 2 with two molecules of HFIP, in which an oxygen atom of one alcohol molecule interacts with a NH proton and the second one bridges it with Pd-H (Figure 6).

2.3. DFT Calculations

To rationalize the observed spectral behavior, we performed the DFT calculations on possible intermolecular adducts formed by 1 and 2 with acids and bases in toluene. Neutral hydride 1 readily forms hydrogen bonds with alcohols (exemplified by TFE) binding to the N atom as well as the hydride ligand (Figure 7) with nearly the same energy (ca. −9 kcal/mol on the ∆E scale; Table S3). The formation of an OH···N complex entails a high-frequency shift of νPdH (ΔνPdH = 18 cm−1) in contrast to the low-frequency shift found for dihydrogen-bonded PdH···HO (ΔνPdH = −34 cm−1; Table S3). It is worth noting that in the dihydrogen-bonded complex, the alcohol molecule approaches the hydride ligand in the direction orthogonal to the PNPPdH plane as reflected by the PdHH angle close to 90° while the OHH moiety is almost linear (Figure 7). Such geometry is not typical for group 10 metal hydrides [18] and was found for the platinum hydrido complexes featuring the significant impact of alcohol binding to the core metal [19].
For cationic complex 2, the computed frequency of Pd-H stretching vibration is 35 cm−1 higher than that for neutral 1 (Table S4). This difference is smaller than observed experimentally, probably because the calculations are performed for the “naked” cation and do not take into account solvation and counter-ion influence. Complex 2 can interact both with acids and bases, the reactivity toward the base being more pronounced. The model base—pyridine—effectively binds the NH+ proton (∆E = −12 kcal/mol) leading to the high-frequency shift of νdH by 9 cm−1 relative to the naked cation 2. Alcohol (TFE was considered as a model) interacts with 2 either as a base forming a NH+···O(H)R hydrogen bond or as an acid forming a hydrogen bond between the OH group and the PdH moiety, with the geometry resembling that of the dihydrogen-bonded complex of 1 with a slight inclination to the hydride ligand (Figure 8). Notably, both the OH···HPd and NH+···O(H)R interactions have nearly the same energy (∆E ≈ −7 kcal/mol) and lead to high-frequency shifts of the νPdH band (+36 and +9, respectively; Table S4). As we observed additional high-frequency shifts of νPdH(2) in the presence of excess alcohol in the experimental IR spectra (), we considered also a cyclic complex with two TFE molecules (2···(TFE)2, Figure 6), which appeared much more energetically favorable (∆E = −18.5 kcal/mol) than the OH···HPd and NH+···O(H)R bonds of 2 and also give a high-frequency shift of νPdH (+14 cm−1 relative to νPdH(2)).

2.4. Interaction with Formic Acid

The acidity of formic acid (pKa = 20.9 in CH3CN [20]) is comparable to that of PFTB. Surprisingly HCOOH exhibits a very peculiar reactivity in respect of 1 that depends on the acid excess. Taken closely to the stoichiometric amount (0.5–2.0 equiv. HCOOH to 1), it undergoes dehydrogenation to give CO2 and H2 (Equation (1)). The reaction can be followed by IR spectroscopy which shows the accumulation of CO2 (the νCO2 band is visible in toluene-d8; Figures S10 and S11) and the consumption of formic acid (FA, Figure S12). Analysis of the νCO(FAmonomer) band intensity changes shows the increase in the reaction rate and the increase in the FA excess up to two equivalents. However, a further increase in the acid content leads to a slower reaction and a very long time to reach a full conversion (more than 72 h for a 10/1 ratio FA/1). The absorbance of FA bands can be converted into concentration, and its dependence on time is linear in the zero-order coordinates [FAmonomer] vs. t (Figures S13 and S14) yielding reaction rate constants of ca. 10−7 M−1∙s−1 (Table 1).
HCOOH benzene or toluene 1 CO 2 + H 2
Both IR and NMR spectra show different forms of palladium complexes depending on the FA amount added. In the presence of 1–2 equiv. FA, the palladium hydride partially transforms into formate (PNP)Pd(OCHO) (3; Figure S15). Its NMR signals change their position in the course of the reaction shifting upon the FA consumption: δH(Pd-OCHO) = 8.24 (in the beginning, 7 min after mixing), 8.21 (in the end, 160 min), δP = 49.1 (12 min) and 48.0 (160 min) (Figure S16). That can be due to hydrogen bonding (PNP)Pd-OCHO···HOOCH that assists the formic acid dehydrogenation [21]. A further increase in the acid content initiates the proton transfer to the nitrogen atom of (PNP)PdH. At a 10-fold FA excess, the palladium complex exists in two forms: protonated [(PN(H)P)PdH]+[OCHO] (2[OCHO], νPdH = 1993 cm−1, δPdH −11.94, δNH 10.70, δP 56.5) and (PNP)Pd-OCHO (Figure S17). The latter is hydrogen-bonded to the acid excess as suggested by the shift in its signals: δH(Pd-OCHO) = 8.27 and δP = 49.9–50.2 relative to non-bonded 3 (8.21 and 48.0 ppm, respectively; Figures S16 and S17). At the very beginning of the reaction, the low-frequency shifted νPdH at 1917 cm−1 (Figure S15) and δPdH -11.8 (Figure S17) are visible in the spectra which could be due to the formation of hydrogen-bonded species featuring Pd-H···HOOCH, N···HOOCH, and NH+···OCHO bonds.
Dihydrogen bonding (PNP)PdH···HOOCH (δPdH = −10.26, δP = 57.9) precedes the proton transfer to a hydride ligand and formation of an unstable η2-H2 complex that immediately loses H2 to yield palladium formate. The latter loses CO2, restoring the starting (PNP)PdH (1) (Scheme 4). This FA dehydrogenation reaction is the only one that occurs with 1 at close to a stoichiometric amount of formic acid (1–2 equiv.). A very fast formation of formate 3 and zero-order reaction kinetics suggest the β-hydride migration and CO2 elimination is a rate-determining step (rds, Scheme 4).
At higher FA excess, the competing protonation of the ligand’s nitrogen takes place, withdrawing the hydride 1 from the dehydrogenation reaction. Based on the data described herein, we can argue that involvement of the formic acid excess in various hydrogen bonds, such as NH+···O=CHOH, N···HOOCH, PdH···HOOCH, Pd-OCHO···HOOCH, and their combination, hampers the dehydrogenation reaction. The experiments with the portioned addition of HCOOH (by 2 equiv.) to 1 show that avoiding the presence of high FA excess allows running at least three cycles before the reaction slows down.

3. Materials and Methods

All reactions were performed using standard Schlenk procedures under a dry argon atmosphere. Dry and oxygen-free organic solvents (toluene, heptane, pentane, THF, CH2Cl2, ethanol) were obtained using a solvent purification system from M. Braun (Garching, Germany). Deuterated solvents (toluene-d8, benzene-d6) for NMR and IR were degassed before use by three freeze–pump–thaw cycles and kept over 3 Å molecular sieves. A liquid nitrogen/isopropanol slush bath was used to maintain samples at the desired low temperature.
Variable-temperature (VT) NMR spectra were recorded on Bruker Avance 300, Bruker Avance 400 (Bruker, Billerica, MA, USA), and Varian Inova 400 (Varian, Palo Alto, CA, USA) spectrometers operating at 300 and 400 MHz in the 180–300 K temperature range. 1H chemical shifts are reported in parts per million (ppm) downfield of tetramethylsilane (TMS) and were calibrated against the residual resonance of the deuterated solvent, while 31P{1H} chemical shifts were referenced to 85% H3PO4 with downfield shift taken as positive. The IR spectra were recorded at different temperatures (190–295 K) using a home-modified cryostat (Carl Zeiss Jena) with a Nicolet iS50 FTIR (Thermo Scientific, Waltham, MA, USA) spectrometer using 0.05–0.2 cm CaF2 cells. The accuracy of the experimental temperature adjustment was ±0.5 °C. The cryostat modification allowed the transfer of the reagents (premixed at either low or room temperature) under an inert atmosphere directly into the cells.
All reagent-grade chemicals purchased from commercial sources were used as received.
Complex (PNP)PdH (1) was prepared as described in the literature [7]. Complex 1 was crystalized from the toluene/hexane mixture at −35 °C. Crystals of 1 (C33H49NP2Pd, M = 628.07) were monoclinic, space group P21/c, at 100 K: a = 12.1794(2), b = 9.6190(2), c = 27.9618(5) Å, β = 94.7130(10)°, V = 3264.75(10) Å3, Z = 4 (Z’ = 1), dcalc = 1.278 gcm–3, μ(MoKα) = 6.87 cm−1, F(000) = 1320. Intensities of 167,806 reflections were measured with a Bruker Quest D8 CMOS diffractometer [λ(MoKα) = 0.71073 Å, ω-scans, 2θ < 90°], and 26,761 independent reflections were used in further refinement. Using Olex2 [22], the structures were solved with the ShelXT structure solution program [23] using Intrinsic Phasing and refined with the XL refinement package [24] using least-squares minimization. The hydrogen atom at the metal ion was located from the difference Fourier synthesis and refined in the isotropic approximation. The positions of other hydrogen atoms were calculated, and they were refined in the isotropic approximation within the riding model. The refinement converged to wR2 = 0.1038 and GOF = 1.070 for all the independent reflections (R1 = 0.0405 was calculated against F for 21,611 observed reflections with I > 2σ(I)). CCDC 2257866 contains supplementary crystallographic information.
Structures of reactants and complexes were optimized at the ωB97-XD level [25] applying the def2-TZVP basis set [26] by Gaussian 09 [27]. Optimizations were performed without any restriction in the gas phase and then in toluene introduced by the SMD solvent model [28]. Vibrational frequencies were calculated for all optimized complexes at the same level of theory to confirm a character of local minima on the potential energy surface. Frequencies are reported without any scaling factors.
a.
General procedure for the interaction of 1 with TfOH and HBF4 and of 2 with bases
The solution of (PNP)PdH (1, c = 0.02–0.06 M) was prepared at inert atmosphere at room temperature in toluene, toluene-d8 or benzene-d6. Then, it was placed into a cell (0.05–0.2 cm, for IR measurements) or into an NMR tube (for NMR measurements) under an inert atmosphere. After spectra of the initial complex were acquired, the necessary amount of stock acid solution (1 M, to obtain 1 or 1.1 equivalents of TfOH or HBF4) was added exactly to the cell or NMR tube. After spectra of [(PN(H)P)PdH]+[A] (2[A]), generated in situ, were acquired, the necessary amount of stock base solution (1 M) or neat base (Py, HMPA, MeCN) was added exactly to the cell or NMR tube.
b.
General procedure for the interaction of 1 with fluorinated alcohols
For variable temperature IR studies.
The solution of (PNP)PdH (1, c = 0.02–0.06 M) was prepared at inert atmosphere at room temperature in toluene, toluene-d8, or benzene-d6. Then, it was placed into a cryostat (CaF2 cell, l = 0.05–0.2 cm) and cooled to 190 K. After spectra of the initial complex were acquired at different temperatures in the range 190 to 290 K, the solution from the cryostat was put back in the Schlenk tube and mixed with stock solution (0.5–1 M) of corresponding fluorinated alcohol or neat alcohol (TFE, HFIP, PFTB; 1–30 eq., c = 0.02–1.2 M) kept at 190 K in a liquid nitrogen/iPrOH slush bath. The mixture obtained was quickly returned to the cryostat, and IR spectra were monitored in the 190–290 K temperature range.
For variable temperature NMR studies.
The solution of (PNP)PdH (1, c = 0.02–0.06 M) was prepared at inert atmosphere at room temperature in toluene-d8 or benzene-d6. Then, it was placed into an NMR tube and cooled to 190 K. After spectra of the initial complex were acquired at different temperatures in the range 190 to 290 K, the stock solution (0.5–1 M) of corresponding fluorinated alcohol (HFIP, PFTB; 1–8 eq., c = 0.02–0.2 M) was added exactly to the NMR tube kept at 190 K in a liquid nitrogen/iPrOH slush bath. NMR spectra were monitored in the 190–290 K temperature range.
For IR and NMR studies at room temperature.
The solution of (PNP)PdH (1, c = 0.02–0.08 M) was prepared in a Schlenk tube at inert atmosphere at room temperature in toluene, toluene-d8, benzene-d6 or neat alcohol (TFE, HFIP, PFTB). Then, the necessary amount neat alcohol or its stock solution (1 M) was added. The resulting solution was placed into a cell (0.05–0.2 cm, for IR measurements) or into an NMR tube (for NMR measurements) under an inert atmosphere. In some cases, the solution after IR measurements was put in an NMR tube to acquire NMR spectra.
c.
General procedure for the studies of interaction of 1 with formic acid
Variable temperature IR and NMR studies of interaction between 1 and formic acid were carried out as described above for interactions between 1 and fluorinated alcohols.
For IR and NMR kinetic studies at room temperature. the solution of (PNP)PdH (1, c = 0.02 M) was prepared in a Schlenk tube at inert atmosphere at room temperature in toluene, toluene-d8 or benzene-d6. Then, the necessary amount of formic acid stock solution (1 M; 0.5–10 eq., c = 0.01–0.2 M) was added. The resulting solution was quickly placed into a cell (0.1 cm, for IR measurements) or into a Young NMR tube (for NMR measurements) under an inert atmosphere.
d.
Formic acid monomer concentration calculation.
The concentration of formic acid monomer, to obtain reaction rate constant of its dehydrogenation, was calculated using the Bouguer–Beer–Lambert law D = ε·l·c, taking ε(FAmonomer, 1746 cm−1) = 1246 [21].

4. Conclusions

Thus, the results of the IR and NMR spectroscopic study of the interaction between (PNP)PdH (1) and different acids show that the nitrogen atom of the amidophosphine pincer ligand readily interacts not only with strong Brønsted acids such as CF3SO3H but with relatively weak fluorinated alcohols. This is the result of the nitrogen binding to palladium(II) which increases the diarylamine basicity (for comparison, pKa(Ph2NH2+) = 5.98 and pKa(Ph2MeNH+) = 6.52 in MeCN [13]) making it a strong base probably due to the better delocalization of the acquired positive charge in the presence of a transition metal. Nevertheless, H+ can be taken from [(PN(H)P)PdH]+ (2) by pyridine (pKa (PyH+) = 12.53 in MeCN) or HMPA (pKa (HMPA-H+) = 6.1 in MeNO2). These observations confirm the need for a shuttle base for the heterolytic splitting of H2 by [(PNP)Pd]+ to form [(PN(H)P)PdH]+ (2).
Still, formic acid (pKa = 20.9 in CH3CN) appears to be able to protonate a hydride ligand yielding an unstable η2-H2 complex that rapidly converts into a formate complex (PNP)Pd(OCHO). The CO2 elimination from the latter is the rate-determining step for formic acid dehydrogenation in the presence of (PNP)PdH. However, the relatively high acid excess hampers this reaction through competitive protonation at nitrogen atom yielding [(PN(H)P)PdH]+ and the formation of a variety of hydrogen bonds with 1 or 2.

Supplementary Materials

The following supporting information can be downloaded at: https://www.mdpi.com/article/10.3390/inorganics11050212/s1: IR and NMR spectroscopic characterization of different Pd(II) complexes; details of kinetic parameters determination, computed frequencies, and energies. Table S1: Key spectral parameters of (PNP)PdH (1) in toluene-d8; Table S2: Key spectral parameters of palladium complexes formed by the interaction of 1 with acids; Table S3: DFT calculated frequencies of PdH stretching vibrations and formation energies of 1 and its bimolecular complexes with TFE in toluene; Table S4: DFT calculated frequencies of PdH stretching vibrations and formation energies of 2 and its non-covalent adducts with pyridine and TFE; Figure S1: IR spectra of (PNP)PdH, TfOH and their mixture in toluene-d8 at 295 K; Figure S2: IR spectra of (PNP)PdH, with 1 equivalent of H[BF4]·Et2O and their mixture with pyridine in benzene-d6 at 295 K; Figure S3: IR spectra in νPdH stretching vibrations region of [(PN(H)P)PdH]+[BF4], with 5, 20, 50 and 100 equivalents of MeCN in benzene-d6, 295 K; Figure S4: IR spectra in the PdH stretching vibrations region of (PNP)PdH, with 5 equiv. PFTB in toluene-d8 and in neat PFTB; Figure S5: IR spectra of νCO stretching vibrations region of (PNP)PdH with 5 equiv. PFTB in toluene-d8 at 190–295 K; Figure S6: The temperature dependence of equilibrium constant for 1 + PFTB ↔ 2[OC(CF3)3] in toluene-d8; Figure S7: IR spectra of νPdH stretching vibrations region of (PNP)PdH and with 4 equiv. HFIP in toluene-d8 at 190–295 K; Figure S8: IR spectra of νCO stretching vibrations region of HCOOH with 0.5 equiv. (PNP)PdH in toluene at 190–290 K; Figure S9: IR spectra of νCO stretching vibrations region of HCOOH and with 0.5 equiv. (PNP)PdH in toluene at 190 K; Figure S10: IR spectra of νCO stretching vibrations region of CO2 evolved from HCOOH with 0.5 equiv. (PNP)PdH in toluene-d8 at 295 K, t = 80–10,000 s; Figure S11: Kinetics of CO2 evolution from formic acid, monitored by change of νCO2 band intensity for the mixture of (PNP)PdH with 0.5, 1, 2, 5 and 10 equiv. HCOOH; Figure S12: IR spectra of νPdH of (PNP)PdH and νCO of HCOOH stretching vibrations regions in toluene-d8 at 295 K, t = 80–10,000 s; Figure S13: Kinetics of formic acid decomposition, monitored by change of νCO(FAmonomer) band intensity for the mixture of (PNP)PdH with 0.5, 1 and 2 equiv. HCOOH; Figure S14: Kinetics of formic acid decomposition, monitored by change of νCO(FAmonomer) band intensity for the mixture of (PNP)PdH with 5 equiv. HCOOH; Figure S15: IR spectra in the νPdH stretching vibrations region of (PNP)PdH in the presence of 0.5, 1, 2, 5 and 10 equiv. HCOOH measured in 150 s after mixing; Figure S16: 31P{1H} and 1H NMR monitoring of (PNP)PdH with 2 equiv. HCOOH; Figure S17: 31P{1H} and 1H NMR monitoring of (PNP)PdH with 10 equiv. HCOOH in benzene-d6, 295 K.

Author Contributions

Investigation, V.A.K. (Vladislava A. Kirkina), V.A.K. (Vasilisa A. Kulikova), E.I.G., I.F.S., Z.N.G. and D.G.Y.; Y.V.N.—XRD study; DFT calculations—O.A.F.; Writing—Original Draft Preparation, V.A.K. (Vladislava A. Kirkina) and N.V.B.; Writing—Review and Editing, N.V.B.; Supervision, E.S.S. and N.V.B. All authors have read and agreed to the published version of the manuscript.

Funding

This work was financially supported by the Russian Science Foundation (grant No. 21-73-00302).

Data Availability Statement

The data presented in this study are available in the article or Supplementary Material.

Acknowledgments

The NMR and X-ray diffraction data were collected using the equipment of the Center for Molecular Composition Studies of INEOS RAS with the support from the Ministry of Science and Higher Education of the Russian Federation (Contract No. 075-03-2023-642). Z.N.G., I.F.S., and D.G.Y. thank the Ministry of Science and Higher Education for the support of FRC Kazan Scientific Center of RAS and CSF-SAC FRC KSC RAS providing the facilities to carry out this work. D.G.Y. acknowledges the Kazan Federal University Strategic Academic Leadership Program (PRIORITY-2030).

Conflicts of Interest

The authors declare no conflict of interest.

References and Notes

  1. van Koten, G.; Milstein, D. (Eds.) Organometallic Pincer Chemistry; Topics in Organometallic Chemistry; Springer: Berlin/Heidelberg, Germany, 2013; Volume 40. [Google Scholar] [CrossRef]
  2. Alig, L.; Fritz, M.; Schneider, S. First-Row Transition Metal (De)Hydrogenation Catalysis Based on Functional Pincer Ligands. Chem. Rev. 2019, 119, 2681–2751. [Google Scholar] [CrossRef]
  3. Piccirilli, L.; Lobo Justo Pinheiro, D.; Nielsen, M. Recent Progress with Pincer Transition Metal Catalysts for Sustainability. Catalysts 2020, 10, 773. [Google Scholar] [CrossRef]
  4. Khusnutdinova, J.R.; Milstein, D. Metal–Ligand Cooperation. Angew. Chem. Intern. Ed. 2015, 54, 12236–12273. [Google Scholar] [CrossRef]
  5. Belkova, N.V.; Filippov, O.A.; Osipova, E.S.; Safronov, S.V.; Epstein, L.M.; Shubina, E.S. Influence of phosphine (pincer) ligands on the transition metal hydrides reactivity. Coord. Chem. Rev. 2021, 438, 213799. [Google Scholar] [CrossRef]
  6. Kumar, A.; Daw, P.; Milstein, D. Homogeneous Catalysis for Sustainable Energy: Hydrogen and Methanol Economies, Fuels from Biomass, and Related Topics. Chem. Rev. 2022, 122, 385–441. [Google Scholar] [CrossRef]
  7. Fan, L.; Foxman, B.M.; Ozerov, O.V. N−H Cleavage as a Route to Palladium Complexes of a New PNP Pincer Ligand. Organometallics 2004, 23, 326–328. [Google Scholar] [CrossRef]
  8. Gregor, L.C.; Chen, C.-H.; Fafard, C.M.; Fan, L.; Guo, C.; Foxman, B.M.; Gusev, D.G.; Ozerov, O.V. Heterolytic splitting of H-X bonds at a cationic (PNP)Pd center. Dalton Trans. 2010, 39, 3195–3202. [Google Scholar] [CrossRef] [PubMed]
  9. Although the synthesis of (PNP)PdH (1) has been described in reference 7, its structure was determined by X-ray diffraction in this work for the first time. See CCDC 2257866 for crystallographic information.
  10. Raamat, E.; Kaupmees, K.; Ovsjannikov, G.; Trummal, A.; Kütt, A.; Saame, J.; Koppel, I.; Kaljurand, I.; Lipping, L.; Rodima, T.; et al. Acidities of strong neutral Brønsted acids in different media. J. Phys. Org. Chem. 2013, 26, 162–170. [Google Scholar] [CrossRef]
  11. Fourmond, V.; Jacques, P.-A.; Fontecave, M.; Artero, V. H2 Evolution and Molecular Electrocatalysts: Determination of Overpotentials and Effect of Homoconjugation. Inorg. Chem. 2010, 49, 10338–10347. [Google Scholar] [CrossRef]
  12. Fong, T.P.; Forde, C.E.; Lough, A.J.; Morris, R.H.; Rigo, P.; Rocchini, E.; Stephan, T. Synthesis of the acidic dihydrogen complexes trans-[M(H2)(CN)L2]+ and trans-[M(H2)(CNH)L2]2+ where M = Fe, Ru, Os and L = dppm, dppe, dppp, depe, and dihydrogen substitution by the trifluoromethanesulfonate anion to give trans-[Ru(OTf)(CN)L2] or trans-[Ru(OTf)(CNH)L2]OTf. J. Chem. Soc. Dalton Trans. 1999, 4475–4486. [Google Scholar] [CrossRef]
  13. Tshepelevitsh, S.; Kütt, A.; Lõkov, M.; Kaljurand, I.; Saame, J.; Heering, A.; Plieger, P.G.; Vianello, R.; Leito, I. On the Basicity of Organic Bases in Different Media. Eur. J. Org. Chem. 2019, 2019, 6735–6748. [Google Scholar] [CrossRef]
  14. Matrosov, E.I.; Tsvetkov, E.N.; Mironova, Z.N.; Malevannaya, R.A.; Kabachnik, M.I. Acid-base properties of phosphine oxides in nitromethane. Bull. Acad. Sci. USSR Chem. Sci. Div. 1975, 24, 1231–1234. [Google Scholar] [CrossRef]
  15. Belkova, N.V.; Epstein, L.M.; Filippov, O.A.; Shubina, E.S. Hydrogen and Dihydrogen Bonds in the Reactions of Metal Hydrides. Chem. Rev. 2016, 116, 8545–8587. [Google Scholar] [CrossRef] [PubMed]
  16. Estimated from the pKa value in DMSO using correlation equiation pKa(MeCN) = 12.31 + 0.98pKa(DMSO) from reference:Kuejtt, A.; Leito, I.; Kaljurand, I.; Soovaeli, L.; Vlasov, V.M.; Yagupolskii, L.M.; Koppel, I.A. A Comprehensive Self-Consistent Spectrophotometric Acidity Scale of Neutral Broensted Acids in Acetonitrile. J. Org. Chem. 2006, 71, 2829–2838. [Google Scholar] [CrossRef]
  17. Belkova, N.V.; Epstein, L.M.; Shubina, E.S. Dihydrogen Bonding, Proton Transfer and Beyond: What We Can Learn from Kinetics and Thermodynamics. Eur. J. Inorg. Chem. 2010, 2010, 3555–3565. [Google Scholar] [CrossRef]
  18. Osipova, E.S.; Belkova, N.V.; Epstein, L.M.; Filippov, O.A.; Kirkina, V.A.; Titova, E.M.; Rossin, A.; Peruzzini, M.; Shubina, E.S. Dihydrogen Bonding and Proton Transfer from MH vs. OH acids to Group 10 Metal Hydrides (tBuPCP)MH [tBuPCP = κ3-2,6-(tBu2PCH2)2C6H3; M = Ni, Pd]. Eur. J. Inorg. Chem. 2016, 2016, 1415–1424. [Google Scholar] [CrossRef]
  19. Filippov, O.A.; Kirkina, V.A.; Belkova, N.V.; Stoccoro, S.; Zucca, A.; Babakhina, G.M.; Epstein, L.M.; Shubina, E.S. First Example of Hydrogen Bonding to Platinum Hydride. Z. Phys. Chem. 2013, 227, 869–880. [Google Scholar] [CrossRef]
  20. Stirling, M.J.; Sweeney, G.; MacRory, K.; Blacker, A.J.; Page, M.I. The kinetics and mechanism of the organo-iridium-catalysed enantioselective reduction of imines. Org. Biomol. Chem. 2016, 14, 3614–3622. [Google Scholar] [CrossRef]
  21. Osipova, E.; Sedlova, D.; Gutsul, E.; Nelyubina, Y.; Dorovatovskii, P.; Epstein, L.; Filippov, O.; Shubina, E.; Belkova, N. Reactivity of heterobimetallic ion pairs in formic acid dehydrogenation. Organometallics 2023. [Google Scholar] [CrossRef]
  22. Dolomanov, O.V.; Bourhis, L.J.; Gildea, R.J.; Howard, J.A.K.; Puschmann, H. OLEX2: A complete structure solution, refinement and analysis program. J. Appl. Cryst. 2009, 42, 339–341. [Google Scholar] [CrossRef]
  23. Sheldrick, G. SHELXT—Integrated space-group and crystal-structure determination. Acta Crystallogr. A 2015, 71, 3–8. [Google Scholar] [CrossRef] [PubMed]
  24. Sheldrick, G. A short history of SHELX. Acta Crystallogr. A 2008, 64, 112–122. [Google Scholar] [CrossRef] [PubMed]
  25. Chai, J.-D.; Head-Gordon, M. Long-range corrected hybrid density functionals with damped atom-atom dispersion corrections. PCCP 2008, 10, 6615–6620. [Google Scholar] [CrossRef] [PubMed]
  26. Weigend, F.; Ahlrichs, R. Balanced basis sets of split valence, triple zeta valence and quadruple zeta valence quality for H to Rn: Design and assessment of accuracy. PCCP 2005, 7, 3297–3305. [Google Scholar] [CrossRef] [PubMed]
  27. Frisch, M.J.; Trucks, G.W.; Schlegel, H.B.; Scuseria, G.E.; Robb, M.A.; Cheeseman, J.R.; Scalmani, G.; Barone, V.; Petersson, G.A.; Nakatsuji, H.; et al. Gaussian 09, Revision D.01; Gaussian, Inc.: Wallingford, CT, USA, 2016. [Google Scholar]
  28. Marenich, A.V.; Cramer, C.J.; Truhlar, D.G. Universal Solvation Model Based on Solute Electron Density and on a Continuum Model of the Solvent Defined by the Bulk Dielectric Constant and Atomic Surface Tensions. J. Phys. Chem. B 2009, 113, 6378–6396. [Google Scholar] [CrossRef] [PubMed]
Scheme 1. Dihydrogen addition to cationic palladium complex 3. A = OTf.
Inorganics 11 00212 sch001
Scheme 2. (PNP)PdH (1) interaction with Brønsted acids. Molecular structure of 1 is shown with the thermal ellipsoids at 30% probability. Hydrogen atoms except the hydride ligand are omitted for clarity. Selected bond lengths (in Å) and angles (in deg.): Pd(1)-H, 1.84(3), Pd(1)-P(1) 2.2589(6), Pd(1)-P(2) 2.2604(7), Pd(1)-N(1) 2.0855(9), P(1)-Pd(1)-P(2) 164.88(2), N(1)-Pd(1)-H 177.5(8). B = base.
Inorganics 11 00212 sch002
Figure 1. IR spectra in the PdH stretching vibrations region of (PNP)PdH at 190 K (c = 0.032 M in toluene-d8; blue, normalized intensity*), with 5 equiv. PFTB in toluene-d8 at 190 K (purple), and in neat PFTB at 295 K (c = 0.032 M; green). Green dashed lines show the result of the band deconvolution. *—multiplied to make the intensity of νPdH(1) band equal to the intensity in the maximum point (1928 cm−1) for νPdH in 1/PFTB mixture.
Inorganics 11 00212 g001
Figure 2. IR spectra (normalized intensities) in the νPdH stretching vibrations region of (PNP)PdH (c = 0.04 M; blue) * and (PNP)PdH in the presence of 30 equiv. TFE (purple) at 190 K; (PNP)PdH (c = 0.04 M; sky blue) ** and (PNP)PdH in the presence of 465 equiv. TFE (green) *** at 295 K. Toluene-d8, l = 0.1 cm. *—multiplied to make the intensity of the νPdH(1) band at 190 K (blue line) equal to that in the mixture with 30 equiv. TFE. **—multiplied by the same coefficient as applied to blue line. ***—multiplied to make the intensity in the maximum point (1923 cm−1) equal to that of the νPdH(1) band at 295 K (sky blue line).
Inorganics 11 00212 g002
Figure 3. IR spectra (normalized intensities) in the νPdH stretching vibrations region of (PNP)PdH at 190 K (c = 0.025 M; blue) *, in the presence of 4 (red) * and 8 (purple) equiv. HFIP at 190 K in toluene-d8, and in neat HFIP at 295 K (c = 0.025 M; green). Dashed lines are the result of band deconvolution; grey dashed line is for the HFIP band. * —multiplied to make the intensity of νPdH(1) band equal to that in the mixture with 8 equiv. HFIP.
Inorganics 11 00212 g003
Figure 4. 1H (300 MHz, left) and 31P{1H} (121.5 MHz, right) NMR spectra of (PNP)PdH (1) at 190 K (bottom line) and 290 K (top line) and in the presence of 4 equiv. HFIP in 190–290 K temperature range. c(1) = 0.04 M, toluene-d8.
Inorganics 11 00212 g004
Scheme 3. The mechanism of (PNP)PdH (1) interaction with acids.
Inorganics 11 00212 sch003
Figure 5. IR spectra in the νPdH stretching vibrations region of [(PN(H)P)PdH]+[BF4] (2[BF4], c = 0.02 M) (red), with 10 (sky blue), 20 (purple), 30 (yellow), and 50 (orange) equivalents of HFIP in benzene-d6 and in neat HFIP (green), 295 K, l = 0.1 cm.
Inorganics 11 00212 g005
Figure 6. Hydrogen bonding cycle in trimolecular complex 2RFOH·[(PN(H)P)PdH]+ and DFT optimized structure of 2···(TFE)2. Key distances (in Å) are given. Aryl and i-propyl groups of the pincer ligand are shown as a wireframe.
Inorganics 11 00212 g006
Figure 7. DFT-optimized structures of hydrogen-bonded complexes between 1 and TFE. Key distances (in Å) and angles (in deg.) are given. Aryl and i-propyl groups of the pincer ligand are shown as a wireframe.
Inorganics 11 00212 g007
Figure 8. DFT optimized structures of hydrogen-bonded complexes between 2 and TFE. Key distances (in Å) and angles (in deg.) are given. Aryl and i-propyl groups of the pincer ligand are shown as a wireframe.
Inorganics 11 00212 g008
Scheme 4. The mechanism of (PNP)PdH (1) interaction with formic acid.
Inorganics 11 00212 sch004
Table 1. Kinetic data for formic acid dehydrogenation in presence of (PNP)PdH.
FA Amount,
Equiv.
keff, M−1·s−1t of Full FA Conversion
0.53.5·10−740 min
13.5·10−740 min
24.1·10−72.5 h
59.1·10−8more than 24 h
10 Ca. 10% conversion after 3 days
Disclaimer/Publisher’s Note: The statements, opinions and data contained in all publications are solely those of the individual author(s) and contributor(s) and not of MDPI and/or the editor(s). MDPI and/or the editor(s) disclaim responsibility for any injury to people or property resulting from any ideas, methods, instructions or products referred to in the content.

