Article

Tetragonal Nanosized Zirconia: Hydrothermal Synthesis and Its Performance as a Promising Ceramic Reinforcement

School of Materials Science and Engineering, Henan University of Technology, Zhengzhou 450000, China
*
Author to whom correspondence should be addressed.
Inorganics 2023, 11(5), 217; https://doi.org/10.3390/inorganics11050217
Submission received: 11 April 2023 / Revised: 12 May 2023 / Accepted: 15 May 2023 / Published: 17 May 2023
(This article belongs to the Special Issue 10th Anniversary of Inorganics: Inorganic Materials)

Abstract

:
In this study, we produced zirconia nanoparticles with a pure tetragonal phase, good dispersion, and an average particle size of approximately 7.3 nm using the modified hydrothermal method. Zirconium oxychloride (ZrOCl2-8H2O) was used as zirconium source, while propanetriol was used as an additive. The influence of propanetriol content, sonication time, hydrothermal temperature, and type of dispersant on the physical phase and dispersibility of zirconia nanoparticles was investigated. Monoclinic zirconia was found to completely transform into a tetragonal structure when the mass fraction of glycerol was increased to 5 wt%. With the increase in the mechanical stirring time under ultrasonic conditions, the size distribution range of the prepared particles became narrower and then wider, and the particle size became first smaller and then larger. Ultrasonic and mechanical stirring for 5 min had the best effect. When comparing the effects of different dispersants (PEG8000, PVP, and CTAB), it was found that the average particle size of zirconia nanoparticles prepared with 0.5 wt% PVP was the smallest. Furthermore, by adding different concentrations of pure tetragonal phase nanozirconia to 3Y-ZrO2 as reinforcement additives, the bending strength of the prepared ceramics increased first and then decreased with increasing addition amounts. When the amount of addition was 1 wt% and the ceramic was calcined at 1600 °C, the flexural strength of the ceramic increased significantly, which was about 1.6 times that of the unadded ceramic. The results are expected to provide a reference for the reinforcement of high-purity zirconia ceramics.

1. Introduction

Zirconia nanoparticles (ZrO2) possess exceptional physical properties, including remarkable strength, hardness, and resistance to wear. It also exhibits low thermal conductivity, excellent thermal insulation, and superior thermal shock resistance. Additionally, ZrO2 nanoparticles demonstrate outstanding biocompatibility and chemical stability, displaying favorable acid and alkali corrosion resistance in both oxidizing and reducing atmospheres [1,2,3]. These unique characteristics make it highly versatile, finding applications in diverse fields ranging from electronic products to oxygen sensors, catalysis, special ceramics, and refractory materials [4,5,6,7,8,9]. Consequently, it represents a focal point of current research within the realm of inorganic materials.
Superior nano ZrO2 powders are required to meet specific criteria, including small grain size, narrow particle size distribution, controllable physical phase and morphology, good monodispersity, and minimal agglomeration [10]. ZrO2 exists in three crystalline structures, namely monoclinic (m-ZrO2), tetragonal (t-ZrO2), and cubic (c-ZrO2) phases [11]. Nanozirconia with different physical phases possesses unique properties and applications. Particularly, the tetragonal-phase nanozirconia can serve as a reinforcement for compounding with other materials to produce martensitic phase transformation for ceramic toughening. This comes from its phase transformation toughening effect [12]. For example, alumina ceramics can be toughened using tetragonal zirconia, and ZrO2 plays a critical role in the polycrystalline transformation of the composite [13]. Additionally, t-ZrO2 exhibits exceptional biocompatibility, high shear strength, and great potential in the field of biomaterials [14,15]. Owing to these outstanding physicochemical properties, tetragonal-phase zirconia nanoparticles present promising applications in advanced ceramics and new composite materials.
The preparation of t-ZrO2 nanopowder particles in a convenient and efficient manner has significant academic and practical value. Several methods are commonly used to prepare such powders, including the sol-gel, microwave, and hydrothermal routes [16,17,18,19]. For example, Chao Yang et al. [20] successfully synthesized pure tetragonal zirconia (t-ZrO2) with an average particle size of approximately 7 nm via a modified hydrothermal method using zirconium nitrate (Zr(NO3)4) as the zirconium precursor and glycerol as an additive. Similarly, Hongju Qiu et al. [21] used a novel sol-gel flux method to synthesize tetragonal zirconia nanopowders stabilized by 3 mol% Y2O3, producing single tetragonal-phase 3Y-TZP nanoparticles in the binary system NaCl + KCl when the Y2O3 content in the raw material was 5 mol%. In comparison to the other methods, hydrothermal synthesis demonstrates superior economic efficiency in the fabrication of ZrO2 nanoparticles that possess advantageous characteristics such as fine particle sizes, small agglomeration strengths, and a narrow distribution of particle sizes [22]. Currently, doping with cations during preparation is the primary method to improve the stability of tetragonal-phase zirconia in zirconia systems. Examples of such dopants include yttrium oxide-stabilized tetragonal-phase zirconia (Y-TZP) and cerium oxide-stabilized tetragonal-phase zirconia (Ce-TZP) [23,24,25]. However, the major drawback of Y-TZP is that these ceramics are prone to aging, which means that metastable tetragonal grains are very susceptible to slowly transforming to a monoclinic phase triggered by water-derived species [26]. In addition, existing issues such as the dearth of tetragonal phase content, exorbitant reaction costs, stringent equipment demands, and paltry yields are also present. Moreover, nanoparticles exhibit a proclivity for agglomeration because of their elevated surface energy, and the existence of agglomerates hinders interparticle flow and diminishes sintering activity, ultimately leading to an immense depletion in powder quality. According to available studies, changing the surface charge of the powder by adding dispersants is an effective method to improve the agglomeration of zirconia nanopowders [27]. However, different dispersants also have different effects on zirconia [16,28]. Therefore, it is especially important to prepare zirconia nanopowders with good monodispersity and high tetragonal phase content by adjusting the experimental parameters.
In this paper, we present a systematic investigation of the impact of various preparation conditions on the synthesis of tetragonal-phase zirconia nanoparticles via the hydrothermal method using a propanetriol system. We aim to obtain pure tetragonal-phase zirconia nanoparticles with small particle sizes and good monodispersity and to perform relevant tests on their properties.

2. Results and Discussion

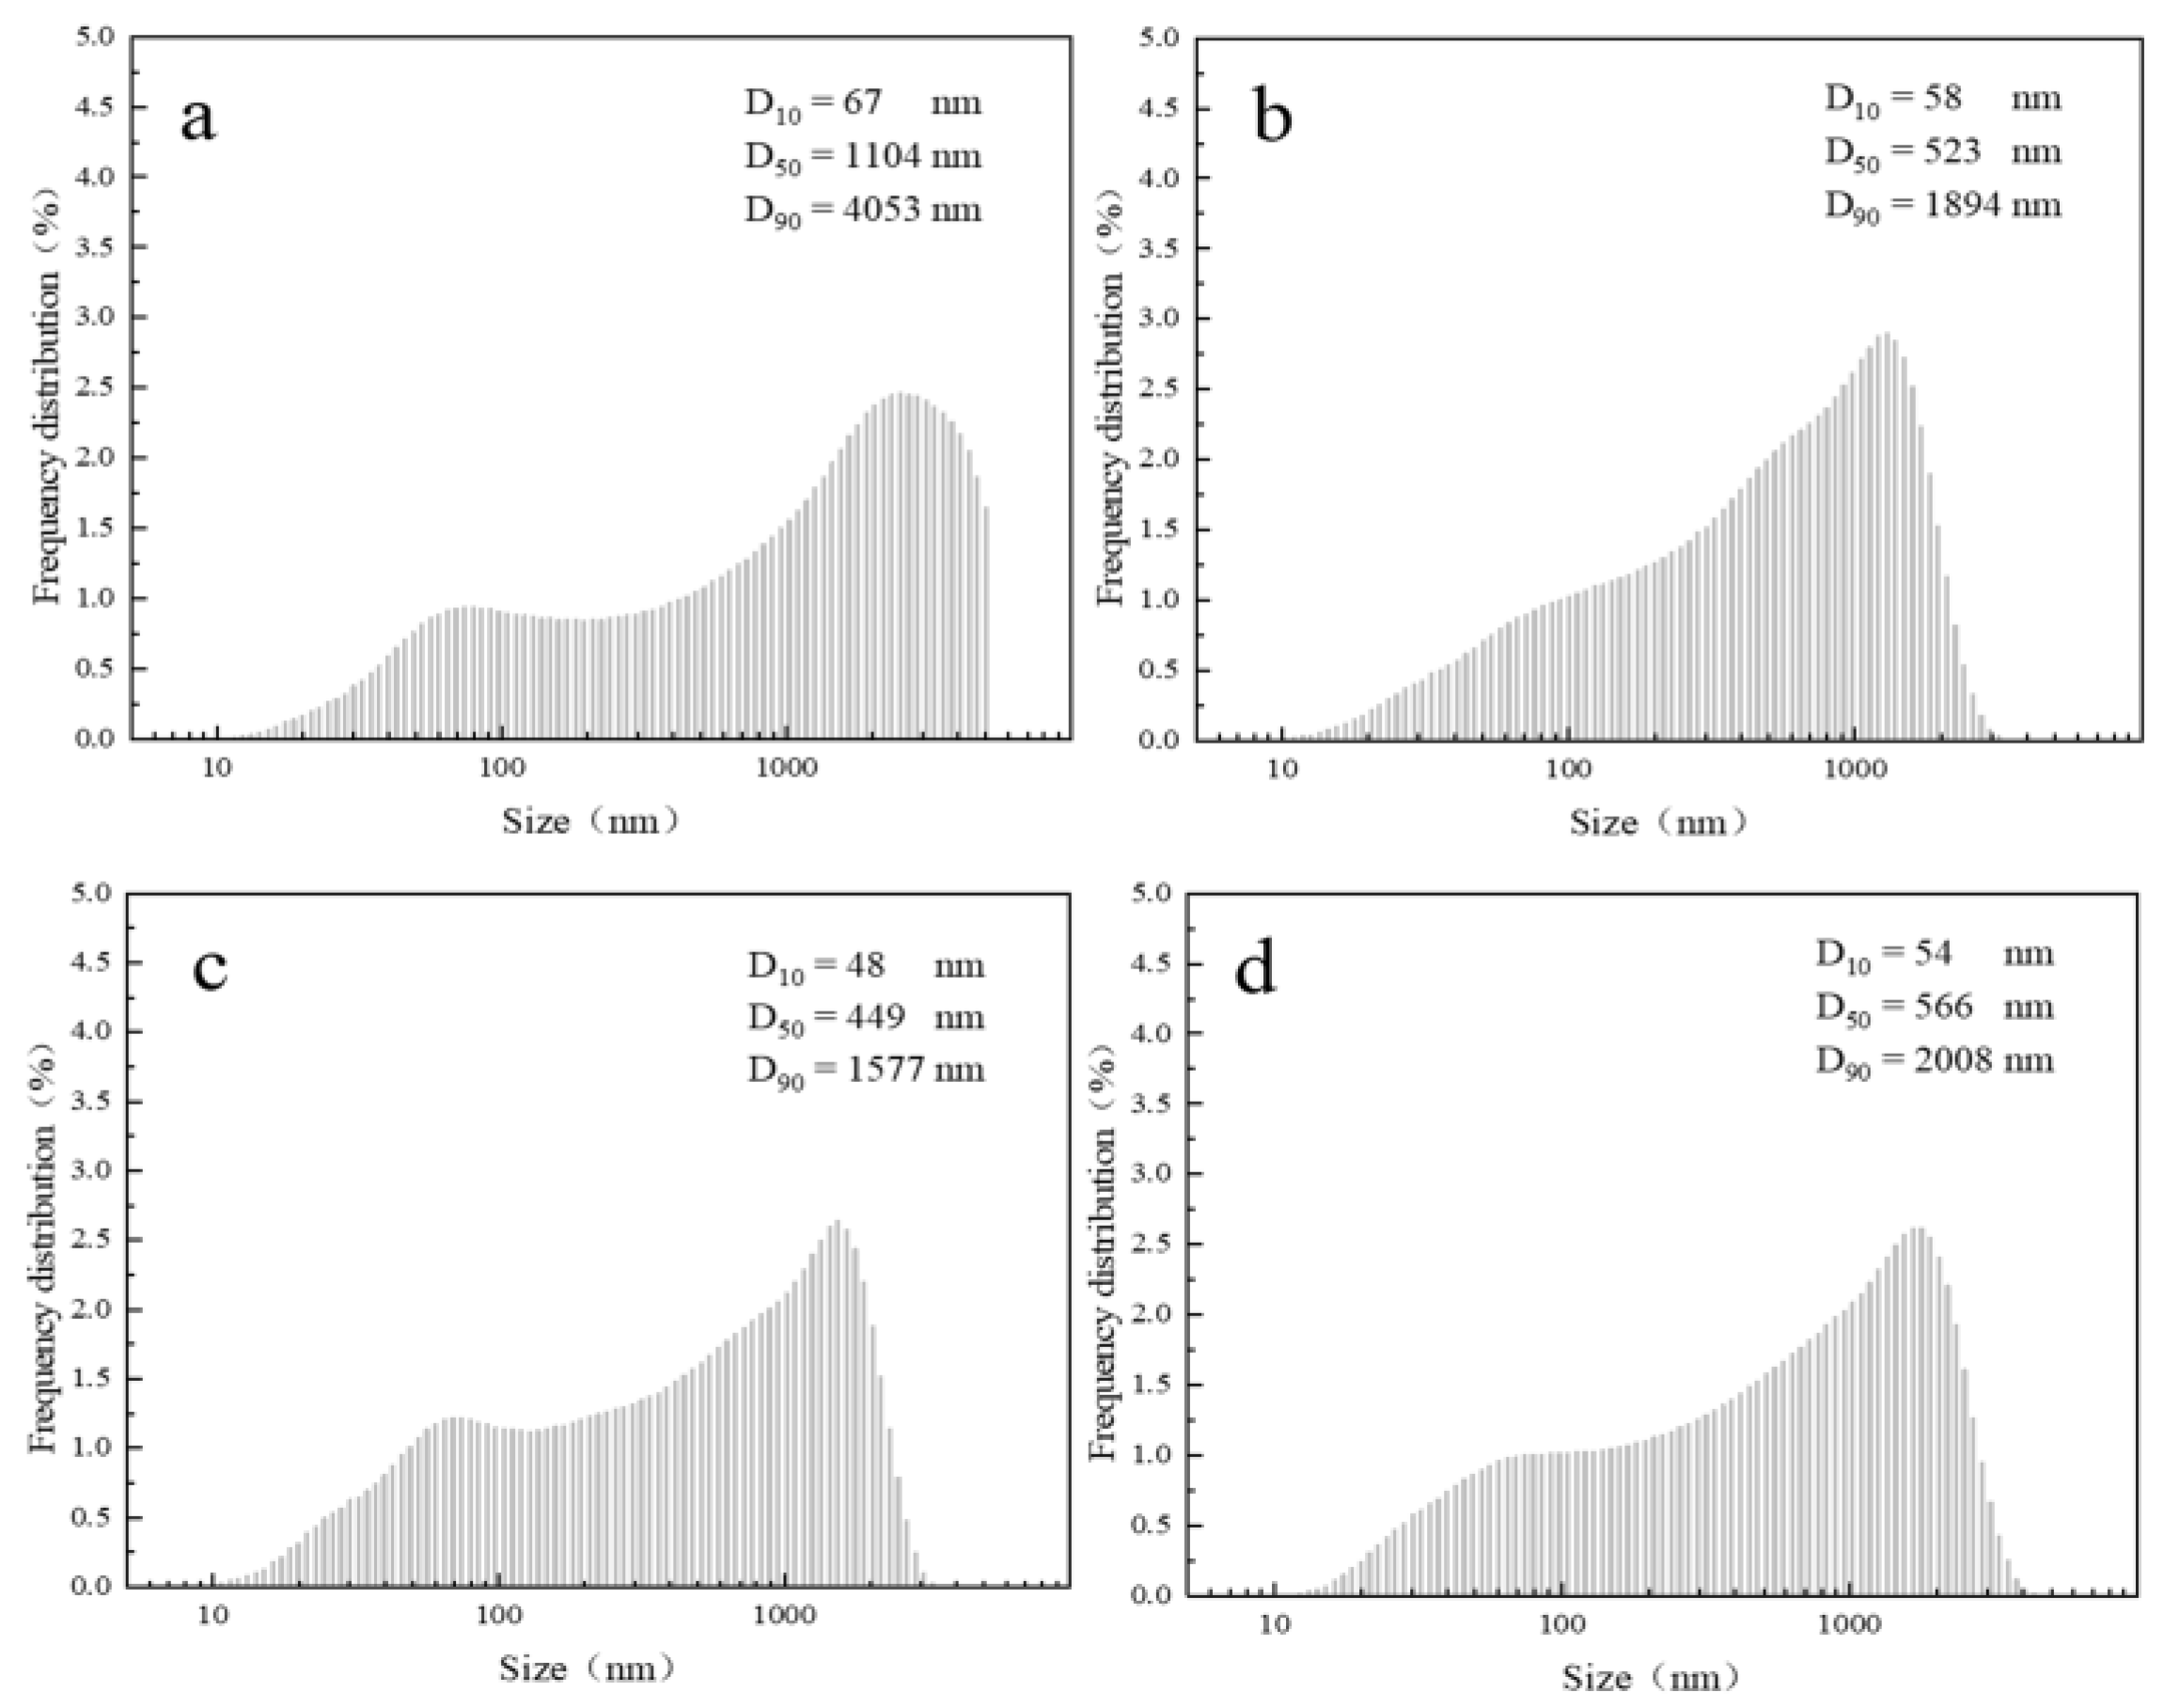
2.1. Glycerol Content

The results of the laser particle size analysis of samples with different mass fractions of the propanetriol system are presented in Figure 1. As shown in the figure, the particle size of the samples showed a trend of an increase and then a decrease with the increase in the mass fraction of propanetriol, and the median diameter (D50) was 518, 692, 449, and 302 nm, respectively. The particle size distribution curves of samples a (1 wt%), b (2.5 wt%), and c (5 wt%) are similar. However, when the addition of propanetriol reached 10 wt%, the particle size and distribution differed significantly, with a concentration of particle size. This observation suggests that the excessive addition of propanetriol might hinder the zirconia crystallization process, leading to incomplete crystallization and the production of other substances. However, it should be noted that the particle size distribution was measured using a laser particle size analyzer, and the refractive index parameter was set on the basis of the refractive index of zirconia. Therefore, the significance of the reference may not be significant. Based on the results, the sample prepared with 5 wt% propanetriol had the smallest median diameter and the best particle size distribution.
The zirconia synthesized through the hydrothermal method should have a particle size in the nanometer range. However, the measured particle size of the samples was found to be at the submicrometer level. This discrepancy may be attributed to the fact that the laser particle size analyzer primarily measures particle sizes in the micrometer range and may not accurately measure particle sizes in the nanometer range. To verify the particle size of the hydrothermal product and the accuracy of the laser particle size analyzer effect pattern on the measured samples, we conducted TEM testing on four groups of samples. The results, as shown in Figure 2, indicate that the prepared samples have good monodispersity with clear boundaries between the particles. However, multiple particle stacking was observed in all of the samples, which may be due to problems arising from the preparation of the samples during TEM testing. After statistical analysis, the average particle sizes of the four groups of samples were found to be approximately 9.3 nm, 10.1 nm, 8.2 nm, and 8.0 nm, respectively. The addition of 5 wt% propanetriol resulted in a relatively good dispersion. The changing pattern of the particle size also followed an increasing and then decreasing trend, consistent with the results obtained from the laser particle size distribution meter. Therefore, while the laser particle size analyzer may not provide exact particle size measurements for nanometer-sized particles, it can still be used for qualitative analysis and to study the impact of different conditions on particle size distribution.
Figure 3 shows the XRD patterns of propanetriol systems with varying mass fractions. The results demonstrate that the physical phase is significantly influenced by the content of propanetriol. Comparison with the standard card of the tetragonal phase (JCPDS NO.50-1089) reveals that the first three sets of experiments at 2θ = 30.12°, 34.62°, 35.11°, 50.22°, 50.57°, 59.44°, 60.06°, 62.84°, and 74.41° exhibit tetragonal phase diffraction peaks corresponding to (011), (002), (110), (112), (020), (013), (121), (202), and (220) crystallographic planes, respectively. The crystalline intensity varies from weak to strong, and then from weak to weak. The diffraction peaks at 2θ = 35.3° and 60.2° are slightly asymmetrical due to the broadening superposition of double peaks with different intensities. This feature distinguishes t-ZrO2 from c-ZrO2, which only exhibits symmetric diffraction peaks. Therefore, the sample prepared under this condition is confirmed to be t-ZrO2 [29,30,31]. When the addition of propanetriol is 1 wt%, a diffraction peak appears at 2θ = 28.16°, and the standard control monoclinic phase card (JCPDS NO.37-1484) is the diffraction peak of zirconium oxide monoclinic phase in the crystalline plane. In contrast, when zirconium oxychloride is used as the zirconium source and ammonia as the precipitant, the structure is usually mixed-phase without adding propanetriol. The diffraction peak of the monoclinic phase is relatively strong, indicating that the addition of propanetriol facilitates the conversion of the monoclinic phase to the tetragonal phase. When the addition of propanetriol was increased to 2.5 wt%, the diffraction peaks of tetragonal phase zirconia were sharpened by XRD full spectrum fitting, indicating an increase in the crystallinity and grain size of tetragonal phase zirconia with the addition of propanetriol. With a further increase in the mass fraction of propanetriol to 5 wt%, the crystallinity decreased slightly, but the monoclinic peak at 2θ = 28.16° disappeared completely. All diffraction peaks corresponded to those of tetragonal zirconia, indicating the formation of a pure tetragonal structure. Furthermore, the diffraction peaks broadened, the width of the half-height increased, and the grain size decreased. With a further increase in the amount of propanetriol to 10 wt%, the diffraction peak intensity of zirconia was very low, and no zirconia with good crystallinity was formed. Therefore, increasing the mass fraction of propanetriol favors the generation of the tetragonal phase. Under the condition of 5 wt%, the monoclinic phase has completely transformed into the tetragonal phase. However, as the amount of propanetriol continues to increase, the crystallinity of the hydrothermal products increases and then decreases. To a certain extent, continuing to increase is not conducive to crystallization. Calculated by the Scherrer equation, the current system exhibited average grain sizes of 6.89 nm, 7.82 nm, 6.25 nm, and 6.56 nm with increasing mass fractions of propanetriol. These values were consistent with the pattern of intensity change observed for diffraction peaks.
To further verify the particle size and microscopic morphology of the samples, the samples prepared under 2.5 and 5 wt% propanetriol conditions were characterized by SEM, as shown in Figure 4. SEM images of the two groups of samples were observed, and it was found that the particle sizes belonged to the nanometer level and the average particle sizes ranged from about 15 to 25 nm. However, the particle agglomeration was more severe in Figure 4a, and the particle boundaries were blurred and the grains were fine. With the increase in propanetriol’s mass fraction, the edges of the particles in Figure 4b are clearer, and the grains are well developed. Because of their smaller grains, it leads to the presence of a larger surface energy and the appearance of agglomeration. Therefore, the above analysis shows that the crystallinity of the product improves and the particle size decreases with the increasing addition of propanetriol. Therefore, the optimal amount of addition was 5 wt% propanetriol, the prepared sample had relatively good dispersion and uniform particle size, and the product had a pure tetragonal phase structure.

2.2. Effect of the Ultrasonic Mode on Tetragonal Nano-Zirconia

The agglomeration of zirconia nanoparticles prepared by the hydrothermal method is a common problem due to the high surface activity of small particles. However, reasonable sonication can improve the dispersion of ZrO2 nanocrystals [32]. The particle size distributions were measured at different sonication times and are shown in Figure 5. The results showed that when only stirring was performed without sonication, the particle size increased significantly, and the D50 value was too large with a wide particle size distribution, leading to irrational test results. However, sonication for 2 min significantly refined the particles, resulting in a decrease in D50 and a narrower particle size distribution. This indicates that sonication is a crucial step in the preparation process. When sonication was combined with mechanical stirring for 5 min, the effect was even more significant, resulting in a smaller median diameter and a narrower size distribution. However, with a further extension of the sonication time, the median diameter increased, indicating that the ultrasonic time should not be too long. The vibration caused by the ultrasonic frequency may regroup the originally dispersed small particles because of their high surface energy, which is not conducive to powder dispersion. Therefore, the ultrasonic and mechanical stirring conditions for 5 min were selected as the best conditions for future studies in this group of experiments.

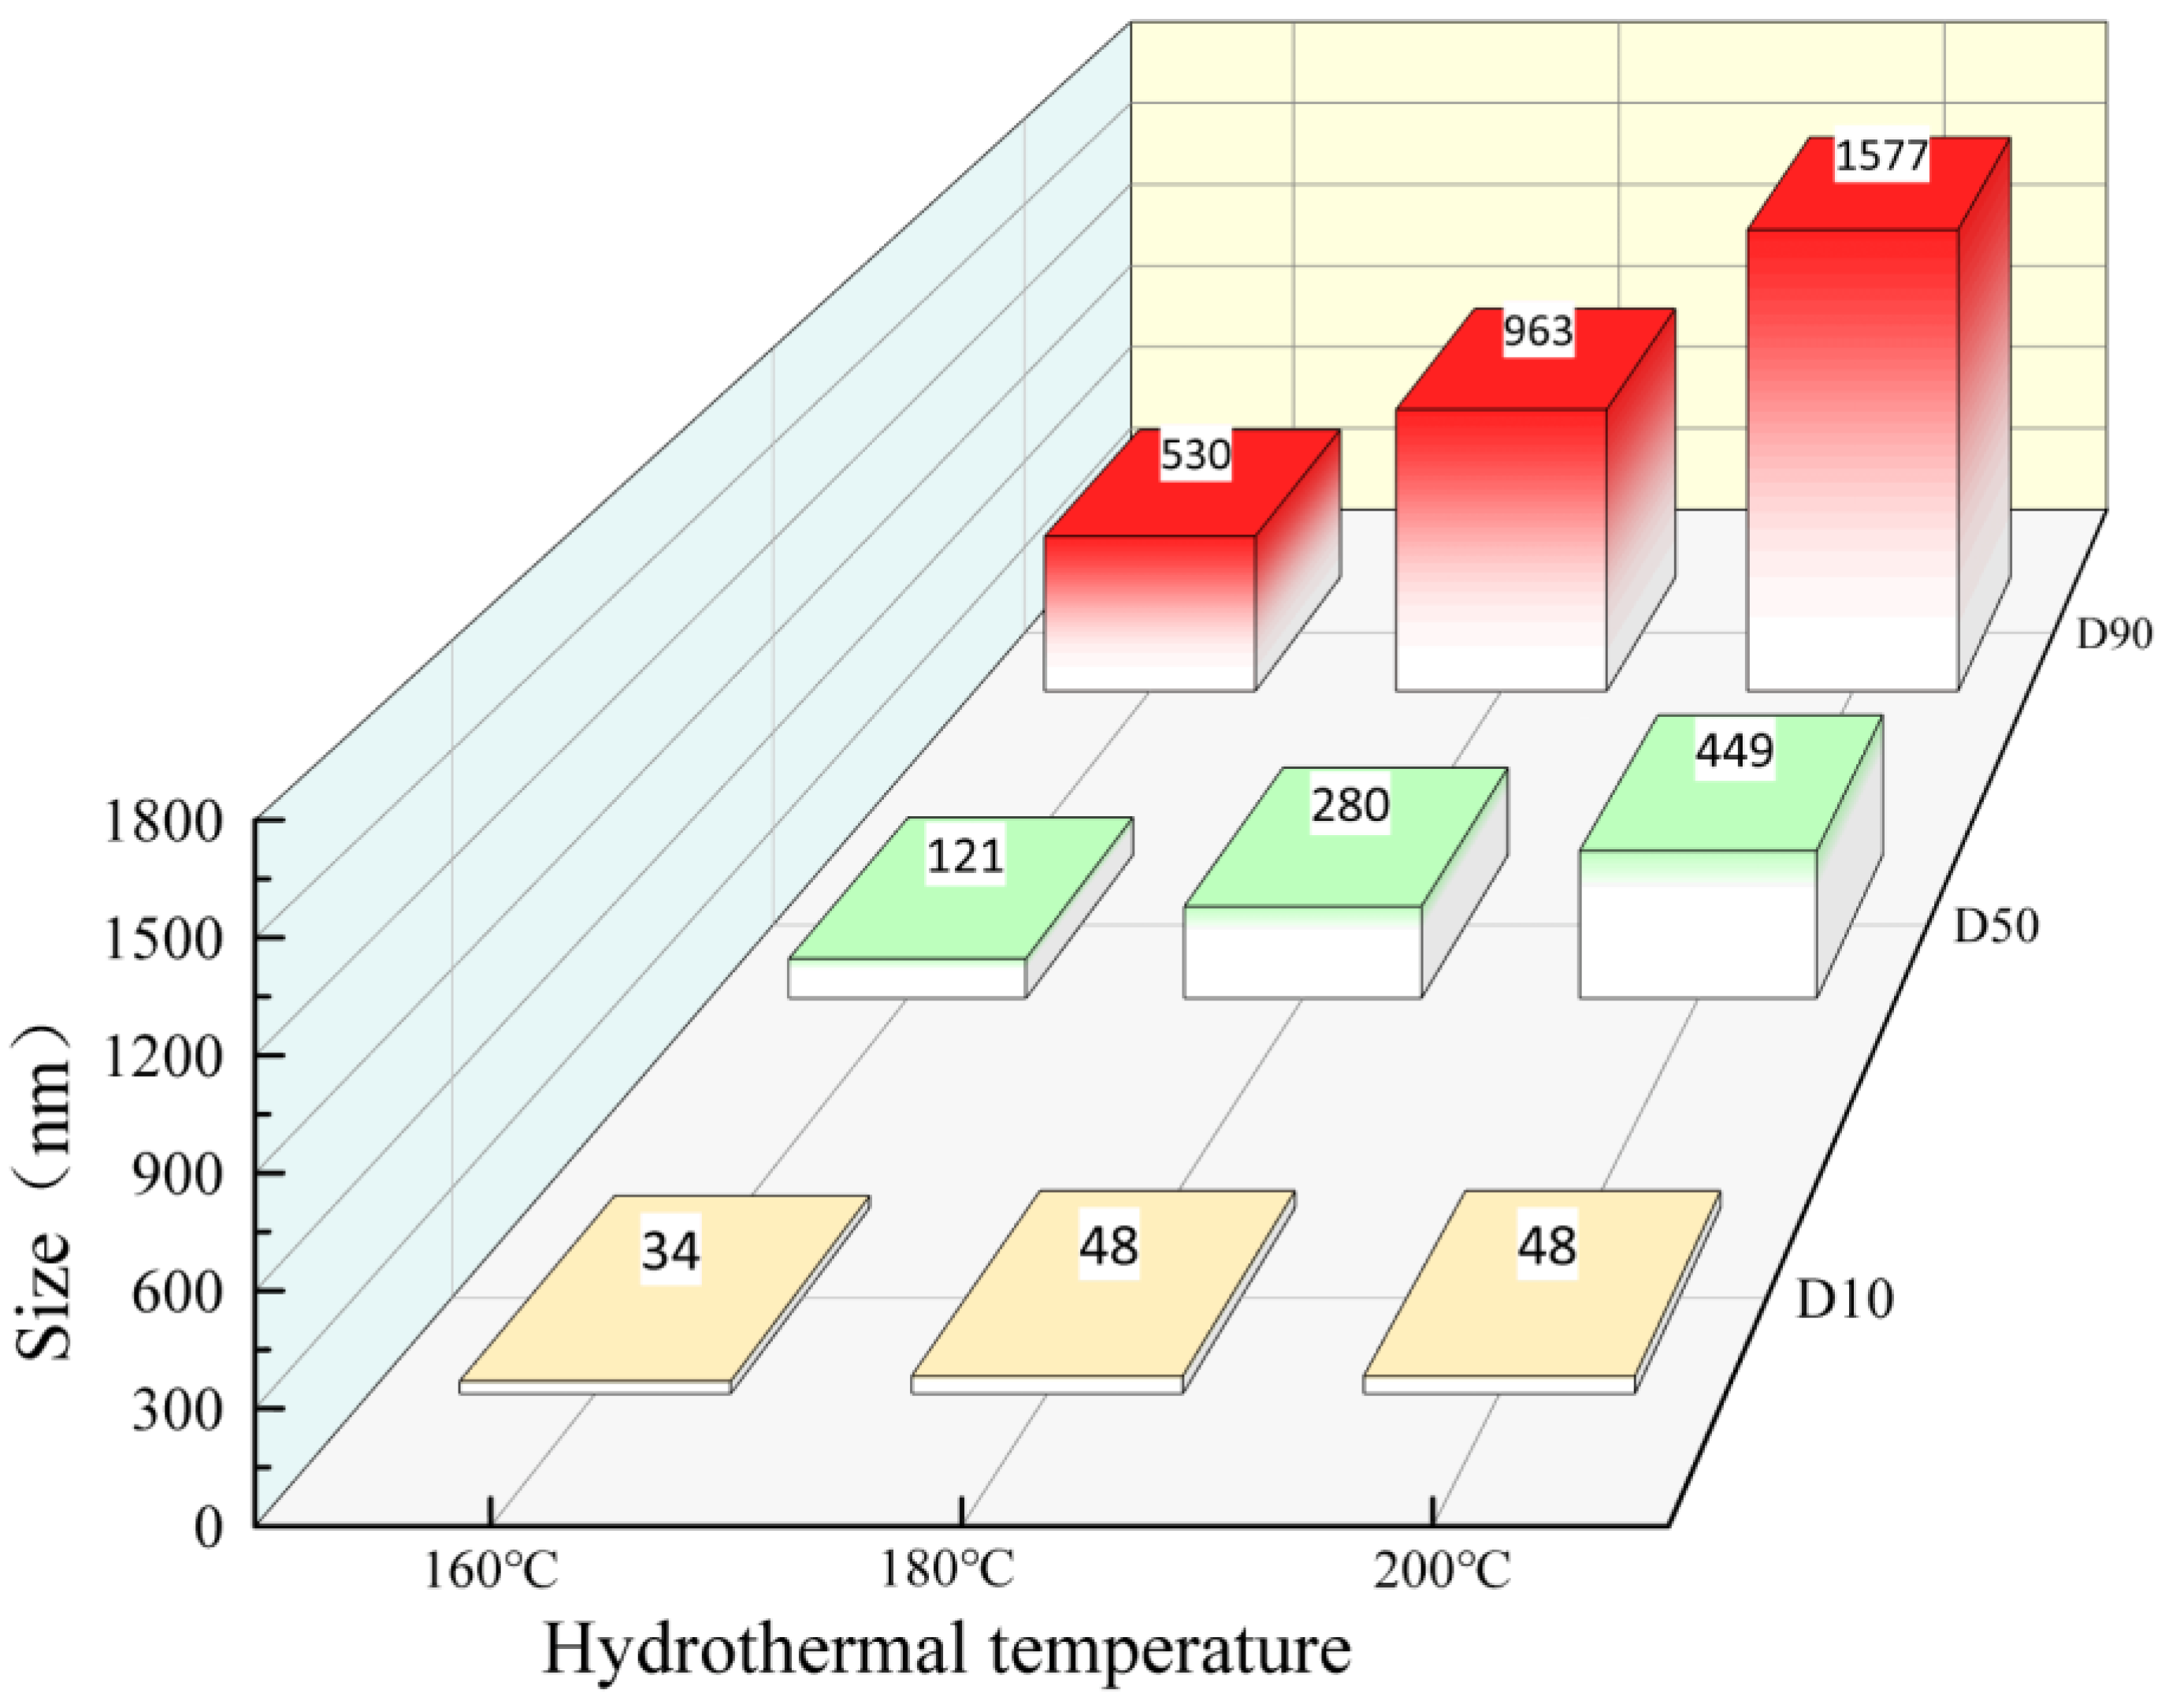
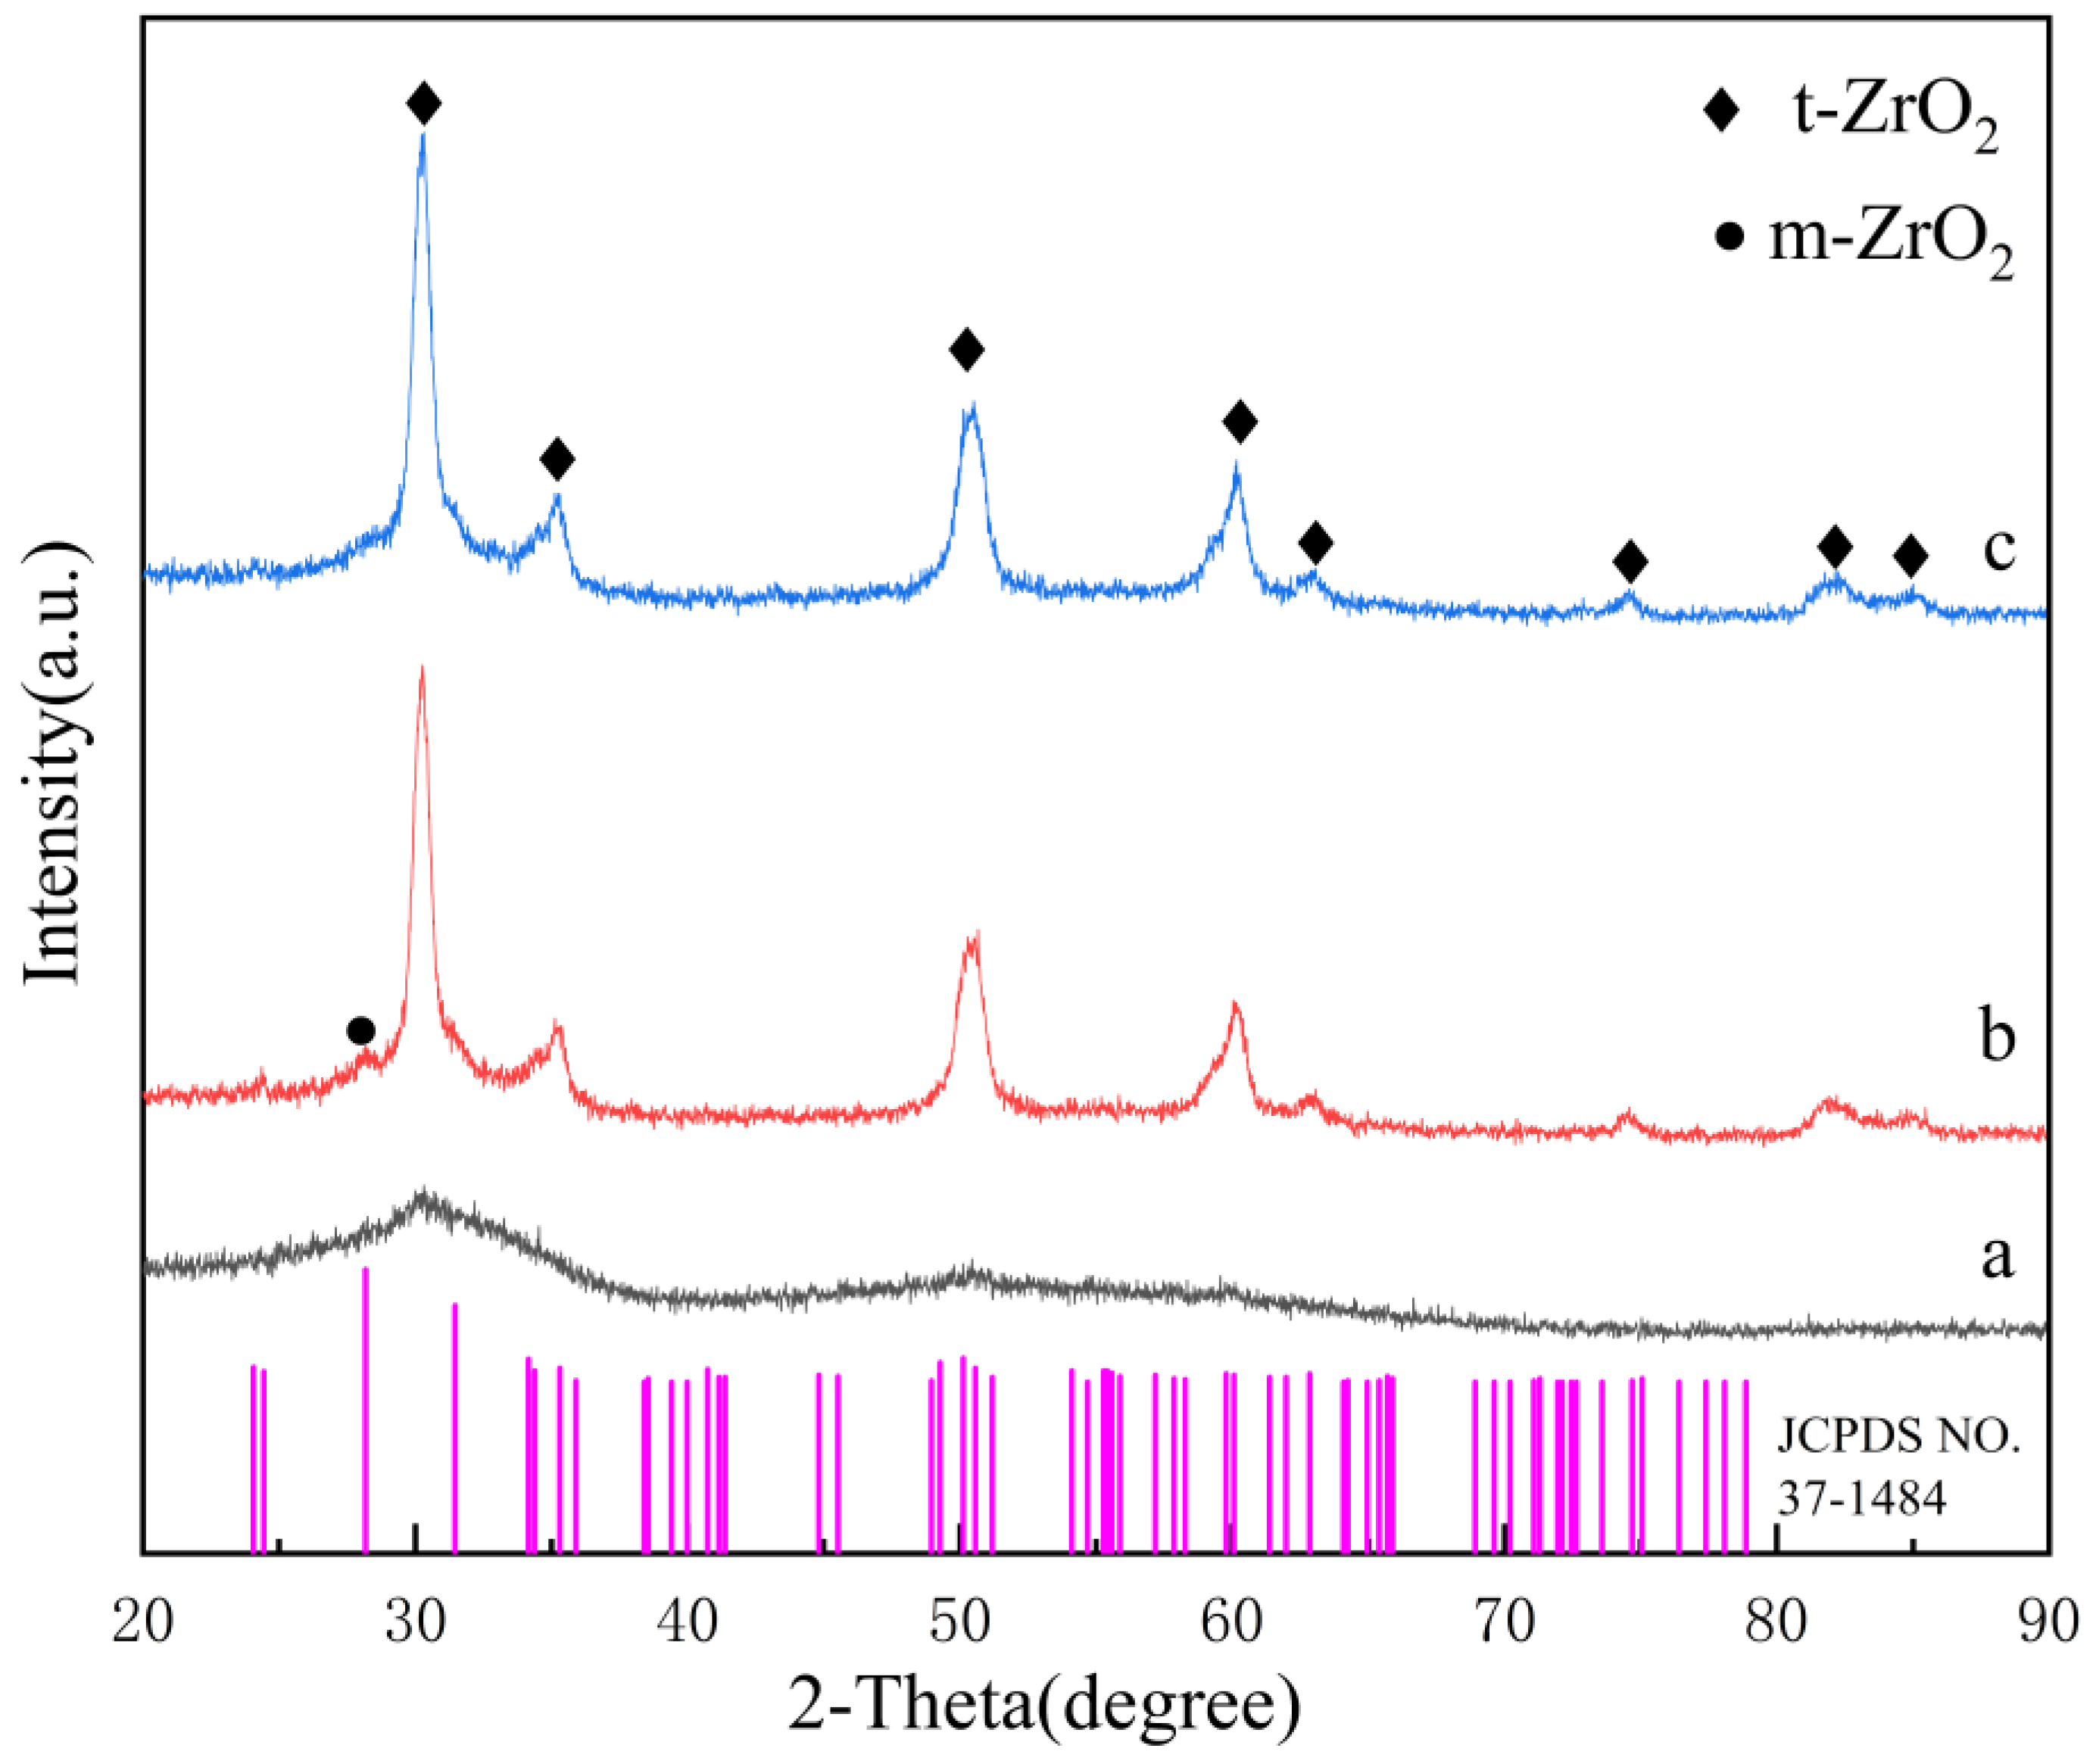
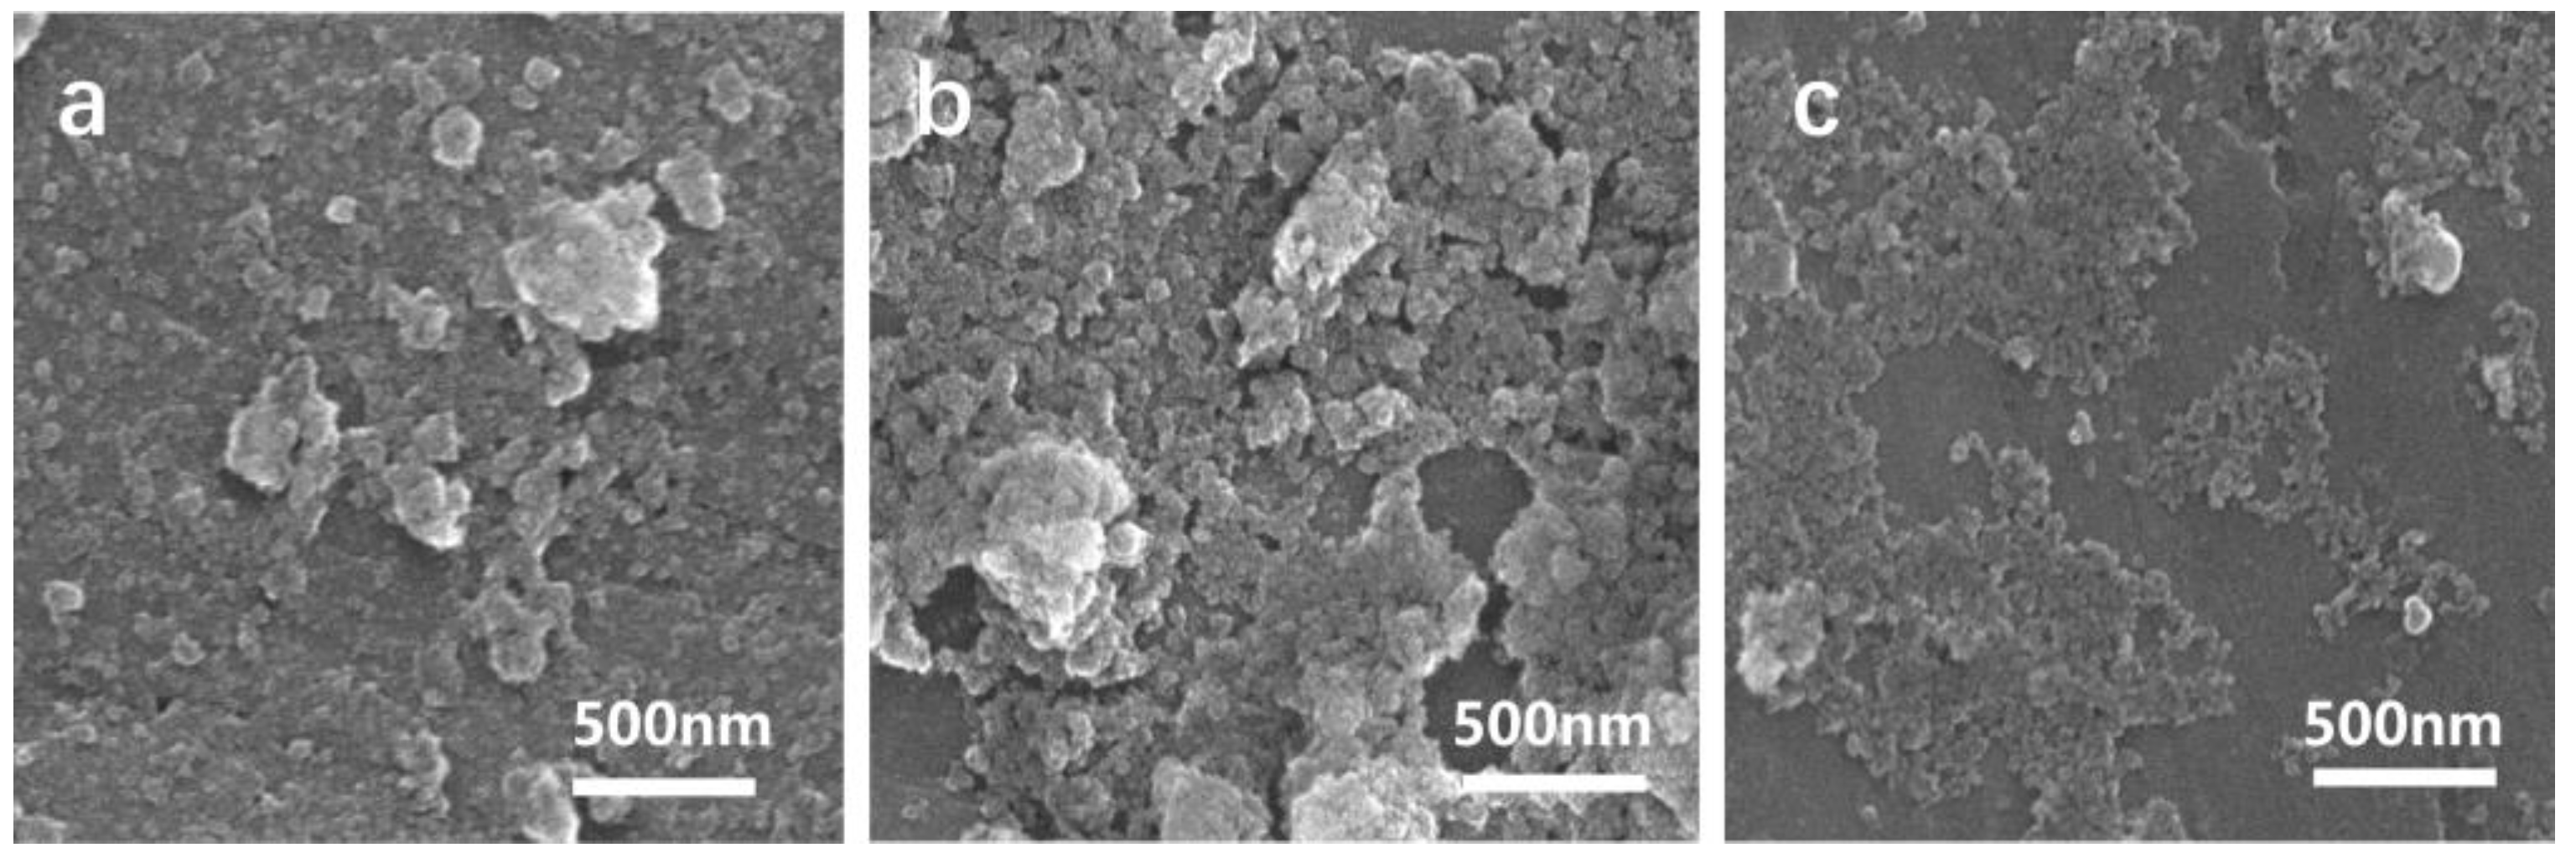
2.3. Hydrothermal Reaction Temperature

Figure 6 displays the particle size distribution obtained at various reaction temperatures using zirconium oxychloride and propanetriol at concentrations of 10 and 5 wt%, respectively. As illustrated in the figure, an overall increasing trend in particle size is observed with increasing hydrothermal temperature, with D50 increasing from 121 to 449 nm. The observed trend can be attributed to the fact that hydrothermal temperature is a critical factor affecting crystal growth. Specifically, the increase in hydrothermal temperature leads to greater solute adsorption onto the crystal, resulting in decreased crystal surface energy and facilitating grain growth.
Figure 7 presents the XRD analysis of the prepared samples at various temperatures within the propanetriol system. As shown in the figure, when the reaction temperature is set at 160 °C, weak diffraction peaks are observed for the products, indicating that zirconia is in a newly crystallized state and still contains many amorphous regions. As the temperature increases, the intensity of the diffraction peaks increases, signifying an increase in crystallinity. However, in comparison with the monoclinic phase standard card (JCPDS NO.37-1484), it is found that monoclinic phase diffraction peaks appear at 2θ = 28.16° when the reaction temperature is set to 180 °C. At 200 °C, these monoclinic peaks disappear completely, and all are tetragonal phase reaction peaks with good crystallinity. It is apparent that an increase in reaction temperature not only facilitates grain growth and enhances crystallinity but also encourages the transformation from the monoclinic phase to the tetragonal phase. The average grain sizes of the hydrothermal products prepared at 180 °C and 200 °C were calculated to be 5.56 nm and 6.25 nm, respectively, according to the Scherrer equation.
Figure 8 shows SEM images of the samples prepared at hydrothermal temperatures of 160 °C, 180 °C, and 200 °C within the glycerol system. As can be observed in the figure, the driving force provided at a hydrothermal temperature of 160 °C is insufficient to induce crystallization in most crystals, which remain in the amorphous state. As the temperature increases, the crystallinity of the samples gradually increases, along with the driving force for crystallization, and when the temperature reaches 200 °C, good crystallinity is obtained, with relatively uniform grain sizes and a sphere-like granular morphology. Based on these observations, 200 °C is determined to be the optimal hydrothermal temperature. However, samples prepared at 200 °C still exhibit particle agglomeration, which was addressed by adding dispersant to mitigate the agglomeration effect.

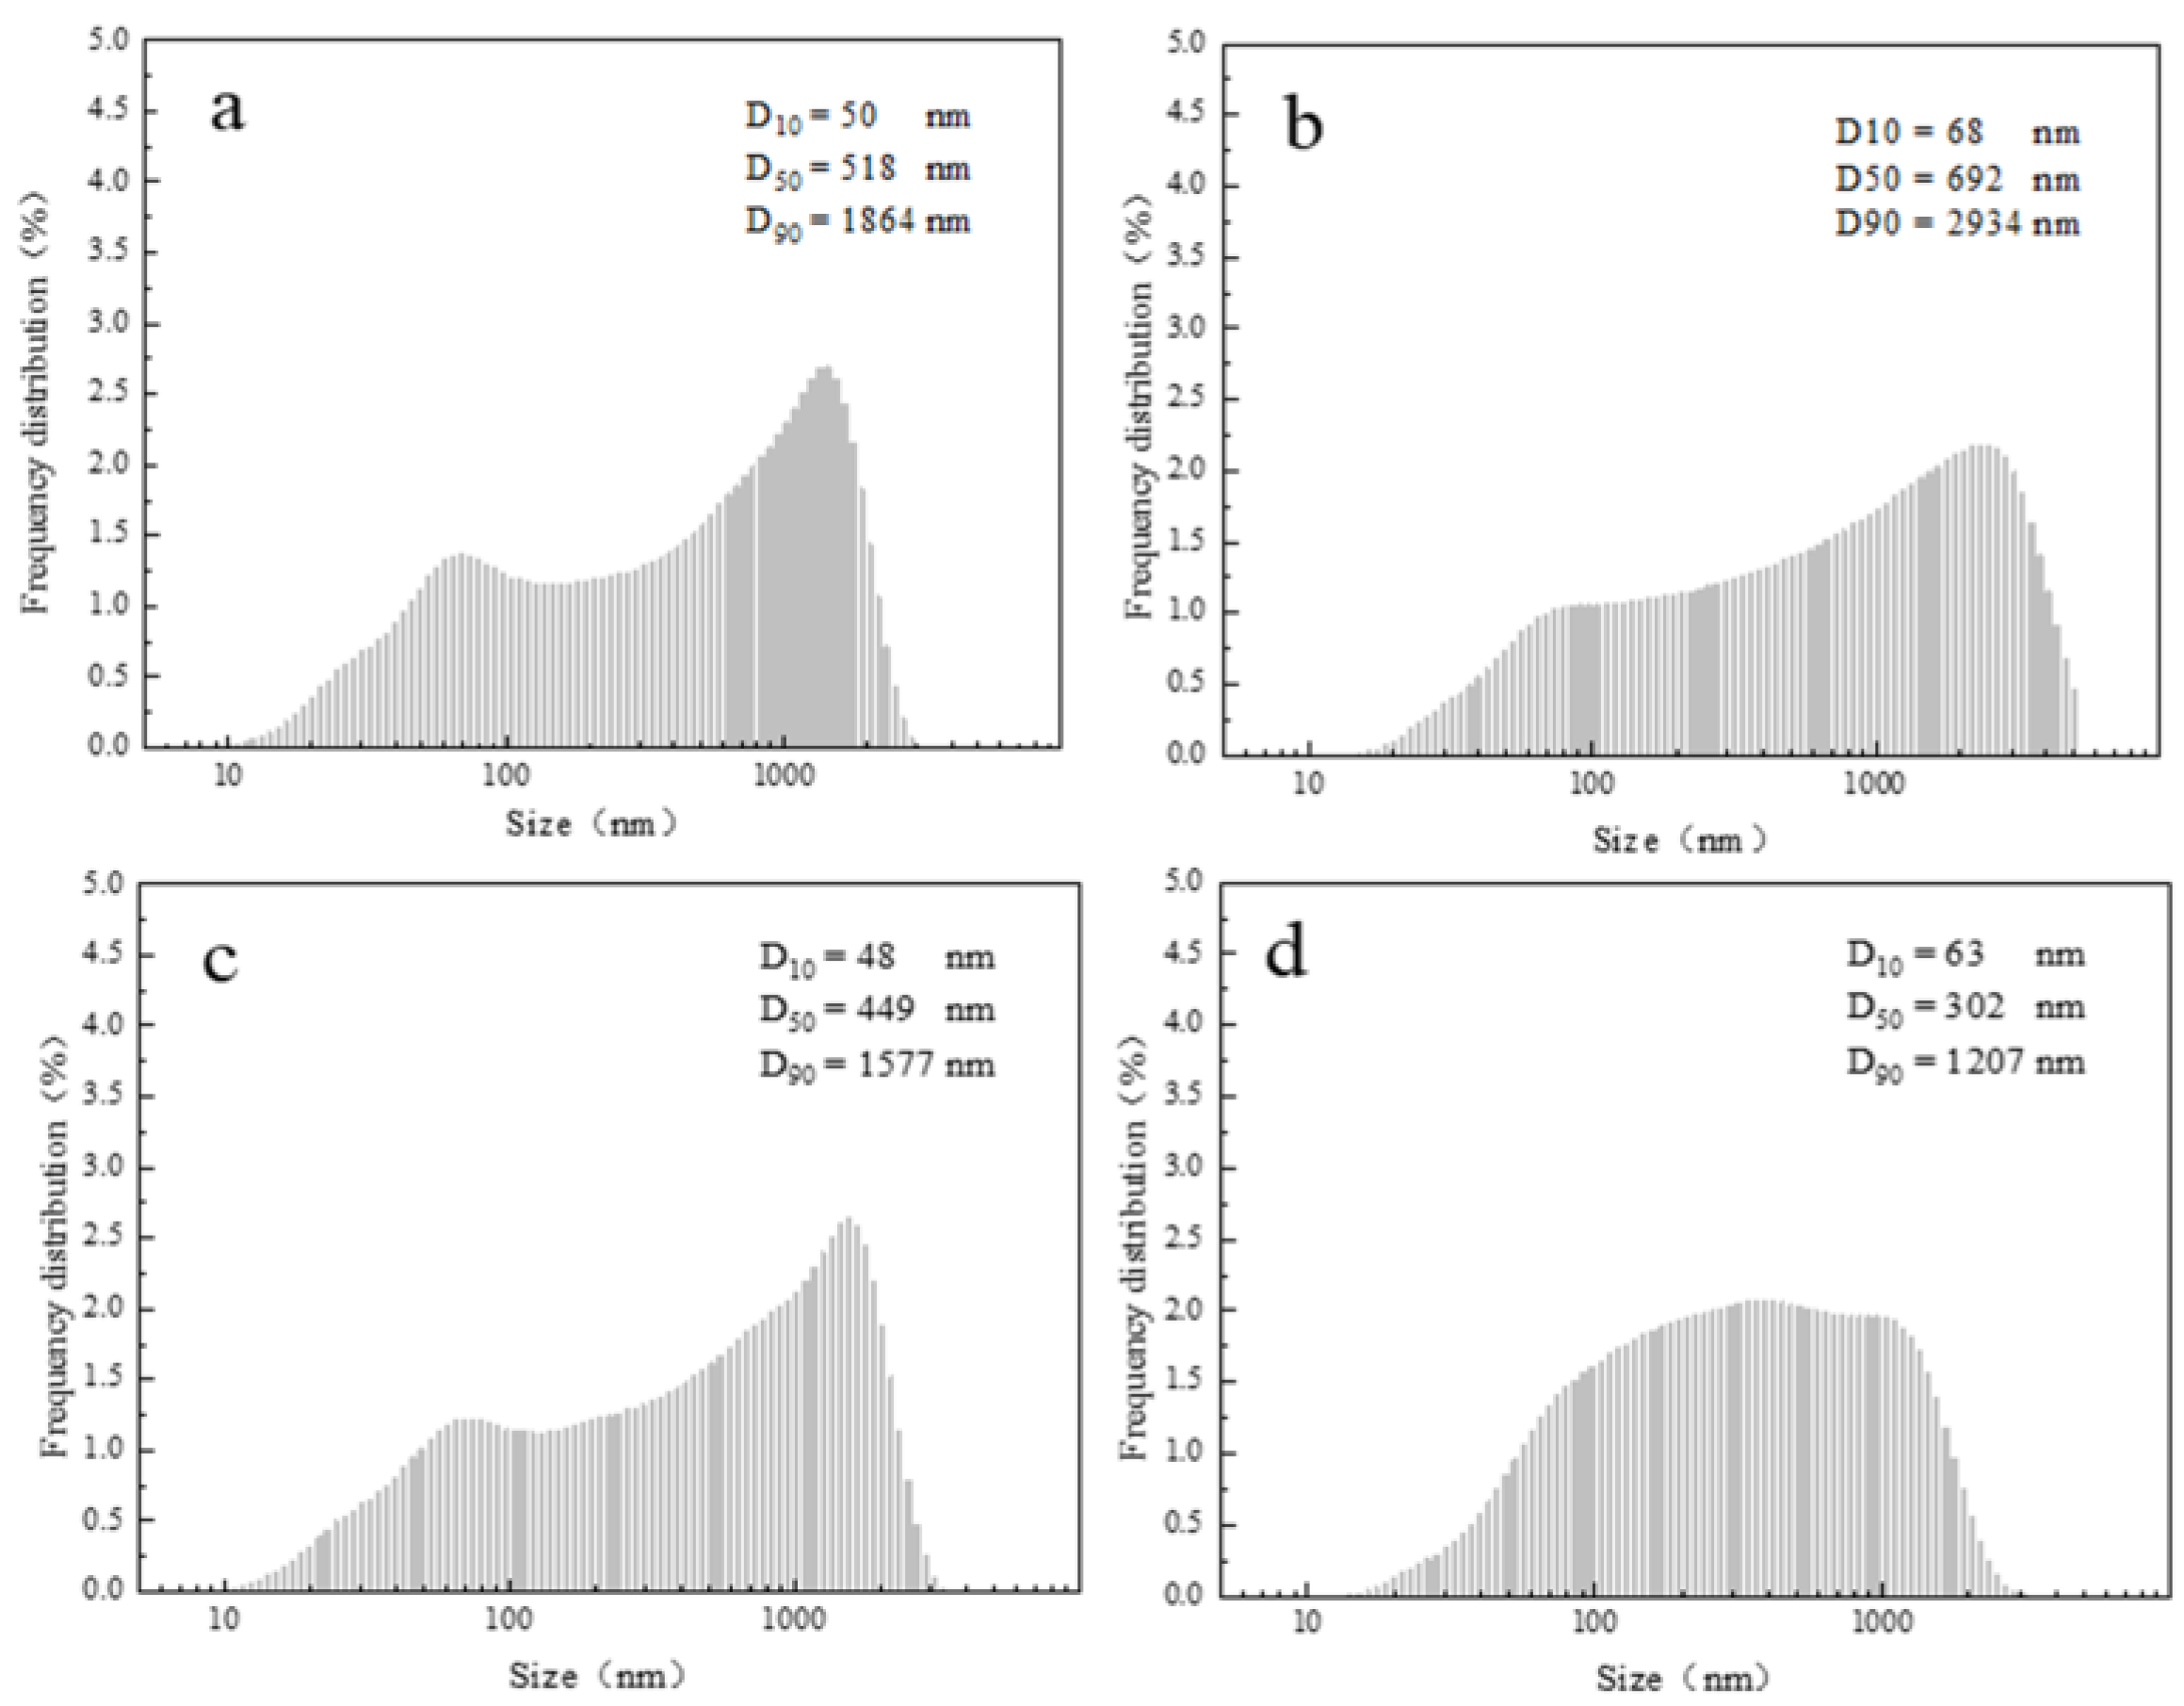
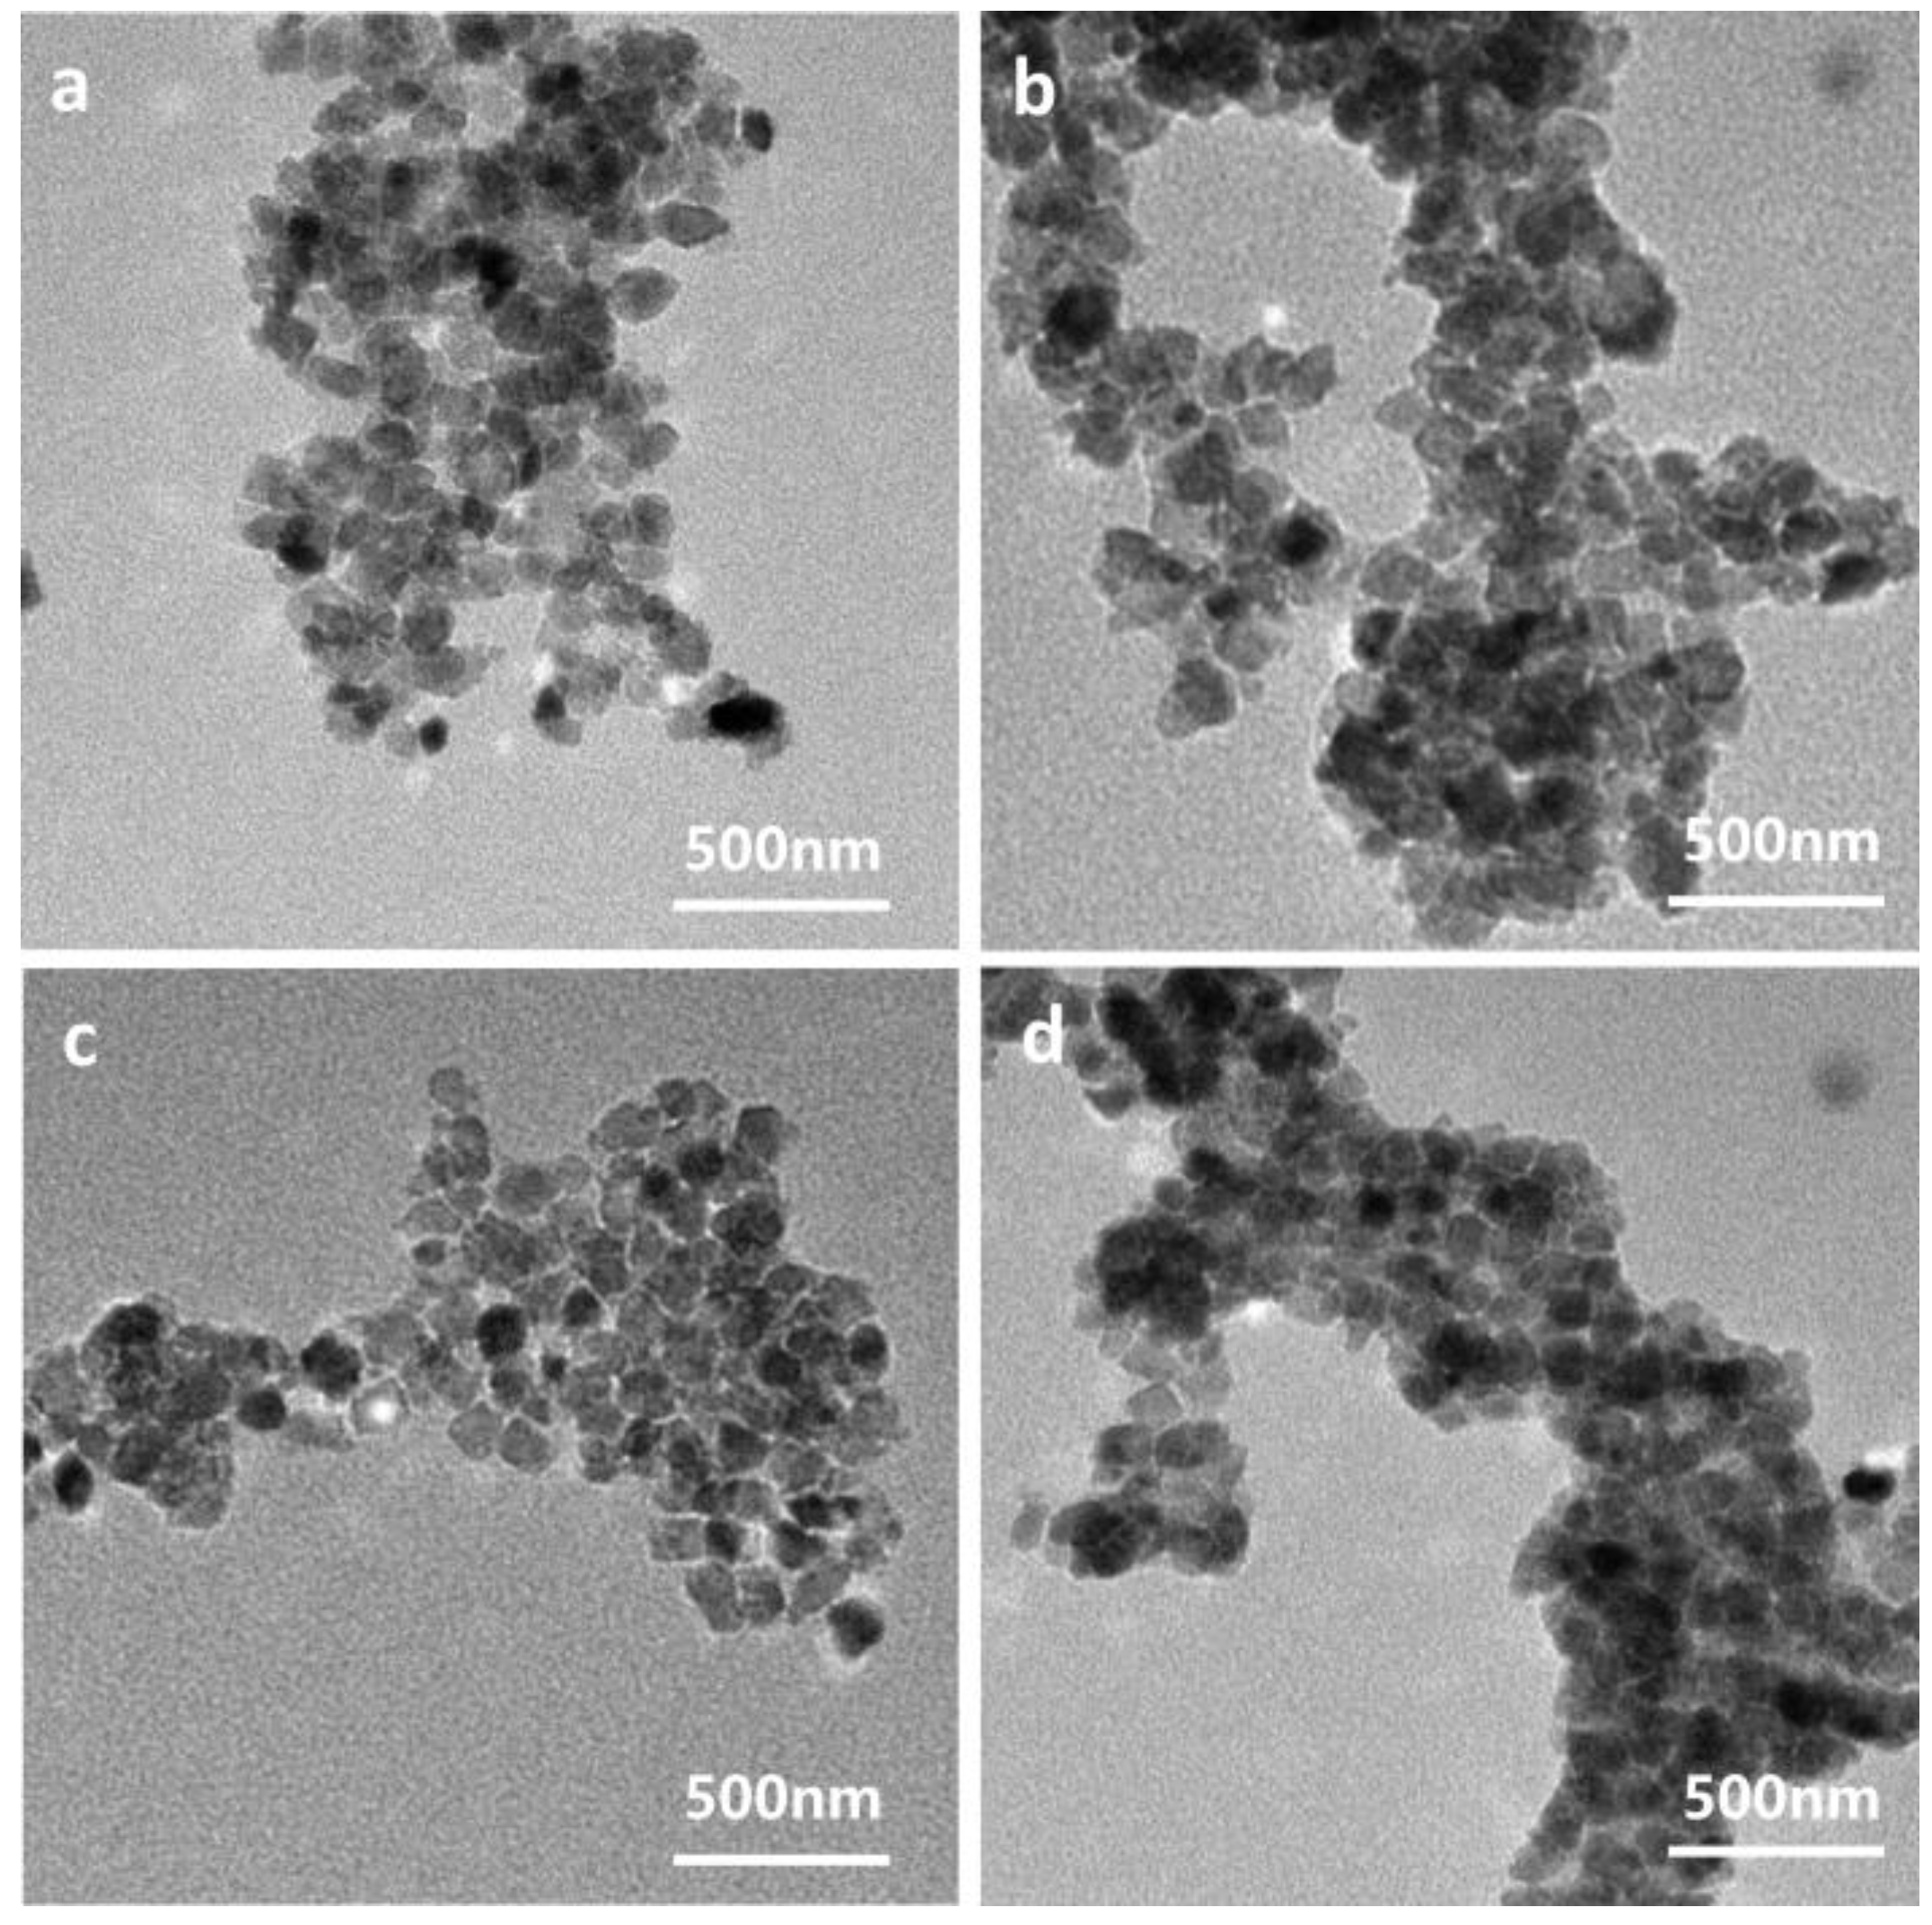
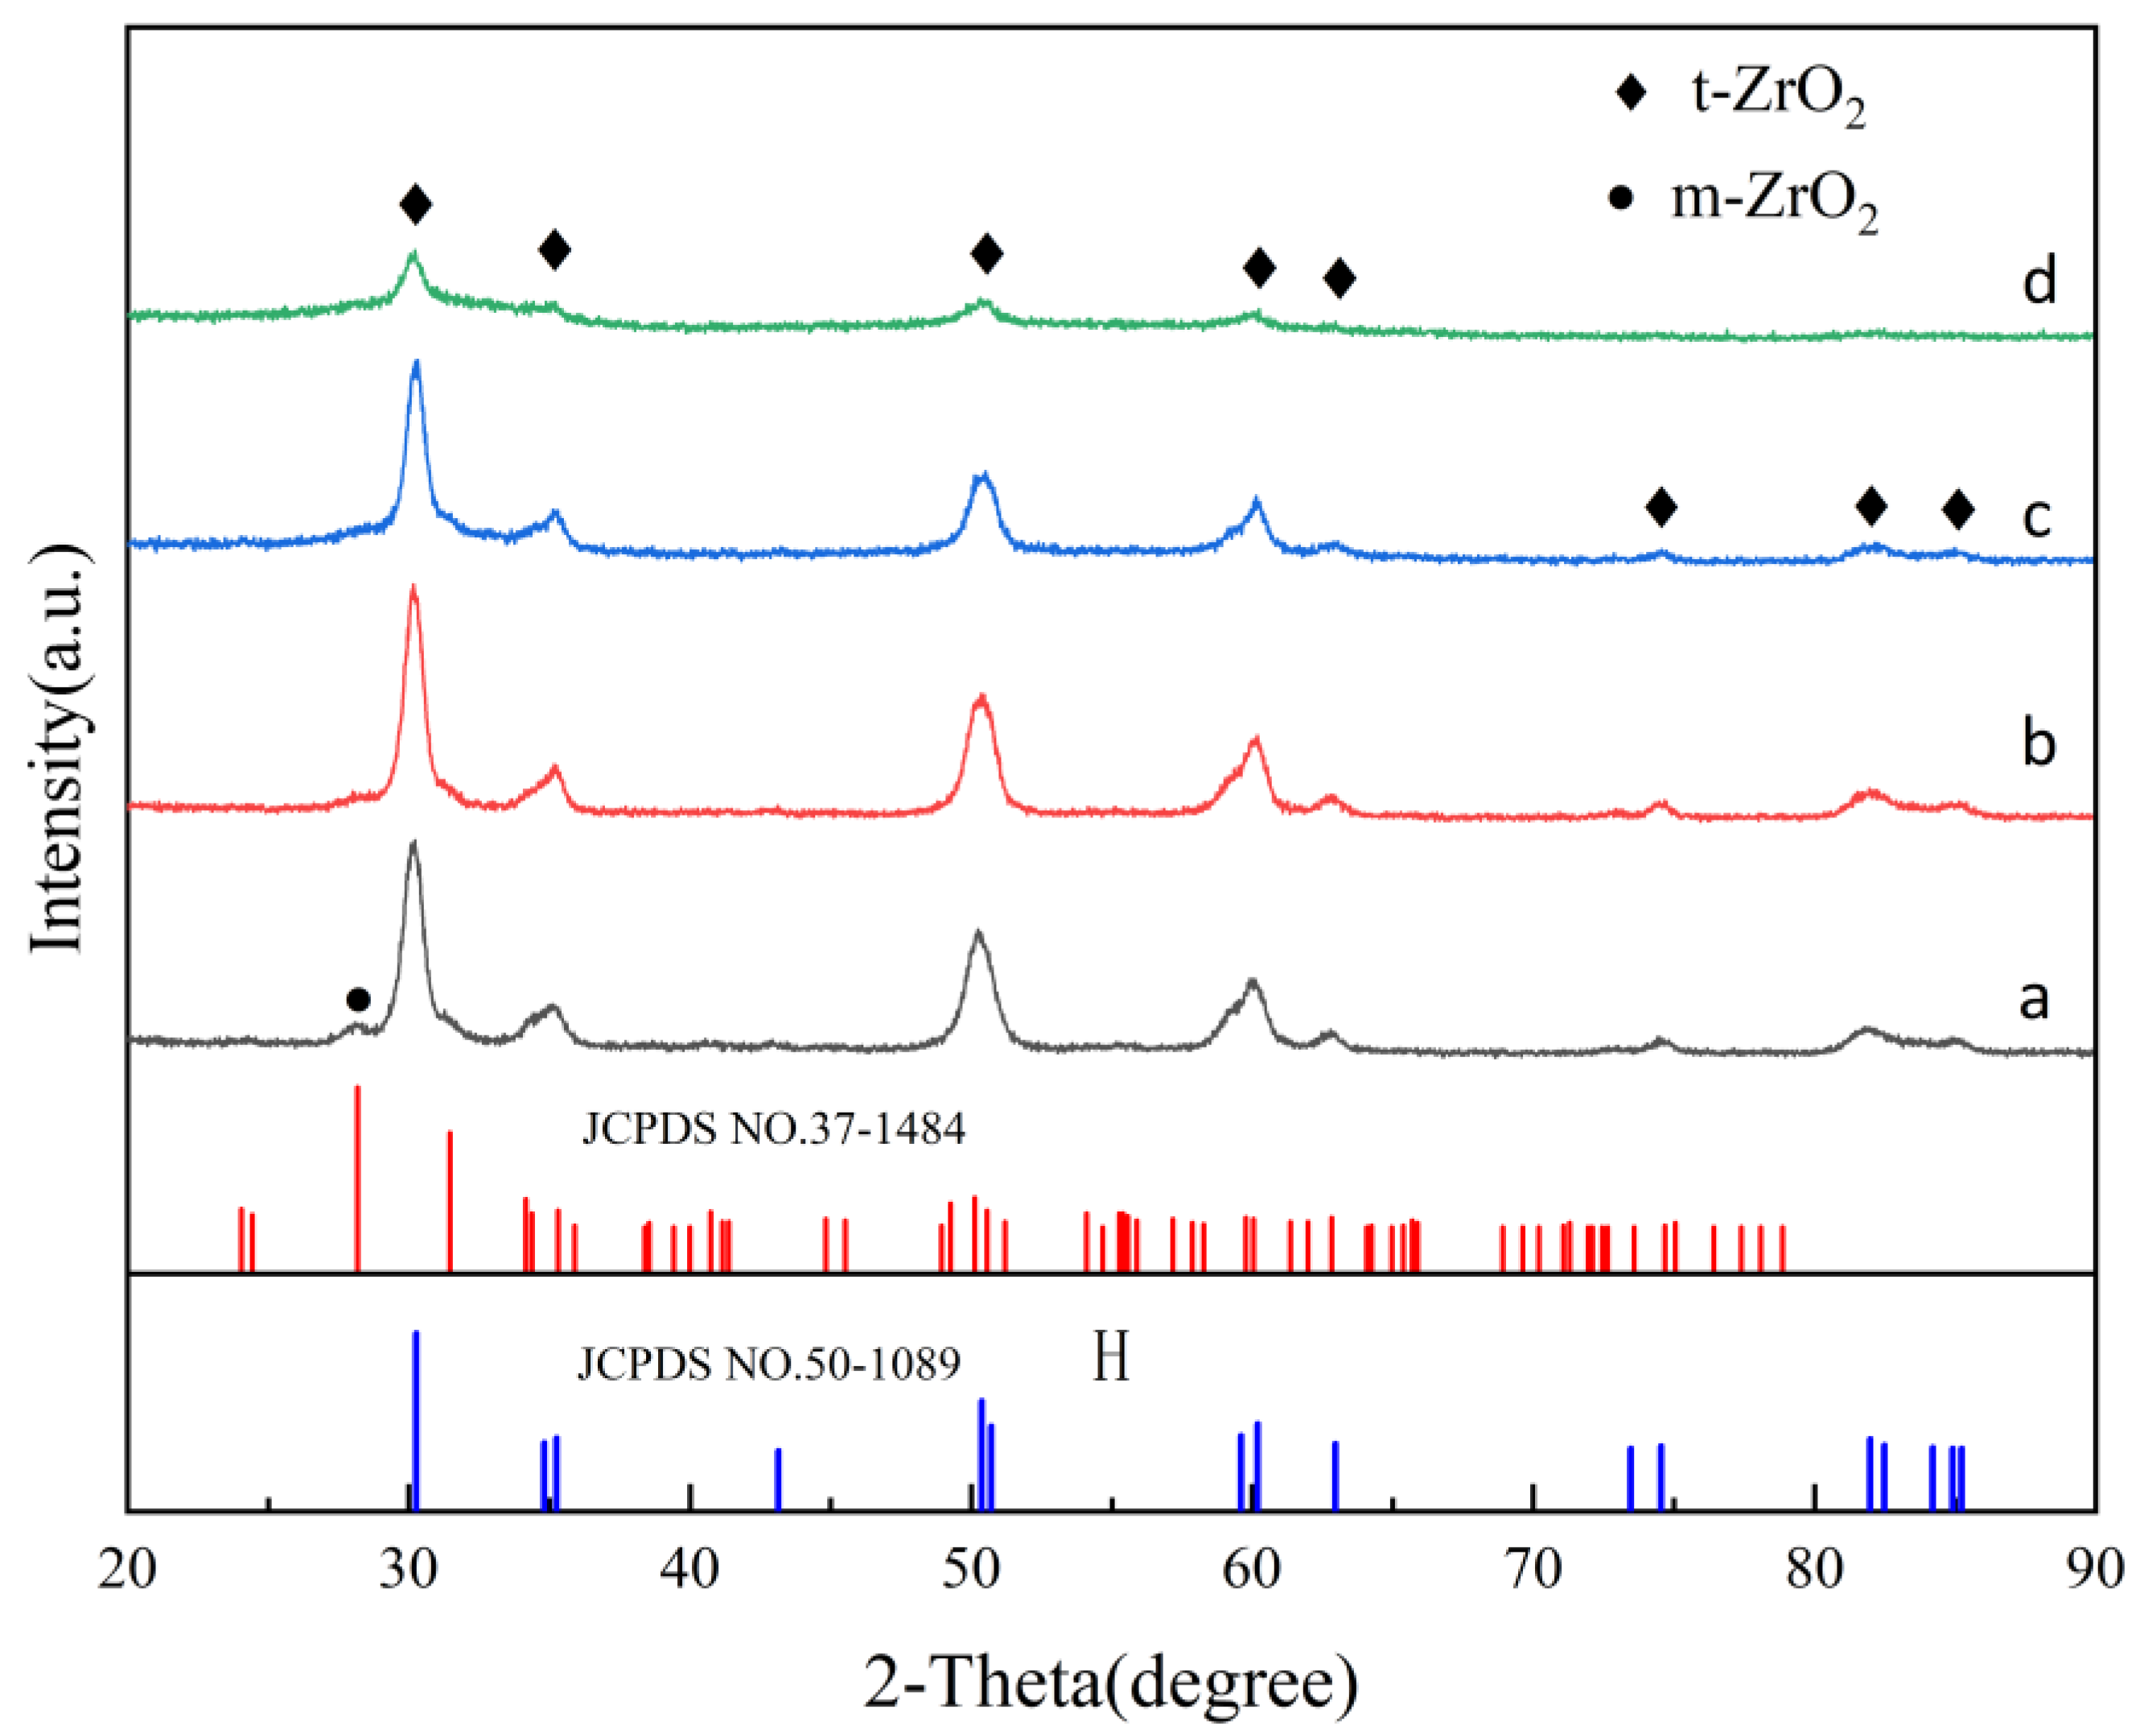
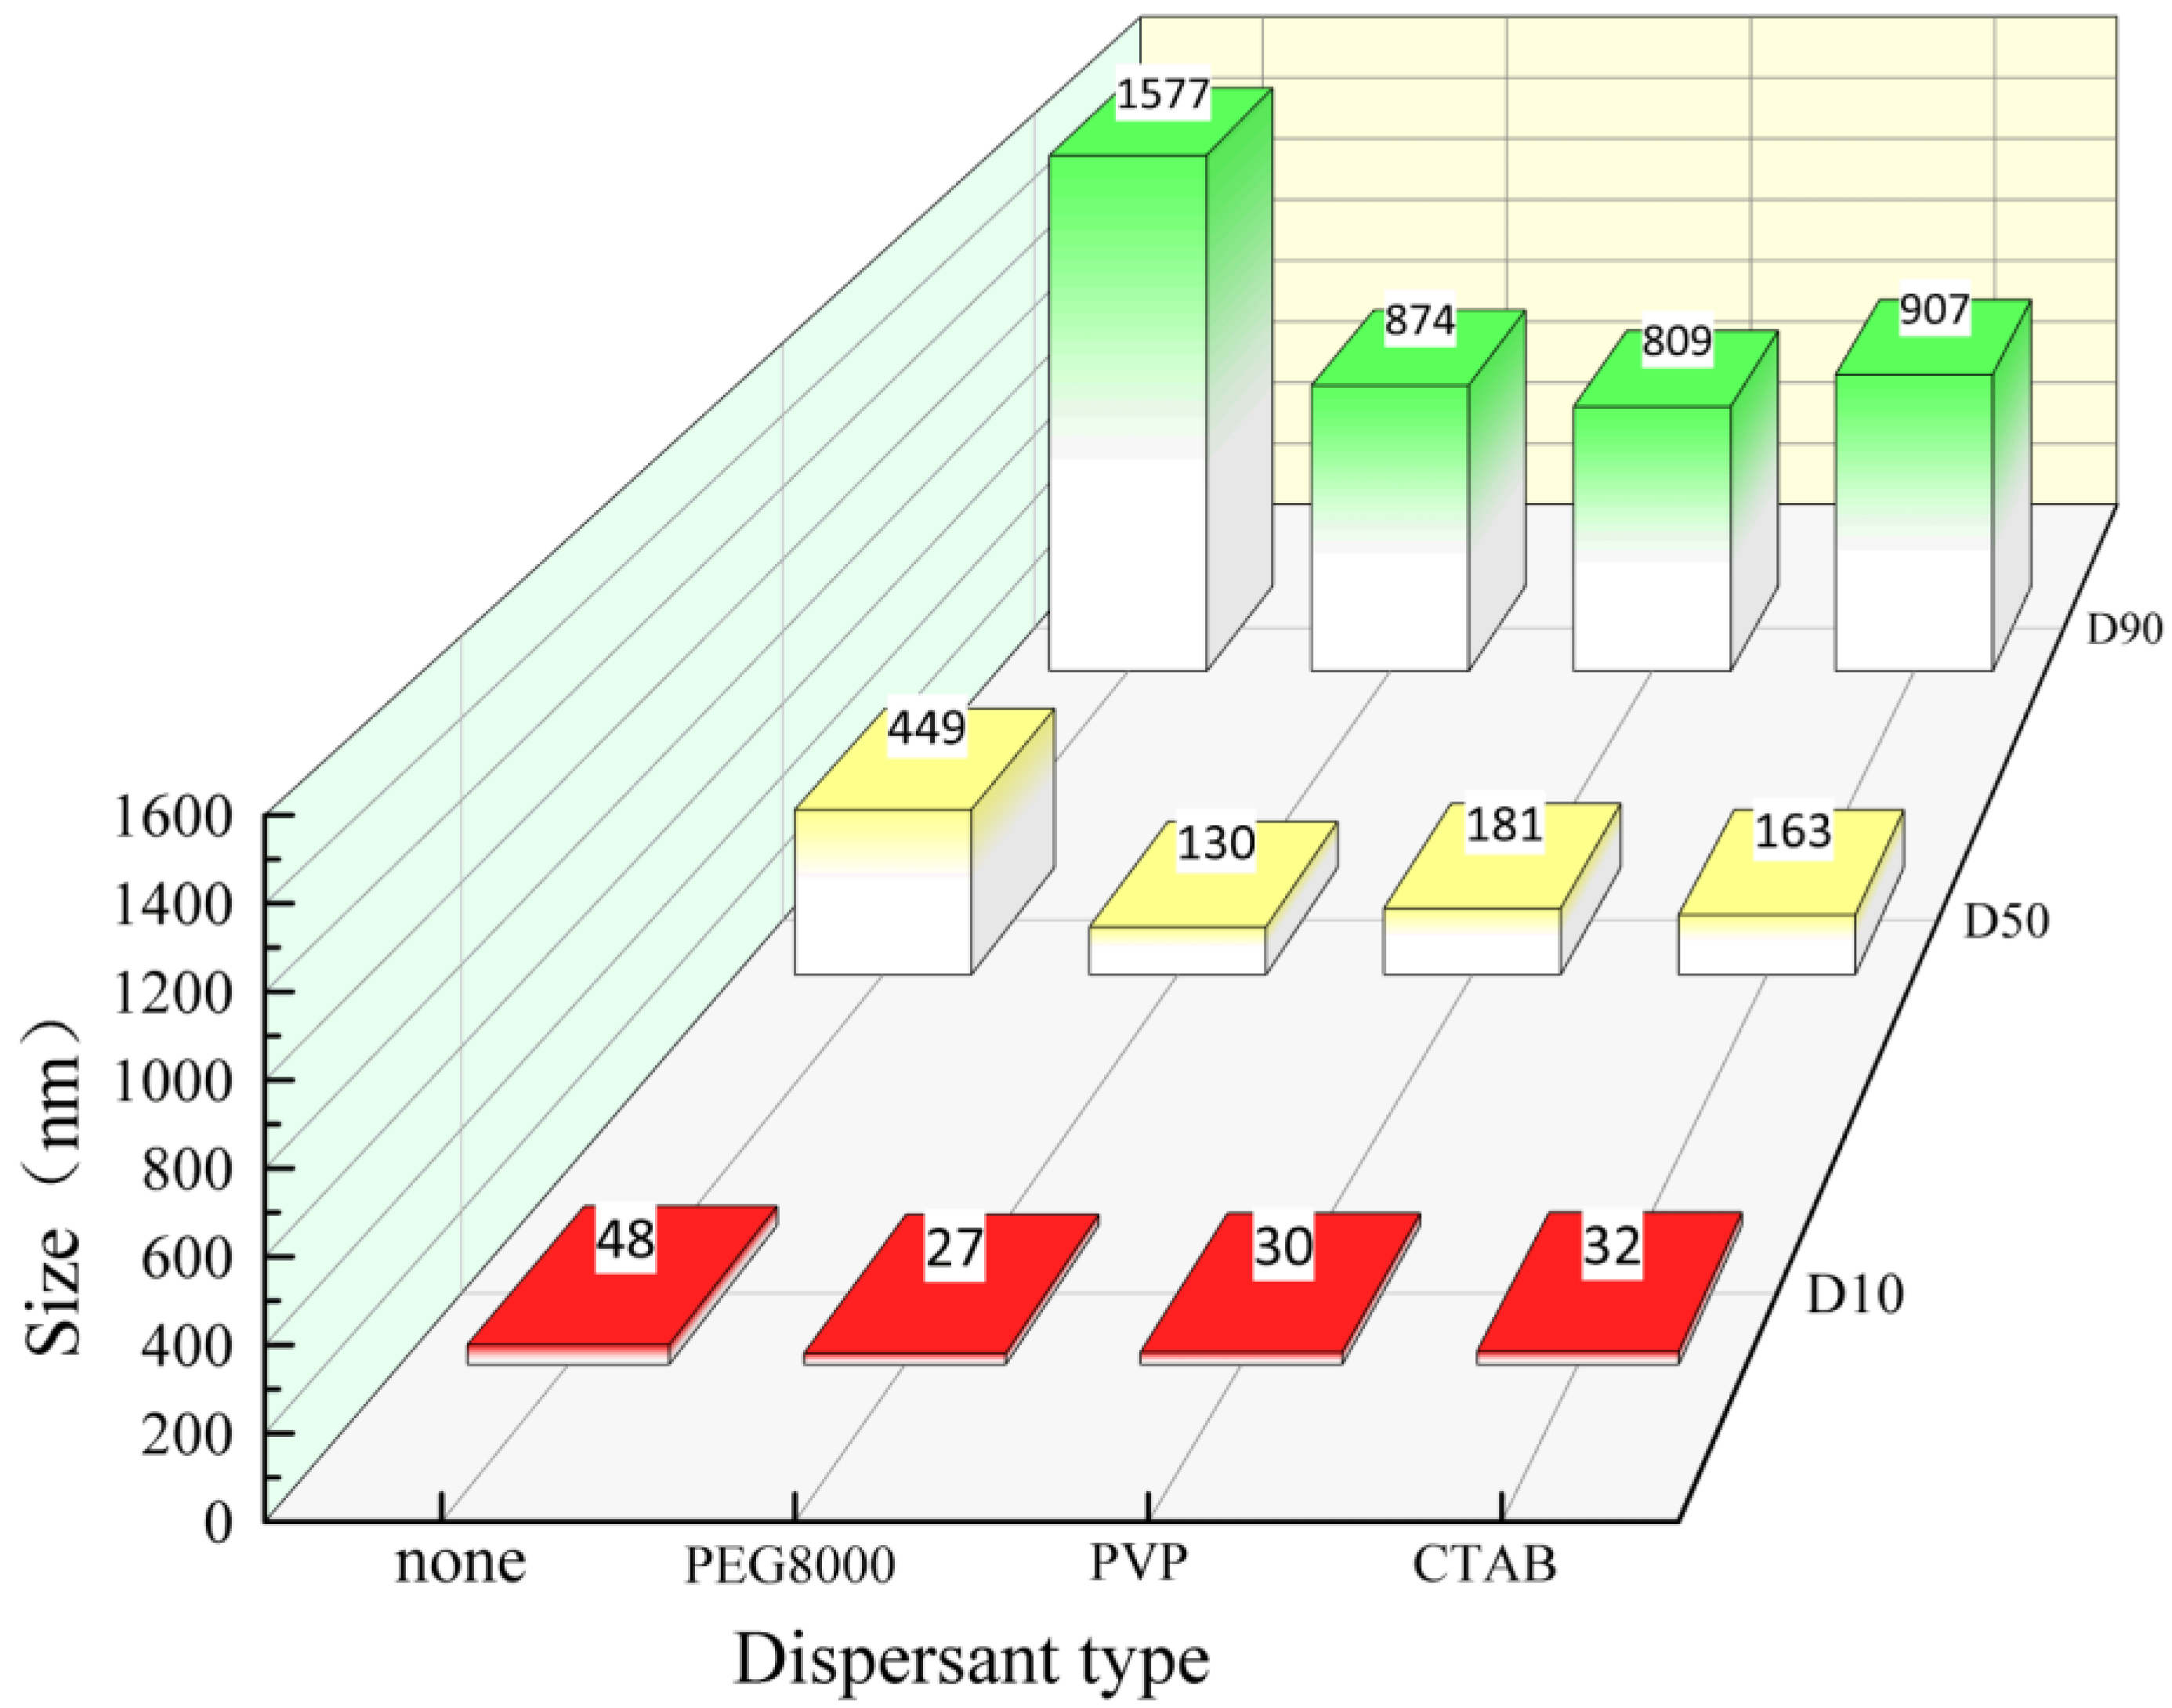
2.4. Dispersant Type

Figure 9 displays the particle size distribution for the optimal addition of the three dispersants. In the supplementary materials (Figures S1–S3), detailed control experiments were conducted on the optimal dosage of three dispersants. Here, the optimal dosage of each dispersant was directly selected for research. As shown in the figure, all three dispersants effectively reduce the size of the sample particle. Figure 10 presents XRD test plots of samples prepared with the optimal content of each of the three dispersants based on the particle size distribution. Specifically, Figure 10a–c correspond to the addition of 0.5 wt% PEG8000, 0.5 wt% PVP, and 0.3 wt% CTAB, respectively. It is observable from these plots that dispersants have almost no impact on the physical phase, with patterns similar to those without dispersants. In Figure 10c, the diffraction peaks of the tetragonal-phase zirconium oxide are observed to have the highest intensity and the narrowest half-height width, indicating a relatively larger grain size. Meanwhile, the other two groups of samples exhibit little difference from each other. Average grain sizes were calculated using the Scherrer equation as 3.75 nm, 3.69 nm, and 3.91 nm, respectively. The general morphological characteristics of the three sets of samples were then observed by scanning electron microscopy.
As indicated in Figure 11, the morphology of the three sample groups with the addition of dispersant is significantly different from that of samples without dispersant, converting from an irregular to a sphere-like shape, accompanied by a notable improvement in the phenomenon of agglomeration and a refinement of the particle size to about 10~20 nm. However, the effects of different types of dispersants are not identical. Samples prepared with PEG8000 dispersant exhibit higher sphericity but relatively larger particle sizes; samples prepared with PVP exhibit the smallest particle size but relatively poor dispersibility; in contrast, CTAB exhibits the best dispersibility and moderate particle size.
To further investigate the effect of different types of dispersant on particle size, samples prepared with optimal addition of the three groups of dispersants were subjected to TEM tests, and the results are presented in Figure 12. When no dispersant was added, the sample particles exhibited poor dispersion, with large agglomerates of fine particles having serious agglomeration. With the addition of a dispersant, the sample was well dispersed, characterized by relatively uniform particle isometric axes and the disappearance of large agglomerates. By measurement and calculation, the average particle size of zirconia nanoparticles prepared with 0.5 wt% PEG8000 was about 9.2 nm, although some particles still agglomerated; the average particle size of zirconia nanoparticles prepared with 0.5 wt% PVP was about 7.3 nm, exhibiting the smallest particle size; and the average particle size of zirconia nanoparticles prepared with 0.3 wt% CTAB was 8.7 nm, featuring uniform isometric morphology and good dispersion.
Glycerol is a polyol composed of three hydrophilic hydroxyl groups. When used as an additive, it exhibits good mutual solubility with water, uniformly disperses and adsorbs around fully hydrolyzed zirconium oxychloride, and plays a crucial role in the regulation of the physical phase, which contributes to the stable existence of the tetragonal phase [33]. By regulating the mass fraction of propanetriol and hydrothermal temperature, pure tetragonal phase nanozirconia can be prepared by adding 5 wt% propanetriol and 10 wt% zirconium chloride, appropriate amounts of dispersant, and reacting under ultrasonic and mechanical stirring for 5 min at a hydrothermal temperature of 200 °C. However, it should be noted that when zirconia phase analysis is performed by XRD, the diffraction peaks corresponding to the tetragonal and cubic phases may overlap. Although the diffraction peaks at 2θ = 35.3° and 60.2° possess slight asymmetry due to the broadening superposition of double peaks with different intensities, which can be used to identify whether the phase is pure tetragonal or not, more reliable phase information can be obtained by adding 0.5 wt% PVP to the sample and subjecting it to the Raman tests. The results are presented in Figure 13.
Figure 13 exhibits the Raman scattering spectra of tetragonal-phase zirconia prepared under optimized conditions in the glycerol system. The figure mainly demonstrates seven distinct peaks in the Raman spectrum, wherein six are located at 147.7 cm−1, 269.8 cm−1, 316.7 cm−1, 472.8 cm−1, 518.9 cm−1, and 648.3 cm−1 in order, respectively, and match with the six primary Raman activation modes of the tetragonal-phase zirconia analyzed by the entropy group theory, belonging to B1g, Eg, B1g, Eg, A1g, and Eg symmetry, respectively. The other scattering peak at 480.1 cm−1 may overlap with the shoulder peak at 472.8 cm−1 and can be attributed to the Eg of the tetragonal phase. Compared to uniform standards reported in the article [34], this result is very close to the theoretical calculation of the laser Raman scattering peak position of the tetragonal-phase zirconia. However, some differences still exist that could be attributed to the imperfect crystallinity of the sample prepared by hydrothermal reaction, the presence of numerous crystal defects, etc. In addition, it can be seen from the observed spectrum that the Raman peak has a more obvious broadening phenomenon, the baseline of the spectrum has a more obvious fluorescence background, and there is no obvious polymer residue in the sample after full washing. These should be due to the introduction of defects in the sample. Moreover, since the tetragonal-phase zirconia and the cubic phase severely overlap in XRD patterns, making them difficult to distinguish, the unique peak position corresponding to the cubic phase zirconia and where the Raman activation mode F2g is located was not observed in the Raman peak, which is typically located close to 490 cm−1 [35]. On the basis of the uniform standards in the articles and the above analysis, it can be concluded that zirconia prepared under optimal conditions in this system exhibits a pure tetragonal phase structure.

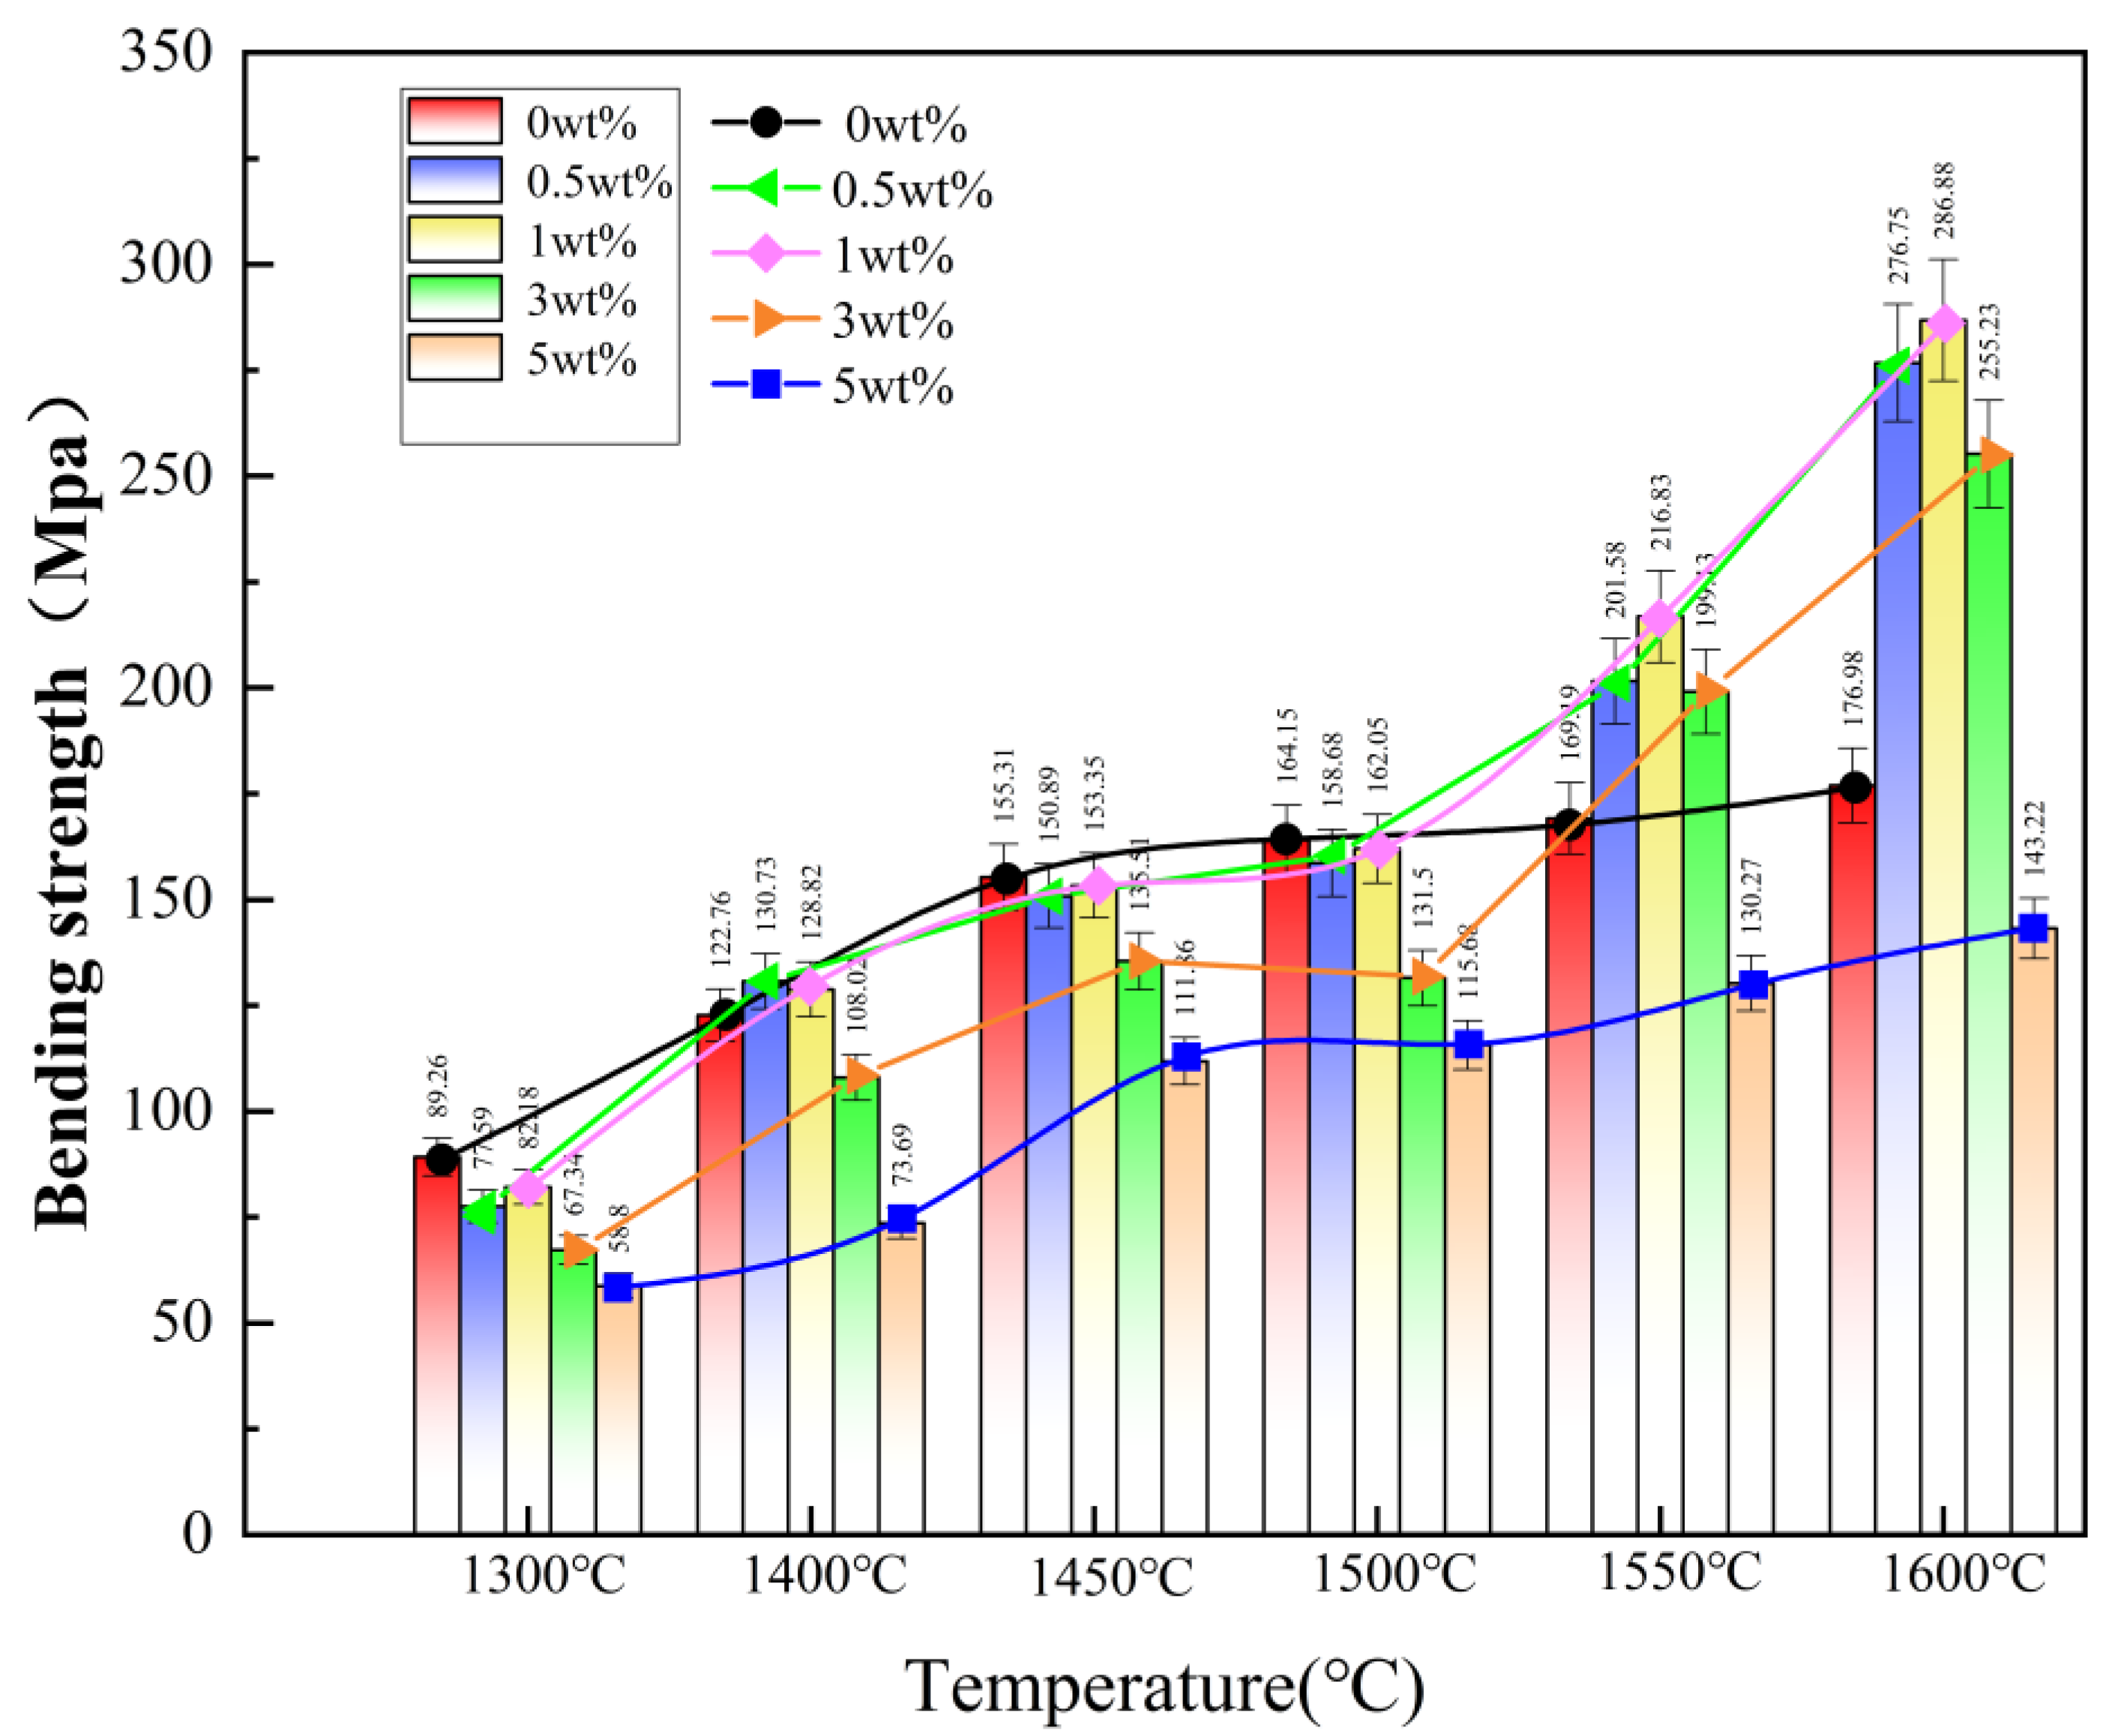
2.5. Effect of Adding Nano-Zirconia on Flexural Strength of 3Y-ZrO2
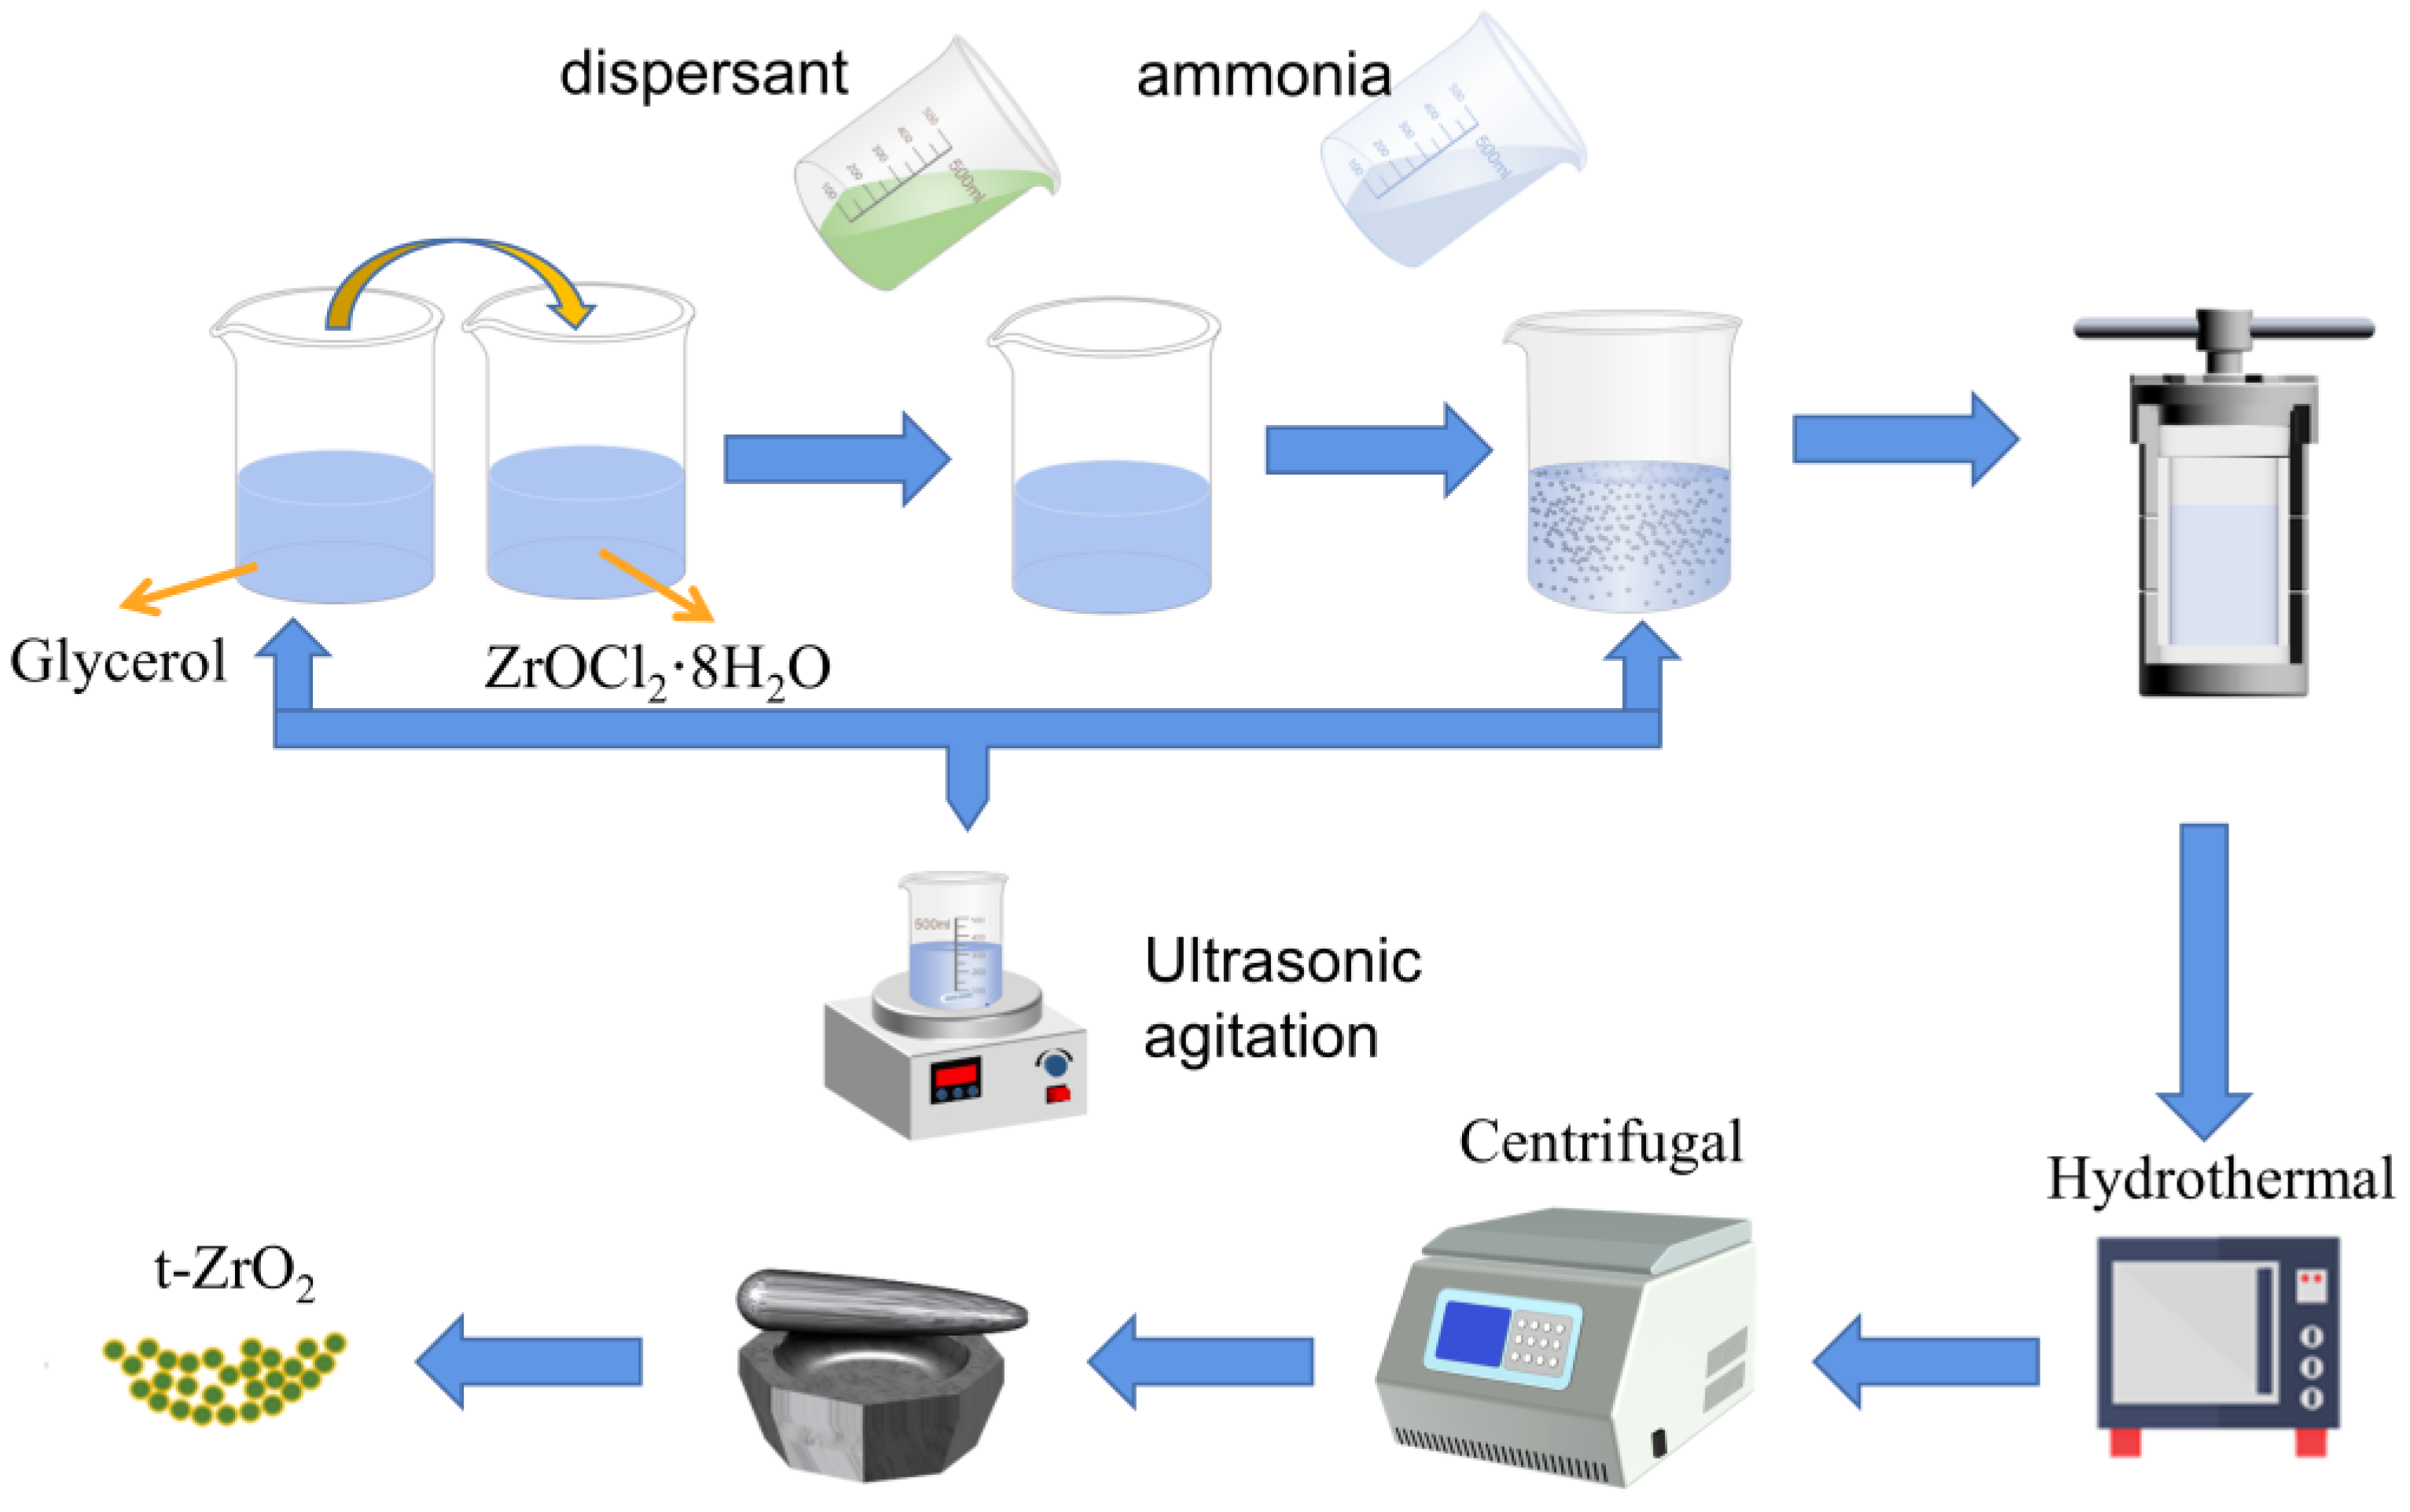
Figure 14 shows the flexural strength of the prepared pure tetragonal-phase zirconia nanoparticles added to 3Y-ZrO2 (3 mol yttrium oxide-stabilized zirconia) at different contents in the glycerol system after calcination at different temperatures. In general, the calcination temperature required to achieve maximum flexural strength in zirconia ceramics is greater than or equal to the sintering temperature of the ceramics. On the basis of the lateral factor analysis of the graph, it can be observed that as the temperature increases, the overall flexural strength gradually increases when nano-zirconia is added at 0 wt%, 0.5 wt%, 1 wt%, 3 wt%, and 5 wt%. When the calcination temperature reaches 1500 °C and continues to increase, the flexural strength of the samples with nanoaddition increases significantly faster, indicating that the sintering temperature of 3Y-ZrO2 with the addition of nanozirconia is greater than 1500 °C. Analysis of different addition factors in the longitudinal direction reveals that in 3Y-ZrO2 samples with the addition of nano-zirconia, the flexural strength exhibits a trend of increase and then decrease with the increase in nanozirconia content, with the highest flexural strength achieved at 1600 °C with the addition of 1 wt% (286.88 Mpa). However, when the calcination temperature is less than or equal to 1500 °C, the flexural strength of the added group is generally not as high as the control group, as the sintering temperature has not yet been reached and the flexural strength continues to increase. At 1600 °C, the flexural strengths of the samples with 0.5 wt%, 1 wt%, and 3 wt% additions were greater than those of the control group, indicating that the addition of zirconia nanoparticles was beneficial to strength improvement, as zirconia nanoparticles themselves act as glass network intermediates and complement the mechanical properties of 3Y-ZrO2. The cross-sectional SEM image of the sample with 1 wt% addition is shown in Figure S4 in the supplementary material. It was shown in that a high flexural strength can be reached by the formation of a comparatively high percentage of fine tetragonal zirconia grains in 3Y-ZrO2 ceramics. Such microstructure provides the implementation of a high energy-consuming fracture micromechanism in flexure due to crack growth along the boundaries of the fine grains or their agglomerates, with rarely occurring cleavage fracture areas. In this case, the crack path undergoes multiple branching occurrences, which slow down the speed of fracture propagation and improve the fracture toughness and strength of ceramics [36,37]. The flexural strength of the samples continued to increase without showing any decreasing trend as the calcination temperature increased. However, according to the report, as the temperature increases in the range of 1200~1600 °C, although the fracture strength of ceramics continues to increase, the fracture toughness of ceramics reaches a maximum at 1500 °C and starts decreasing as the temperature increases further, exhibiting a trend of an increase first and then a decrease. Unfortunately, because of time constraints, no further studies have been conducted at higher sintering temperatures.

3. Experimental

3.1. Materials and Methods

Using the hydrothermal method, the influencing factors regarding the preparation of t-ZrO2 nanopowders were systematically investigated by adding different types and contents of dispersants, with zirconium oxychloride as the zirconium source, ammonia with a mass fraction of 28% as the precipitant, and propanetriol as an additive. Polyethylene glycol 8000 (PEG8000), polyvinylpyrrolidone (PVP), and cetyl trimethyl ammonium bromide (CTAB) were used as dispersants. The contents of the dispersants are shown in Table 1. The zirconium hydroxide precursors were formed by adding propanetriol to the zirconium oxychloride solution under ultrasonic and mechanical stirring conditions, completely dissolving it and then adding dispersant, followed by twice the molar amount of ammonia of zirconium oxychloride, and fully ultrasonic and stirring. To disperse the raw material as homogeneously as possible, we performed a systematic control test on the sonication time and method, setting the power at 80 W and the rotational speed at 1000 RPM, and finally obtained 5 min of sonication and mechanical stirring as the optimal choice. The precursor was transferred to a reactor with a capacity of 50 mL, filled with 75%, and reacted at 200 °C for 12 h. The synthesized sample was allowed to stand in deionized water, and then 0.1 mol/L of silver nitrate solution was added dropwise to the supernatant until no precipitation was produced. Then, the impurity ions were removed by centrifugation three times, dried, and ground to obtain the final sample. The experimental procedure is shown in Figure 15.

3.2. Characterization

The crystal structure and phase composition of the materials were measured by XRD (D8 ADVANCE CEO, BRUKER) under the conditions of Cu Kα radiation and a 2θ range of 20–90°. The crystallite size was estimated from the peak broadening of the (011) reflection in the XRD pattern using the Scherrer equation as follows:
D = K λ β cos θ
The particle size and microscopic morphology of ZrO2 nanopowders were analyzed using field emission scanning electron microscopy (FESEM, INSPECT F50, FEI, USA) to observe their morphological characteristics. The particle size of the particles is measured using a laser particle size analyzer (LT3600, Light Truth) with a controlled refractive index range of 5–8% of the sample at the time of measurement. The microstructure and dispersion of the nanoparticles were observed by transmission electron microscopy (TEM) (JEOL 1400 Flash, JEOL, Japan). The molecular structure of the powder can be characterized by Raman spectroscopy (Lab RAM Armis, HORIBA Jobin Yvon). The three-point bending method (as shown in Figure 16) was used to measure the flexural strength of the ceramics (International Standard ISO 6872:2015 Dentistry—Ceramic materials; ISO, 2015). After the corresponding parameters were set in the equipment, the span distance was adjusted to 20 mm, and the indenter loading speed was 0.5 mm/min. The flexural strength (MPa) was calculated using the following equation:
σ = 3 F L / 2 b h 2
where F is the fracture load (N), L is the distance between the supporting rollers (mm), b is the width of the sample (mm) and h is the thickness of the sample (mm).

4. Conclusions

Pure tetragonal-phase zirconia nanoparticles with good dispersion and an average particle size of 7.3 nm were prepared by the hydrothermal method with the addition of 5 wt% propanetriol, 10 wt% zirconium chloride, 0.5 wt% PVP, ultrasonication and mechanical stirring for 5 min, and a hydrothermal temperature of 200 °C. In the preparation of tetragonal-phase zirconia nanoparticles by propanetriol modulation, it was found that an appropriate amount of propanetriol was favorable for the generation of tetragonal-phase zirconia nanoparticles, and 5 wt% propanetriol induced the complete transformation of the monoclinic phase to the tetragonal phase. The increasing hydrothermal temperature gradually transformed the monoclinic phase into the tetragonal phase. Ultrasonication and mechanical stirring had a certain effect on particle size and distribution, with the optimal effect achieved at 5 min. The addition of dispersant effectively alleviated the agglomeration problem, with 0.5 wt% PVP being particularly favorable for reducing the particle size.
Pure zirconia nanoparticles in the tetragonal phase prepared using propanetriol were added to 3Y-ZrO2 at different contents, and their flexural strengths were tested after calcination at varying temperatures. As the calcination temperature increased to above 1500 °C, the flexural strength of the 3Y-ZrO2 samples with the addition of zirconia nanoparticles showed a trend of initial increase and then decrease with increasing nanoparticle content, and the flexural strength reached its maximum value of 286.88 Mpa at 1600 °C with 1 wt% zirconia nanoparticles added. The performance of 3Y-ZrO2 ceramics after the addition of t-ZrO2 was significantly increased, which provides important academic value and practical significance for the development and preparation of high-performance zirconia nanopowders.

Supplementary Materials

The following supporting information can be downloaded at: https://www.mdpi.com/article/10.3390/inorganics11050217/s1, Figure S1: Particle size distribution of ZrO2 prepared with different mass fractions of PEG8000: (a) 0; (b) 0.1 wt%; (c) 0.3 wt%; (d) 0.5 wt%; (e) 1 wt%; (f) 2 wt%; Figure S2: Particle size distribution of ZrO2 prepared with different mass fractions of PVP: (a) 0; (b) 0.1 wt%; (c) 0.3 wt%; (d) 0.5 wt%; (e) 1 wt%; (f) 2 wt%; Figure S3: Particle size distribution of ZrO2 prepared with different mass fractions of CTAB: (a) 0; (b) 0.1 wt%; (c) 0.3 wt%; (d) 0.5 wt%; (e) 1 wt%; (f) 2 wt%; Figure S4: SEM image of the cross-section of 3Y-ZrO2 calcined sample: (a) 0; (b) 1 wt%.

Author Contributions

Conceptualization and methodology, S.L.; formal analysis and writing—original draft preparation, J.W.; methodology and investigation, Y.C.; formal analysis and data curation, Z.S.; data curation and validation, B.H. and H.W.; validation, T.Z.; methodology, M.L. All authors have read and agreed to the published version of the manuscript.

Funding

This research was funded by the Science and Technology Program of Henan Province, China (222102230034).

Acknowledgments

We thank L. P. Guo from the School of Foreign Languages at Henan University of Technology for help.

Conflicts of Interest

The authors declare no conflict of interest.

References

  1. Basu, B. Toughening of Yttria-Stabilised Tetragonal Zirconia Ceramics. Int. Metall. Rev. 2005, 50, 239–256. [Google Scholar] [CrossRef]
  2. You, X.; Chen, F.; Zhang, J.; Anpo, M. A Novel Deposition Precipitation Method for Preparation of Ag-Loaded Titanium Dioxide. Catal. Lett. 2005, 102, 247–250. [Google Scholar] [CrossRef]
  3. Huang, W.; Qiu, H.; Zhang, Y.; Nan, L.; Gao, L.; Chen, J.; Omran, M.; Chen, G. Preparation of Nano Zirconia by Binary Doping: Effect of Controlled Sintering on Structure and Phase Transformation. Ceram. Int. 2022, 48, 25374–25381. [Google Scholar] [CrossRef]
  4. Albayrak, S.; Becker-Willinger, C.; Aslan, M.; Veith, M. Influence of Nano-Scaled Zirconia Particles on the Electrical Properties of Polymer Insulating Materials. IEEE Trans. Dielectr. Electr. Insul. 2012, 19, 76–82. [Google Scholar] [CrossRef]
  5. Rehman, M.; Noor, T.; Iqbal, N. Effect of Zirconia on Hydrothermally Synthesized Co3O4/TiO2 Catalyst for NOx Reduction from Engine Emissions. Catalysts 2020, 10, 209. [Google Scholar] [CrossRef]
  6. Hori, C. Thermal Stability of Oxygen Storage Properties in a Mixed CeO2-ZrO2 System. Appl. Catal. B Environ. 1998, 16, 105–117. [Google Scholar] [CrossRef]
  7. Mandal, S.; Kumar, C.; Kumar, D.; Syed, K.; Ende, M.; Jung, I.; Finkeldei, S.C.; Bowman, W.J. Designing Environment-friendly Chromium-free Spinel-Periclase-Zirconia Refractories for Ruhrstahl Heraeus Degasser. J. Am. Ceram. Soc. 2020, 103, 7095–7114. [Google Scholar] [CrossRef]
  8. Jiang, L.; Guo, S.; Bian, Y.; Zhang, M.; Ding, W. Effect of Sintering Temperature on Mechanical Properties of Magnesia Partially Stabilized Zirconia Refractory. Ceram. Int. 2016, 42, 10593–10598. [Google Scholar] [CrossRef]
  9. Liu, C.X.; Gao, N. An Enzymesensor Based on Strongly Negative Nano-Zirconia-Embedded Carben Paste Electrode for H_2O_2 Assay. Chem. Sens. 2005, 25, 17–20. [Google Scholar] [CrossRef]
  10. Li, N.; Yu, N.; Yi, Z.; An, D.; Xie, Z. CeO2-Stabilised ZrO2 Nanoparticles with Excellent Sintering Performances Synthesized by Sol-Gel-Flux Method. J. Eur. Ceram. Soc. 2022, 42, 1645–1655. [Google Scholar] [CrossRef]
  11. Cousland, G.P.; Cui, X.Y.; Smith, A.E.; Stampfl, A.P.J.; Stampf, C.M. Mechanical Properties of Zirconia, Doped and Undoped Yttria-Stabilized Cubic Zirconia from First-Principles. J. Phys. Chem. Solids 2018, 122, 51–71. [Google Scholar] [CrossRef]
  12. Kelly, J.R.; Denry, I. Stabilized Zirconia as a Structural Ceramic: An Overview. Dent. Mater. 2008, 24, 289–298. [Google Scholar] [CrossRef] [PubMed]
  13. Pezzotti, G.; Zhu, W.; Zanocco, M.; Marin, E.; Sugano, N.; Mcentire, B.J.; Bal, B.S. Reconciling in Vivo and in Vitro Kinetics of the Polymorphic Transformation in Zirconia-Toughened Alumina for Hip Joints: II. Theory. Mater. Sci. Eng. C 2017, 72, 446–451. [Google Scholar] [CrossRef] [PubMed]
  14. Guo, H.; Khor, K.A.; Yin, C.B.; Miao, X. Laminated and Functionally Graded Hydroxyapatite/Yttria Stabilized Tetragonal Zirconia Composites Fabricated by Spark Plasma Sintering. Biomaterials 2003, 24, 667–675. [Google Scholar] [CrossRef]
  15. Torres-Lagares, D. A Review on CAD/CAM Yttria-Stabilized Tetragonal Zirconia Polycrystal (Y-TZP) and Polymethyl Methacrylate (PMMA) and Their Biological Behavior. Polymers 2022, 14, 906. [Google Scholar] [CrossRef]
  16. Guo, M.; Wang, G.; Zhao, Y.; Li, H.; Burgess, K. Preparation of Nano-ZrO2 Powder via a Microwave-Assisted Hydrothermal Method. Ceram. Int. 2021, 47, 12425–12432. [Google Scholar] [CrossRef]
  17. Salas, P.; Rosa-Cruz, E.; Mendoza-Anaya, D.; González, P.; Rodrguez, R.; Castao, V.M. High Temperature Thermoluminescence Induced on UV-Irradiated Tetragonal ZrO2 Prepared by Sol–Gel. Mater. Lett. 2000, 45, 241–245. [Google Scholar] [CrossRef]
  18. Song, J.; Zhang, H.; Feng, Z.; Zhang, J.; Huang, X. Controllable Preparation of 5mol% Y2O3-Stabilized Tetragonal ZrO2 by Hydrothermal Method. J. Alloys Compd. 2020, 856, 156766. [Google Scholar] [CrossRef]
  19. Yurdakul, A.; Gocmez, H. One-Step Hydrothermal Synthesis of Yttria-Stabilized Tetragonal Zirconia Polycrystalline Nanopowders for Blue-Colored Zirconia-Cobalt Aluminate Spinel Composite Ceramics. Ceram. Int. 2019, 45, 5398–5406. [Google Scholar] [CrossRef]
  20. Yang, C.; Jin, Z.; Chen, X.; Fan, J.; Fan, Y. Modified Wet Chemical Method Synthesis of Nano-ZrO2 and Its Application in Preparing Membranes. Ceram. Int. 2021, 47, 13432–13439. [Google Scholar] [CrossRef]
  21. Qiu, H.; Zhang, Y.; Huang, W.; Peng, J.; Chen, J.; Gao, L.; Omran, M.; Li, N.; Chen, G. Sintering Properties of Tetragonal Zirconia Nanopowder Preparation of the NaCl + KCl Binary System by the Sol–Gel–Flux Method. ACS Sustain. Chem. Eng. 2023, 11, 1067–1077. [Google Scholar] [CrossRef]
  22. Duran, C.; Jia, Y.; Sato, K.; Hotta, Y.; Watari, K. Hydrothermal Synthesis of Nano ZrO2 Powders. Key Eng. Mater. 2006, 317–318, 195–198. [Google Scholar] [CrossRef]
  23. Hsu, Y.-W.; Yang, K.-H.; Chang, K.-M.; Yeh, S.-W.; Wang, M.-C. Synthesis and Crystallization Behavior of 3 Mol% Yttria Stabilized Tetragonal Zirconia Polycrystals (3Y-TZP) Nanosized Powders Prepared Using a Simple Co-Precipitation Process. J. Alloys Compd. 2011, 509, 6864–6870. [Google Scholar] [CrossRef]
  24. Chevalier, J.; Gremillard, L.; Virkar, A.V.; Clarke, D.R. The Tetragonal-Monoclinic Transformation in Zirconia: Lessons Learned and Future Trends. J. Am. Ceram. Soc. 2010, 92, 1901–1920. [Google Scholar] [CrossRef]
  25. Gionco, C.; Hernández, S.; Castellino, M.; Gadhi, T.A.; Paganini, M.C. Synthesis and Characterization of Ce and Er Doped ZrO2 Nanoparticles as Solar Light Driven Photocatalysts. J. Alloys Compd. 2018, 775, 896–904. [Google Scholar] [CrossRef]
  26. Morales–Rodríguez, A.; Poyato, R.; Gutiérrez–Mora, F.; Muñoz, A.; Gallardo–López, A. The Role of Carbon Nanotubes on the Stability of Tetragonal Zirconia Polycrystals. Ceram. Int. 2018, 44, 17716–17723. [Google Scholar] [CrossRef]
  27. Sun, J.; Gao, L.A.; Guo, J.K. Effect of Dispersant on the Measurement of Particle Size Distribution of Nano Size Y-TZP. J. Inorg. Mater. 1999, 14, 465–469. [Google Scholar] [CrossRef]
  28. Yu, J.; Yu, F.-X.; Wang, S.; Zhang, J.-F.; Fan, F.-Q.; Long, Q. Effect of Dispersant Content and Drying Method on ZrO2@Al2O3 Multiphase Ceramic Powders. Ceram. Int. 2018, 44, 17630–17634. [Google Scholar] [CrossRef]
  29. Lin, C.; Zhang, C.; Lin, J. Phase Transformation and Photoluminescence Properties of Nanocrystalline ZrO2 PowdersPrepared via the Pechini-Type SolGel Process. J. Phys. Chem. C 2007, 111, 3300–3307. [Google Scholar] [CrossRef]
  30. Noh, H.J.; Seo, D.S.; Kim, H.; Lee, J.K. Synthesis and Crystallization of Anisotropic Shaped ZrO2 Nanocrystalline Powders by Hydrothermal Process. Mater. Lett. 2003, 57, 2425–2431. [Google Scholar] [CrossRef]
  31. Chang, Q.; Zhou, J.; Wang, Y.; Meng, G. Formation Mechanism of Zirconia Nano-Particles Containing Pores Prepared via Sol-Gel-Hydrothermal Method. Adv. Powder Technol. 2010, 21, 425–430. [Google Scholar] [CrossRef]
  32. Chao, Y.A.; Jw, A.; Xc, A.; Xd, A.; Mq, A.; Hv, B.; Yf, A. Modified Hydrothermal Treatment Route for High-Yield Preparation of Nanosized ZrO2. Ceram. Int. 2020, 46, 19807–19814. [Google Scholar] [CrossRef]
  33. Zang, S.; Yang, Q.; He, N.; Ji, Y.; Yang, H. Influence of Additives on the Tetragonal Phase Purity and Grain Size of Zirconia. J. Clin. Rehabil. Tissue Eng. Res. 2018, 22, 5445–5451. [Google Scholar] [CrossRef]
  34. Mondal, A.; Zachariah, A.; Nayak, P.; Nayak, B.B. Synthesis and Room Temperature Photoluminescence of Mesoporous Zirconia with a Tetragonal Nanocrystalline Framework. J. Am. Ceram. Soc. 2010, 93, 387–392. [Google Scholar] [CrossRef]
  35. Thackeray, D. The Raman Spectrum of Zirconium Dioxide. Spectrochim. Acta Part A Mol. Spectrosc. 1974, 30, 549–550. [Google Scholar] [CrossRef]
  36. Kulyk, V.; Duriagina, Z.; Vasyliv, B.; Vavrukh, V.; Kovbasiuk, T.; Lyutyy, P.; Vira, V. The Effect of Sintering Temperature on the Phase Composition, Microstructure, and Mechanical Properties of Yttria-Stabilized Zirconia. Materials 2022, 15, 2707. [Google Scholar] [CrossRef]
  37. Kulyk, V.; Duriagina, Z.; Kostryzhev, A.; Vasyliv, B.; Vavrukh, V.; Marenych, O. The Effect of Yttria Content on Microstructure, Strength, and Fracture Behavior of Yttria-Stabilized Zirconia. Materials 2022, 15, 5212. [Google Scholar] [CrossRef]
Figure 1. Particle size distribution of ZrO2 with different mass fractions of propanetriol. (a) 1 wt%; (b) 2.5 wt%; (c) 5 wt%; (d) 10 wt%.
Inorganics 11 00217 g001
Figure 2. TEM images of ZrO2 material with different mass fractions of glycerol: (a) 1 wt%; (b) 2.5 wt%; (c) 5 wt%; (d) 10 wt%.
Inorganics 11 00217 g002
Figure 3. Effect of different mass fractions of propanetriol on ZrO2 crystals: (a) 1 wt%; (b) 2.5 wt%; (c) 5 wt%; (d) 10 wt%.
Inorganics 11 00217 g003
Figure 4. SEM images of ZrO2 material with different mass fractions of propanetriol: (a) 2.5 wt%; (b) 5 wt%.
Inorganics 11 00217 g004
Figure 5. Particle size distribution of ZrO2 with different ultrasound + mechanical stirring times: (a) mechanical stirring 2 min; (b) 2 min; (c) 5 min; (d) 10 min.
Inorganics 11 00217 g005
Figure 6. Distribution of the particle size of ZrO2 at different hydrothermal temperatures.
Inorganics 11 00217 g006
Figure 7. Influence of different hydrothermal temperatures on ZrO2 crystals: (a) 160 °C; (b) 180 °C; (c) 200 °C.
Inorganics 11 00217 g007
Figure 8. SEM images of the ZrO2 material at different hydrothermal temperatures for the glycerol system: (a) 160 °C; (b) 180 °C; (c) 200 °C.
Inorganics 11 00217 g008
Figure 9. Particle size distribution of ZrO2 prepared under the conditions of optimal addition of different types of dispersants: 0.5 wt% PEG8000; 0.5 wt% PVP; 0.3 wt% CTAB.
Inorganics 11 00217 g009
Figure 10. Effect of different types of dispersants on ZrO2 crystals under optimal addition conditions: (a) 0.5 wt% PEG8000; (b) 0.5 wt% PVP; (c) 0.3 wt% CTAB.
Inorganics 11 00217 g010
Figure 11. SEM images of ZrO2 prepared by different kinds of dispersants of the propanetriol system under optimal addition conditions: (a) none; (b) 0.5 wt% PEG8000; (c) 0.5 wt% PVP; (d) 0.3 wt% CTAB.
Inorganics 11 00217 g011
Figure 12. TEM images of ZrO2 prepared by different types of dispersants of the glycerol system under optimal addition conditions: (a) none; (b) 0.5 wt% PEG8000; (c) 0.5 wt% PVP; (d) 0.3 wt% CTAB.
Inorganics 11 00217 g012
Figure 13. Raman spectra of samples under optimal conditions of the glycerol system.
Inorganics 11 00217 g013
Figure 14. Flexural strength of the sample strips after calcination by adding the prepared zirconia to 3Y-ZrO2.
Inorganics 11 00217 g014
Figure 15. Flow chart of the preparation of tetragonal phase nano-zirconia powder.
Inorganics 11 00217 g015
Figure 16. Schematic diagram of the three-point bending method.
Inorganics 11 00217 g016
Table 1. Factor levels at different dispersant mass fractions in the preparation of ZrO2 nanoparticles.
Sample NumberPEG8000 (wt%)PVP (wt%)CTAB (wt%)Zirconium Oxychloride:GlycerolHydrothermal Reaction Temperature (°C)
1 ///2:1200
20.10.10.12:1200
30.30.30.32:1200
40.50.50.52:1200
51112:1200
62222:1200
Disclaimer/Publisher’s Note: The statements, opinions and data contained in all publications are solely those of the individual author(s) and contributor(s) and not of MDPI and/or the editor(s). MDPI and/or the editor(s) disclaim responsibility for any injury to people or property resulting from any ideas, methods, instructions or products referred to in the content.

