
Superoxide Radical Formed on the TiO2 Surface Produced from Ti(OiPr)4 Exposed to H2O2/KOH

1
Voevodsky Institute of Chemical Kinetics and Combustion, Russian Academy of Sciences, Novosibirsk 630090, Russia
2
Department of Veterinary Clinical Medicine, University of Illinois at Urbana-Champaign, Urbana, IL 61801, USA
*
Author to whom correspondence should be addressed.
Inorganics 2023, 11(7), 274; https://doi.org/10.3390/inorganics11070274
Submission received: 8 May 2023
/
Revised: 11 June 2023
/
Accepted: 24 June 2023
/
Published: 27 June 2023
(This article belongs to the Special Issue 10th Anniversary of Inorganics: Inorganic Materials)
Abstract
:In this study, the superoxide radical O2•− formed by treating Ti(OR)4 (R = iPr, nBu) with H2O2 in the presence of KOH was detected in the EPR spectra. The g-tensor of this radical differs from the typical values reported for a superoxide on various TiO2 surfaces. On the other hand, similar g-tensor components g||(zz = 2.10 ± 0.01, g⊥ = 2.005 ± 0.003 assigned to the O2•− were previously observed for radicals in aqueous solutions in the presence of K2O, alkaline solutions of DMSO, and water/DMSO mixtures. A common factor in all these systems is the presence of alkali ions. However, there was no structural support for the possible interaction of alkali ions with a superoxide in these systems. The use of multifrequency pulsed EPR techniques in this work revealed the stabilization of the O2•− near the K+ ion and its involvement in a strong hydrogen bond with the surface. These findings are consistent with the features previously reported for superoxides on a Na pre-covered MgO surface. Interactions with a closely located 23Na and a strongly coupled 1H proton were also seen in the HYSCORE spectra but assigned to two different superoxides with various gzz values presented in the sample.
1. Introduction
Superoxide anion (O2•−) is a radical formed after the one-electron reduction of dioxygen O2, in different chemical processes [1]. In reactions with organic compounds, it can behave as a base, a nucleophile, and an oxidizing or reducing agent [2,3]. O2•− is paramagnetic, which has allowed for broad applications of multifrequency, continuous wave (CW) EPR spectroscopy for its studies [4,5,6,7,8].
The treatment of an oxide with a solution of hydrogen peroxide (H2O2), followed by drying the obtained solid under a vacuum has been also employed for generations of the superoxide radicals [9]. A product with matrix-bound O2•−, produced by treating Ti(OR)4 (R = iPr, nBu) with H2O2, was described and used as a selective heterogeneous catalyst for the oxidation of organic compounds [10]. It is effective at room temperatures and with various solvents including water.
Detailed studies of the catalyst using various experimental methods have shown that O2•− is responsible for the reaction, and its exceptional stability results from a stabilization near Ti4+ on the TiO2 surface with a contribution of H2O molecules and/or OH groups [10,11,12]. However, the nature and strength of O2•− interactions with the surrounding molecules was not characterized.
In our previous work, paramagnetic O2•− intermediates formed during the decomposition of H2O2 on the TiO2 surface have been studied employing X- and Q-band CW and pulsed EPR spectroscopy. Exploiting high-resolution pulsed EPR techniques, i.e., 1D and 2D ESEEM (Electron Spin Echo Envelope Modulation) and ENDOR (Electron-Nuclear Double Resonance), weak interactions between the superoxide unpaired electron and the surrounding protons were quantitatively characterized. This enabled us to modify the model of the O2•− with its surrounding environment on the TiO2 surface [13]. In this work, we found that the superoxide radical with different EPR spectroscopic characteristics is formed in reaction with Ti(OR)4 (R = iPr, nBu) and H2O2 in the presence of a KOH solution. The application of pulsed EPR techniques has led to our finding that the stabilization of this O2•− is due to proximity to K+ ion and its involvement in a strong hydrogen-bonding interaction with the surface.
2. Materials and Methods
2.1. Preparation of the Catalysts
The TiO2/O2•− catalyst studied in our previous work [13] was prepared from Ti(OiPr)4 exposed to H2O2 following the method described in [10]. The dried powder obtained at the end of this procedure was transferred in quartz X- and Q-band EPR tubes, degassed, sealed, and used in the EPR experiments described in [13] (further called “sample I” in this article). It is known that radiolytically or photochemically generated superoxide reacts with tyrosine, forming phenoxyl radicals of tyrosine [14,15]. We aimed to test the appearance of this species in a similar reaction using tyrosine with superoxide on the surface without prior irradiation. The solubility of tyrosine in alcohol is highly pH-dependent [16]. Initially, we tried to initiate a reaction of tyrosine with superoxide by adding tyrosine to the TiO2 dispersion powder from an alcohol solution or from its mixture with low concentration KOH. EPR spectra of these samples show a rhombic signal consistent with the spectrum of the O2•− radical found in sample I. On the contrary, a signal with an axial g-tensor and increased gzz was observed in samples with a higher KOH concentration (pH > 10). Similar results were obtained upon joint addition of peroxide and tyrosine in an alkaline alcohol solution to Ti(OCH(CH3)2)4. The presence of an axial EPR signal was also confirmed in the control experiment by adding KOH in methanol without tyrosine to the TiO2/O2•− catalyst (sample II).
Earlier, in aqueous solutions and mixtures containing alkali metals (M), radicals with similar EPR characteristics attributed to O2•– were found, which suggests a special role of M+ ions in these samples for the radical stabilization. However, no structural EPR support was provided for this hypothesis. Therefore, this paper describes the pulsed EPR characterization of the superoxide radical and its environment in the type II samples containing K+ ions.
2.2. EPR Measurements
The CW EPR, two-dimensional, four-pulse hyperfine sublevel correlation (HYSCORE, π/2 − τ − π/2 − t1 − π − t2 − π/2 − τ − echo) [17], and Davies pulsed ENDOR (π − t − π/2 − τ − π − τ − echo) [18]) experiments were performed as previously described elsewhere [13]. The Bruker WIN-EPR software was used for spectral processing.
3. Results and Discussions
3.1. EPR Spectra of Dried TiO2 + H2O2
X- and Q-band EPR spectra of a dried sample of TiO2 (solution of Ti(OiPr)4 treated with H2O2, sample I) were reported in [13]. They show a signal with rhombic g-tensor produced by the decomposition of H2O2 on the TiO2 surface (Figure S1). The g-tensor principal components (2.024, 2.009, and 2.003) determined from the Q-band spectrum supports the formation of a stable superoxide radical O2•− [10], because they are in line with values usually reported for the superoxide on various TiO2 surfaces (O2•−-Ti4+) (see Table S1).
3.2. EPR Spectra in the Presence of KOH
Figure 1 and Figure S2 show Q- and X-band EPR spectra of the radical formed in sample II. The spectra were obtained as a field-swept two-pulse Electron Spin Echo (ESE) signal and its calculated derivative. In contrast to sample I, the shapes of these spectra possess a typical axial g-tensor anisotropy with principal values g||(zz) = 2.10, g⊥(x,y) = 2.002, and a total width of ~20 mT in the X-band. We used the field-sweep ESE because a broad g||(zz) feature was not clearly resolved in CW EPR spectra. The EPR signals with similar g-tensor components g||(zz) = 2.10 ± 0.01 and g⊥ =2.005 ± 0.003 assigned to the superoxide radical have previously been observed in water solutions with the presence of K2O, alkaline DMSO solutions, and water/DMSO mixtures (Table 1). One can note that the common factor in all these systems is the presence of alkaline ions. Earlier studies have found a good correlation of the superoxide gzz value with the oxidation state of the nearest metal cation [5,19]. Particularly, a comparison of our data with the reported empirical dependence [5] indicates that gzz = 2.0227 for the superoxide in sample I is consistent with its suggested location near Ti4+. In contrast, gzz = 2.10 is within the region reported for M+ and may display the radical location near an alkaline cation in sample II as well as in the compounds shown in Table 1.
3.3. Pulsed EPR Characterization of the Radical
Interactions between the O2•− species and its environment in samples I and II were probed using HYSCORE and pulsed ENDOR techniques. Our previous HYSCORE studies of the superoxide in sample I have found only weakly coupled protons, with the anisotropic couplings T not exceeding ~2 MHz (Supplementary Materials, Section S1) [13]. These protons produce cross-features located along an antidiagonal crossing the diagonal of the (++) quadrant at the (ν1H, ν1H) point, where ν1H is the proton Zeeman frequency in the applied magnetic field (Figure S3).
In contrast, the X-band HYSCORE spectrum of sample II (Figure 2) is dominated by a pair of cross-ridges 1H that significantly deviated from the (ν1H, ν1H) antidiagonal. This indicates the presence of proton(s) with a substantially stronger anisotropic hyperfine interaction [22] than the protons contributing to the spectra of sample I (Figure S3). One can also note that the 1H spectrum in Figure 2 clearly shows additional features 1′H that also deviated from the 1H antidiagonal but oriented in the opposite matter relative to this line. In the course of the analysis described below, we provide evidence that the 1H and 1′H lines are parts of the same cross-feature located on opposite sides of the diagonal of the (++) quadrant. Lines from weaker coupled protons, elongated along the antidiagonal (ν1H, ν1H), are also present in the spectra of sample II but possess a lower intensity.
The Q-band HYSCORE spectrum of sample II (Figure 2, right) shows an extended straight ridge around a diagonal frequency of 2.4 MHz with a total length of ~2 MHz. This line is produced by the interaction with 39K (nuclear spin I = 3/2) possessing a Zeeman frequency of 2.409 MHz in the applied magnetic field 1212.5 mT. The natural abundance of 39K is 93.26%. The second stable isotope 41K has the same nuclear spin and natural abundance of 6.73%. The Zeeman frequency of 41K in the specified field is 1.32 MHz. However, the spectrum in Figure 2 does not contain any features near this frequency on the diagonal line.
4. Discussions
4.1. Analysis of the 1H HYSCORE Spectra
Quantitative analysis of 1H cross-ridges from the HYSCORE spectra of the O2•− in samples I and II, based on linear regression of contour line shapes in ν12 vs. ν22 coordinates [26], gives isotropic and anisotropic components of hyperfine tensors in axial approximation for protons interacting with the electron spin of the superoxide. Detailed explanations and results of the analysis are provided in the Supplementary Materials, Section S1.
In particular, a representation of the cross-ridges 1H from the spectra of sample I prepared with H2O2 and D2O2 in coordinates ν12 vs. ν22 gives anisotropic hyperfine coupling T = 2.0 ± 0.2 MHz for the contributing proton(s) (Figure S4 and Table S2) [13]. The estimated value of T ~ 2 MHz is supported by the negligible deviation of the cross-ridges from the antidiagonal in the experimental spectra. A similar analysis of the cross-ridges 1H and 1′H with the visible deviation from the antidiagonal (Figure S5) in sample II provides the value of anisotropic coupling of T ~ 7.0 MHz, which significantly exceeds the hyperfine coupling of T ~ 2 MHz for protons interacting with O2•− in sample I.
4.2. Evaluation of the Proton Anisotropic Hyperfine Couplings
The anisotropic couplings of T ~ 2 MHz and ~7 MHz for the superoxide-proton interactions in samples I and II indicate different relative locations of the O–O molecule and protons. The value of ~7 MHz is closer to previously reported 1H hyperfine couplings of T ~ 10 MHz and 9.8 MHz for a species with similar g-tensor generated on from KO2 reacting with water in a H2O/DMSO mixture in the presence of ubiquinone-10 [22] and a Na pre-covered MgO surface [27], respectively. The anisotropic hyperfine tensor for the proton located near the O2•− is the result of a magnetic dipole–dipole interaction with an unpaired π spin density distributed approximately equally over two oxygens. The tensor depends on a proton position relative to the O–O bond and is generally rhombic [28]. When the interaction between the electron and the proton spins is described by the point dipole approximation the anisotropic parameter is defined by the expression T = (MHz) [13], where r is the distance between spins.
The dipole–dipole interaction is described by an axially symmetric tensor with diagonal principal values
in the principal axes coordinate, with the z axis directed along the direction.
T = [Txx, Tyy, Tzz] = T [−1, −1, 2]
A proton near the superoxide oxygens O1 and O2, carrying unpaired spin densities ρ1 and ρ2, experiences a local magnetic field, which is a vector sum of two contributions depending on the O1–H (r1) and the O2–H (r2) distances (Figure S9). The principal values of the rhombic hyperfine tensor in this case are [28]
where δ = [T12 + T22 + 2T1T2cos(2α + 2β)]1/2, T1 = 79ρ1/r13, T2 = 79ρ2/r23. Equation (2) transforms to the traditional axial form
for the proton located on the O1––O2 line with β = 180°and δ = T1 + T2.
T = [½(T1 + T2 − 3δ), − (T1 + T2), ½(T1 + T2 + 3δ)]
T = [−(T1 + T2), −(T1 + T2), 2(T1 + T2)]
The relations between the sides and angles of the triangle HO1O2 (Figure S8)
allow us to define the tensor components based on one distance (r1, O1–H distance) and one angle (β, angle between H–O1 and O1–O2).
It has been shown that the unpaired spin density is almost equally (ρ1,2 ~ 0.5) distributed on the 2pπx of each oxygen in superoxide radicals studied in a solution [29], on a MgO surface [30], and generated in TiAlPO-5 [31]. The reported O–O distance in the superoxide varies between 1.32–1.35 Å [29,32,33,34] and increases under the influence of hydrogen bonds [29,32].
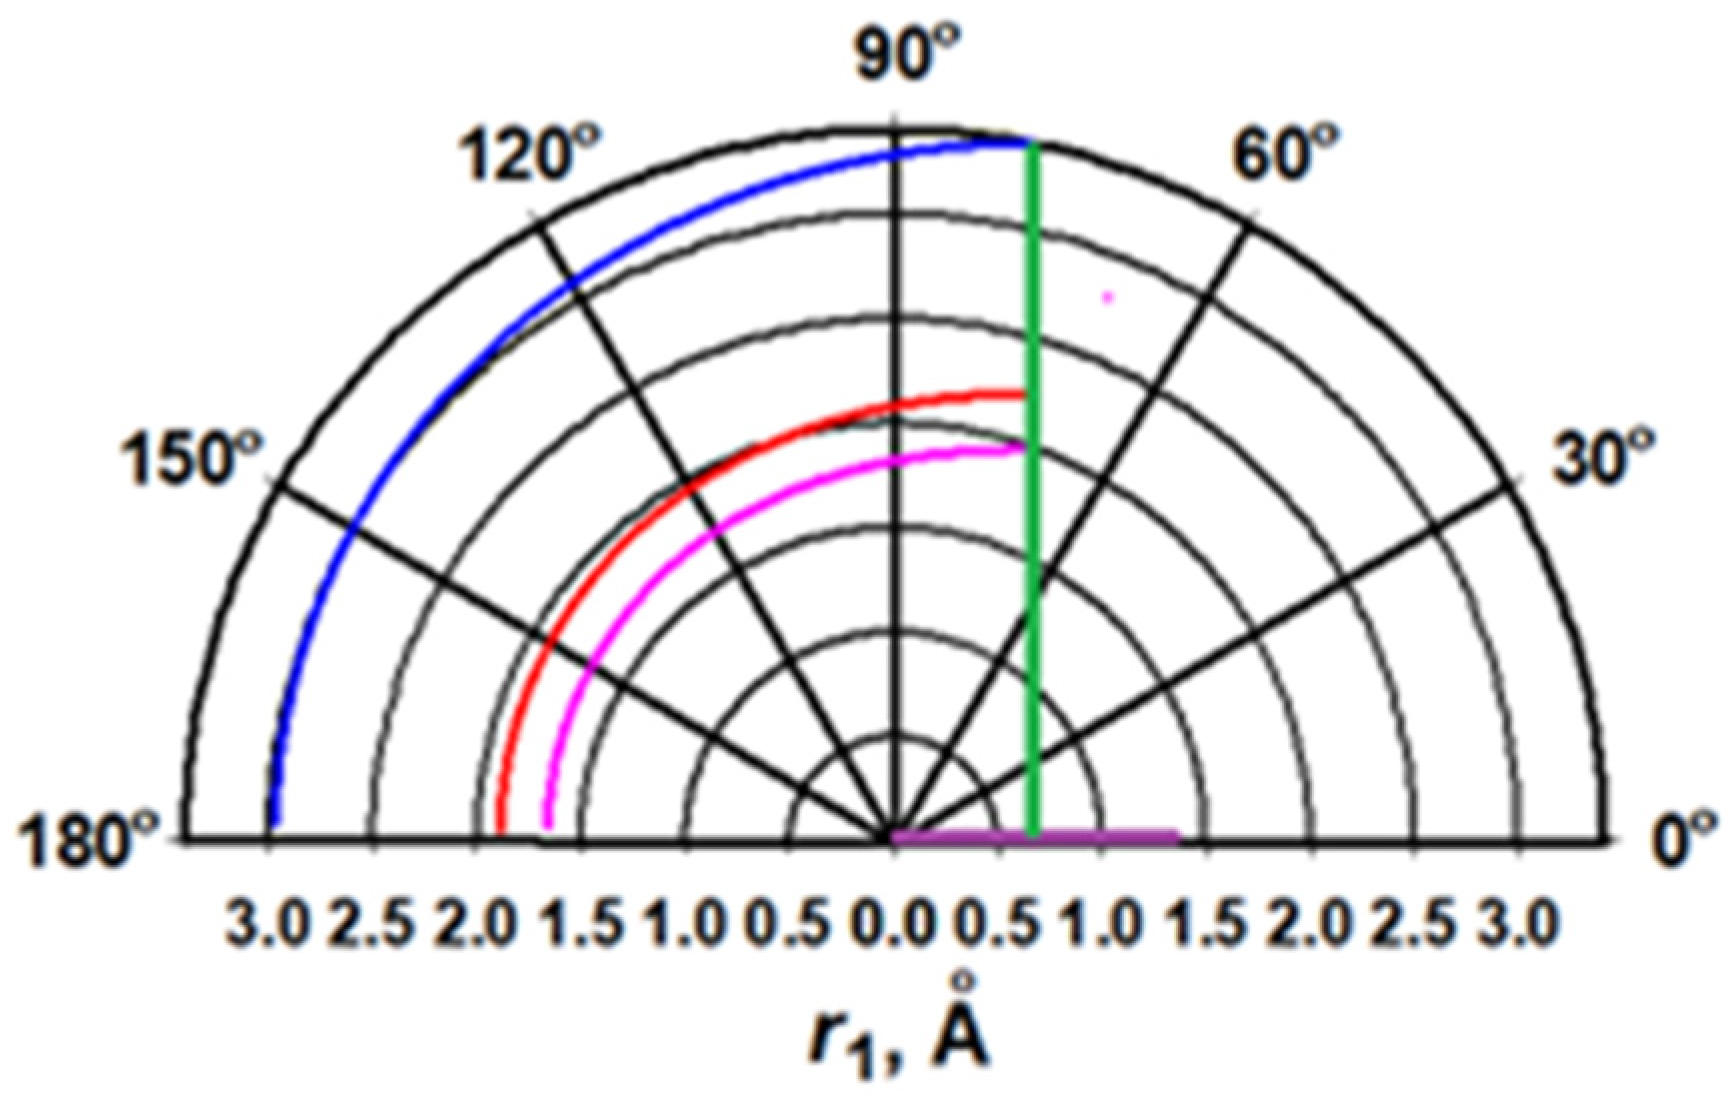
For a direct comparison with the HYSCORE determined values of T = 2 [13], 7 (this work) and 10 MHz [22,27], we calculated the term T1 + T2 from Equation (2), which lacks the rhombic term 3δ and is equal to T = 39.5 for ρ1 ≈ ρ2 ≈ 0.5. This term is shown in the form of contours, where each point defines r1 and β with the selected T (2, 7, or 10 MHz) (Figure 3), i.e., as a function of the O1–H distance and the angle β between the H–O1 and O1–O2 directions. Calculated graphs show that T = 2 MHz corresponds to the H–O1 distance 2.97–3.4 Å for the angles β < 180°. On the contrary, this distance is ~1.0–1.2 Å less for T = 7 or 10 MHz (Table 2).
Available models of a hydration shell for the aqueous O2•− include four water molecules, with two waters forming hydrogen bonds with each oxygen atom (Figure S9). The hydrogen bond lengths vary between 1.72–1.94 Å [30,35,36]. The lower limit of the H–O1 distance 1.89 Å obtained for T = 7 MHz is still within the interval shown above.
4.3. Interaction with 39K Nucleus
39K possesses the nuclear spin I = 3/2 with a natural abundance of 93.26%. The orientation disordered HYSCORE spectra of the S = 1/2 and I = 3/2 system are influenced by hyperfine and nuclear quadrupole interactions. Both of them are anisotropic. Available data about the nuclear quadrupole coupling constant in 39K+ state indicate that it is quite small [37,38]. Model simulations of the HYSCORE spectra from I = 3/2 nuclei with hyperfine and nuclear quadrupole tensors satisfying the conditions [νI > AZZ > QZZ] have shown that the hyperfine interaction creates cross-ridges normal to the diagonal line in the (++) quadrant, whereas the nuclear quadrupole interaction produces an additional splitting of these cross-features in the direction parallel to the diagonal [39]. This simple manual is helpful for the qualitative analysis of the observed spectrum from 39K (Figure 2).
The spectrum consists of a straight segment normal to the diagonal of the (++) quadrant and is located symmetrically relative to the (ν39K, ν39K) diagonal point. The length of the ridge is about ~2 MHz along each coordinate. A projection of the spectrum on each coordinate and stacked presentation of the spectrum shows a weakly resolved triplet structure of the ridge with the hyperfine splitting A ~ 1 MHz between cross-peaks with permutated coordinates of ~2 and 3 MHz. The spectrum does not show any additional splitting of the ridge along the diagonal, assuming the small value of the quadrupole coupling constant of 39K [39].
The crystal structure of an α-potassium superoxide shows an octahedral environment of the superoxide ion near K+ ions with smallest contact distances of 2.71 Å in the direction parallel to the O–O bond and another 2.92 Å away, in the direction approximately normal to the O–O bond [40]. The calculated value of the principal component (T1 + T2) of the hyperfine tensor defined by Equation (2) for the two indicated locations of 39K+ using formulae T = (3.7/2)[1/r13 + 1/r23] is equal to 0.12 and 0.148 MHz, respectively. The anisotropic width of the single-quantum transitions in the powder spectrum 3T/2 does not explain the line splitting ~1 MHz from 39K, as detected in the HYSCORE spectrum. Consequently, there remains only one source resulting in the observed line shape—the isotropic hyperfine interaction. However, the simulation of spectra with parameters a ~ 1 MHz and T ~ 0.15 MHz did not reproduce the presence of a spectral intensity around the diagonal between two peaks with a ~1 MHz splitting. Additional ideas about hyperfine interactions between 39K and the O2•− can be obtained by taking into account the available data on hyperfine couplings between a superoxide and 23Na or 133Cs on the MgO surface.
4.4. Comparison with Superoxide on a Na or Cs Pre-Covered MgO Surface
The EPR spectrum of superoxide species formed on a Na pre-covered MgO surface [27] shows a formation of two species with gzz values equal to 2.091 and 2.14. The gx,y components of both species are close to g = 2 and produce a single intensive line with a width of 1.5–2.0 mT in the spectrum. The species with gzz = 2.091 have been assigned to superoxide ions on Mg2+ matrix sites. The value gzz = 2.14 is within the range typical for superoxide anions stabilized on monovalent cations; thus, the corresponding EPR signal was designated as a surface O2•− − Na+ adduct.
The HYSCORE spectra collected in the gx,y area of the Na/MgO sample contain cross-features from the 23Na and 1H nuclei (Figure S10). Two of them belong to 23Na with strong and weak hyperfine couplings ~17 MHz and ~<3 MHz, respectively. The 1H spectrum consists of two extended ridges with a clearly visible deviation from the antidiagonal crossing (ν1H, ν1H) point of the diagonal, indicating a strong anisotropic interaction between the superoxide and a proton. Computer simulations of the spectrum have provided hyperfine tensors a = −15 ± 2 MHz, T = (−0.1, 3.1, −3.0,) MHz (±0.5 MHz) for the strongly coupled 23Na from the O2•−–Na+ adduct and a = −5.0 ± 0.5 MHz, T = (−9.8, 19.6, −9.8) MHz (±0.1 MHz) for the proton that produced extended cross-ridges. It was suggested that this proton belongs to the superoxide stabilized on the Mg2+ matrix site in the proximity of a surface OH−. Our analysis (Figure 3) shows that the 1H coupling of T ~ 10 MHz indicates the formation of an H-bond between the superoxide and proton with an O–H distance of ~1.7–2.0 Å. Furthermore, the authors have proposed that the line around the diagonal (νNa, νNa) point is produced by remote 23Na nuclei that are randomly distributed between 3.5 Å and 4.5 Å away (i.e., 0.5 >|T| > 0.2 MHz in the point dipole approximation), and the species of both gzz contribute to this feature [27].
To compare the experimental and calculated spectra, this feature was calculated using a single hyperfine tensor a = −2.5 MHz, T = (−0.5, −0.5, 1.0) MHz (Figure S10). On the other hand, we estimated Tmax = (20.9/2)[1/r13 + 1/r23] for two models of the 23Na location relative to the superoxide (O–O length 1.33 Å) using a Na–O distance of 2.38–2.39 Å reported for the orthorhombic structure of sodium superoxide [41,42]. The corresponding values are Tmax ~ 1 MHz and 1.5 MHz for the 23Na locations on the line extending the O–O bond and normal to the middle of the O–O bond that is consistent with the value of Tmax/2 used for calculating the spectrum. This estimate shows that the signal assigned to randomly distributed 23Na nuclei at distances in the range between 3.5 Å and 4.5 Å can be produced just by one nucleus located at the Na–O distance found in the crystal structures. More convincing conclusions about the nature of the signal from weakly coupled Na could be supported by the relative intensities of two sodium signals which are not available from the published spectra.
The increased hyperfine parameters for strongly coupled 23Na is explained by the formation of the ionic sodium superoxide Na+O2− as symmetrical triangular molecules with an interatomic distance of 1.96 Å that was deduced from vibrational spectra [43]. One can recalculate the characteristic hyperfine parameters of the 23Na+O2•− species obtained in this work for a superoxide interacting with a nucleus of 39K+. The ratio of 23Na/39K magnetic moments is 5.56. Then, the parameters |a| =15 MHz and |T|= 3 MHz found for the 23NaO2 species will give formal values of a = 2.7 MHz and T = 0.54 MHz for 39K. The ratio of the atomic isotropic hyperfine constants 927.1 MHz (23Na, 3s) and 228.5 MHz (39K, 4s) [44] calculated for unit spin density is 4.06. It leads to a decreasing a value of 0.67 MHz. Another possible factor that may reduce the hyperfine parameters of 39K compared to 23Na is the larger value of its ionic radius (1.02 Å for 23Na and 1.38 Å for 29K). Simulations of the 39K HYSCORE spectra with estimated parameters a = 0.6–0.7 MHz and T = 0.6 MHz confirm the increased total length of the cross-ridge and its line shape without well pronounced maxima (Figure S11). Thus, the recalculation analysis assuming similar structural motifs of the MO2 species predicts significantly lower hyperfine couplings for 39K. However, the value of the anisotropy parameter is greater than the calculated ~0.15 MHz using the crystallographic structure. That increase provides an extended line shape from 39K, which is consistent with the experimental HYSCORE spectra.
DFT calculations of the hyperfine parameters for O2•− in Na/MgO were performed for different elements of the MgO surface [27]. Based on the analysis of the full set of g and A tensors, the NaO2 species formed on an edge site of the MgO surface, where O2 is simultaneously bound to Na and to MgO, give the best description of the large gzz and the 23Na hyperfine interaction observed in the EPR experiments. On the other hand, the DFT analysis of the 1H tensor determined from the HYSCORE spectrum of O2•− in Na/MgO has not been carried out even for the proposed O2•−/HMgO center, although this tensor possesses an aiso = −5 MHz and Tmax = 19.6 MHz, which significantly exceeds the aiso ~ 0 MHz and Tmax ~ 10 MHz reported for O2•− at the surface of MgO [45].
One can note that the exchangeable proton with Tmax ~ 20 MHz was found in the HYSCORE spectra of the superoxide in the KO2/DMSO/H2O mixture in the presence of ubiquinone-10 [24]. However, the X-band HYSCORE spectra obtained in this work were not suitable for the detection of 39K signals due to a low Zeeman frequency in this band.
Other experimental examples relevant to this work are EPR studies of 23NaO2, 39KO2, 87RbO2, and 133CsO2 in rare gas matrices [46] and superoxides on a 133Cs/MgO surface [47]. Similar to Table 1, the gzz component of these species varies between 2.10–2.12, and the alkali metals 23Na and 133Cs produce a resolved hyperfine splitting of the gzz and gxx,yy components presented in Table 3.
A comparison with rare-gas matrix-trapped MO2 molecules shows that the surface-stabilized complexes are characterized by larger aiso and gzz parameters. The differences between isolated MO2 molecules and surface-adsorbed NaO2/MgO species have been examined with the help of DFT calculations, which illustrated the role of the matrix in the stabilization of the superoxide with particular magnetic characteristics [27]. A set of surface sites was compatible with the observed experimental results, which are characterized by a mutual interaction between the superoxide anion and the Mg2+ matrix ions and adsorbed Na+ species. Particularly, in the case of the surface-stabilized NaO2 complex, the unpaired electron is localized in a π* orbital lying in the O2–Na plane, whereas the π* orbital hosting the unpaired electron is found to be perpendicular to the M(OO) plane for matrix-trapped NaO2 in the rare gas. This difference will influence the hyperfine interaction with the alkaline atom nucleus [46].
5. Conclusions
Our experiments with the TO2…O2•− catalyst obtained with the joint addition of peroxide and a KOH solution of alcohol show the formation of the superoxide radical with the atypical gzz = 2.10. A similar EPR signal was previously observed in various systems containing alkaline ions that allowed us to suggest the special role of K+ ions in the O2•− stabilization. However, 39K nucleus(i) did not produce any resolved features in the reported EPR spectra. In this work, we applied 2D HYSCORE spectroscopy to characterize hyperfine interactions between the O2•− and the 39K and 1H nuclei in its environment. Q-band HYSCORE spectra have shown the presence of 39K near the superoxide. A comparison of the magnetic characteristics and electronic configuration defining the isotropic coupling of 39K with 23Na in Na/MgO [27] allowed us to predict significantly smaller 39K hyperfine couplings for the similar structural MO2 motifs. The estimated values give a reasonable agreement between the calculated and experimental 39K HYSCORE spectra. Another finding of this superoxide is the existence of a strongly coupled 1H with the anisotropic coupling T ~ 7 MHz, which suggests the formation of an H-bond with an O–H distance of <2Å. So far, an interaction with the closely located alkaline ion and the strongly coupled proton T ~ 10 MHz has been reported for the O2•− on Na/MgO only [27]. However, two different O2•− species with gzz = 2.014 and 2.091 were present in this sample, and strongly coupled 23Na with a = 15 MHz and the 1H with anisotropic coupling T = 9.8 MHz were assigned to different species, − O2•−/NaMgO and O2•−/HMgO, respectively. Only one type of O2•−/KTiO2 species with gzz = 2.10 was found in our work. This means that signals from 39K and a strongly coupled proton with T ~ 7 MHz in the HYSCORE spectra are produced by interactions with this superoxide and should be considered as the elements of its structure. Therefore, independent data to support the hypothesis that the presence of a stable superoxide radical in systems containing alkali metals requires the simultaneous proximity of M+ ion(s) and the formation of a hydrogen bond with its environment are still needed.
Supplementary Materials
The following supporting information can be downloaded at: https://www.mdpi.com/article/10.3390/inorganics11070274/s1, Figure S1: X- and Q-band EPR spectra of the superoxide radical in sample I; Figure S2: X-band two-pulse ESE field-swept spectrum and its first derivative of the TiO2 surface produced from Ti(OiPr)4 exposed to H2O2/KOH; Figure S3: Contour representation of the HYSCORE spectra of the superoxide radical in the sample I (a) and in the similar sample prepared using D2O2 (b); Figure S4: Plots of cross-ridges 1H from HYSCORE spectra of the superoxide radical in sample I in the (ν1)2 vs. (ν2)2 coordinate system; Figure S5: Plots of cross-ridges 1H and 1H’ from HYSCORE spectrum of the superoxide radical in sample II in the (ν1)2 vs. (ν2)2 coordinate system; Figure S6: Q-band field-sweep 2-pulse ESE spectrum (a) and Q-band Davies ENDOR spectra (b) of the superoxide radical in sample I; Figure S7: Q-band Davies ENDOR spectrum of the superoxide radical in sample II; Figure S8: Definition of the distances and angles describing the location of the proton relative to O1 and O2 of the superoxide radical; Figure S9: Structural model of [O2(H2O)4]−; Figure S10: Experimental and simulated HYSCORE spectra of the O2•− species on Na/MgO; Figure S11: Experimental and simulated 39K HYSCORE spectra; Table S1: g-tensors assigned to the O2•− radical in different TiO2 samples; Table S2: 1H hyperfine tensor parameters determined from linear regressions of the cross-ridges; Section S1: Square frequency fitting of the 1H HYSCORE spectra and its comparison with the pulsed ENDOR data [4,10,13,22,26,27,29,31,35,36,48,49,50,51,52,53,54,55,56].
Author Contributions
Conceptualization, R.I.S. and S.A.D.; methodology, R.I.S. and S.A.D.; validation, R.I.S. and S.A.D.; resources, S.A.D.; writing—original draft preparation, S.A.D.; writing—review and editing, S.A.D. and R.I.S.; project administration, S.A.D.; funding acquisition, S.A.D. All authors have read and agreed to the published version of the manuscript.
Funding
This work was supported by Grant DE-FG02-08ER15960 (S.A.D.) from the Chemical Sciences, Geosciences and Biosciences Division, the Office of Basic Energy Sciences, and the Office of Sciences, U.S. Department of Energy.
Institutional Review Board Statement
Not applicable.
Informed Consent Statement
Not applicable.
Data Availability Statement
All data and information recorded or analyzed throughout this study are included in this paper.
Acknowledgments
The authors are grateful to Andrei Astashkin (University of Arizona) for very useful discussions and Quan Lam for a critical reading of the manuscript.
Conflicts of Interest
The authors declare no conflict of interest.
References
- Hayyan, M.; Hashim, M.A.; AlNashef, I.M. Superoxide Ion: Generation and Chemical Implications. Chem. Rev. 2016, 116, 3029–3085. [Google Scholar] [CrossRef] [Green Version]
- Afanas’ev, I.B. The Oxygen Radical-anion O2− in Chemical and Biochemical Processes. Russ. Chem. Rev. 1979, 48, 527–549. [Google Scholar] [CrossRef]
- Sawyer, D.T.; Valentine, J.S. How Super Is Superoxide? Acc. Chem. Res. 1981, 14, 393–400. [Google Scholar] [CrossRef]
- Anpo, M.; Che, M.; Fubini, B.; Garrone, E.; Giamello, E.; Paganini, M.C. Generation of Superoxide Ions at Oxide Surfaces. Top. Catal. 1999, 8, 189–198. [Google Scholar] [CrossRef]
- Che, M.; Tench, A.J. Characterization and Reactivity of Molecular Oxygen Species on Oxide Surfaces. Adv. Catal. 1983, 32, 1–148. [Google Scholar]
- Kokorin, A.I. Electron Spin Resonance of Nanostructured oxide semiconductors. In Chemical Physics of Nanostructured Semiconductors; Kokorin, A.I., Bahnemann, D.W., Eds.; CRC Press: Boca Raton, FL, USA, 2003; Chapter 8; pp. 203–263. [Google Scholar]
- Chiesa, M.; Giamello, E.; Che, M. EPR Characterization and Reactivity of Surface-Localized Inorganic Radicals and Radical Ions. Chem. Rev. 2010, 110, 1320–1347. [Google Scholar] [CrossRef]
- Sobańska, K.; Krasowska, A.; Mazur, T.; Podolska-Serafin, K.; Pietrzyk, P.; Sojka, Z. Diagnostic Features of EPR Spectra of Superoxide Intermediates on Catalytic Surfaces and Molecular Interpretation of Their g and A Tensors. Top. Catal. 2015, 58, 796–810. [Google Scholar] [CrossRef] [Green Version]
- Giamello, E.; Rumori, P.; Geobaldo, F.; Fubini, B.; Paganini, M.C. The Interaction between Hydrogen Peroxide and Metal Oxides: EPR Investigations. Appl. Magn. Res. 1996, 10, 173–192. [Google Scholar] [CrossRef]
- Dewkar, G.K.; Nikalje, M.D.; Sayyed, I.A.; Paraskar, A.S.; Jagtap, H.S.; Sudalai, A. An Exceptionally Stable Ti Superoxide Radical Ion: A Novel Heterogeneous Catalyst for the Direct Conversion of Aromatic Primary Amines to Nitro Compounds. Angew. Chem. Int. Ed. 2001, 40, 405–408. [Google Scholar] [CrossRef]
- Dewkar, G.K.; Shaikh, T.M.; Pardhy, S.; Kulkarni, S.S.; Sudalai, A. Titanium superoxide catalyzed selective oxidation of phenols to p-quinones with aq. H2O2. Indian J. Chem. B 2005, 44, 1530–1532. [Google Scholar] [CrossRef]
- Reddy, R.S.; Shaikh, T.M.; Rawat, V.; Karabal, P.U.; Dewkar, G.; Suryavanshi, G.; Sudalai, A. A Novel Synthesis and Characterization of Titanium Superoxide and its Application in Organic Oxidative Processes. Catal. Surv. Asia 2010, 14, 21–32. [Google Scholar] [CrossRef]
- Samoilova, R.I.; Dikanov, S.A. Local environment of superoxide radical formed on the TiO2 surface produced from Ti(OiPr)4 exposed to H2O2. Appl. Magn. Reson. 2022, 53, 1089–1104. [Google Scholar] [CrossRef]
- Jin, F.; Leitich, J.; von Sonntag, C. The superoxide radical reacts with tyrosine-derived phenoxyl radicals by addition rather than by electron transfer. J. Chem. Soc. Perkin. Trans. II 1993, 1583–1588. [Google Scholar] [CrossRef]
- Schunemann, V.; Lendzian, F.; Jung, C.; Contzen, J.; Barra, A.-L.; Sligar, S.G.; Trautwein, A.X. Tyrosine Radical Formation in the Reaction of Wild Type and Mutant Cytochrome P450cam with Peroxy. J. Biol. Chem. 2004, 279, 10919–10930. [Google Scholar] [CrossRef] [PubMed] [Green Version]
- Hitchcock, D.I. The solubility of tyrosine in acid and alkali. J. Gen. Physiol. 1924, 6, 747–757. [Google Scholar] [CrossRef] [PubMed] [Green Version]
- Höfer, P.; Grupp, A.; Nebenführ, H.; Mehring, M. Hyperfine Sublevel Correlation (HYSCORE) spectroscopy: A 2D ESR investigation of the squaric acid radical. Chem. Phys. Lett. 1986, 132, 279–282. [Google Scholar] [CrossRef]
- Davies, E.R. A New Pulse Endor Technique. Phys. Lett. A 1974, 47, 1–2. [Google Scholar] [CrossRef]
- Lunsford, J.H. ESR of Adsorbed Oxygen Species. Catal. Rev. 1973, 8, 135–157. [Google Scholar] [CrossRef]
- Symons, M.C.R.; Eastland, G.W.; Denny, L.R. Effect of Solvation on the Electron Spin Resonance Spectrum of the Superoxide ion. J. Chem. Soc. Faraday Trans. I 1980, 76, 1868–1874. [Google Scholar] [CrossRef]
- Narayana, P.A.; Suryanarayana, D.; Kevan, L. Electron Spin-Echo Studies of the Solvation Structure of Superoxide ion (O2−) in Water. J. Am. Chem. Soc. 1982, 104, 3552–3555. [Google Scholar] [CrossRef]
- Samoilova, R.I.; Crofts, A.R.; Dikanov, S.A. Reaction of Superoxide Radical with Quinone Molecules. J. Phys. Chem. A 2011, 115, 11589–11593. [Google Scholar] [CrossRef] [Green Version]
- Haseloff, R.; Ebert, B.; Damerau, W. Superoxide generation in alkaline dimethyl sulfoxide. Anal. Chim. Acta. 1989, 218, 179–184. [Google Scholar] [CrossRef]
- Krager, K. Superoxide in Aprotic Solvents; The University of Iowa: Iowa City, IA, USA, 2003. [Google Scholar]
- Hyland, K.; Auclair, C. The Formation of Superoxide Radical Anions by a Reaction Between O2, OH− and Dimethyl Sulfoxide. Biochem. Biophys. Res. Comm. 1981, 102, 531–537. [Google Scholar] [CrossRef] [PubMed]
- Dikanov, S.A.; Bowman, M.K. Cross-peak lineshape of two-dimensional ESEEM spectra in disordered S=1/2, I=1/2 spin system. J. Magn. Reson., Ser. A 1995, 116, 125–128. [Google Scholar] [CrossRef]
- Napoli, F.; Chiesa, M.; Giamello, E.; Preda, G.; Di Valentin, C.; Pacchioni, G. Formation of Superoxo Species by Interaction of O2 with Na Atoms Deposited on MgO Powders: A Combined Continuous-Wave EPR (CW-EPR), Hyperfine Sublevel Correlation (HYSCORE) and DFT Study. Chem. Eur. J. 2010, 16, 6776–6785. [Google Scholar] [CrossRef]
- Randall, D.W.; Gelasco, A.; Caudle, M.T.; Pecoraro, V.L.; Britt, R.D. ESE-ENDOR and ESEEM Characterization of Water and Methanol Ligation to a Dinuclear Mn(III)Mn(IV) Complex. J. Am. Chem. Soc. 1997, 119, 4481–4491. [Google Scholar] [CrossRef]
- Janik, I.; Tripathi, G.N.R. The nature of the superoxide radical anion in water. J. Chem. Phys. 2013, 139, 014302. [Google Scholar] [CrossRef] [PubMed]
- Chiesa, M.; Giamello, E.; Paganini, M.C.; Sojka, Z.; Murphy, D.M. Continuous Wave Electron Paramagnetic Resonance Investigation of the Hyperfine Structure of 17O2− Adsorbed on the MgO Surface. J. Chem. Phys. 2002, 116, 4266–4274. [Google Scholar] [CrossRef]
- Maurelli, S.; Vishnuvarthan, M.; Berlier, G.; Chiesa, M. NH3 and O2 interaction with tetrahedral Ti3+ ions isomorphously substituted in the framework of TiAlPO-5. A combined pulse EPR, pulse ENDOR, UV-Vis and FT-IR study. Phys. Chem. Chem. Phys. 2012, 14, 987–995. [Google Scholar] [CrossRef] [PubMed]
- Dietzel, P.D.C.; Kremer, R.K.; Jansen, M. Tetraorganylammonium Superoxide Compounds: Close to Unperturbed Superoxide Ions in the Solid State. J. Am. Chem. Soc. 2004, 126, 4689–4696. [Google Scholar] [CrossRef]
- Seyeda, H.; Jansen, M. A novel access to ionic superoxides and the first accurate determination of the bond distance in O2−. J. Chem. Soc. Dalton Trans. 1998, 6, 875–876. [Google Scholar] [CrossRef]
- Halverson, F. Comments on Potassium Superoxide Structure. J. Phys. Chem. Solids 1962, 23, 207–214. [Google Scholar] [CrossRef]
- Antonchenko, V.Y.; Kryachko, E.S. Interaction of Superoxide O2− with Water Hexamer Clusters. Chem. Phys. 2006, 327, 485–493. [Google Scholar] [CrossRef]
- Antonchenko, V.Y.; Kryachko, E.S. Structural, Energetic, and Spectroscopic Features of Lower Energy Complexes of Superoxide Hydrates O2−(H2O)1-4. J. Phys. Chem. A 2005, 109, 3052–3059. [Google Scholar] [CrossRef] [PubMed]
- Barkhuijsen, H.; de Beer, R.; Deutz, A.F.; van Ormondt, D.; Völkel, G. Observation of Potassium Hyperfine Interactions in X-irradiated KH2AsO4 through the Method of Electron Spin Echo Envelope Modulation. Solid State Commun. 1984, 49, 679–684. [Google Scholar] [CrossRef]
- Nellutla, S.; Morley, G.W.; van Tol, J.; Pati, M.; Dalal, N.S. Electron Spin Relaxation and 39K Pulsed ENDOR Studies on Cr5+-doped K3NbO8 at 9.7 and 240 GHz. Phys. Rev. B 2008, 78, 054426. [Google Scholar] [CrossRef] [Green Version]
- Gutjahr, M.; Böttcher, R.; Pöppl, A. Analysis of Correlation Patterns in Hyperfine Sublevel Correlation Spectroscopy of S = 1/2, I = 3/2 Systems. Appl. Magn. Reson. 2002, 22, 401–414. [Google Scholar] [CrossRef]
- Abrahams, S.C.; Kalnajs, J. The Crystal Structure of α-Potassium Superoxide. Acta Crystallogr. 1955, 8, 503–506. [Google Scholar] [CrossRef] [Green Version]
- Carter, G.F.; Templeton, D.H. Polymorphism of Sodium Superoxide. J. Am. Chem. Soc. 1953, 75, 5247–5249. [Google Scholar] [CrossRef]
- Deng, N.; Yang, G.; Wang, W.; Qiu, Y. Structural Transitions and Electronic Properties of Sodium Superoxide at High Pressures. RSC Adv. 2016, 6, 67910–67915. [Google Scholar] [CrossRef]
- Smardzewski, R.R.; Andrews, L. Raman Spectra of the Products of Na and K Atom Argon Matrix Reactions with O2 Molecules. J. Chem. Phys. 1972, 57, 1327–1333. [Google Scholar] [CrossRef]
- Morton, J.R.; Preston, K.F. Atomic Parameters for Paramagnetic Resonance Data. J. Magn. Reson. 1978, 30, 577–583. [Google Scholar] [CrossRef]
- Giamello, E.; Ugliengo, P.; Garrone, E.; Che, M.; Tench, A.J. Experimental Evidence for the Hyperfine Interaction between a Surface Superoxide Species on MgO and a Neighbouring Hydroxylic Proton. J. Chem. Soc. Faraday Trans. I 1989, 85, 3987–3994. [Google Scholar] [CrossRef]
- Lindsay, D.M.; Herschbach, D.R.; Kwiram, A.L. ESR of Matrix Isolated Alkali Superoxides. Chem. Phys. Lett. 1974, 25, 175–181. [Google Scholar] [CrossRef]
- Chiesa, M.; Paganini, M.C.; Giamello, E.; Murphy, D.M. Partial Ionization of Cesium Atoms at Point Defects over Polycrystalline Magnesium Oxide. J. Phys. Chem. B 2001, 105, 10457–10460. [Google Scholar] [CrossRef]
- Antcliff, K.L.; Murphy, D.M.; Griffithsa, E.; Giamello, E. The interaction of H2O2 with exchanged titanium oxide systems (TS-1, TiO2, [Ti]-APO-5, Ti-ZSM-5). Phys. Chem. Chem. Phys. 2003, 5, 4306–4316. [Google Scholar] [CrossRef]
- Ramaswamy, V.; Awati, P.; Ramaswamy, A.V. Epoxidation of indene and cyclooctene on nanocrystalline anatase titania catalyst. Top. Catal. 2006, 38, 251–259. [Google Scholar] [CrossRef]
- Tengvall, P.; Lundström, I.; Sjöqvist, L.; Elwing, H.; Bjursten, L.M. Titanium-hydrogen peroxide interaction: Model studies of the influence of the inflammatory response on titanium implants. Biomaterials 1989, 10, 166–175. [Google Scholar] [CrossRef]
- Green, J.; Carter, E.; Murphy, D.M. Interaction of molecular oxygen with oxygen vacancies on reduced TiO2: Site specific blocking by probe molecules. Chem. Phys. Lett. 2009, 477, 340–344. [Google Scholar] [CrossRef]
- Carter, E.; Carley, A.F.; Murphy, D.M. Evidence for O2− Radical Stabilization at Surface Oxygen Vacancies on Polycrystalline TiO2. J. Phys. Chem. C 2007, 111, 10630–10638. [Google Scholar] [CrossRef]
- Liu, F.; Feng, N.; Wang, Q.; Xu, J.; Qi, G.; Wang, W.; Deng, F. Transfer Channel of Photoinduced Holes on a TiO2 Surface As Revealed by Solid-State Nuclear Magnetic Resonance and Electron Spin Resonance Spectroscopy. J. Am. Chem. Soc. 2017, 139, 10020–10028. [Google Scholar] [CrossRef] [PubMed]
- Rahemi, V.; Trashin, S.; Hafideddine, Z.; Meynen, V.; Van Doorslaer, S.; De Wael, K. Enzymatic sensor for phenols based on titanium dioxide generating surface confined ROS after treatment with H2O2. Sens. Actuators B Chem. 2019, 283, 343–348. [Google Scholar] [CrossRef]
- Yu, J.; Chen, J.; Li, C.; Wang, X.; Zhang, B.; Ding, H. ESR Signal of Superoxide Radical Anion Adsorbed on TiO2 Generated at Room Temperature. J. Phys. Chem. B 2004, 108, 2781–2783. [Google Scholar] [CrossRef]
- Dikanov, S.A.; Tyryshkin, A.M.; Bowman, M.K. Intensity of cross-peaks in HYSCORE spectra of S = 1/2, I = 1/2 spin systems. J. Magn. Reson. 2000, 144, 228–242. [Google Scholar] [CrossRef] [PubMed]
Figure 1.
Q-band two-pulse ESE field-sweep spectrum and its first derivative of the radical formed in sample II. Field-sweep ESE generates a spectrum similar in shape to the absorption spectrum produced on the integration of the normal continuous-wave EPR derivative. Microwave frequency is 33.9523 GHz, length of π/2 pulse is 100 ns, time τ between first and second pulses is 400 ns, and temperature is 15 K.
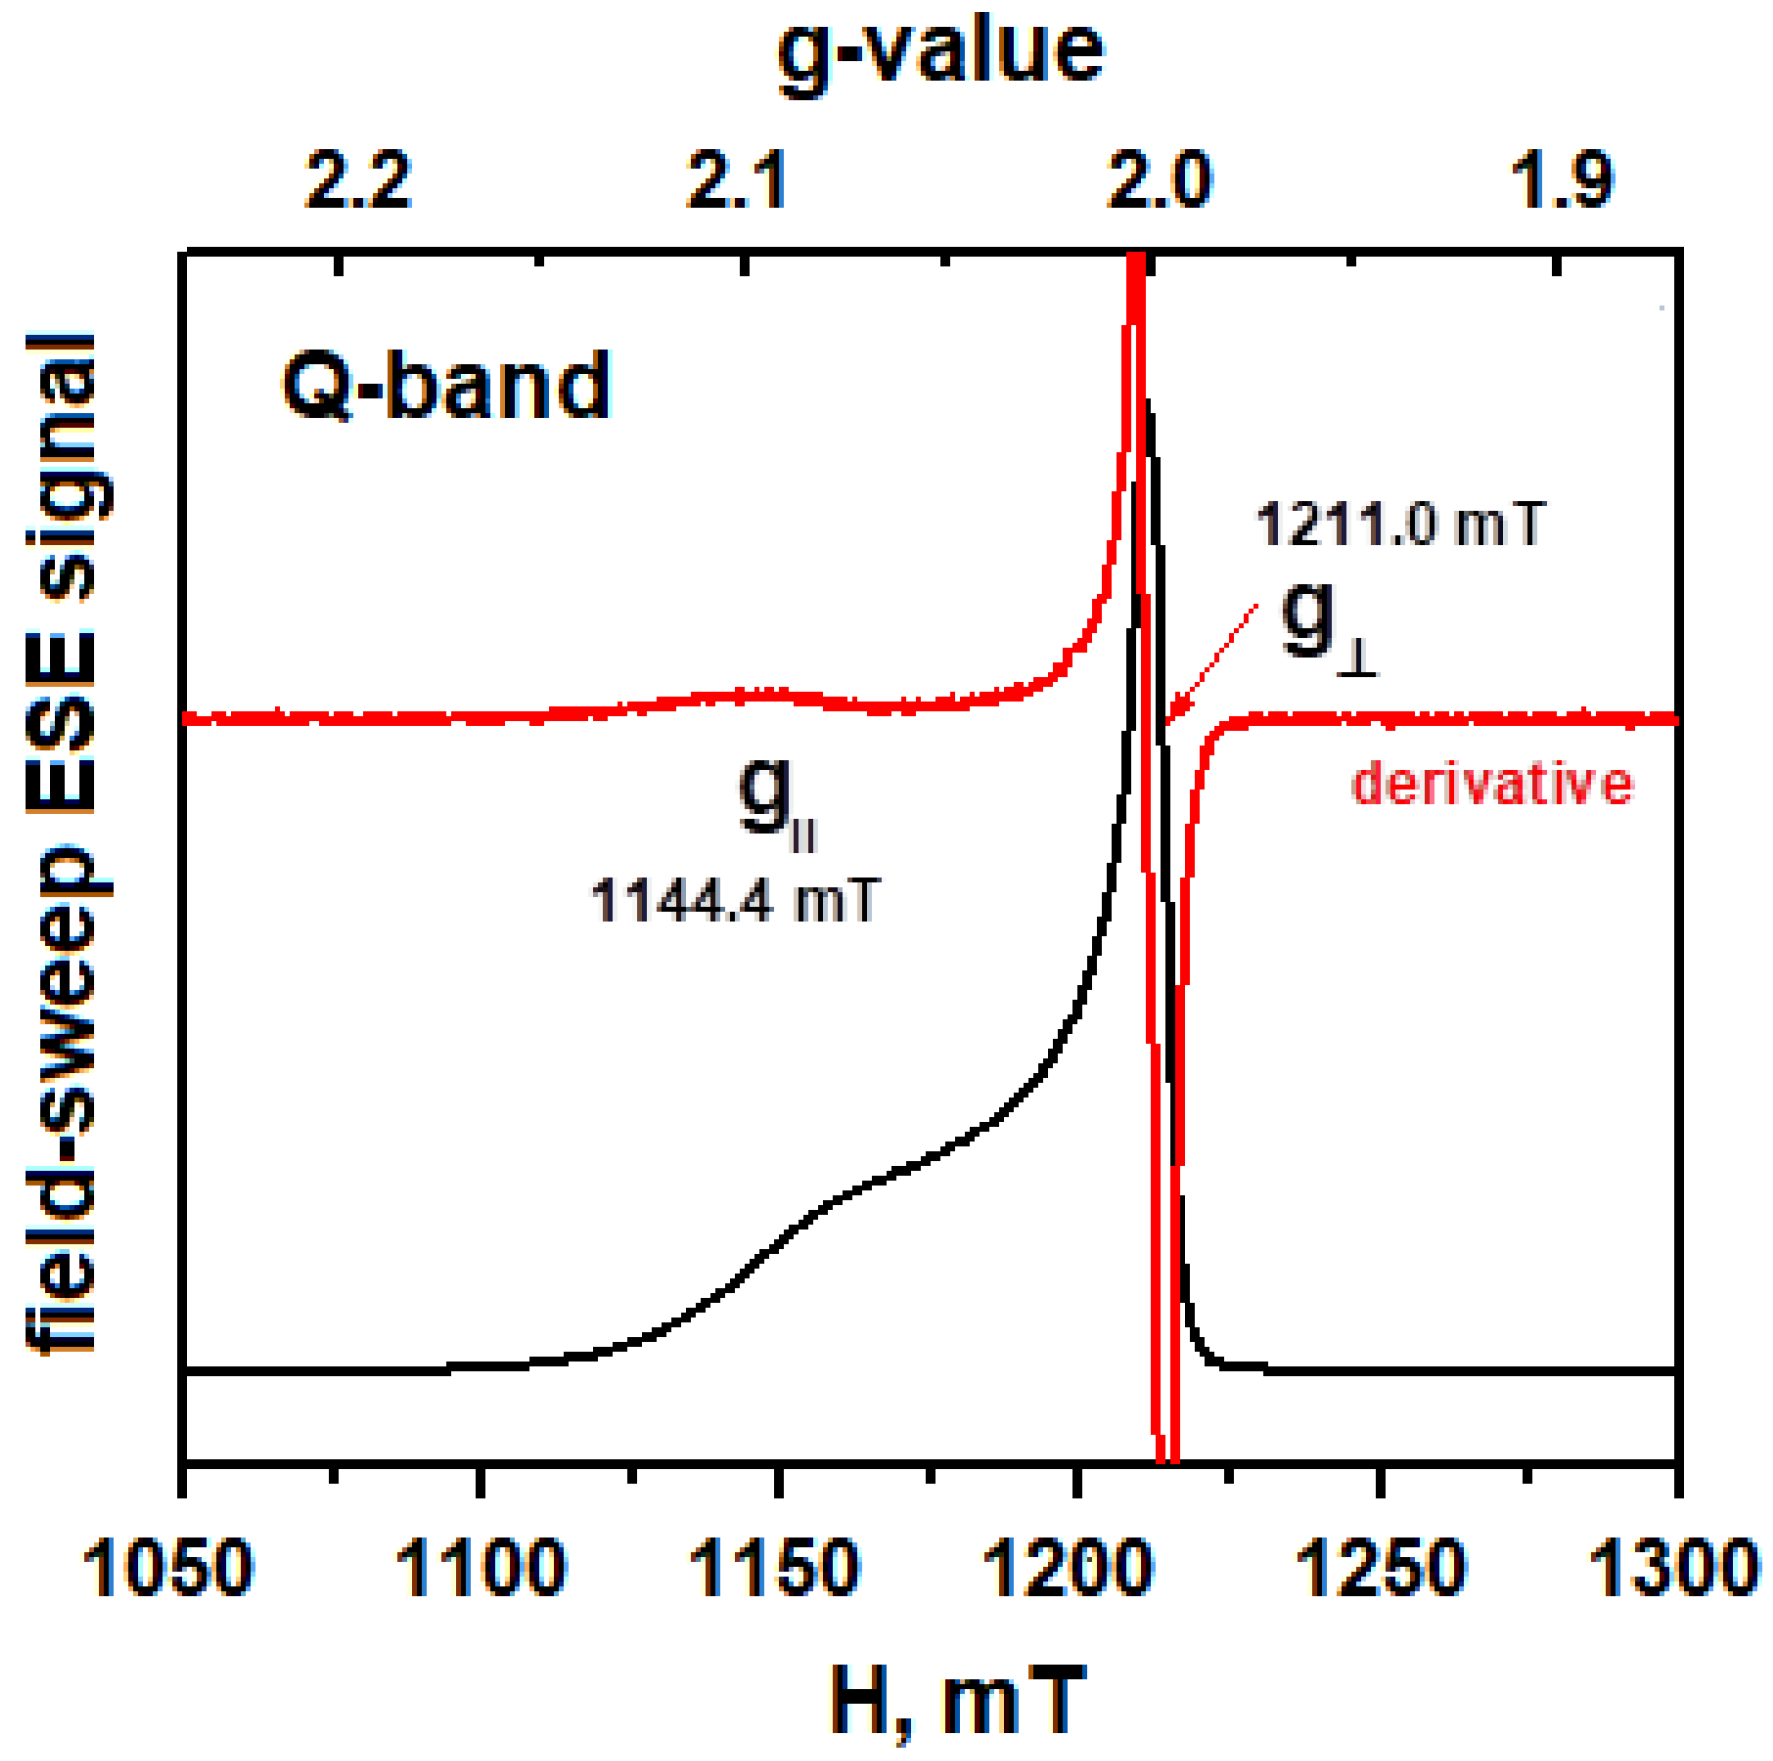
Figure 2.
Contour representation of the X- (left) and Q-band (right) HYSCORE spectra of the superoxide radical in sample II. The time τ, between the first and the second microwave pulses, was 136 ns (X) and 200 ns (Q). The spectra were obtained by FT of the 2D time domain patterns containing 256 × 256 points with a 16 ns step in t1 and t2, which are the intervals between the second and the third microwave pulses, and the third and the fourth microwave pulses, respectively. The microwave frequency was 9.671 GHz (X) and 33.9915 GHz (Q), and the magnetic field was set to 343 mT (X) and 12,125 T (Q), and the temperature was 15 K.
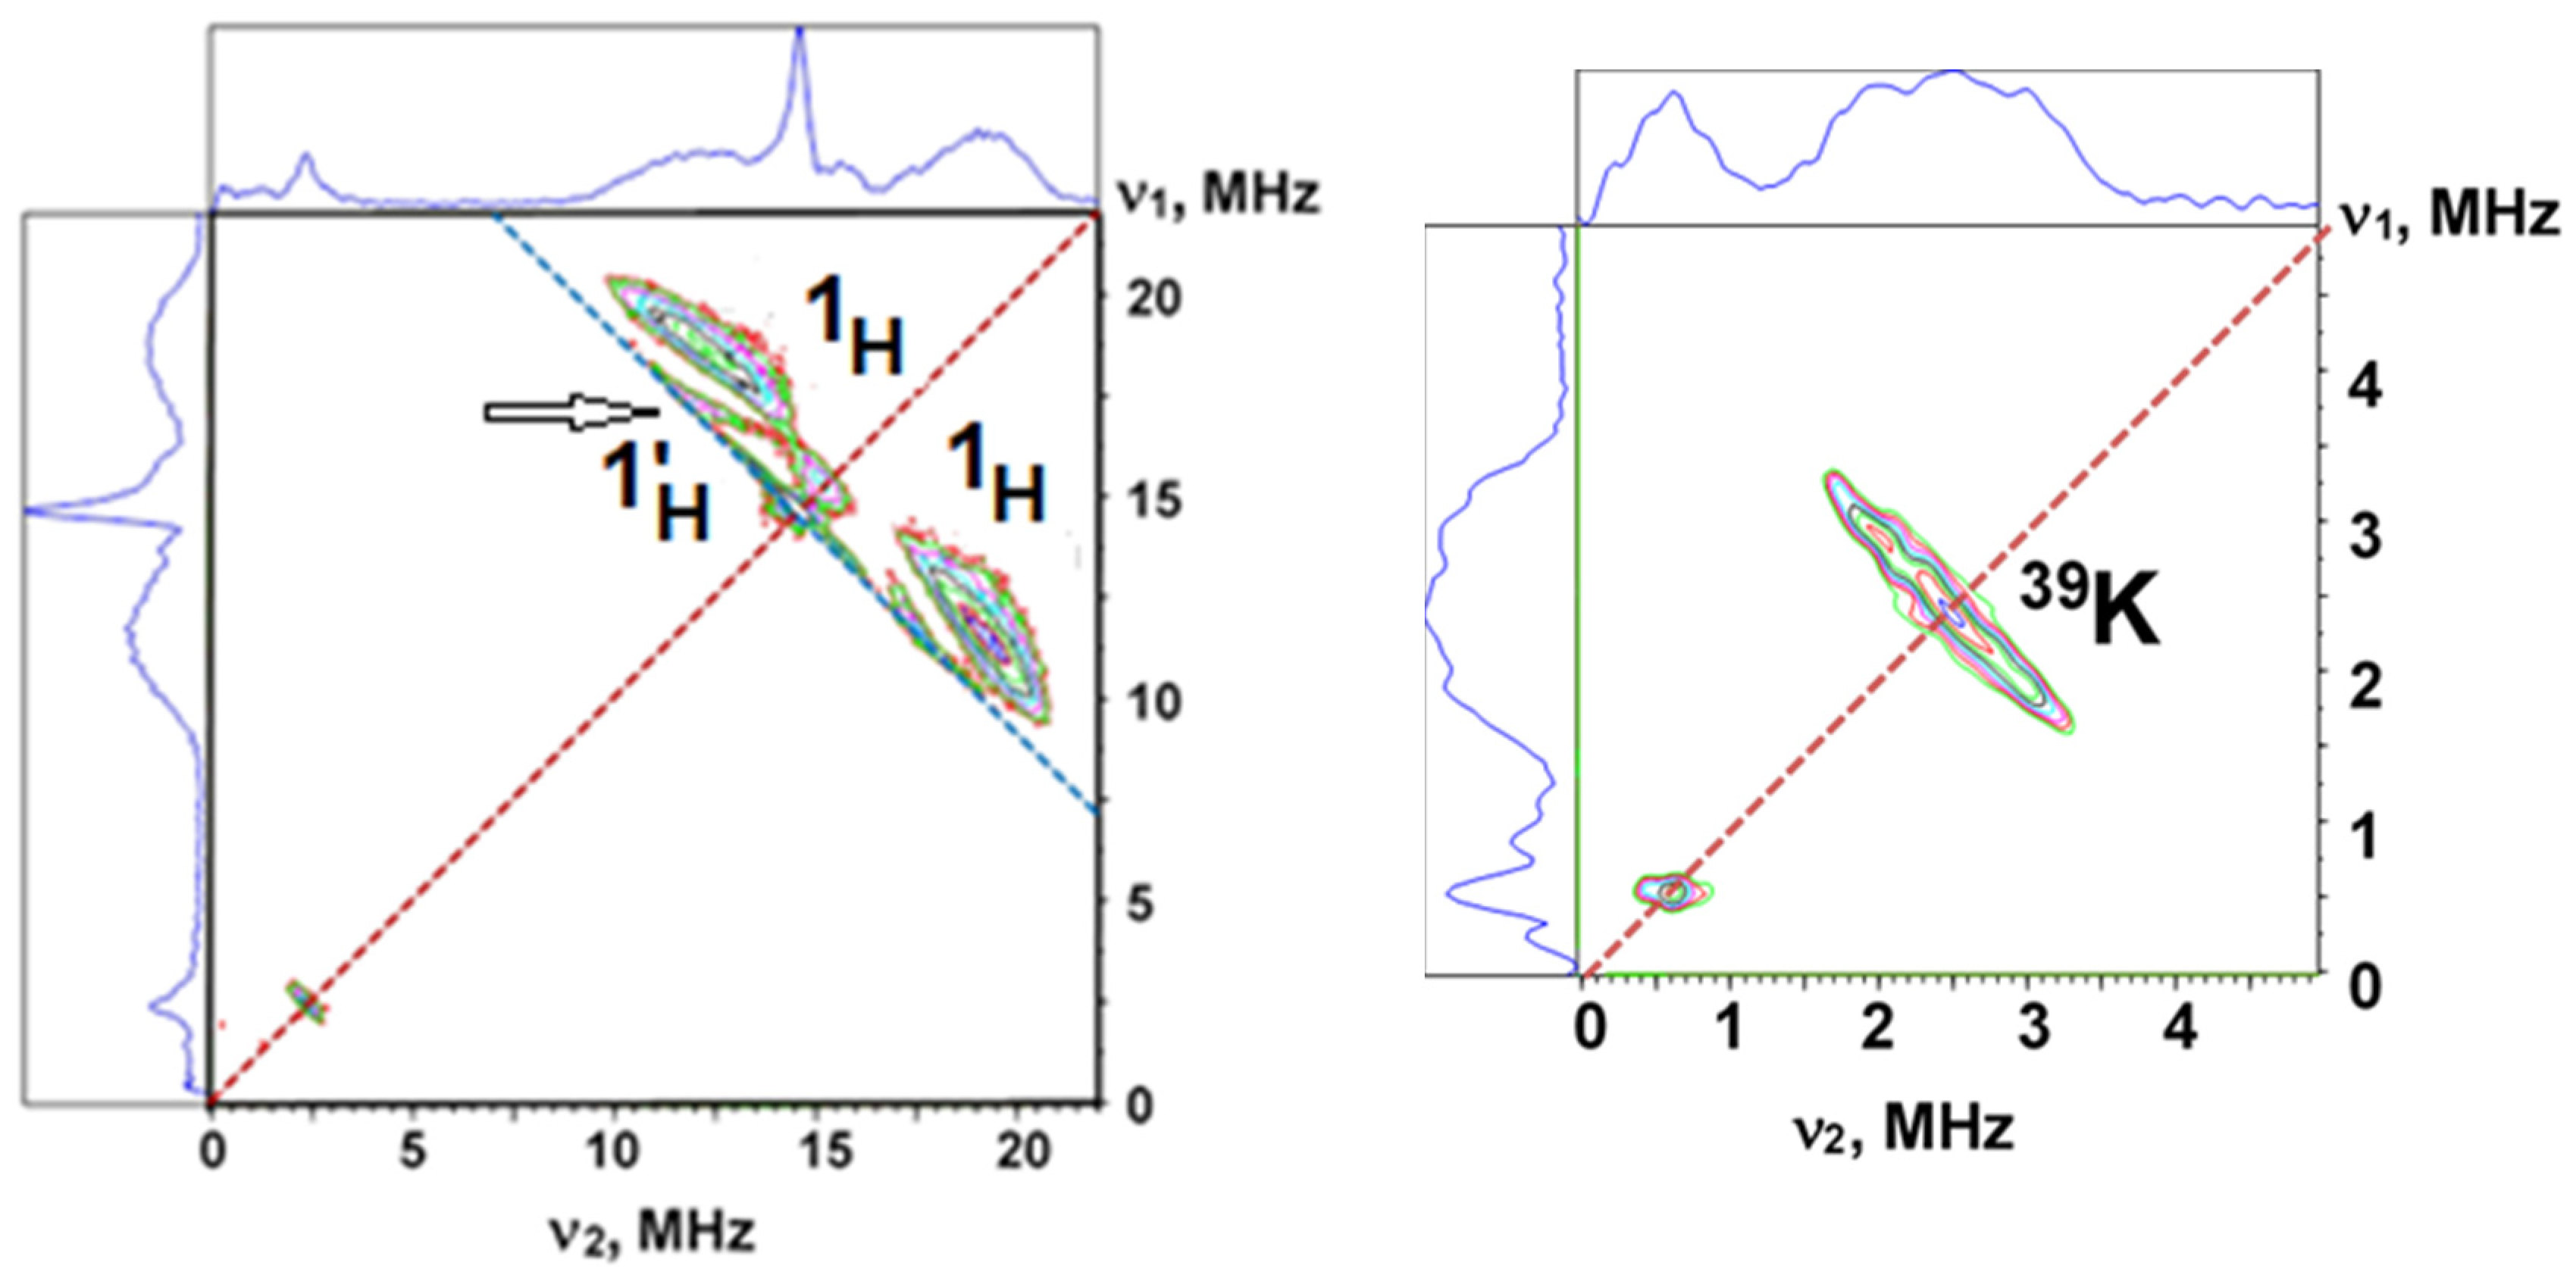
Figure 3.
Polar graphs (r1, β) with representative contours T = 39.5 equal to 2.0 (blue), 7.0 (red), and 10 (pink) MHz calculated for a model with one superoxide oxygen located at the (0,0) point of the coordinates and a second oxygen at the point (1.33 Å, 0°). O1–O2 distance equals to 1.33 Å marked in purple along the line with β = 0o. Green line normal to r1 axis corresponds to the middle of the O1–O2 distance. Adapted by permission from Copyright Clearance Center: Springer Nature, Samoilova et al. [13]. Copyright 2022.

Table 1.
Systems where the EPR signal with axial g-tensor was assigned to a superoxide.
| Matrix | g||(gzz) | g⊥(gx,y) | Reference |
|---|---|---|---|
| H2O ice (K2O) | 2.110 | [20] | |
| D2O ice (0.1 mM K2O) | 2.110 | 2.002 | [21] |
| KO2 in DMSO/H2O in the presence of ubiquinone-10 | 2.108 | 2.004 | [22] |
| Alkaline DMSO | 2.098 | 2.005 | [23,24] |
| 10 μL of 0.5M NaOH/mL of DMSO | 2.089 | 2.007 | [25] |
| TiO2 + H2O2+ KOH | 2.10 | 2.002 | This work |
Table 2.
Distances of a proton location relative to a superoxide radical at different values of the anisotropic hyperfine coupling.
Table 2.
Distances of a proton location relative to a superoxide radical at different values of the anisotropic hyperfine coupling.
| T, MHz | r1 (H–O1), Å | β, Degree | r1 at β = 180°, Å | r1 at β = 120°, Å | References a |
|---|---|---|---|---|---|
| 2 | 2.97–3.4 | 180–75 | 2.97 | 3.08 | [13] |
| 7 | 1.89–2.24 | 180–73 | 1.89 | 1.95 | This work |
| 10 | 1.67–1.99 | 180–70 | 1.67 | 1.71 | [22,27] |
a References, where parameters T from first column were experimentally determined. Adapted by permission from Copyright Clearance Center: Springer Nature, Samoilova et al. [13]. Copyright 2022.
Table 3.
EPR parameters of MO2 species in a rare gas and on a MgO surface.
| Sample | gzz | T11 | T22 | T33 | aiso | A0 | ρו10−3 | Ref. a |
|---|---|---|---|---|---|---|---|---|
| 23NaO2 | 2.111 | −2.8 | 1.68 | −1.12 | 9 | 927.1 | 9.7 | [46] |
| O2•− on Na/MgO | 2.14 | −0.1 | 3.1 | −3.0 | −15 | 927.1 | 16.2 | [27] |
| 133CsO2 | 2.107 | −0.56 | 0.84 | −0.28 | 14 | 2464 | 5.7 | [46] |
| O2•− on Cs/MgO | 2.120 | 5.1 | 2.6 | −7.7 | 29.6 | 2464 | 12.0 | [47] |
a Tii components of an anisotropic tensor, isotropic constant aiso, and atomic isotropic hyperfine constant A0 are in MHz.
Disclaimer/Publisher’s Note: The statements, opinions and data contained in all publications are solely those of the individual author(s) and contributor(s) and not of MDPI and/or the editor(s). MDPI and/or the editor(s) disclaim responsibility for any injury to people or property resulting from any ideas, methods, instructions or products referred to in the content. |
© 2023 by the authors. Licensee MDPI, Basel, Switzerland. This article is an open access article distributed under the terms and conditions of the Creative Commons Attribution (CC BY) license (https://creativecommons.org/licenses/by/4.0/).
Share and Cite
MDPI and ACS Style
Samoilova, R.I.; Dikanov, S.A. Superoxide Radical Formed on the TiO2 Surface Produced from Ti(OiPr)4 Exposed to H2O2/KOH. Inorganics 2023, 11, 274. https://doi.org/10.3390/inorganics11070274
AMA Style
Samoilova RI, Dikanov SA. Superoxide Radical Formed on the TiO2 Surface Produced from Ti(OiPr)4 Exposed to H2O2/KOH. Inorganics. 2023; 11(7):274. https://doi.org/10.3390/inorganics11070274
Chicago/Turabian StyleSamoilova, Rimma I., and Sergei A. Dikanov. 2023. "Superoxide Radical Formed on the TiO2 Surface Produced from Ti(OiPr)4 Exposed to H2O2/KOH" Inorganics 11, no. 7: 274. https://doi.org/10.3390/inorganics11070274
Note that from the first issue of 2016, this journal uses article numbers instead of page numbers. See further details here.