Article

Unveiling the Thermoelectric Performances of Zn1−xFexSe Nanoparticles Prepared by the Hydrothermal Method

1
Dipartimento di Scienze Fisiche, Informatiche e Matematiche, Università di Modena e Reggio Emilia, Via Campi 213/a, 41125 Modena, Italy
2
NEST Laboratory, Scuola Normale Superiore, Piazza San Silvestro 12, 56127 Pisa, Italy
3
Department of Physics, University of Cagliari, S.P. Monserrato-Sestu, 09042 Monserrato, Italy
4
Department of Physics, Government College University, Faisalabad 38000, Pakistan
5
Istituto Nanoscienze—CNR-NANO, Centro di Ricerca S3, Via G. Campi 213/a, 41125 Modena, Italy
*
Authors to whom correspondence should be addressed.
Inorganics 2023, 11(7), 286; https://doi.org/10.3390/inorganics11070286
Submission received: 30 January 2023 / Revised: 24 June 2023 / Accepted: 27 June 2023 / Published: 2 July 2023
(This article belongs to the Special Issue Advances of Thermoelectric Materials)

Abstract

:
Fe2+-doped ZnSe nanoparticles, with varying concentrations of Fe2+ dopants, were prepared by the hydrothermal method and investigated using a multi-technique approach exploiting scanning electron microscopy (SEM), X-ray diffraction (XRD), and Raman spectroscopy, as well as measurement of the electrical transport properties and Seebeck coefficient (S). The doped nanoparticles appeared as variable-sized agglomerates on nanocrystallites upon SEM investigation for any doping level. Combined XRD and Raman analyses revealed the occurrence of a cubic structure in the investigated samples. Electric and thermoelectric (TE) transport investigations showed an increase in TE performance with an increase in Fe atom concentrations, which resulted in an enhancement of the power factors from 13 µWm−1K−2 to 120 µWm−1K−2 at room temperature. The results were also dependent on the operating temperature. The maximum power factor of 9 × 10⁻³ Wm−1K−2 was achieved at 150 °C for the highest explored doping value. The possible applications of these findings were discussed.

1. Introduction

Zinc selenide is one of the most studied semiconductors and is nowadays considered as a very important, environmentally friendly, and multipurpose material with prominent applications in several fields of technology [1]. ZnSe is a wide band gap semiconductor (Eg = 2.7 eV) with a large exciton binding energy (21 meV) [2] and is largely employed in solar cells [3], short wavelength lasers [4], LEDs [5], photodetectors [6], sensors [7], and catalysts [8]. In particular, low dimensional ZnSe nanostructures, such as nanocrystals, nanowires, nanorods, etc., have received great attention due to the intriguing properties deriving from the high surface area and quantum confinement effects, which make them interesting optical and electronic materials [9]. An effective way to tune and improve the physical properties of nanostructures is through doping [1,10]. Transition-metal-doped ZnSe nanostructures have attracted great research attention as they display enhanced properties compared with their undoped counterparts for applications in spintronics and as tunable laser materials in the mid-infrared [11,12].
In this study, we aimed at exploring the effect of the concentration of iron dopants on the thermoelectric properties of ZnSe nanoparticles in view of the possible use of this class of nanomaterials for energy conversion and harvesting applications. Thermoelectric energy conversion [13], i.e., the generation of an electric voltage or current exploiting a thermal gradient, is considered a very powerful approach for powering small-scale devices, such as wearables, sensors, etc., or for managing heat flows in micro and nanoelectronics circuits. The performance of thermoelectric materials is described by the thermoelectric figure of merit ZT, defined as:
Z T = σ S 2 T k
where σ is the electrical conductivity, k is thermal conductivity (which includes an electronic contribution and a thermal contribution), S is the Seebeck coefficient of the material, and T is the absolute temperature [14]. The expression at the numerator, σ S 2 , is defined as the power factor, P, and is considered as a crucial parameter for evaluating the thermoelectric properties of a material. Indeed, high power factors and low thermal conductivities are required for securing high ZT [15]. Several materials have been assessed as interesting thermoelectric materials, such as tellurides (i.e., BiTe, PbTe, GeTe, etc.), skutterudites, TAGS, half-Heusler, and others [15]. More recently, chalcogenide materials based on selenium and the lighter homologs of tellurium, such as tin selenide, have shown a strong competitiveness among thermoelectric materials [16,17]. Beyond the specific thermoelectric material, the advent of nanotechnologies in the 1990s offered enormous advantages for finding new strategies for enhancing ZT [18]. Among them, the exploitation of quantum phenomena and density of states engineering for increasing the power factor [19,20] and the use of nanostructuring for reducing the lattice contribution to the thermal conductivity [21,22] have shown great potential for optimizing the performance of thermoelectric materials. Very recently, new strategies for tuning the thermoelectric performances of several semiconductor nanostructures have been proposed, based, for example, on innovative gating approaches [23].
Here, we focused on a nanostructured selenide nanomaterial and in particular on hydrothermally grown ZnSe nanoparticles, and we aimed to investigate the role of iron doping (Fe2+) on the thermoelectric properties. We grew several samples with different Fe2+ doping levels. We then investigated the morphological and structural properties of the material by scanning electron microscopy, X-ray diffraction (XRD), and Raman spectroscopy. Finally, we measured the electrical conductivity and Seebeck coefficient in order to estimate the material power factor. The results show how the thermoelectric properties (Seebeck coefficient and power factor) of Fe2+-doped ZnSe nanoparticles are strongly affected by doping and open the way for the application of such classes of nanomaterials in energy applications.

2. Results and Discussion

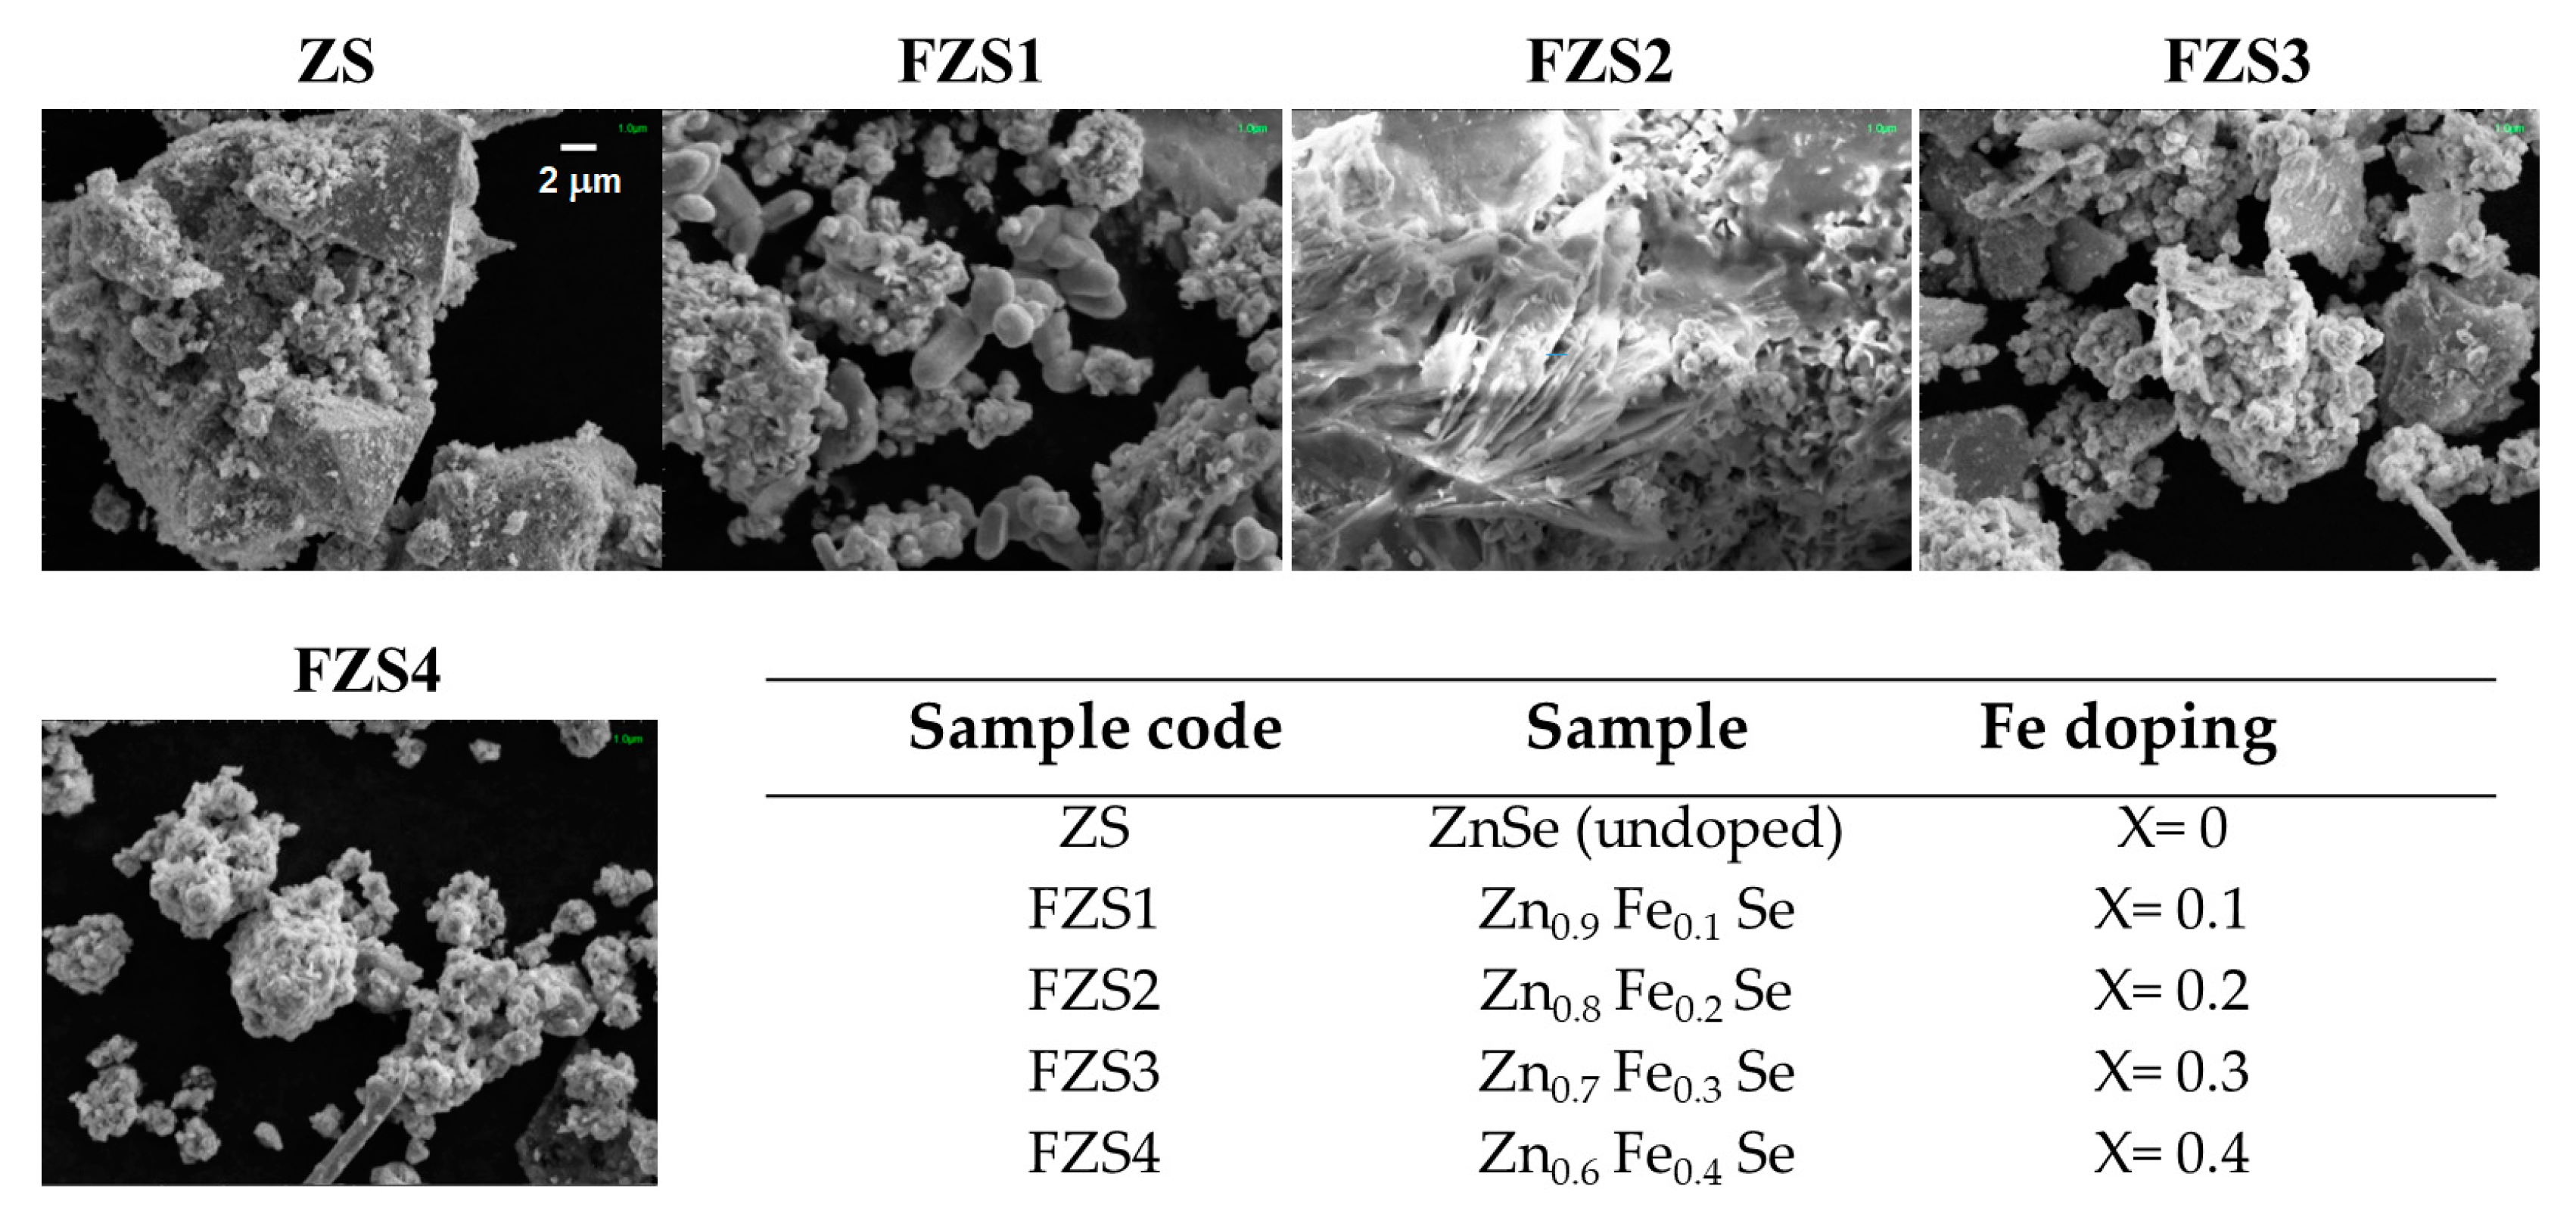
2.1. Scanning Electron Microscopy Investigation

Fe2+-doped ZnSe nanoparticles were synthesized using the hydrothermal method. Five different Zn1−xFexSe samples were prepared, with Fe2+ concentrations of x = 0 (undoped), x = 0.1, x = 0.2, x = 0.3, and x = 0.4. Figure 1 shows the scanning electron micrographs of the grown samples, whereas the table in the bottom right part of the figure summarizes the characteristics of the five prepared samples. In Figure 1, the scale bar of the micrographs is the same for all the samples. The images clearly show the morphological changes induced by the different Fe2+ doping concentrations. The undoped ZnSe sample (ZS) displays a non-homogenous microscopic morphology, with large clusters of material, surrounded by agglomerates of smaller-sized particles. By introducing a small dopant concentration (x = 0.1), the size of the agglomerates is reduced and some rod-like structures start to appear (FZS1). The sample with an Fe concentration x = 0.2 (FZS2) is quite peculiar, as the material appears as a continuous film homogeneously covering the substrate. The samples with Fe2+ concentrations x = 0.3 and x = 0.4 (FZS3 and FZS4) display the presence of both large aggregates and smaller-sized particles. In particular, FZS4 (x = 0.4) displays smaller aggregate sizes and has higher size homogeneity.

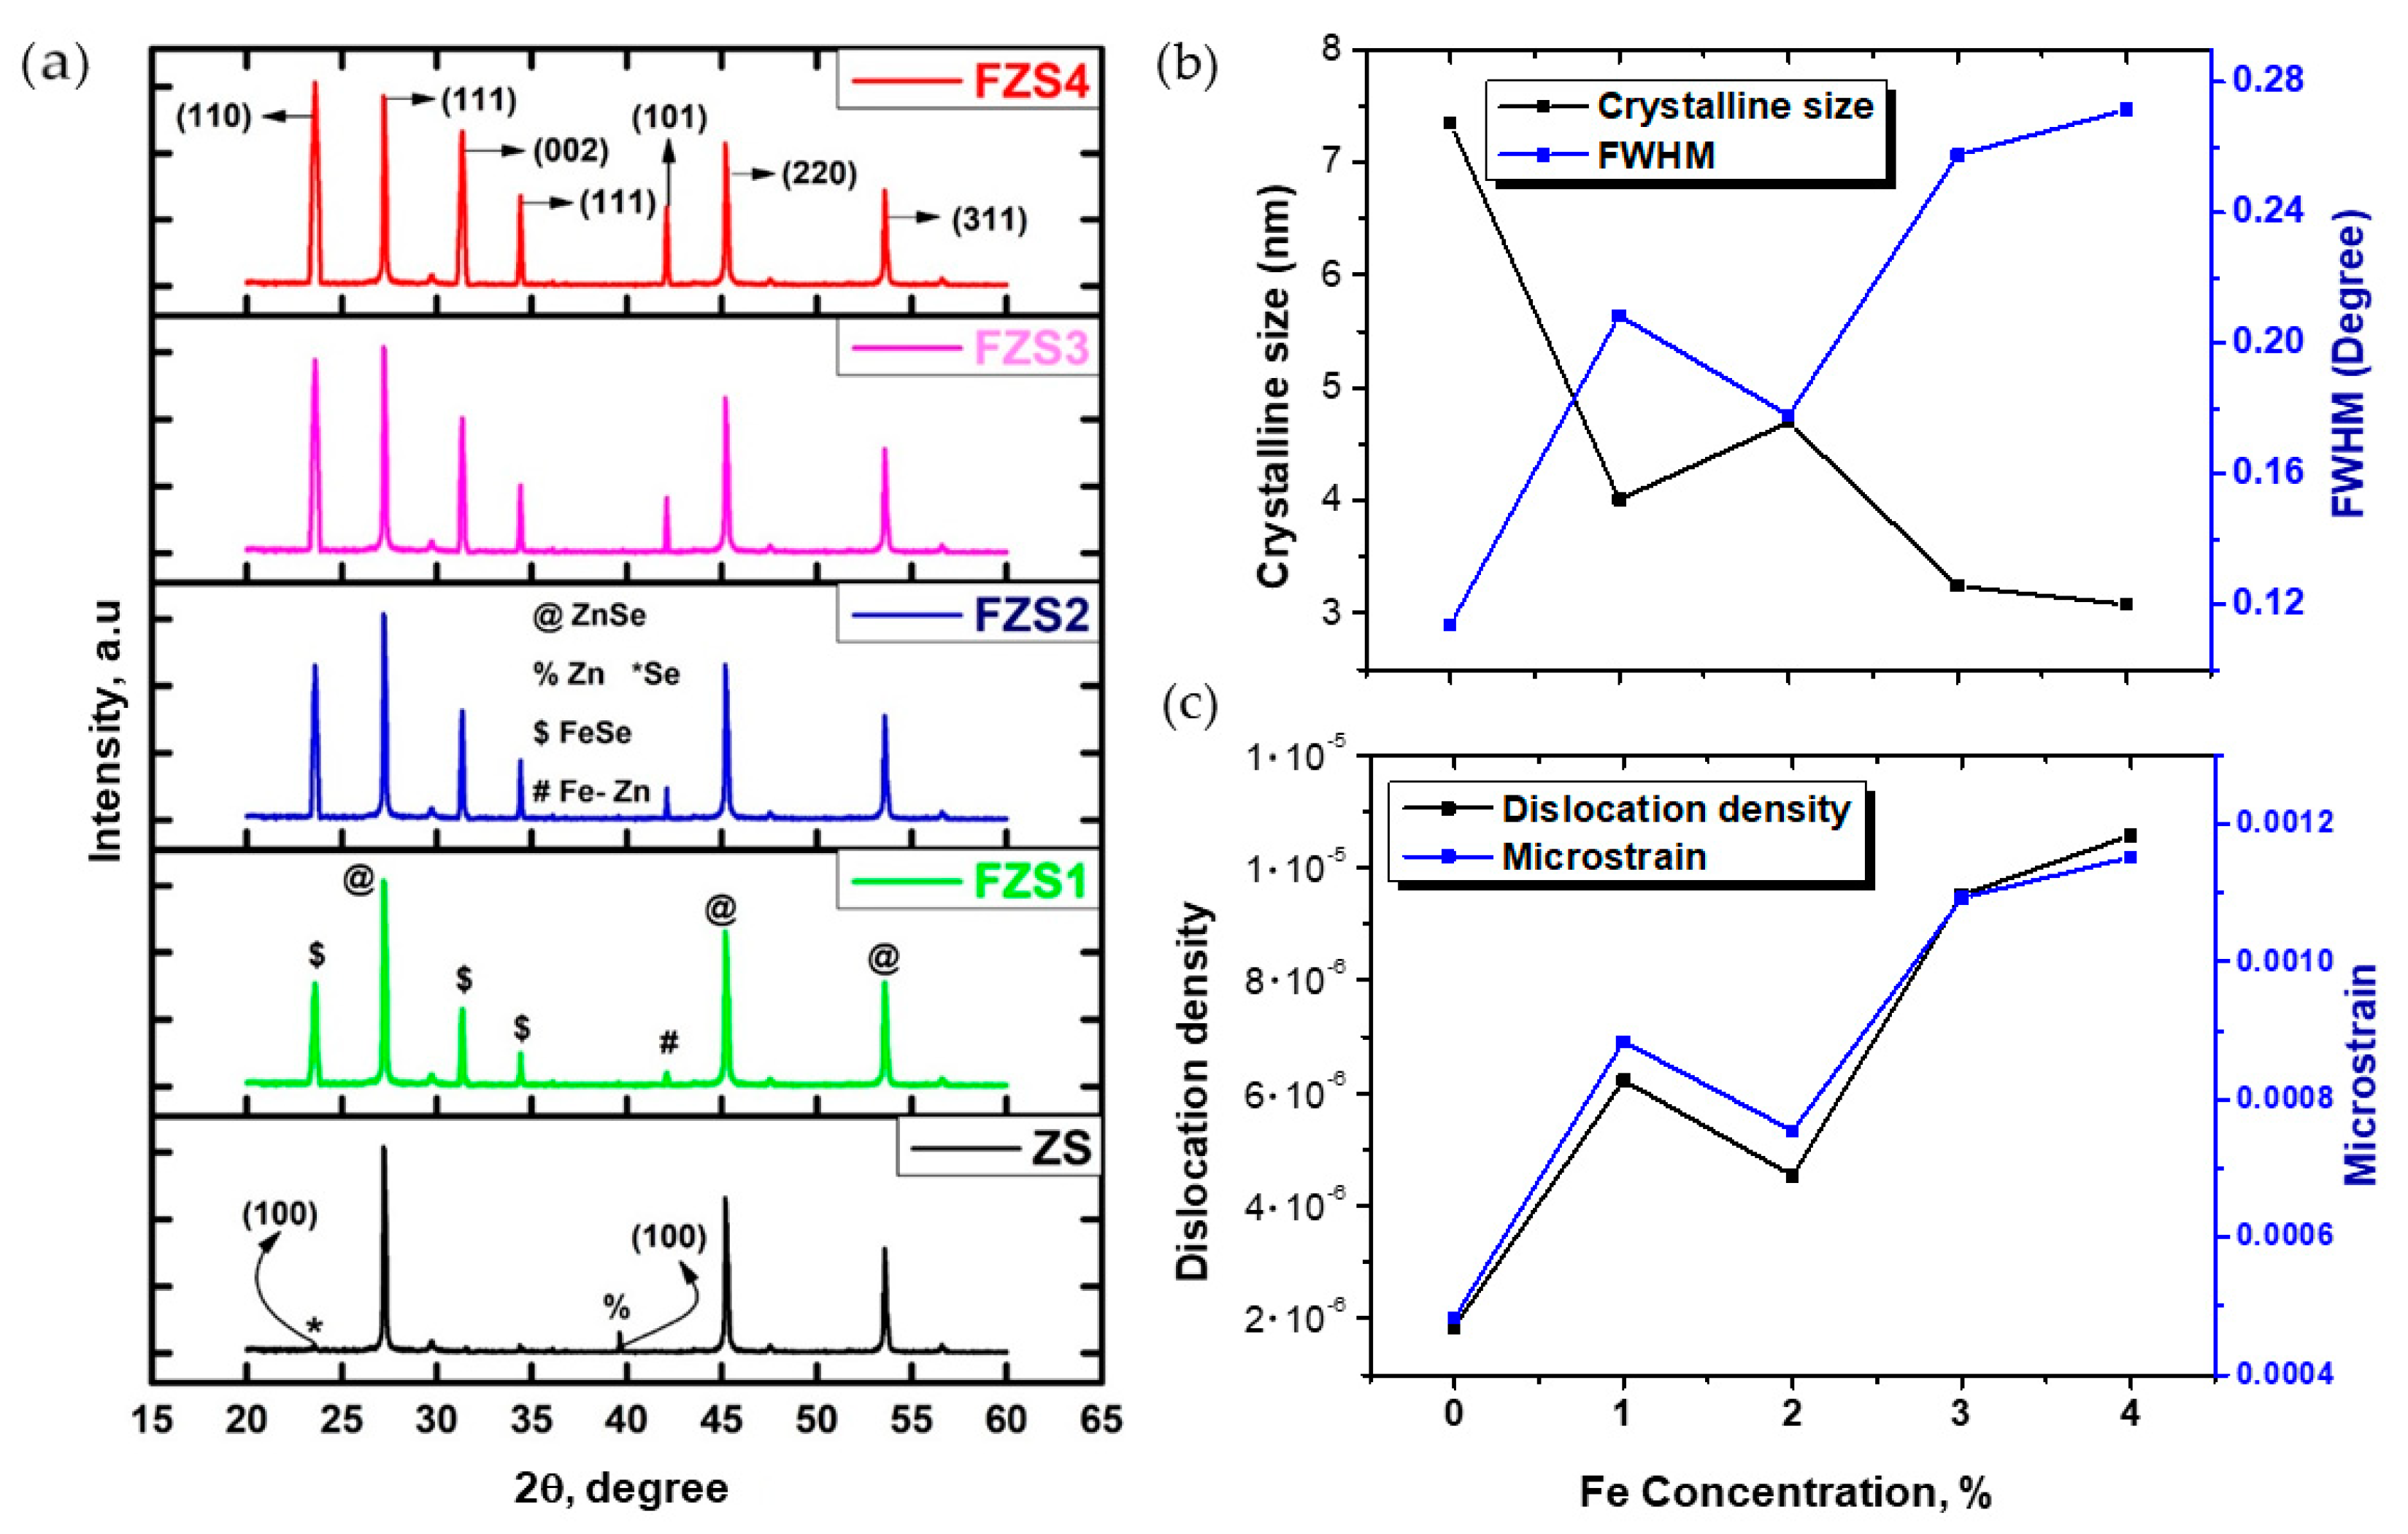
2.2. X-ray Diffraction Study

An X-ray diffraction (XRD) analysis was conducted to investigate the samples’ structural properties, using CuKα (λ = 1.54 Å) as the radiation source. The diffraction angle was varied from 20° to 60°. Figure 2 shows the XRD patterns of as-prepared undoped ZnSe and the Fe2+-doped ZnSe samples. The undoped sample (ZS) displays sharp peaks at 2θ = 27°, 45°, and 53° corresponding to diffraction from the (111), (220), and (311) planes in zincblende ZnSe (JCPDS Card No. 80-0021). This is in agreement with other studies [24,25]. Very small peaks located at 2θ = 23° and 39°, attributed to the planes (100) of Se and Zn, respectively, which are related to excesses of these materials in the synthesis, can also be observed. This is also in agreement with previous observations [26,27].
For Fe2+-doped samples, the XRD patterns show additional peaks at 2θ = 23°, 31°, and 34°, which display an increasing intensity when the doping concentration is increased, whereas the intensities of the characteristic peaks of zincblend ZnSe are slightly reduced. These peaks are the signature of the formation of a new phase in the composite material induced by doping. Specifically, they correspond to the (110), (002), and (111) planes of FeSe [28]. Moreover, a smaller peak at 2θ = 42° that is related to phase (101) of FeZn is present, with increasing intensity going from lower to higher Fe concentrations.
The crystallite sizes of pure ZnSe and Fe-doped ZnSe samples were estimated from the highest intensity diffraction peak in the XRD patterns (111) by using the Debye–Scherrer formula [29]:
D h k l = k λ β c o s θ
where D is the crystalline size, k is a numerical factor (frequently referred to as the crystallite-shape factor and approximated to 0.9 [30] ), λ is the wavelength of the X-ray beam, β is the full width at half maximum (FWHM), and θ is diffraction angle.
Bragg’s relation was used to calculate the interplanar spacing d.
d = n λ 2 s i n θ
The dislocation density, that is the number of defects present in the sample, was calculated using Williamson and Smallmman’s relation [31]:
δ = 1 D 2
and the lattice microstrain was calculated according to [32]:
ε = β cot ( θ ) 4
Table 1 summarizes the extracted values of the full width half maximum (FWHM), the crystallite size, the interplanar spacing, the dislocation density, and the microstrain for all the samples.
As shown in Table 1, increasing the doping concentration leads to an increase in the half weight at half maximum and consequently to a reduction in the material crystal size. For undoped ZnSe, the calculated crystallite size is 7.34 nm. For x = 0.1, 0.2, 0.3, and 0.4 Fe2+-doped ZnSe, the crystallite sizes are on average reduced to 4.01 nm, 4.7 nm, 3.24 nm, and 3.1 nm, respectively, although the sample with x = 0.1 doping slightly deviates from the monotonic behavior. This trend could be attributed to the smaller ionic radii of the dopant Fe2+ (0.064 pm) compared with Zn2+ (0.074 pm), which could lead to lattice distortions, resulting in poorer crystallization and a smaller grain size. As a consequence, the dislocation density (due to the inverse relationship with crystalline size [33]) and microstrain increase with increasing dopant concentrations. This is in agreement with previously reported studies [34]. The results of XRD analysis suggest that a reduction in ZnSe crystallinity, observed in conjunction with an enhancement in the intensity of the peaks associated with the FeSe secondary phase and increase in defect concentration, is associated with an increase in the significance of grain boundaries. These are the regions were the FeSe phase is likely predominantly located, and the FeSe phase is probably the primary factor influencing the effect of doping on the material’s properties. A similar behavior has been observed in metal-doped ZnSe nanoparticles [35].

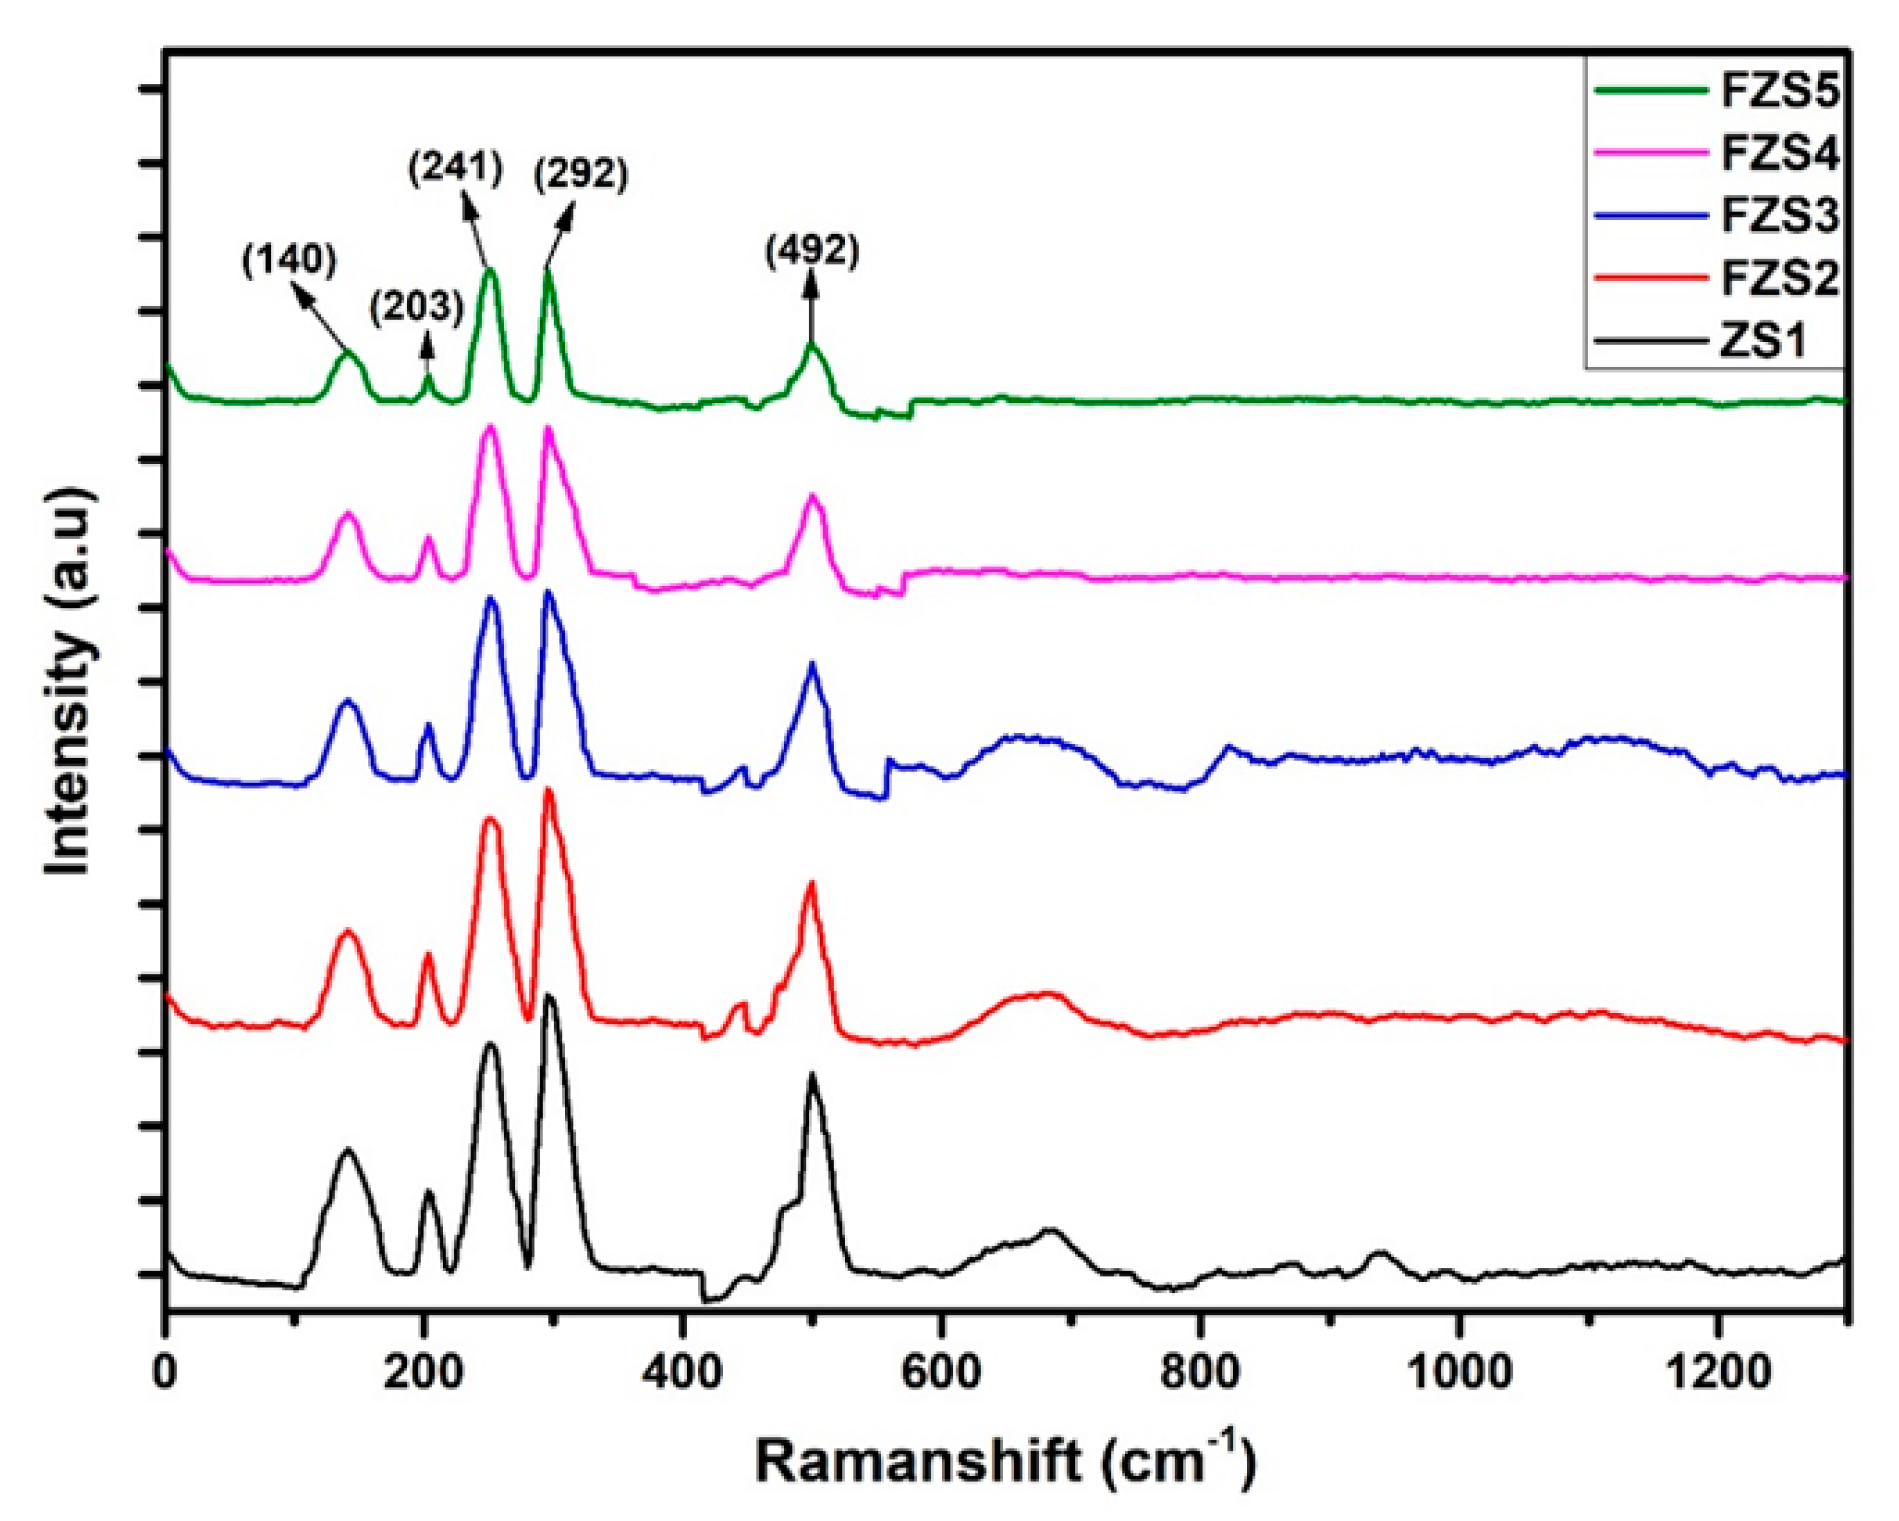
2.3. Raman Characterization

The structure of the samples was further investigated using Raman spectroscopy, a versatile and powerful technique for addressing the main structural features of nanomaterials at large, including not only nanoparticles but also nanorods and nanotubes, as well as low dimensional materials such as two-dimensional systems [36,37,38]. The spectra for the five samples are reported in Figure 3. As shown in the figure, the spectra of undoped and Fe-doped samples are similar, revealing that Fe doping does not induce significant modifications of the crystal structure. Five peaks located at 140 cm−1, 203 cm−1, 241 cm−1, 292 cm−1, and 492 cm−1 were found, which may be assigned to the 2TA(L), TO, LO, LO(L) + TA(L), and 2LO phonon modes, respectively [25,39]. The existence of the peaks related to the TO phonon mode at 203 cm−1 and the LO phonon mode at 241 cm−1 and TO mode confirms the cubic structure of ZnSe that is already suggested by the XRD analysis. The occurrence of the additional scattering peaks is related to higher-order phonons modes, which indicates that there is strong anharmonicity in the lattice vibrations [26,40,41]. In the literature, the formation of the LO(L) + TA(L) has been attributed to the fact that the movement of some optical phonons is partially limited by stacking faults [41]. The peak intensity decreases as the Fe content increases.

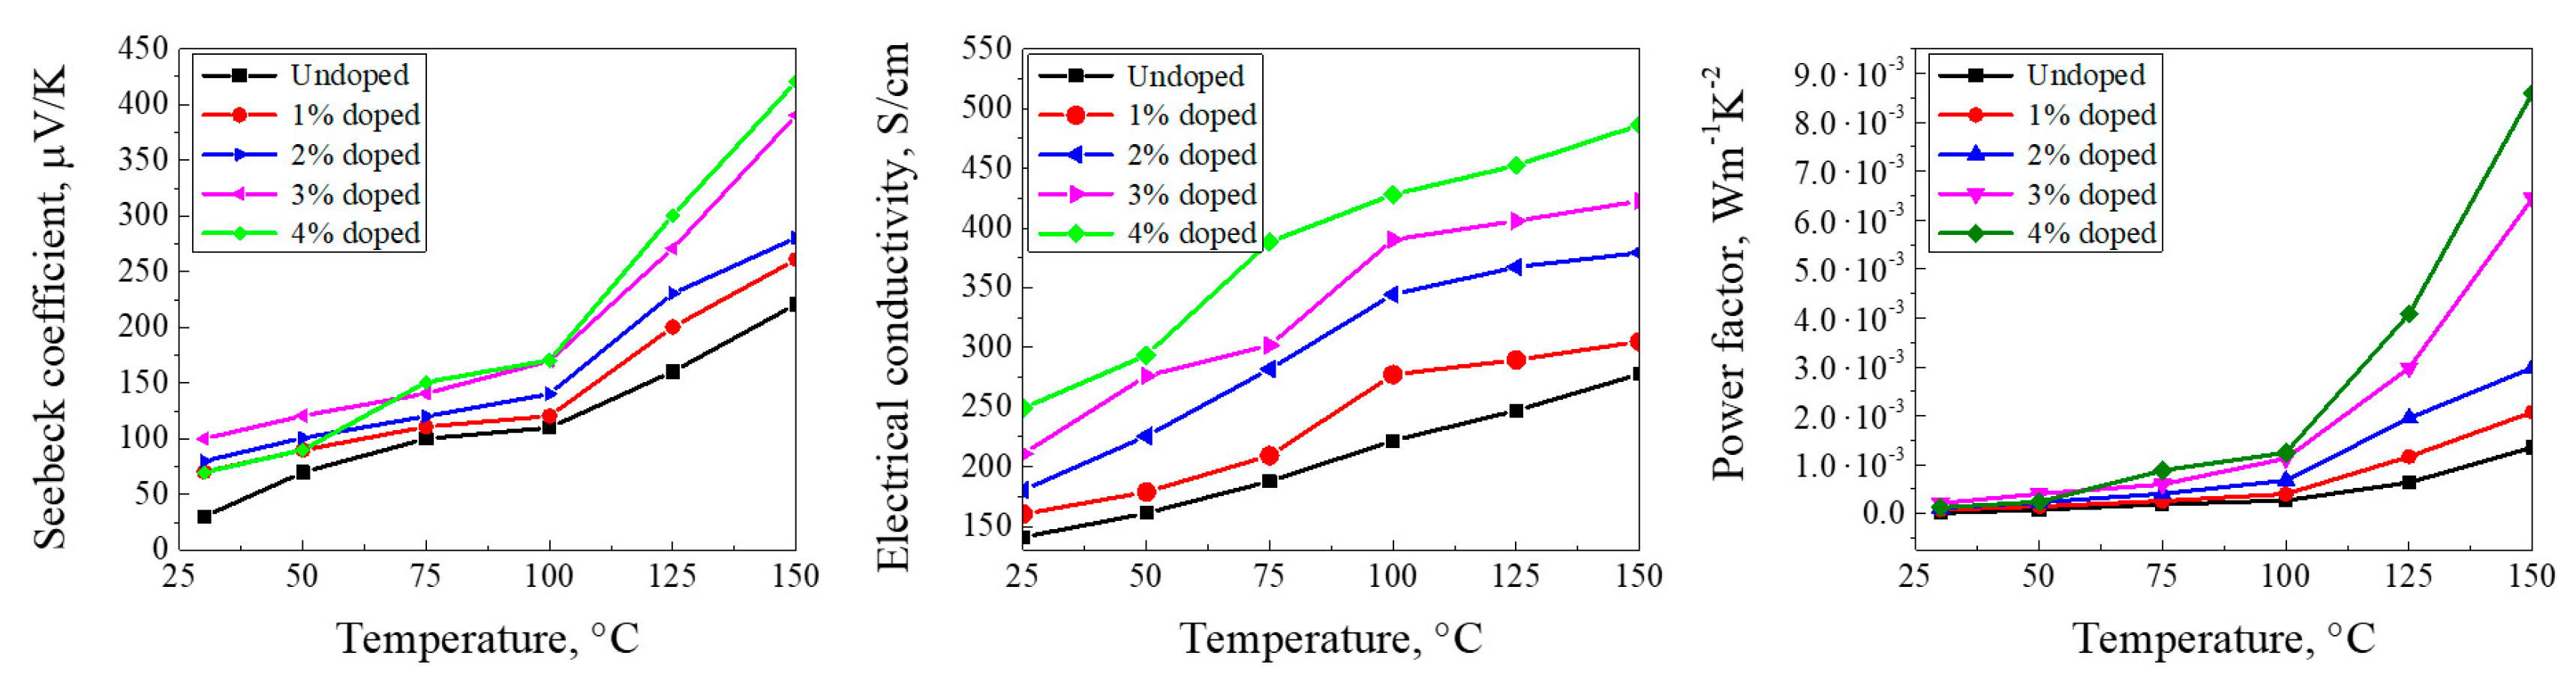
2.4. Electrical and Thermoelectric Measurements

In order to investigate the thermoelectric properties of pure ZnSe and Fe2+-doped ZnSe samples, we performed measurements of the Seebeck coefficient and of the electrical conductivity and extracted the material’s power factor. Pressed powder pellets of the hydrothermally grown materials were prepared using the standard cold pressing technique. This approach was chosen over more advanced methods such as hot pressing or spark plasma sintering as it offered a more cost-effective and scalable approach to device production. The measurements of the Seebeck coefficient, S, were carried out using a homemade setup described in session 4. The electrical conductivity, σ , was measured by using an Ecopia 3000 Hall Measurement SystemTM. All the thermoelectric parameters were measured as a function of temperature in the 25–150 °C range. The results are reported in Figure 4:
The values obtained for the Seebeck coefficients are positive, revealing a p-type behavior. It can also be observed that, for all the samples, as the temperature increases from 25 to 150 °C, the Seebeck values also increase. The maximum Seebeck value, which is close to 420 μV/K at 150 °C, was observed for the x = 0.4 Fe-doped sample. Undoped ZnSe has a lower Seebeck value, which reaches to 220 μV/K at 150 °C. The slight deviation in the Seebeck coefficient for the sample with the x = 0.4 doping concentration, which exhibits a behavior that deviates slightly from that of the other samples, is included within the error in the measurement, which was estimated to be ±30 µV/K. As expected for a doped semiconductor, the electrical conductivity also increases when the dopant concentration or the temperature are increased. Enhancement of the Seebeck coefficient values is observed for increasing levels of doping. The simultaneous increase in the Seebeck coefficient and electrical conductivity with increasing doping is not common, despite being reported multiple times in the literature [42,43,44,45]. The precise understanding of the mechanisms involved requires dedicated theoretical calculations. Nonetheless, some tentative explanations can be suggested based on the available evidence. The analysis of the samples studied in this work revealed that the introduction of Fe dopants in the material reduces the size of the crystallites, thus increasing the significance of grain boundaries, and increases the crystal dislocation and microstrain. These can be reasonably identified as the main mechanisms affecting the observed thermoelectric behavior. In fact, previous studies have also shown that optimized doping can induce the formation of nanocrystalline structures where the contribution of grain boundaries and defects to thermoelectric properties can be as significant as that of grain regions [42]. The band structure of the material, the position of the chemical potential, and the carrier’s effective mass around the grain boundaries can be strongly modified compared with the bulk material, leading to various mechanisms such as the contribution of higher energy carriers to transport and an increase in the electrical conductivity due to an increased scattering mean free path of these carriers. Additionally, energy barriers can form at grain boundaries, promoting an energy filtering effect that enhances the thermoelectric efficiencies [44]. The combination of these effects may explain the observed simultaneous increase in the Seebeck coefficient and electrical conductivity with temperature and doping.
The trends of the Seebeck coefficient and the electrical conductivity are reflected in the values of the power factors, which also increase with the doping concentration and with the temperature. The samples investigated displayed power factors at room temperature of around a few µWm-1K-2, which increased for temperatures above 100 °C and had a more pronounced effect at higher doping levels. The sample with the highest doping concentration (x = 0.4) exhibited the largest power factor, reaching about 9 × 10⁻³ Wm-1K-2 at 150 °C, approximately one order of magnitude higher than the power factor of the undoped sample. Similar results were previously obtained by some of the authors of this study on aluminum-doped ZnSe nanoparticles synthesized using the same approach [45]. Although a comprehensive understanding of the mechanisms behind the enhanced thermoelectric performance would require dedicated computational studies, it is worth noting that similar results were achieved in similar classes of materials, such as doped nanocrystalline SnSe-based compounds. In these materials, defect engineering led to significant improvements in the thermoelectric properties, resulting in a ZT as high as 2.6 [42]. These results support the hypothesis that the nanocrystalline nature of the material, along with doping, may be the main contributors to the material’s favorable thermoelectric performance.

3. Materials and Methods

Iron-doped zinc selenide samples were prepared by using the hydrothermal method. Firstly, an aqueous ZnSe precursor solution was prepared by mixing zinc acetate dihydrate (ZnC4H6O4) (99% Sigma Aldrich, St. Louis, MO, USA) and selenium Se (99% Sigma Aldrich), both separately dissolved in distilled water. Zn1−xFexSe samples with x ranging from 0.1 to 0.4 were prepared by incorporating different amounts of iron sulfate FeSO4 (98% Sigma Aldrich). The pH of the reaction was maintained to 8.4 to ±0.2 using sodium hydroxide (NaOH) (99% Sigma Aldrich). The precursor solution was stirred for 30 min and then transferred to a Teflon-lined stainless-steel autoclave with a 50mL capacity. The autoclave was then sealed, heated to 200 °C, and maintained at 200 °C for 24 h. The autoclave was then naturally cooled down to room temperature and the precipitates were separated by filtering through filter paper. The primary amorphous precipitate was then dissolved in 50 mL of deionized water by continuous stirring at 80 °C. Again, the solution was naturally cooled at room temperature and a secondary nanoparticle precipitate was obtained. The Fe-ZnSe nanoparticles were prepared by centrifuging the secondary precipitate (3000 r/min), washing, and then annealing in a muffle furnace for 2 h at 100 °C.
The morphology of the samples was investigated by scanning electron microscopy (SEM) (Emcrafts), whereas the crystalline structure was characterized by X-ray diffraction (XRD) (Bruker D8 Advanced), using a Cu Kα source that had a wavelength of 0.154 nm. Raman spectroscopy (MN STEX-PR 1100) was used to examine the vibrational modes. In order to perform the thermoelectric characterization, pressed powder pellets of the hydrothermally grown materials were prepared by resorting to the standard cold pressing technique. After the synthesis, rectangular pellets of the material were realized by using a hydraulic press with 13-ton pressure [46]. The density of the pellets was found to be around 2.1 g/cm3. The Seebeck coefficient was measured using a homemade setup: thermal gradients were applied at the two extremities of the pellets by exploiting Joule heating that was induced by using indium paste electrodes at one of end of the pellet and keeping a fixed temperature at the other end. The thermal gradient was monitored by using a thermocouple, and the voltage was measured using a probe station connected to a sourcemeter unit. The electrical conductivity was measured using an Ecopia 3000 Hall Measurement SystemTM.

4. Conclusions

In this paper, the effect of iron dopant concentration on the thermoelectric properties of ZnSe nanoparticles was investigated. Five Zn1−xFexSe samples were prepared, with Fe2+ concentrations ranging from x = 0 (undoped) to x = 0.4. The samples were investigated from a morphological and structural point of view and then the thermoelectric properties were investigated as a function of the doping concentration and temperature. The XRD data indicated that the samples consisted of very small crystallites, with the grain sizes decreasing as the doping concentration increased. The thermoelectric performance of the material was strongly affected by the doping concentration and temperature. In particular, both the Seebeck coefficient and electrical conductivity increased with the doping concentration and temperature. This behavior is consistent with that observed in the other nanocrystalline materials and suggests that the nanostructure of the material is highly promising for thermoelectric applications. The highest power factor, corresponding to 9 × 10⁻³ Wm−1K−2, was measured at 150 °C for the sample with the highest doping concentration (x = 0.4). The results of this research demonstrate that the incorporation of Fe dopants into the synthesis of ZnSe nanoparticles is an effective way to enhance the material’s thermoelectric properties. Specifically, the results show that Fe-doped ZnSe nanoparticles are interesting thermoelectric materials in the temperature range around or above 150 °C. This range is very interesting for applications in the recovery of waste heat in medium temperatures industrial processes, such as in the food industry.

Author Contributions

Conceptualization, K.M. and F.R.; methodology, S.B., A.d.B., N.A., K.M. and F.R.; formal analysis, M.I., N.A.K. and R.M.M.; investigation, M.I., N.A.K, R.M.M., N.A. and K.M.; resources, K.M. and F.R.; data curation, M.I. and N.A.K.; writing—original draft preparation, M.I. and V.D.; writing—review and editing, all coauthors; visualization, M.I., R.M.M. and V.D.; supervision, K.M. and F.R.; project administration, N.A., K.M. and F.R.; funding acquisition, K.M. and F.R. All authors have read and agreed to the published version of the manuscript.

Funding

This research was funded by MIUR-PON, scholarship PhD program “Physics and nano sciences” 2021/22.“Nanotecnologie per la termoelettricità e l’energy harvesting” (Azione IV.5 “Dottorati su tematiche green”) and by project QUANTEP, INFN CSN5. This work was also partially funded under the National Recovery and Resilience Plan (NRRP), Mission 04 Component 2 Investment 1.5—NextGenerationEU, Call for tender n. 3277 dated 30 December 2021. Award Number: 0001052 dated 23 June 2022.

Conflicts of Interest

The authors declare no conflict of interest.

References

  1. Zhang, Q.; Li, H.; Ma, Y.; Zhai, T. ZnSe nanostructures: Synthesis, properties and applications. Prog. Mater. Sci. 2016, 83, 472–535. [Google Scholar] [CrossRef]
  2. Feng, B.; Cao, J.; Yang, J.; Yang, S.; Han, D. Characterization and photocatalytic activity of ZnSe nanoparticles synthesized by a facile solvothermal method, and the effects of different solvents on these properties. Mater. Res. Bull. 2014, 60, 794–801. [Google Scholar] [CrossRef]
  3. Elsaeedy, H.I.; Hassan, A.A.; Yakout, H.A.; Qasem, A. The significant role of ZnSe layer thickness in optimizing the performance of ZnSe/CdTe solar cell for optoelectronic applications. Opt. Laser Technol. 2021, 141, 107139. [Google Scholar] [CrossRef]
  4. Benstaali, W.; Bentata, S.; Abbad, A.; Belaidi, A. Ab-initio study of magnetic, electronic and optical properties of ZnSe doped-transition metals. Mater. Sci. Semicond. Process. 2013, 6, 231–237. [Google Scholar] [CrossRef]
  5. Godlewski, M.; Guziewicz, E.; Kopalko, K.; Łusakowska, E.; Dynowska, E.; Godlewski, M.M.; Goldys, E.; Phillips, M.R. Origin of white color light emission in ALE-grown ZnSe. J. Lumin. 2003, 102, 455–459. [Google Scholar] [CrossRef]
  6. Lin, T.K.; Chang, S.J.; Chiou, Y.Z.; Wang, C.K.; Chang, S.P.; Lam, K.T.; Sun, Y.S. Homoepitaxial ZnSe MIS photodetectors with SiO2 and BST insulator layers. SolidState Electron. 2006, 50, 750. [Google Scholar] [CrossRef]
  7. Liu, W.; Gu, D.; Li, X. Ultrasensitive NO2 Detection Utilizing Mesoporous ZnSe/ZnO Heterojunction-Based Chemiresistive-Type Sensors. ACS Appl. Mater. Interfaces 2019, 11, 29029–29040. [Google Scholar] [CrossRef]
  8. Li, P.; He, T. Recent advances in zinc chalcogenide-based nanocatalysts for photocatalytic reduction of CO2. J. Mater. Chem. A 2021, 9, 23364–23381. [Google Scholar] [CrossRef]
  9. Gul, S.; Cooper, J.K.; Glans, P.-A.; Guo, J.; Yachandra, V.K.; Yano, J.; Zhang, J.Z. Effect of Al3+ co-doping on the dopant local structure, optical properties, and exciton dynamics in Cu+-doped ZnSe nanocrystals. ACS Nano 2013, 7, 8680–8692. [Google Scholar] [CrossRef]
  10. Norris, D.J.; Efros, A.L.; Erwin, S.C. Doped nanocrystals. Science 2008, 319, 1776–1779. [Google Scholar] [CrossRef]
  11. Chen, M.; Cui, X.; Xiao, X.; Xu, Y.; Cui, J.; Guo, J.; Liu, C.; Guo, H. Mid-infrared emission of transition metal Co2+-doped ZnSe nanocrystals at room temperature via hydrothermal preparation. ACS Appl. Nano Mater. 2019, 2, 2844–2853. [Google Scholar] [CrossRef]
  12. Myoung, N.; Martyshkin, D.V.; Fedorov, V.V.; Sergey, B. Energy scaling of 4.3 μm room temperature Fe: ZnSe laser. Opt. Lett. 2011, 36, 94–96. [Google Scholar] [CrossRef] [PubMed]
  13. Snyder, G.J.; Toberer, E.S. Complex thermoelectric materials. Nat. Mater. 2008, 7, 105. [Google Scholar] [CrossRef] [Green Version]
  14. DiSalvo, F.J. Thermoelectric cooling and power generation. Science 1999, 285, 703–706. [Google Scholar] [CrossRef] [PubMed]
  15. Shi, X.-L.; Zou, J.; Chen, Z.-G. Advanced thermoelectric design: From materials and structures to devices. Chem. Rev. 2020, 120, 7399–7515. [Google Scholar] [CrossRef]
  16. Zhao, L.-D.; Lo, S.-H.; Zhang, Y.; Sun, H.; Tan, G.; Uher, C.; Wolverton, C.; Dravid, V.P.; Kanatzidis, M.G. Ultralow thermal conductivity and high thermoelectric figure of merit in SnSe crystals. Nature 2014, 508, 373–377. [Google Scholar] [CrossRef]
  17. Chang, C.; Wu, M.H.; He, D.S.; Pei, Y.L.; Wu, C.F.; Wu, X.F.; Yu, H.L.; Zhu, F.Y.; Wang, K.D.; Chen, Y.; et al. 3D charge and 2D phonon transports leading to high out-of-plane ZT in n-type SnSe crystals. Science 2018, 360, 778–783. [Google Scholar] [CrossRef] [Green Version]
  18. Dresselhaus, M.S.; Chen, G.; Tang, M.Y.; Yang, M.Y.R.; Lee, H.; Wang, D.; Ren, Z.; Fleurial, J.P.; Gogna, P. Nanocomposites to enhance ZT in thermoelectrics. Adv. Mater. 2007, 19, 1043–1053. [Google Scholar] [CrossRef]
  19. Prete, D.; Erdman, P.A.; Demontis, V.; Zannier, V.; Ercolani, D.; Sorba, L.; Beltram, F.; Rossella, F.; Taddei, F.; Roddaro, S. Thermoelectric conversion at 30 K in InAs/InP nanowire quantum dots. Nano Lett. 2019, 19, 3033–3039. [Google Scholar] [CrossRef] [Green Version]
  20. Chen, R.; Lee, J.; Lee, W.; Li, D. Thermoelectrics of nanowires. Chem. Rev. 2019, 119, 9260–9302. [Google Scholar] [CrossRef]
  21. Peri, L.; Prete, D.; Demontis, V.; Zannier, V.; Rossi, F.; Sorba, L.; Beltram, F.; Rossella, F. Giant reduction of thermal conductivity and enhancement of thermoelectric performance in twinning superlattice InAsSb nanowires. Nano Energy 2022, 103 Pt A, 107700. [Google Scholar] [CrossRef]
  22. Rocci, M.; Demontis, V.; Prete, D.; Ercolani, D.; Sorba, L.; Beltram, F.; Pennelli, G.; Roddaro, S.; Rossella, F. Suspended InAs Nanowire-Based Devices for Thermal Conductivity Measurement Using the 3 ω Method. J. Mater. Eng. Perform. 2018, 27, 6299–6305. [Google Scholar] [CrossRef]
  23. Prete, D.; Dimaggio, E.; Demontis, V.; Zannier, V.; Rodriguez-Douton, M.J.; Guazzelli, L.; Beltram, F.; Sorba, L.; Pennelli, G.; Rossella, F. Electrostatic Control of the Thermoelectric Figure of Merit in Ion-Gated Nanotransistors. Adv. Funct. Mater. 2021, 31, 2104175. [Google Scholar] [CrossRef]
  24. Flamee, S.; Dierick, R.; Cirillo, M.; Van Genechten, D.; Aubertab, T.; Hens, Z. Synthesis of metal selenide colloidal nanocrystals by the hot injection of selenium powder. Dalton Trans. 2013, 42, 12654–12661. [Google Scholar] [CrossRef] [PubMed]
  25. Li, T.T.; Sun, C.C.; Xue, C.; Jiang, Y.T.; Zhang, J.; Zhao, L.J. Structure and optical properties of iron doped ZnSe microspheres. Opt. Mater. 2021, 114, 110989. [Google Scholar] [CrossRef]
  26. Liu, X.Y.; Mo, M.S.; Zeng, J.H.; Qian, Y.T. Large-scale synthesis of ultra-long wire-like single-crystal selenium arrays. J. Cryst. Growth 2003, 259, 144. [Google Scholar] [CrossRef]
  27. Li, H.; Wang, B.; Li, L. Study on Raman spectra of zinc selenide nanopowders synthesized by hydrothermal method. J. Alloys Compd. 2010, 506, 327–330. [Google Scholar] [CrossRef]
  28. Qiao, F.; Qi, Q.; Wang, Z.; Xu, K.; Ai, S. Double enzymatic cascade reactions within FeSe–Pt@ SiO2 nanospheres: Synthesis and application toward colorimetric biosensing of H2O2 and glucose. Analyst 2015, 140, 6684–6691. [Google Scholar] [CrossRef]
  29. Holzwarth, U.; Gibsong, N. The Scherrer equation versus the ‘Debye-Scherrer equation’. Nat. Nanotechnol. 2011, 6, 534. [Google Scholar] [CrossRef]
  30. Klug, H.P.; Alexander, L.E. X-ray Diffraction Procedures: For Polycrystalline and Amorphous Materials, 2nd ed.; Wiley: Hoboken, NJ, USA, 1974; Chapter 9. [Google Scholar]
  31. Javid, M.A.; Rafi, M.; Ali, I.; Hussain, F.; Imran, M.; Ali, N. Synthesis and study of structural properties of Sn doped ZnO nanoparticles. Mater. Sci. Pol. 2016, 34, 741–746. [Google Scholar] [CrossRef] [Green Version]
  32. Yon, V.; Rochat, N.; Charles, M.; Nolot, E.; Gergaud, P. X-ray Diffraction Microstrain Analysis for Extraction of Threading Dislocation Density of GaN Films Grown on Silicon, Sapphire, and SiC Substrates. Phys. Status Solidi B 2020, 257, 1900579. [Google Scholar] [CrossRef]
  33. Kasar, R.R.; Deshpande, N.G.; Gudage, Y.G.; Vyas, J.C.; Sharma, R. Studies and correlation among the structural, optical and electrical parameters of spray-deposited tin oxide (SnO2) thin films with different substrate temperatures. Phys. B Condens. Matter 2008, 403, 3724–3729. [Google Scholar] [CrossRef]
  34. Divya, R.; Manikandan, N.; Girisun, T.S.; Vinitha, G. Investigations on the structural, morphological, linear and third order nonlinear optical properties of manganese doped zinc selenide nanoparticles for optical limiting application. Opt. Mater. 2020, 100, 109641. [Google Scholar] [CrossRef]
  35. Yadav, K.; Dwivedi, Y.; Jaggi, N. Structural and optical properties of Ni doped ZnSe nanoparticles. J. Lumin. 2015, 158, 181–187. [Google Scholar] [CrossRef]
  36. Bellucci, S.; Chiaretti, M.; Onorato, P.; Rossella, F.; Grandi, M.; Galinetto, P.; Sacco, I.; Micciulla, F. Micro-Raman study of the role of sterilization on carbon nanotubes for biomedical applications. Nanomedicine 2010, 5, 209–215. [Google Scholar] [CrossRef] [PubMed]
  37. Caridad, J.; Closkey, D.; Rossella, F.; Bellani, V.; Donegan, J.; Krstić, V. Effective wavelength scaling of and damping in plasmonic helical antennae. ACS Photonics 2015, 2, 675–679. [Google Scholar] [CrossRef]
  38. Caridad, J.; Rossella, F.; Bellani, V.; Grandi, M.; Diez, E. Automated detection and characterization of graphene and few-layer graphite via Raman spectroscopy. J. Raman Spectrosc. 2011, 42, 286–293. [Google Scholar] [CrossRef]
  39. Taylor, W. The Raman spectra of cubic zinc selenide and telluride. Phys. Lett. A 1967, 24, 556–558. [Google Scholar] [CrossRef]
  40. Hoffmann, A.; Heitz, R.; Broser, I. Fe3+ as near-infrared luminescence center in ZnS. Phys. Rev. B 1990, 41, 5806–5816. [Google Scholar] [CrossRef]
  41. Liang, B.; Hou, L.P.; Zou, S.Y.; Zhang, L.; Guo, Y.C.; Liu, Y.T.; Farooq, M.U.; Shi, L.J.; Liu, R.B.; Zou, B.S. The aggregation of Fe3+ and their d–d radiative transitions in ZnSe: Fe3+ nanobelts by CVD growth. RSC Adv. 2018, 8, 3133–3139. [Google Scholar] [CrossRef]
  42. Liu, Y.; Calcabrini, M.; Yu, Y.; Lee, S.; Chang, C.; David, J.; Ghosh, T.; Spadaro, M.C.; Xie, C.; Cojocaru-Mirédin, O.; et al. Defect Engineering in Solution-Processed Polycrystalline SnSe Leads to High Thermoelectric Performance. ACS Nano 2022, 25, 78–88. [Google Scholar] [CrossRef] [PubMed]
  43. Zheng, Z.H.; Wei, M.; Luo, J.T.; Li, F.; Liang, G.X.; Liang, Y.; Hao, J.; Ma, H.L.; Zhang, X.H.; Fan, P. An enhanced power factor via multilayer growth of Ag-doped skutterudite CoSb3 thin films. Inorg. Chem. Front. 2018, 5, 1409–1414. [Google Scholar] [CrossRef] [Green Version]
  44. Neophytou, N.; Zianni, X.; Kosina, H.; Frabboni, S.; Lorenzi, B.; Narducci, D. Simultaneous increase in electrical conductivity and Seebeck coefficient in highly boron-doped nanocrystaline Si. Nanotechnology 2013, 24, 205402. [Google Scholar] [CrossRef]
  45. Ali, H.T.; Jacob, J.; Isram, M.; Mahmood, K.; Yusuf, M.; Mehboob, K.; Ikram, S.; Amin, N.; Javaid, K. Effect of Aluminum (Al) Concentration on the Thermoelectric Performance of Zinc Aluminum Selenium (ZnAlSe) Alloy. J. Supercond. Nov. Magn. 2021, 34, 2199–2206. [Google Scholar] [CrossRef]
  46. Jacob, J.; Mahmood, K.; Usman, M.Y.; Rehman, U.; Ali, A.; Ashfaq, A.; Amin, N.; Ikram, S.; Hussain, S. Modulation of thermoelectric properties of bulk ZnAlO by annealing in oxygen environment. Phys. B Condens. Matter 2019, 572, 247–250. [Google Scholar] [CrossRef]
Figure 1. Scanning electron micrographs of the prepared Fe2+-doped ZnSe samples. The scale bar is common to all the images. The table summarizes the preparation parameters for the five samples.
Inorganics 11 00286 g001
Figure 2. (a) XRD patterns of undoped and Fe-doped ZnSe nanoparticles synthetized using the hydrothermal method. (b) Peaks full width at half maximum (FWHM) as a function of the dopant concentration; (c) dislocation density as a function of dopant concentration.
Inorganics 11 00286 g002
Figure 3. Raman spectra of the undoped and Fe-doped ZnSe samples. The Raman peaks at 203 and 241 cm−1 correspond to the TO and LO phonon modes of cubic ZnSe. The other peaks are related to higher-order phonon modes.
Inorganics 11 00286 g003
Figure 4. Measured values for the Seebeck coefficient, electrical conductivity, and power factor for the undoped and Fe-doped ZnSe samples as a function of temperature.
Inorganics 11 00286 g004
Table 1. Effect of Fe doping in Zn1−xFexSe nanoparticles on the FWHM, crystalline size, interplanar spacing, dislocation density, and microstrain.
SampleFWHM
(Degree)
Crystalline
Size (D)
(nm)
Interplanar
Spacing
(dhkl)
(Å)
Dislocation
Density (δ)
10 (Line m−2)
Microstrain
(ε)
10−4 (Line −2 m−4)
ZS10.117.343.271.854.82
FZS10.204.013.276.238.84
FZS20.174.703.274.547.54
FZS30.263.243.279.5110.92
FZS40.273.083.2710.5711.52
Disclaimer/Publisher’s Note: The statements, opinions and data contained in all publications are solely those of the individual author(s) and contributor(s) and not of MDPI and/or the editor(s). MDPI and/or the editor(s) disclaim responsibility for any injury to people or property resulting from any ideas, methods, instructions or products referred to in the content.

