Article

Structural, Morphological, and Optical Properties of Single and Mixed Ni-Co Aluminates Nanoparticles

by
Dana Gingasu
1,*,
Ovidiu Oprea
2,3,
Gabriela Marinescu
1,
Jose Maria Calderon Moreno
1,
Daniela C. Culita
1,
Silviu Preda
1,* and
Vasile-Adrian Surdu
2
1
Ilie Murgulescu Institute of Physical Chemistry, Romanian Academy, 202 Splaiul Independentei, 060021 Bucharest, Romania
2
Faculty of Chemical Engineering and Biotechnologies, University Politehnica of Bucharest, 1–7 Polizu Street, 011061 Bucharest, Romania
3
Academy of Romanian Scientists, 3 Ilfov Street, 050054 Bucharest, Romania
*
Authors to whom correspondence should be addressed.
Inorganics 2023, 11(9), 371; https://doi.org/10.3390/inorganics11090371
Submission received: 27 July 2023 / Revised: 8 September 2023 / Accepted: 13 September 2023 / Published: 16 September 2023
(This article belongs to the Special Issue Optoelectronic Properties of Metal Oxide Semiconductors)

Abstract

:
A series including single and mixed Ni-Co aluminates was obtained using the precursor method, with malic acid as a ligand. The malate precursors (polynuclear coordination compounds) were isolated and characterized by Fourier Transform Infrared (FTIR), Ultraviolet/Visible/Near Infrared (UV–Vis–NIR) spectroscopy, and thermal analysis. The UV–Vis–NIR spectra of the synthesized complex compounds highlighted the presence of Co2+ and Ni2+ in an octahedral environment. The thermal decomposition of these precursors led to Co1−xNixAl2O4 (x = 0, 0.1, 0.25, 0.5, 0.75, 0.9, and 1) spinels. The effect of Ni2+ substitution on the structure, morphology, and optical properties of the obtained oxides was studied with the help of different characterization tools. XRD, FTIR, and Raman spectra evidenced the formation of the spinel phase. The size of the crystallites and the agglomeration degree of the particles decrease when the nickel content increases. The band gap (BG) value is not significantly influenced by the Ni substitution. The fluorescence spectra recorded for all samples show a similar pattern, but different intensities of the emission bands.

Graphical Abstract

1. Introduction

Spinel metal oxides are intensively studied due to their special properties and the attractive applications in which they are used. Spinels have the general formula AB2O4, where A are divalent cations from tetrahedral sites and B are trivalent cations from octahedral sites. The nature of the cations and the preparation method influence the distribution of the cations between the two crystallographic sites, having considerable implications for magnetic, catalytic, optical, and electrical properties. The type of spinel structure (normal or inverse) depends on the distribution of these cations [1].
Two of the most important materials and exciting members of the spinel class are cobalt aluminate (CoAl2O4) and nickel aluminate (NiAl2O4). CoAl2O4 has a normal spinel structure, while NiAl2O4 is an inverse spinel. Due to their good chemical and thermal stability, dielectric, and optical properties, they are used as pigments, catalysts/photocatalysts, and microstrip antennas [2,3,4,5,6,7,8,9]. Previous studies have highlighted the multitude of synthesis methods of spinel aluminates. The methods used for obtaining CoAl2O4 and NiAl2O4 include the Pechini route [10], combustion/microwave combustion technique [2,4,11,12], sol–gel method [9], coprecipitation method [13,14], solid-state reaction [15,16], ultrasonic hydrothermal method [17], and ultrasonic spray pyrolysis method [18]. The properties of the spinel oxides, and implicitly their application field, are influenced by the synthesis method, as well as the parameters used during the synthesis. The glycine content within the combustion method [12] influences the formation and the crystallinity of the prepared cobalt aluminates.
Our attention was focused on the precursor method, also known as the complexation method, because it is simple, highly effective, and the oxide formation takes place simultaneously or immediately after the decomposition of the precursors (polynuclear complex compounds) [19]. The properties of the final oxide depend on the chosen ligand. The most commonly used ligands (complexation agents) are carboxylic/polyhydroxycarboxylic acids; of these, tartaric acid and gluconic acid are the most often mentioned in the literature [19,20]. Malic acid was also used as a ligand to obtain polynuclear multimetallic species due to its special coordination capacity [20]. The malate anion, which contains two carboxyl groups and one hydroxyl group in the molecule, can have multiple coordination possibilities. As is well known, the type of precursor depends on the used chemicals and reaction conditions (pH solution, temperature and time of reaction, solvent, etc.). Suciu et al. [21] obtained three malate precursors depending on the pH solution. The thermal decomposition of these polynuclear coordination compounds led to nickel aluminates. Recently, Mitran et al. [22] used malic acid as a complexing agent to obtain CoAl2O4 spinel catalyst by the sol–gel method.
The structural, morphological, optical, and catalytic/photocatalytic properties of the spinel aluminates can also be altered by introducing a dopant or substituent metal ion in the oxidic lattice. As an example, the addition of calcium ions to CoAl2O4 has a great influence on the color of synthesized samples, leading, at the same time, to a reduction in production costs and a minimization of environmental damage [23]. Jafari et al. [24] observed that the partial substitution of Co2+ with Ba2+ causes a distortion in the unit cell compared to pure CoAl2O4 spinel. De Sousa et al. [25] employed the polymeric precursor method to obtain CoxZn1−xAl2O4 (x = 0, 0.1, 0.3, 0.5, 0.7, 0.9, 1) series with potential industrial applications. The substitution of Sr2+ ions in the CoAl2O4 structure leads to a decrease in the band gap from 3.32 eV for CoAl2O4 to 3.18 eV for Co0.6Sr0.4Al2O4 sample [26]. The substitution of Ni2+ ions in spinel structure introduces a new energy level into the host matrix [27]. Suguna et al. [4] used Ni-doped CoAl2O4 for catalytic oxidation of benzyl alcohol and highlighted that the nature and amount of dopant ions influence both the conversion and product selectivity. Nickel-doped CoAl2O4 was also investigated in the evaluation of sunlight driven catalytic studies [10]. The ultrasonic spray pyrolysis method [18] leads to a (Ni,Co)Al2O4 mesoporous spinel catalyst. The partial substitution of Ni with Co increased the methane conversion values, while a complete replacement of the cobalt with nickel in the spinel structure caused a decrease in the catalytic properties. Patil et al. [28] use glycine as fuel to synthesize Ni1−xCoxAl2O4 (x = 0.0, 0.25, 0.50, 0.75, 1.0) spinels by the sol–gel combustion method. The composition of the obtained aluminates has a strong influence on the structure, morphology, thermal behavior, and catalytic properties in the reaction of N-formylation of amines to synthesize substituted formamides.
Those discussed above motivated us to report, through this paper, the synthesis of a single and mixed Ni-Co aluminate series (Co1−xNixAl2O4, where x = 0, 0.1, 0.25, 0.5, 0.75, 0.9, 1) and to study the impact of Ni2+ substitution on the structural, morphological, and optical properties of the prepared samples. The precursor method using malic acid as a ligand has been adopted to prepare these oxidic materials. The polynuclear coordination compounds as precursors and the obtained mixed oxides were characterized by various techniques.

2. Results and Discussion

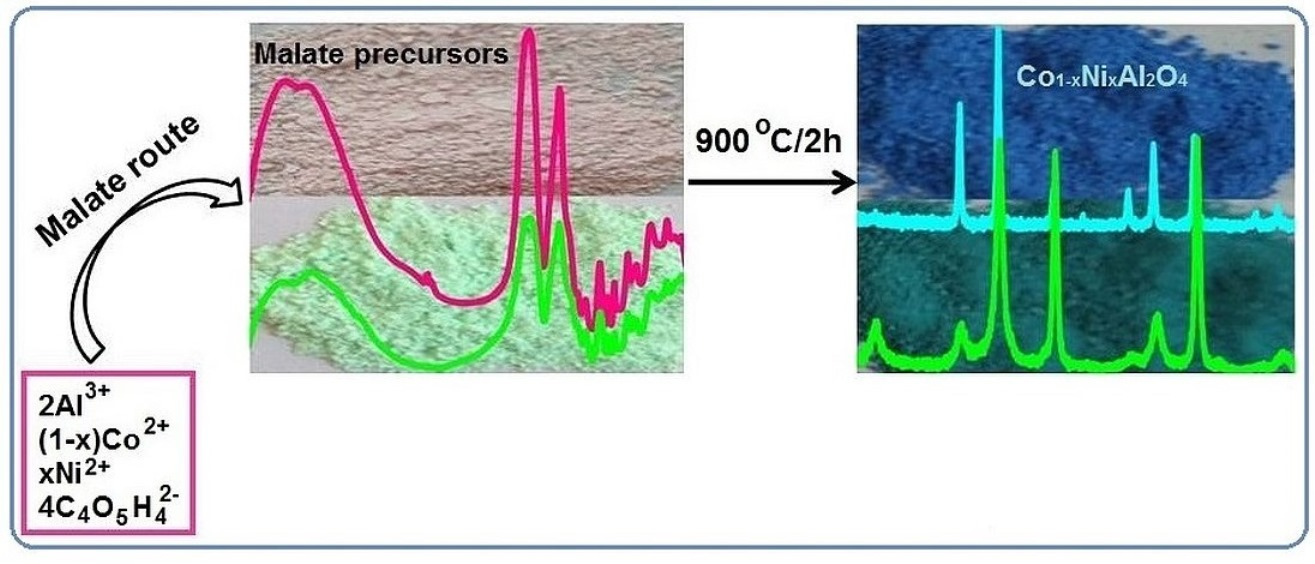
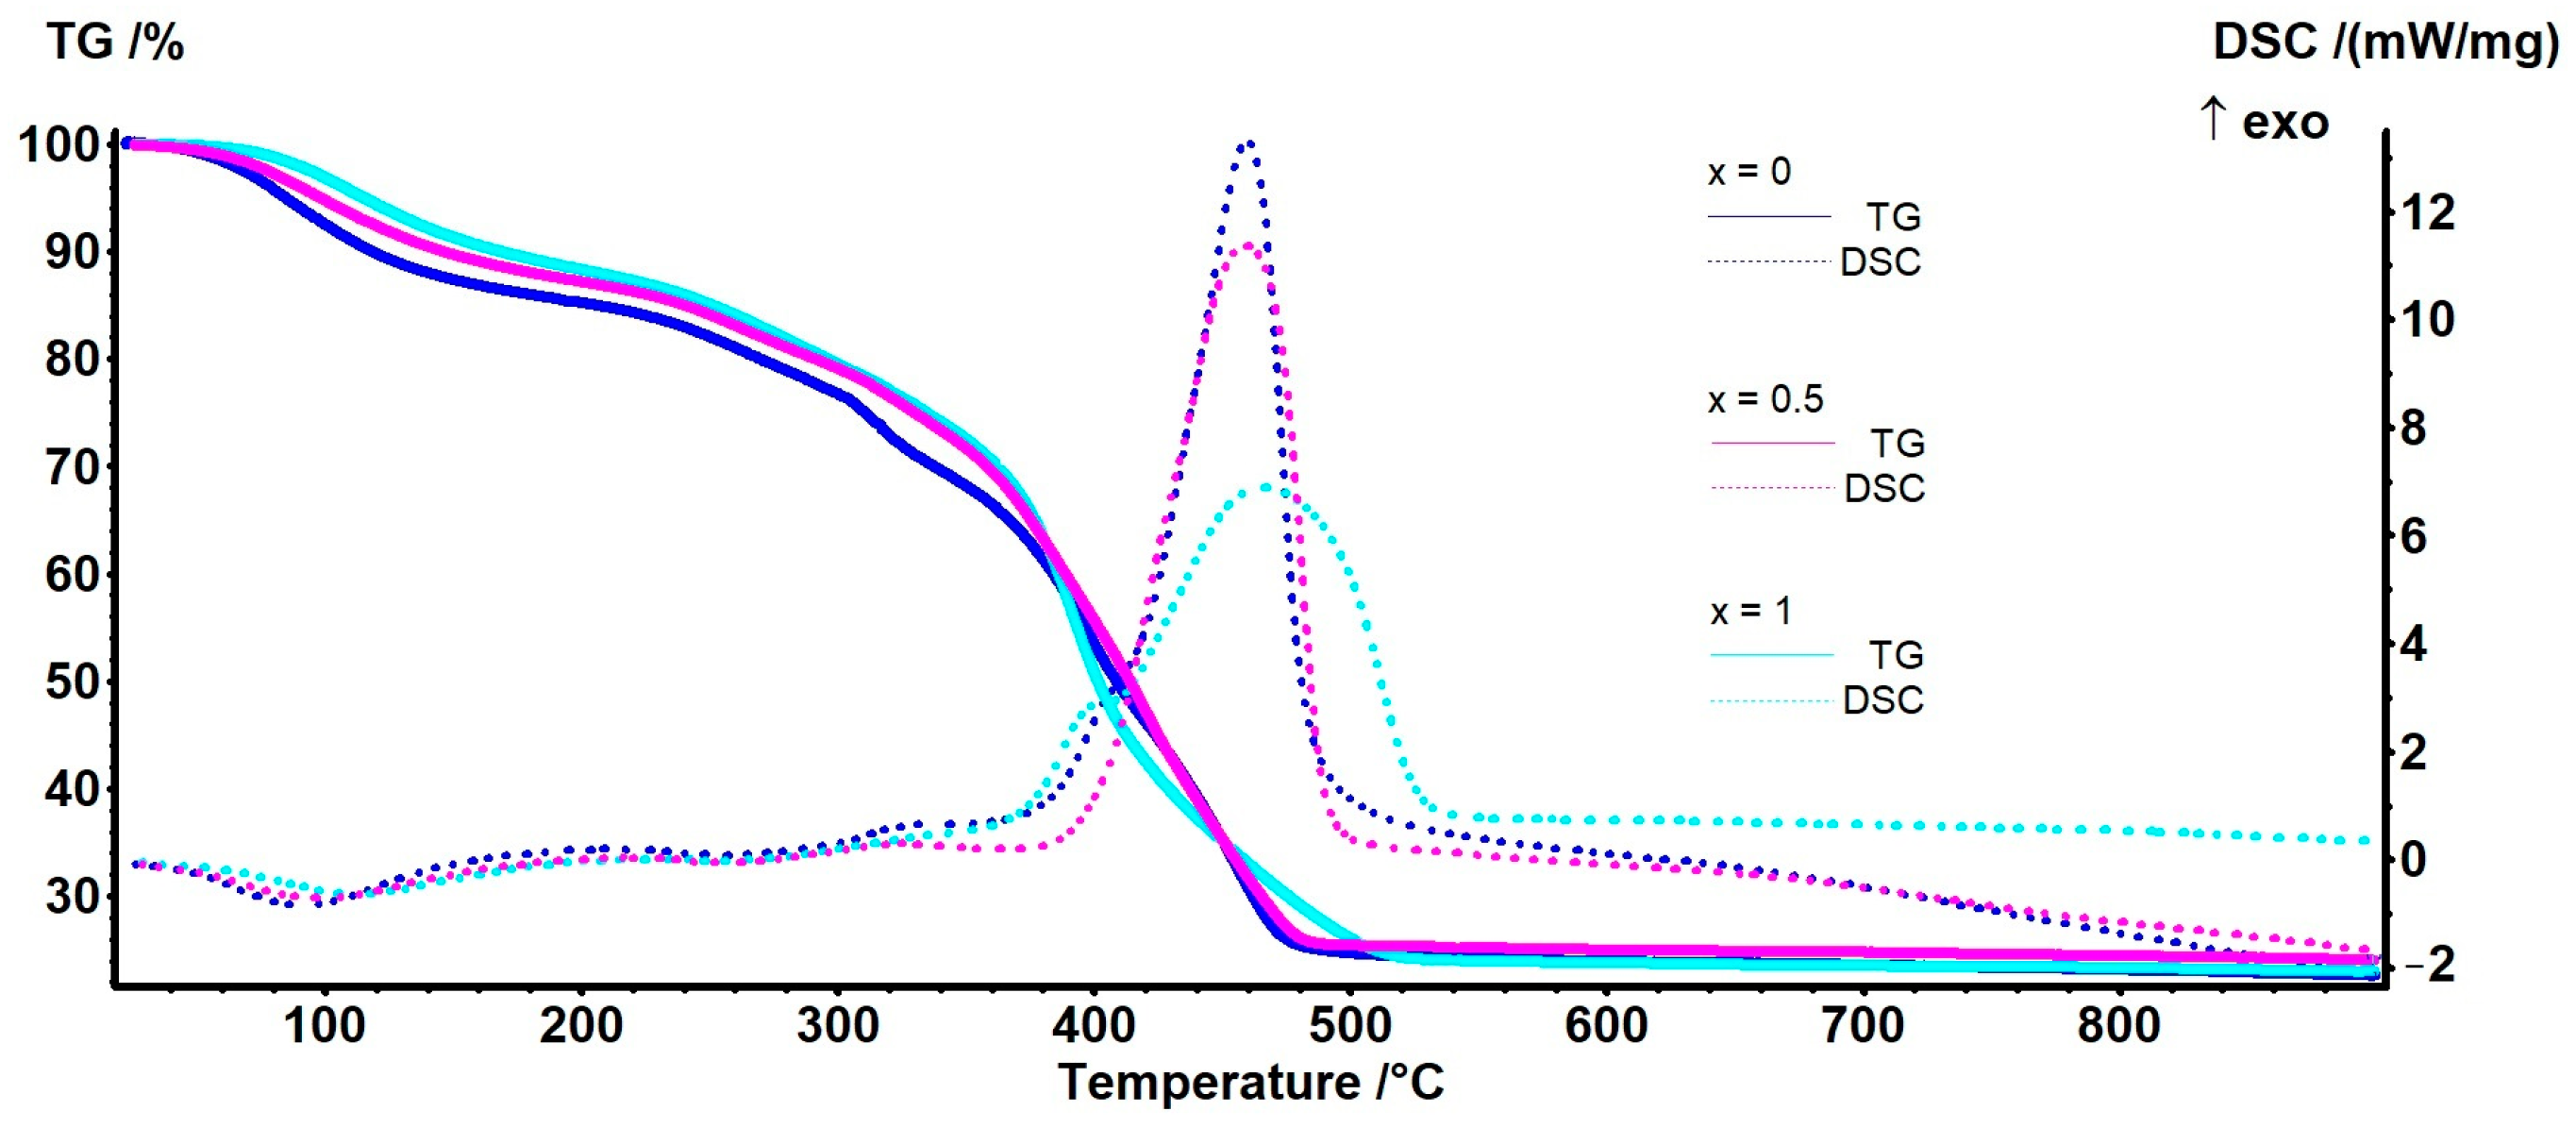
2.1. Characterization of the Malate Precursors

The synthesized polynuclear complex compounds (malate precursors) were characterized by FTIR and UV–Vis–NIR spectroscopy and thermal analysis.
In order to obtain data about the coordination mode of the malate ligand to the metal ions, the FTIR spectra were recorded and depicted in Figure 1.
Some observations emerge from the examination of these FTIR spectra. In the region of 3500–3000 cm˗1, a very intense and broad band due to water and hydrogen bonds in the network is highlighted for all complexes. The bands characteristic to the asymmetric, νasym(OCO), and symmetric, νsym(OCO), vibration frequencies of the carboxylate groups in the malate anion appear at ~1620 and ~1396 cm−1, respectively. The appearance of these two new bands and the disappearance of the band at 1721 cm−1, characteristic of the vibration frequency ν(C=O) present in the free malic acid [29], prove the coordination of the carboxylic groups to the metal ions. The presence of NO3˗ anions in the precursor-polynuclear coordination compounds is supported by the existence, in all spectra, of two bands at ~1384 cm−1 (this band is completely overlapped with that due to νsym(OCO)) (Figure 1) and ~835 cm−1. The absorption band that appears at around 1100 cm−1 is attributed to the vibration frequency of the secondary –OH group present in the malic acid anion. This band is present in the IR spectra of the complexes as a doublet form and at lower frequencies (1097, 1044 cm−1), which supports the involvement of this group in the coordination to the metal ion. According to these observations, in the precursor-polynuclear coordination compounds the ligand (malate anion) coordinates to the metal ions through both its two COO– and C–OH groups.
The absorbance spectra of the polynuclear complex compounds (malate precursors) are shown in Figure 2. The solid-state electronic spectra of the compounds (x values between 0.1 and 0.9) show the overlap of the individual chromophores of cobalt(II) and nickel(II), respectively, in an octahedral stereochemistry. The band at ~525 nm is assigned to 4T1g4T1g(P) (ν3) transition of the Co2+ (d7) high spin ion in an octahedral configuration [19,30]. The bands at ~400 and 670 nm, are assigned to the 3A2g3T1g(P) (ν3) and 3A2g3T1g(F) (ν2) transitions, of the hexacoordinated Ni2+ (d8) ion in an octahedral environment. All UV–Vis–NIR spectra evidence a broad band between 1100 and 1400 nm due to the presence of Co2+/Ni2+ in an octahedral arrangement, ascribed to the 4T1g4T2g1) (Co2+) and 3A2g3T2g1) (Ni2+) d-d transitions. All spectra of the complexes exhibit an intense band between 200 and 400 nm that covers the bands corresponding to the ligand (π-π*, n-π*) transitions.
The optimal conditions for obtaining nickel-substituted cobalt aluminates were established through the investigation of the precursor thermal decompositions.
The thermal behavior of the precursors is presented in Figure 3. Typically, the samples went through a dehydration process up to 200 °C, with a recorded mass loss of 9.7–14.8% (Table 1). The process was accompanied by a weak endothermic effect, with a minimum in the interval 91.1–112.0 °C. Between 200 and 360 °C, a mass loss of 17.6–35.2% was recorded, corresponding to partial decomposition/oxidation of organic part. The combustion process took place between 360 and 550 °C, when a mass loss of 34.8–46.6% was recorded and a strong exothermic peak was observed at 459.4–465.9 °C. The residual mass represented 18.0–24.0%.
The principal data for the thermal analysis are presented in Table 1. While the general behavior of the samples is similar, some minor differences are observed due to dissimilar water content and multiple decomposition pathways.

2.2. Characterization of Co1−xNixAl2O4 Samples

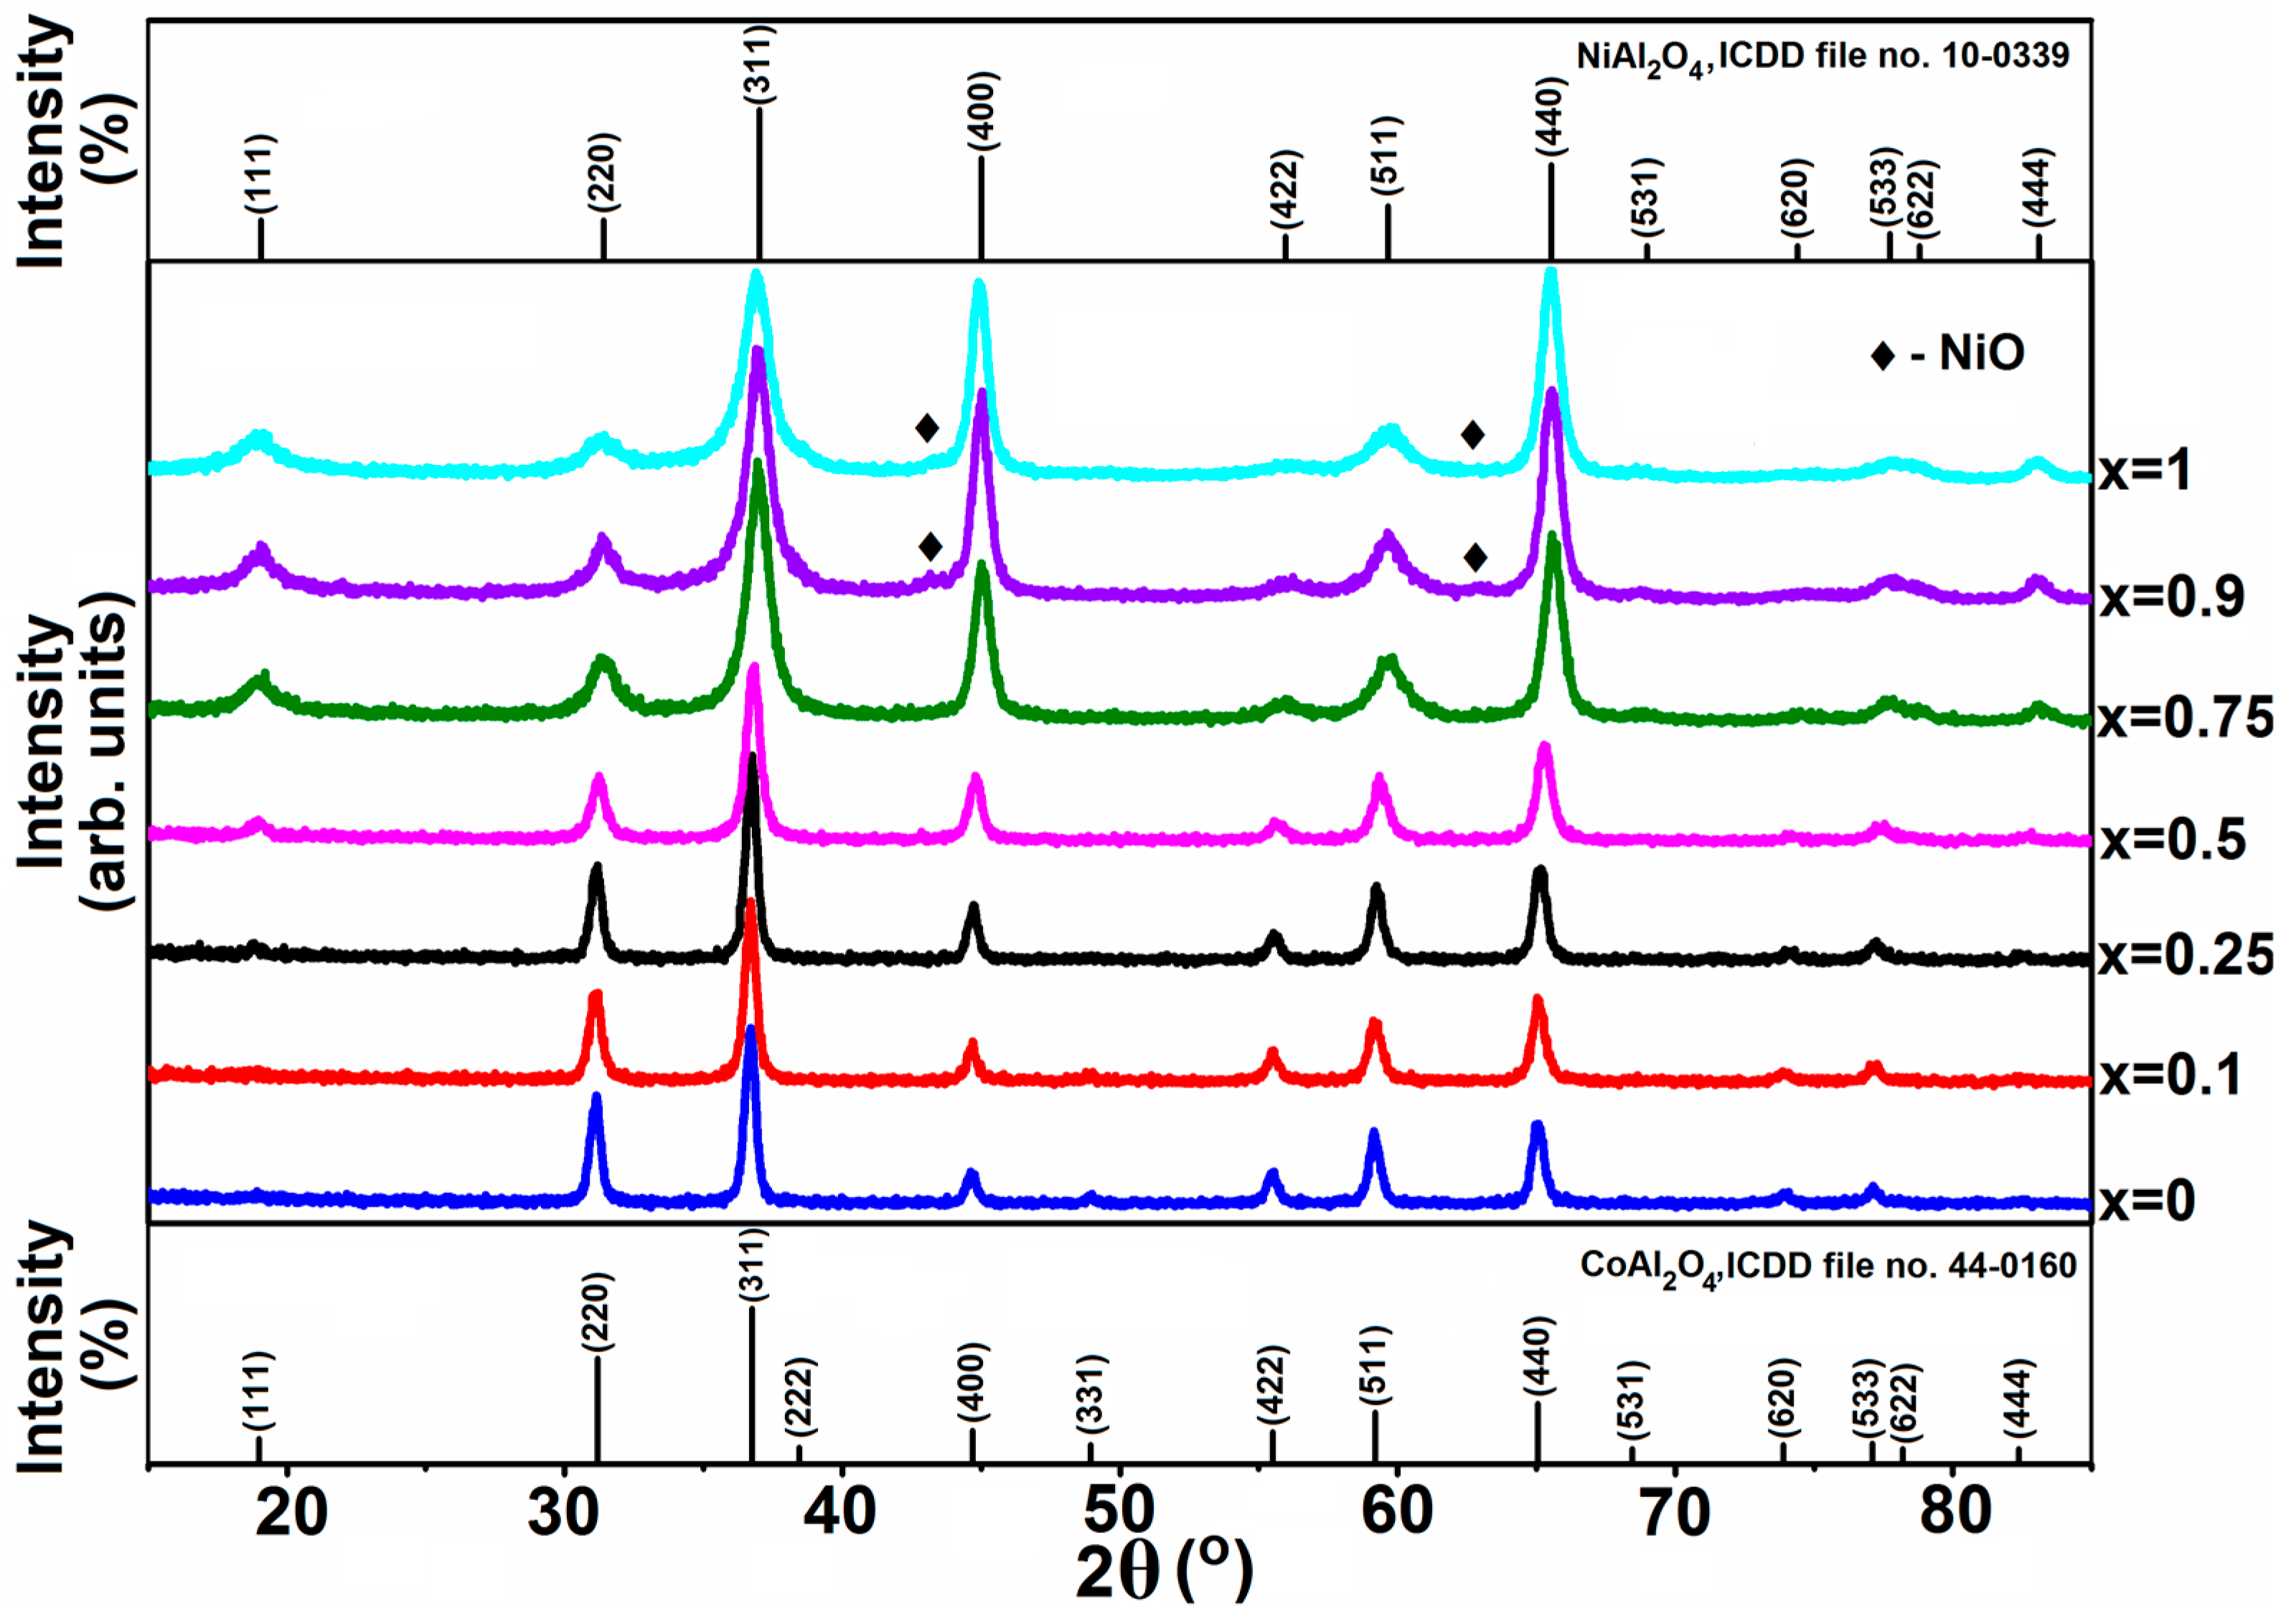
2.2.1. X-ray Diffraction

The malate precursors were thermally treated at 900 °C to obtain mixed oxide samples. The samples’ crystalline structure and phase purity (Co1−xNixAl2O4 where x = 0, 0.1, 0.25, 0.5, 0.75, 0.9 and 1) were determined using XRD. The XRD patterns are shown in Figure 4. In the samples with x ranging from 0 to 0.75, a single-phase spinel was identified in the sample composition. The phase composition of the samples with x = 0, 0.1, 0.25, and 0.5 were indexed according to ICDD file no. 44-0160 (CoAl2O4). At x = 0 and 0.1, the presence of the diffraction line at 48.76°, corresponding to the (331) crystal plane of the normal spinel, supports the presence of CoAl2O4. The diffraction line corresponding to the (331) crystal plane is no longer present for the samples with x > 0.1. A possible explanation could be the introduction of the Ni cation in the composition of samples. Nickel leads to a cation arrangement close to an inverse spinel [31]. The missing (331) crystal plane and the presence of Ni cations in the composition of CoAl2O4 could be indicators of the beginning of a conversion from a normal to an inverse spinel structure. We noticed an increase in the intensity of the diffraction lines corresponding to crystal planes (111), (400), and (440) and a decrease, respectively, of the diffraction line corresponding to crystal plane (511), from x = 0 to x = 1 which can be explained by a change in the composition of the spinel due to the introduction of nickel cations in the samples.
At x = 0.75 a single-phase NiAl2O4-based compound was identified, according to ICDD file no. 10-0339. The last two members of the series, the samples with x = 0.9 and x = 1, show similar patterns, with spinel NiAl2O4 and bunsenite, NiO, as identified phases. For samples with x > 0.75, the (400) and (440) crystal planes of the NiAl2O4 phase do not precisely conform to the ICDD standard in terms of their relative intensities and full width at half maximum (FWHM). This inconsistency in the relative intensities of the lines could be attributed to impurities like NiO, as well as to preferred growth along specific crystal directions [32]. The presence of NiO is also mentioned in the case of NiAl2O4 obtained by co-precipitation method and calcination at 800 °C [14].
The mean crystallite size (Table 2) remains constant for the samples with x = 0.1 and x = 0.25, with a value around 16 nm, and relatively close to the value of the sample with x = 0 (18 nm) As the quantity of nickel increases, the size of the crystallites decreases, which can also be observed from the broadening of the diffraction lines.
The Rietveld method was used to refine the crystal structures in the CoAl2O4–NiAl2O4 system. The structure of the spinels was refined with allowance for a possible cation distribution over the tetrahedral and octahedral sites, starting with the cations’ molar ratios as occupancies. The lattice constant and the crystallite size are listed in Table 2 and the oxygen occupancy and the degree of inversion are shown in Table 3. Based on these parameters, more structural parameters were calculated, using the Equations (1)–(9) listed in the Section 3.
According to our results, the degree of inversion, γ, increases, as expected, with increasing the Ni content. The parameters a and u determine the bond distances, including the average cation–oxygen bond distances, as listed in Table 3. The data demonstrate that, with increasing the Co content, the tetrahedral sites lengths diverge from the octahedral ones, which is due to the changes in the degree of inversion, determined by the larger divalent ion radius of Ni. Co has a preference for the tetrahedral site, and Ni for the octahedral site, so it is reasonable to assume that almost all of the tetrahedral sites corresponding to A are occupied by Co and Ni replaced Al in octahedral sites. Based on the UV–Vis and Raman data (Section 2.2.4 and Section 2.2.5), Ni was also found in tetrahedral coordination for intermediate molar contents, not octahedral only, leading to random cation distribution in the spinels, rather than normal or inverse spinel distribution, as the end members, CoAl2O4 or NiAl2O4, respectively.
The switch of cobalt and nickel ions from tetrahedral to octahedral environment, and the inverse transition for aluminum ions, leads to geometrical changes in the unit cell volume and significant effects on the oxygen positional parameter.
As a comparison with our results, Table 4 includes values of the lattice parameter and the crystallite size reported in the literature for similar aluminates.

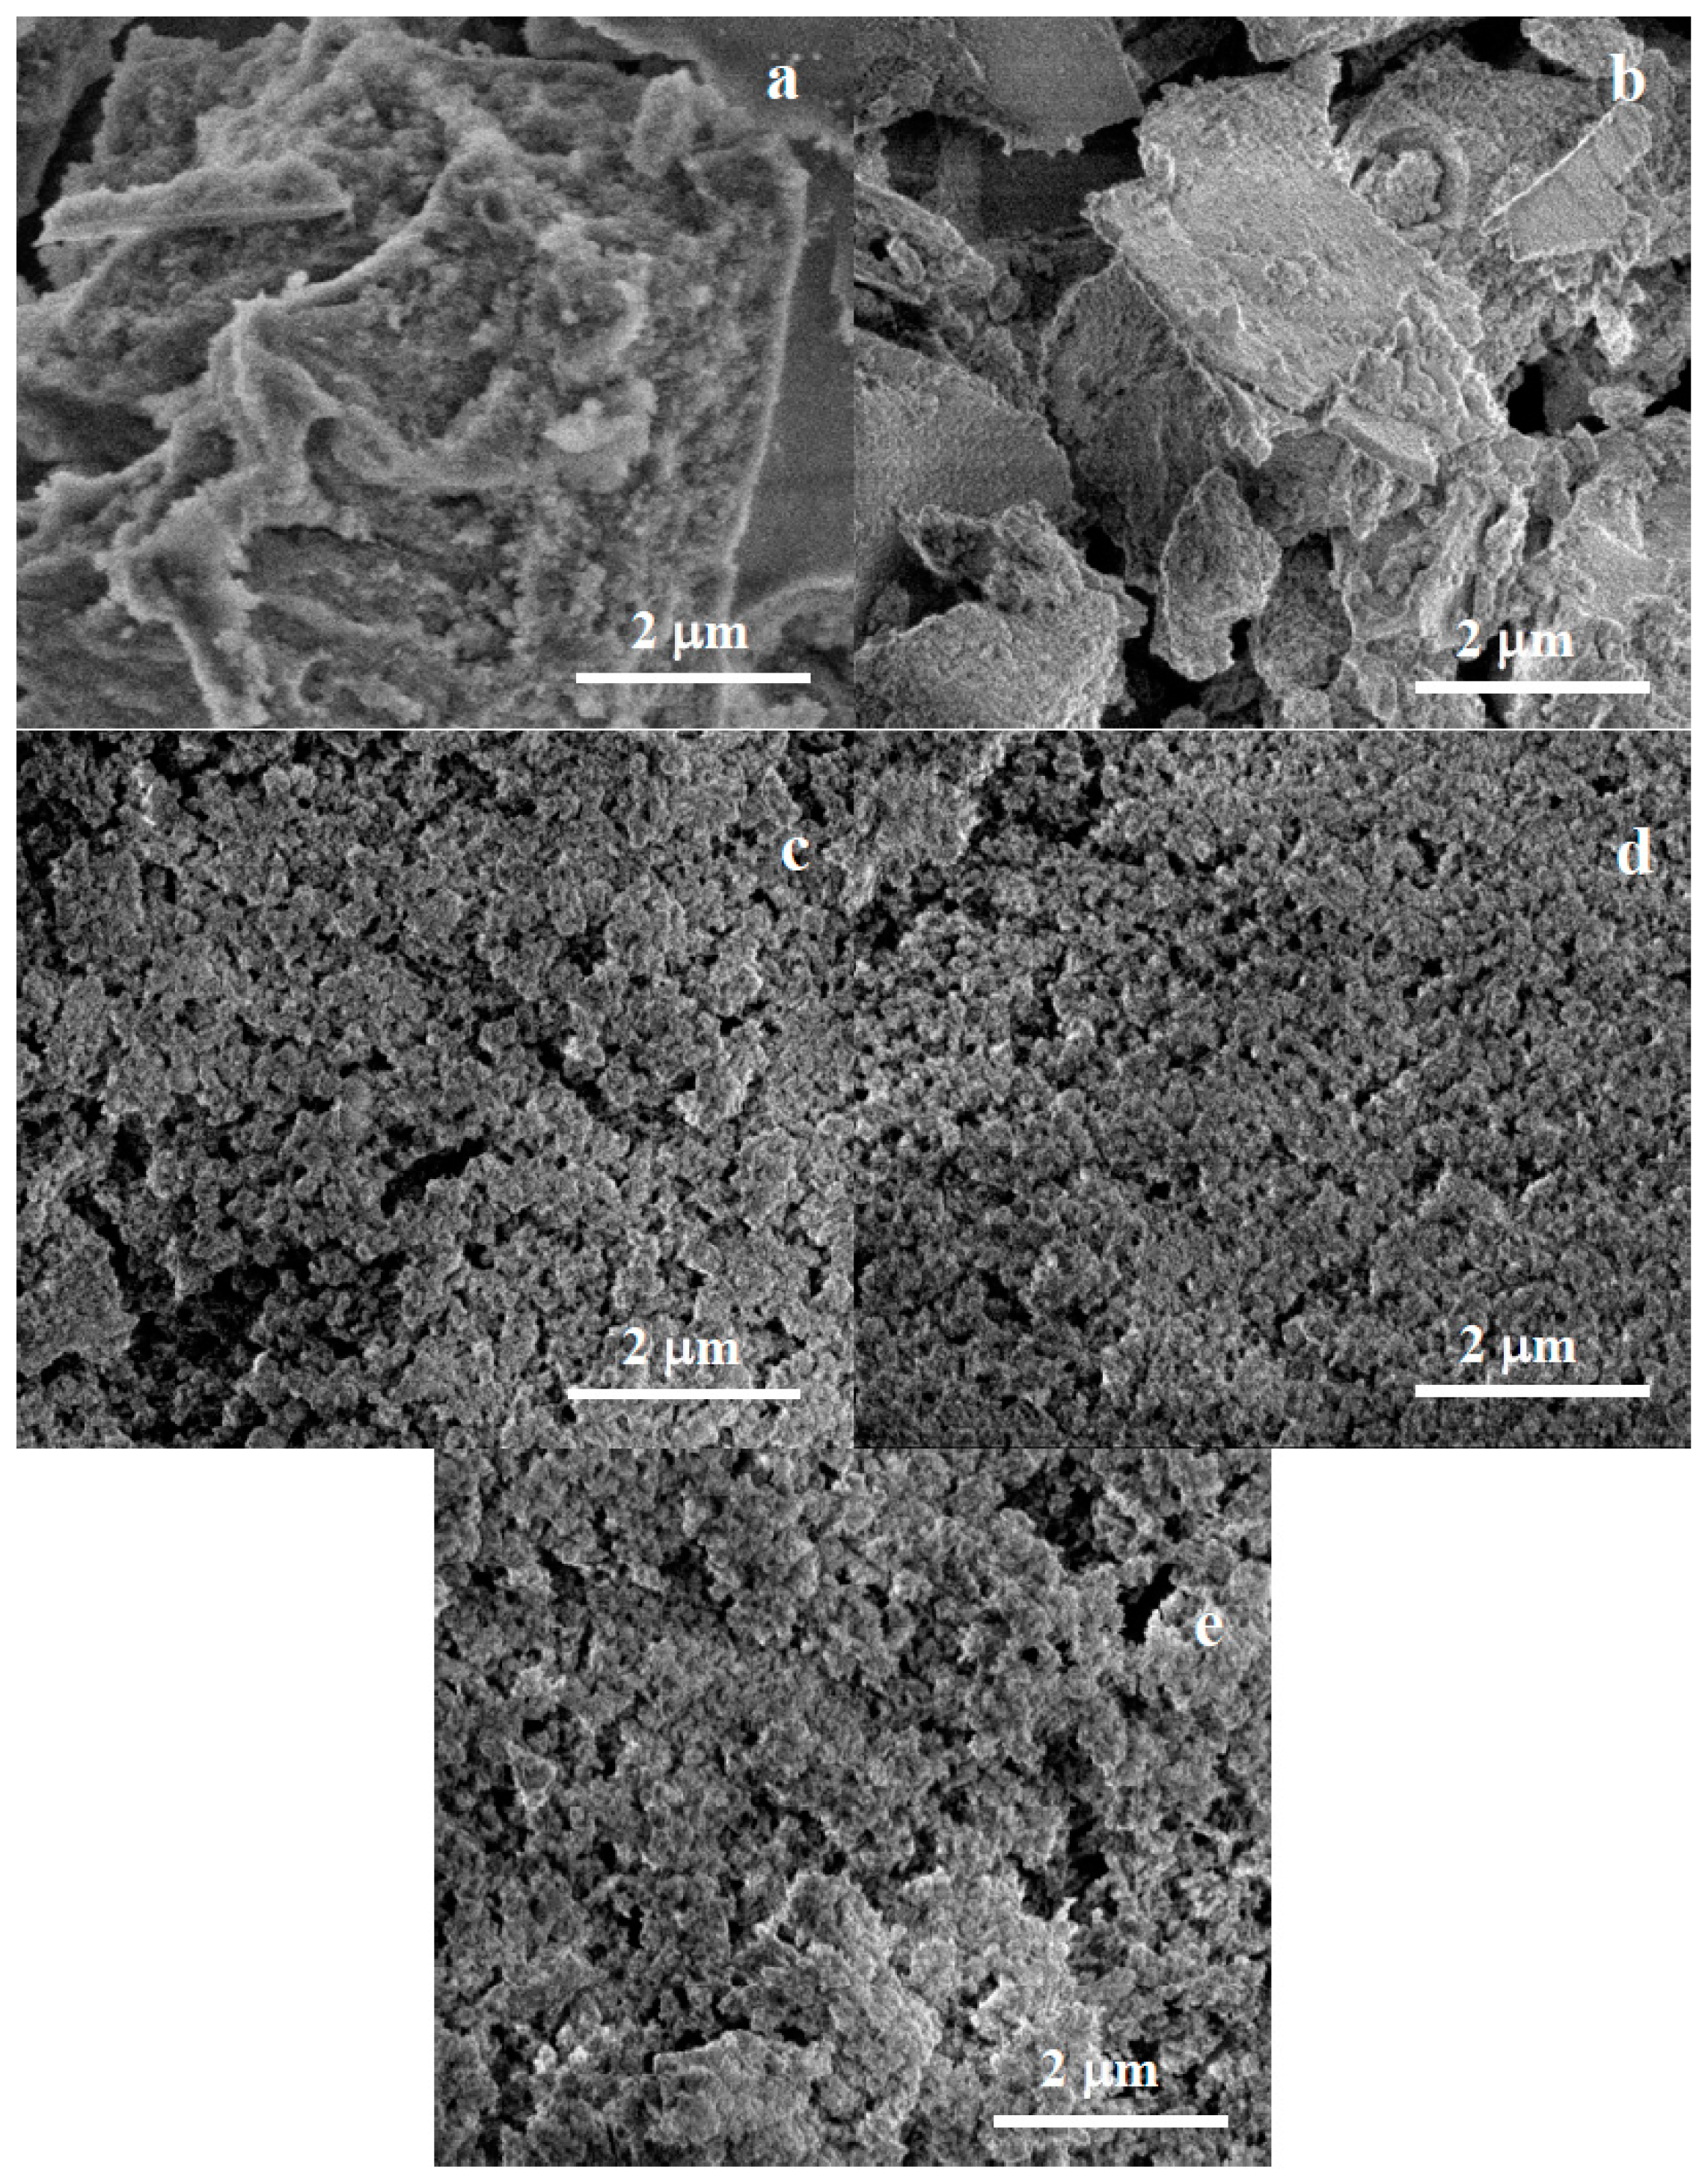
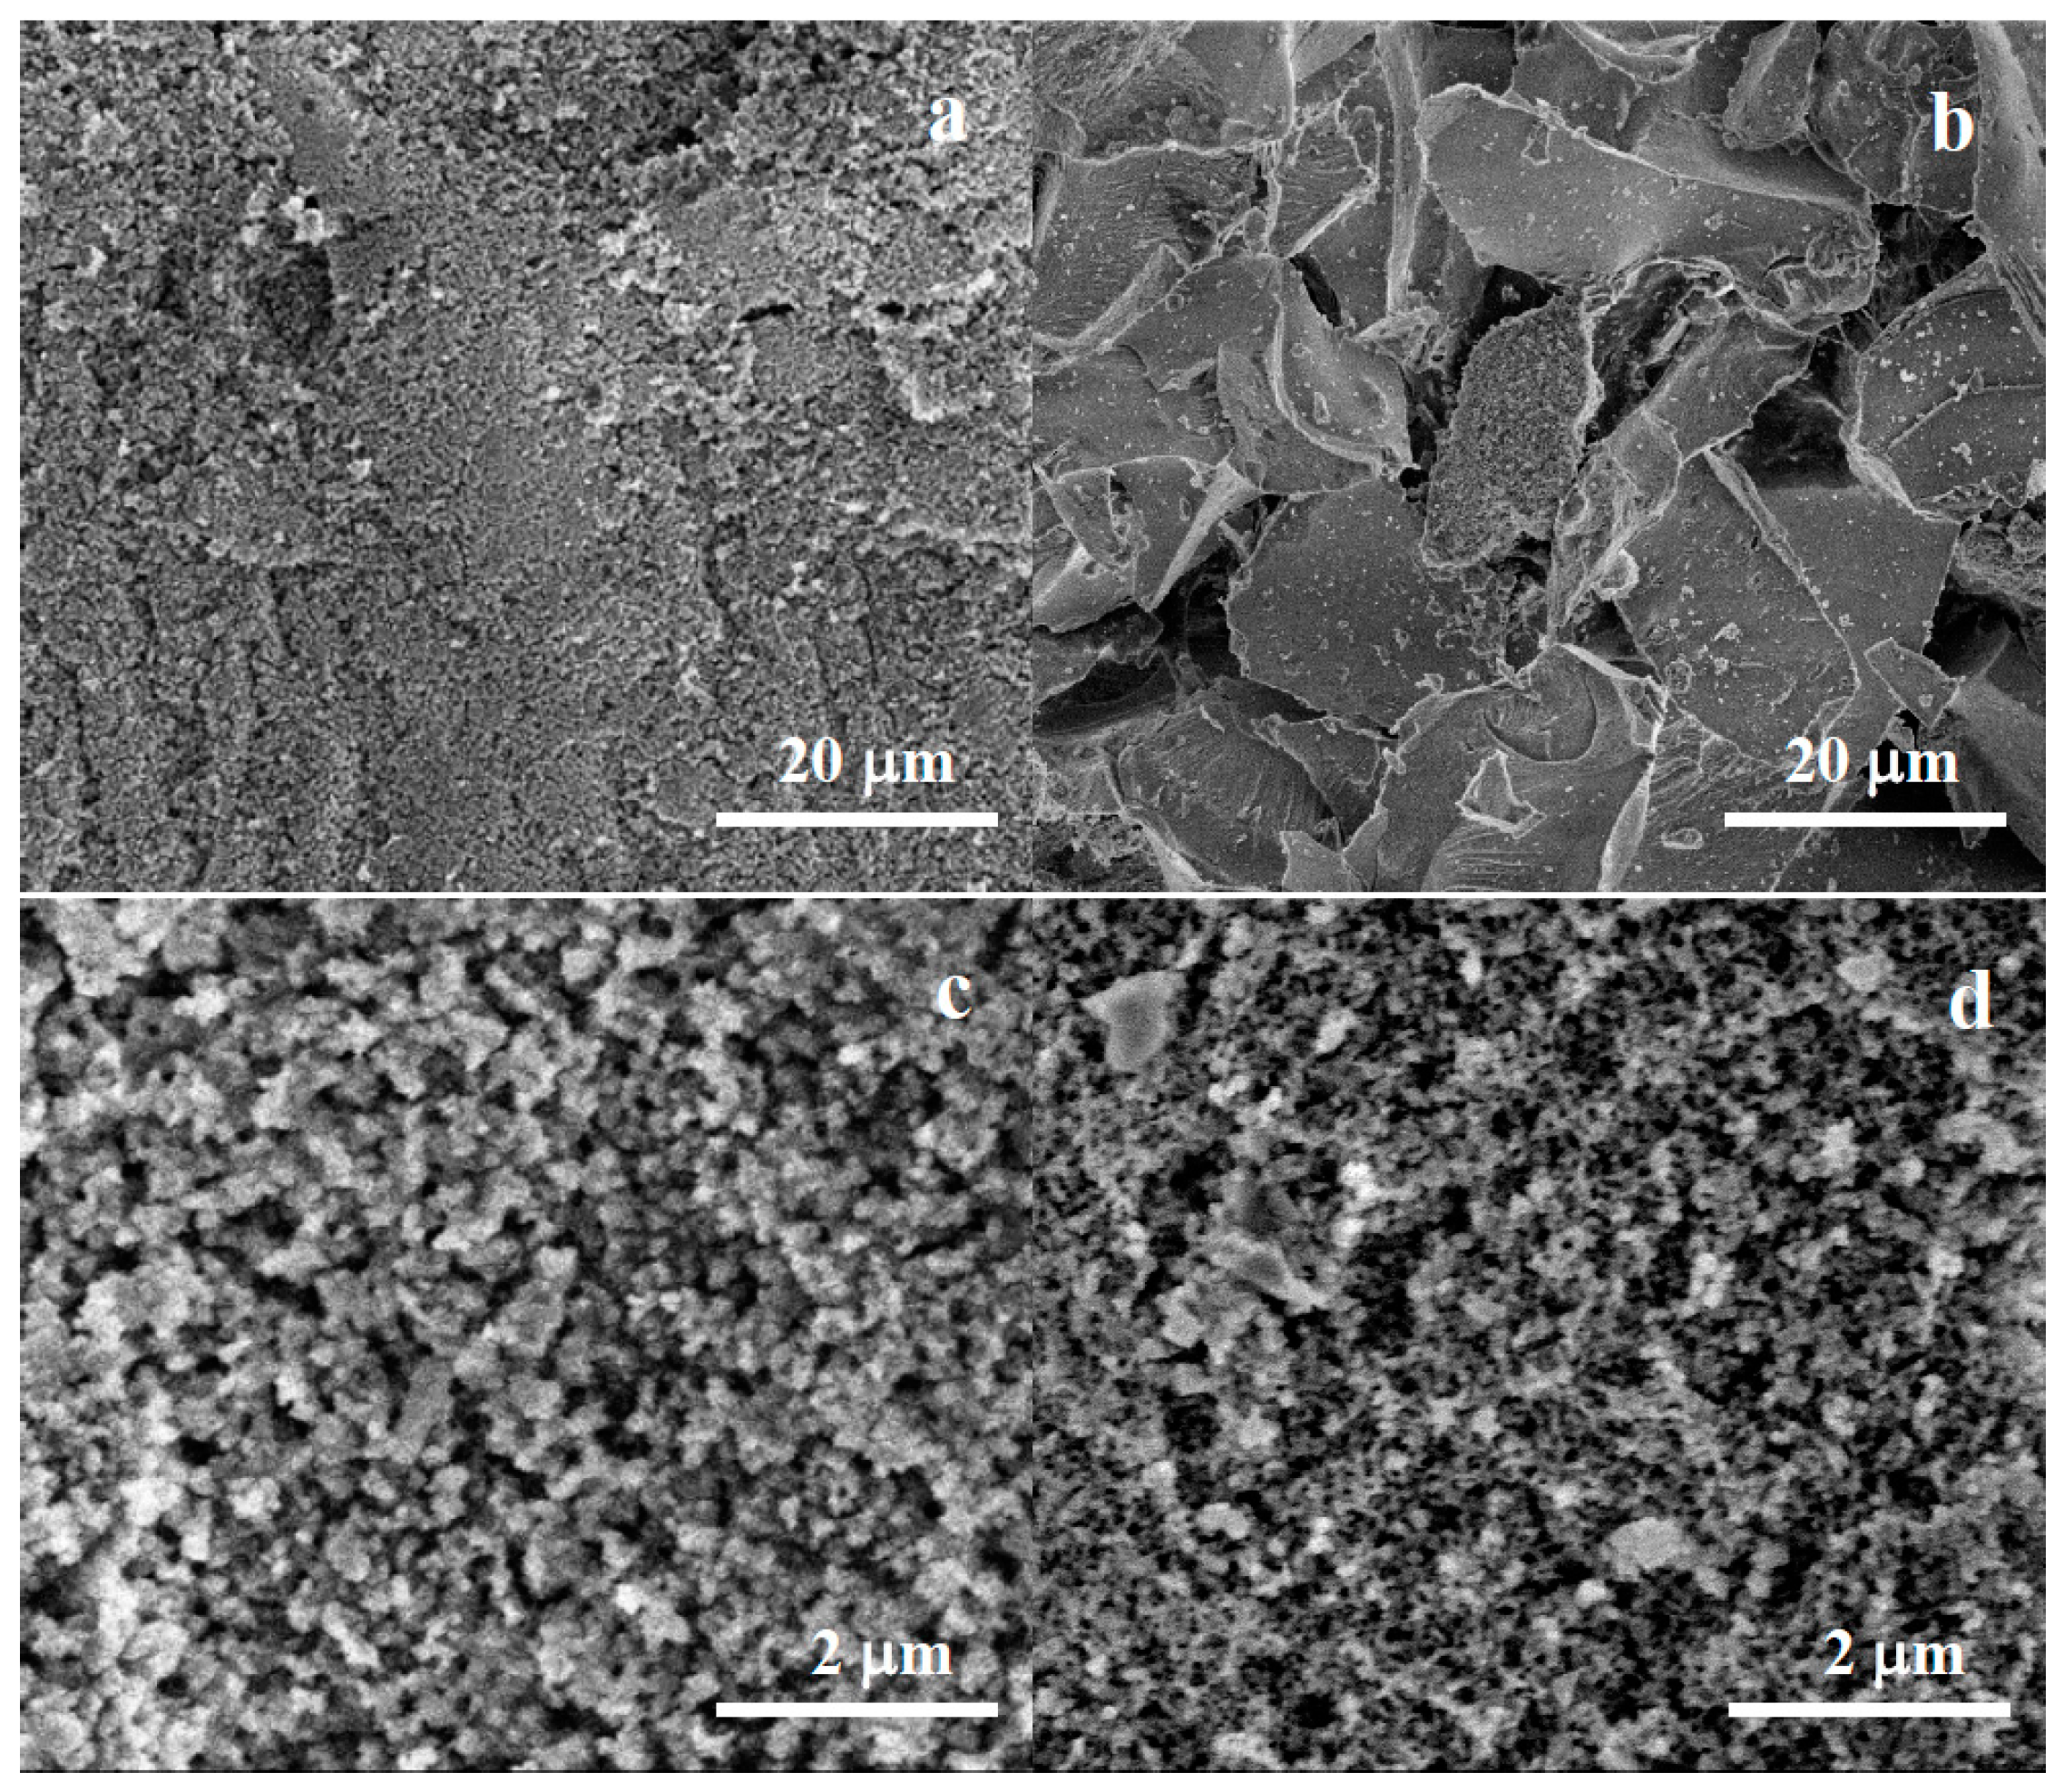
2.2.2. Scanning Electron Microscopy

The surface morphology and microstructure of the ceramic powders were examined using SEM. Figure 5 shows SEM micrographs of both end members of the (CoNi)Al2O4 system, CoAl2O4 (Figure 5a,c) and NiAl2O4 (Figure 5b,d). The micrographs at various magnifications reveal important structural features. At the lower magnification (4000×, Figure 5a,b), SEM images provide an overall view of the powders, showcasing a very different degree of agglomeration: hard aggregates in the tens of microns for CoAl2O4 (Figure 5a) and loosely aggregated powders in the case of NiAl2O4 (Figure 5b). At higher magnifications (40000×, Figure 5c,d), individual grains make the ceramic aggregates distinguishable. The observed particle sizes are around one hundred nanometers, higher for CoAl2O4 (Figure 5c) and lower for NiAl2O4 powders (Figure 5d). Crystallite sizes calculated by XRD are much lower (below 20 nm), therefore the particles we observe in the images correspond to polycrystalline aggregates of nanocrystallites. These morphologies are different from those of the cobalt and nickel aluminates (spherical particles with an average size of ~480 nm) obtained through ultrasonic spray pyrolysis at 1000 °C [12].
Figure 6 shows SEM micrographs of the solid solution ceramic powders with increasing Ni content, Co1−xNixAl2O4, (x = 0.1, 0.25, 0.5, 0.75, 0.9). The images reveal changes in the size of hard agglomerates and primary aggregates, discussed in Figure 5 for the end members of the series (x = 0 and x = 1). We can observe a gradual decrease in the degree of agglomeration in terms of the sizes of the hard agglomerates, which decrease with increasing Ni content.

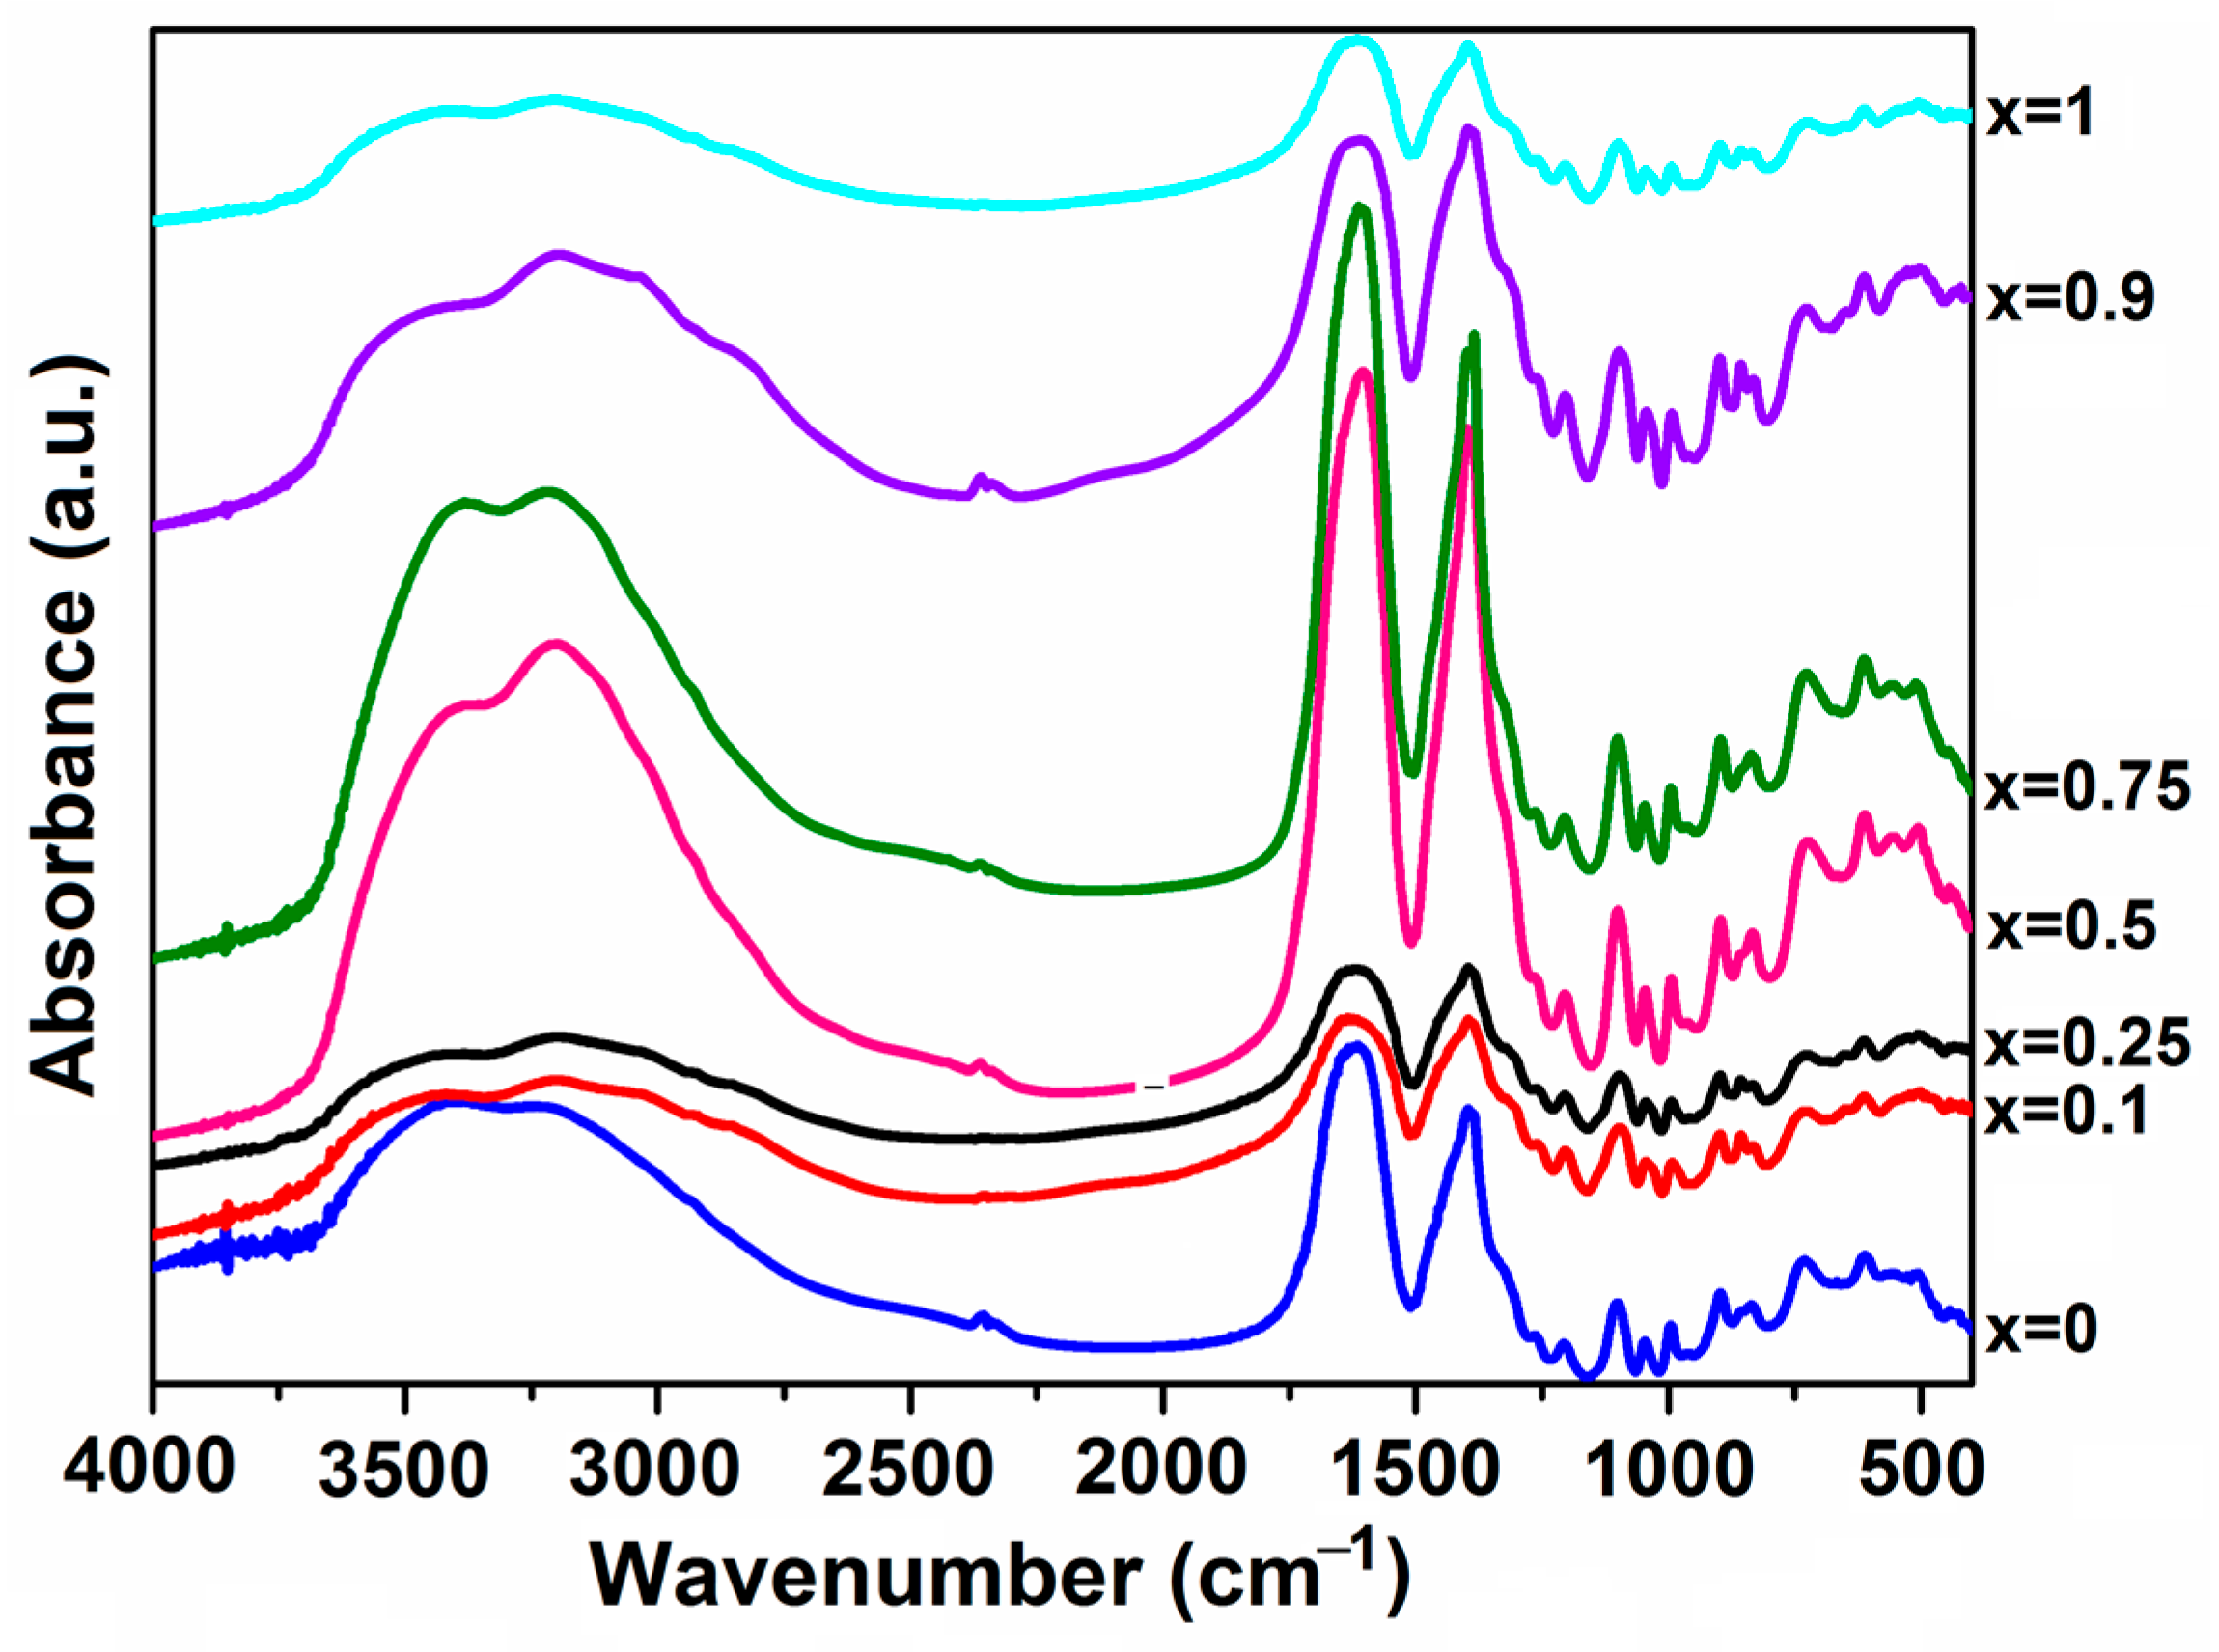
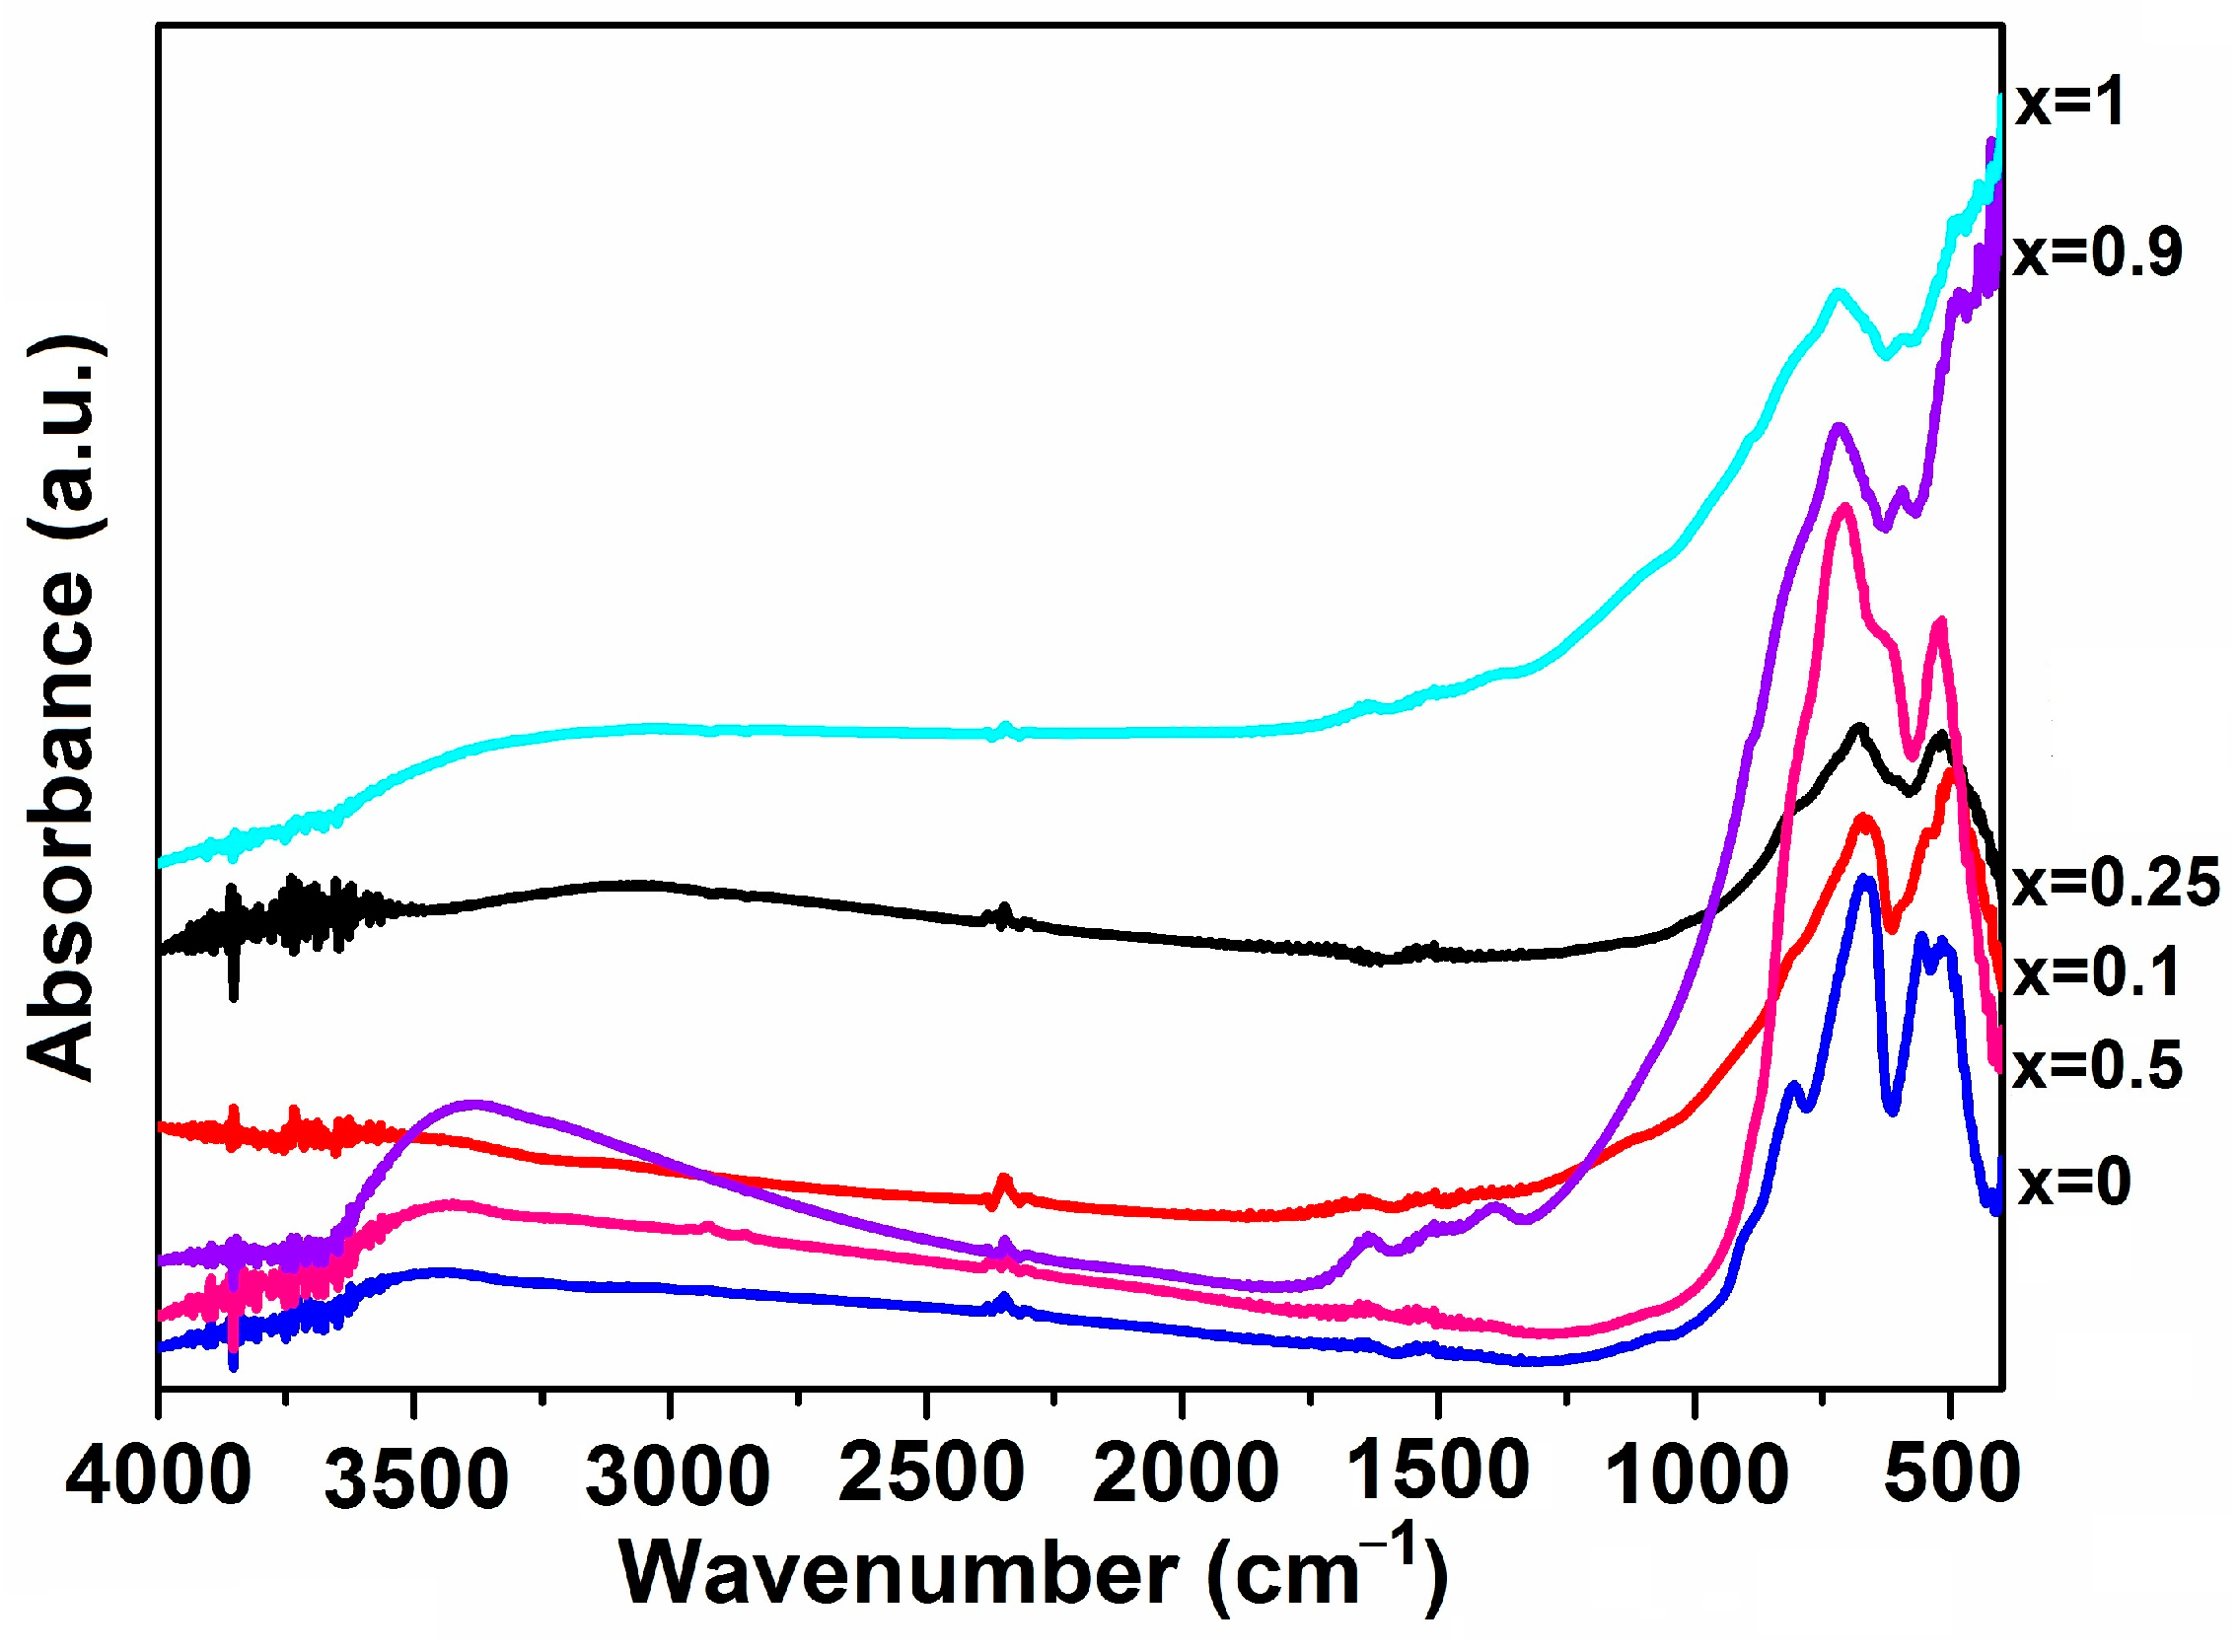
2.2.3. Infrared Spectroscopy

The analysis of the FTIR spectra (Figure 7) recorded for the Co1−xNixAl2O4 samples sustains the formation of the spinel phase by the presence of bands at: 660–730 cm−1, 545–620 cm−1, and 485–520 cm−1. These peaks correspond to the vibration modes of Co–O, Ni–O–Al, Ni–O, and Al–O bonds located in tetrahedral and octahedral environments [4,34].

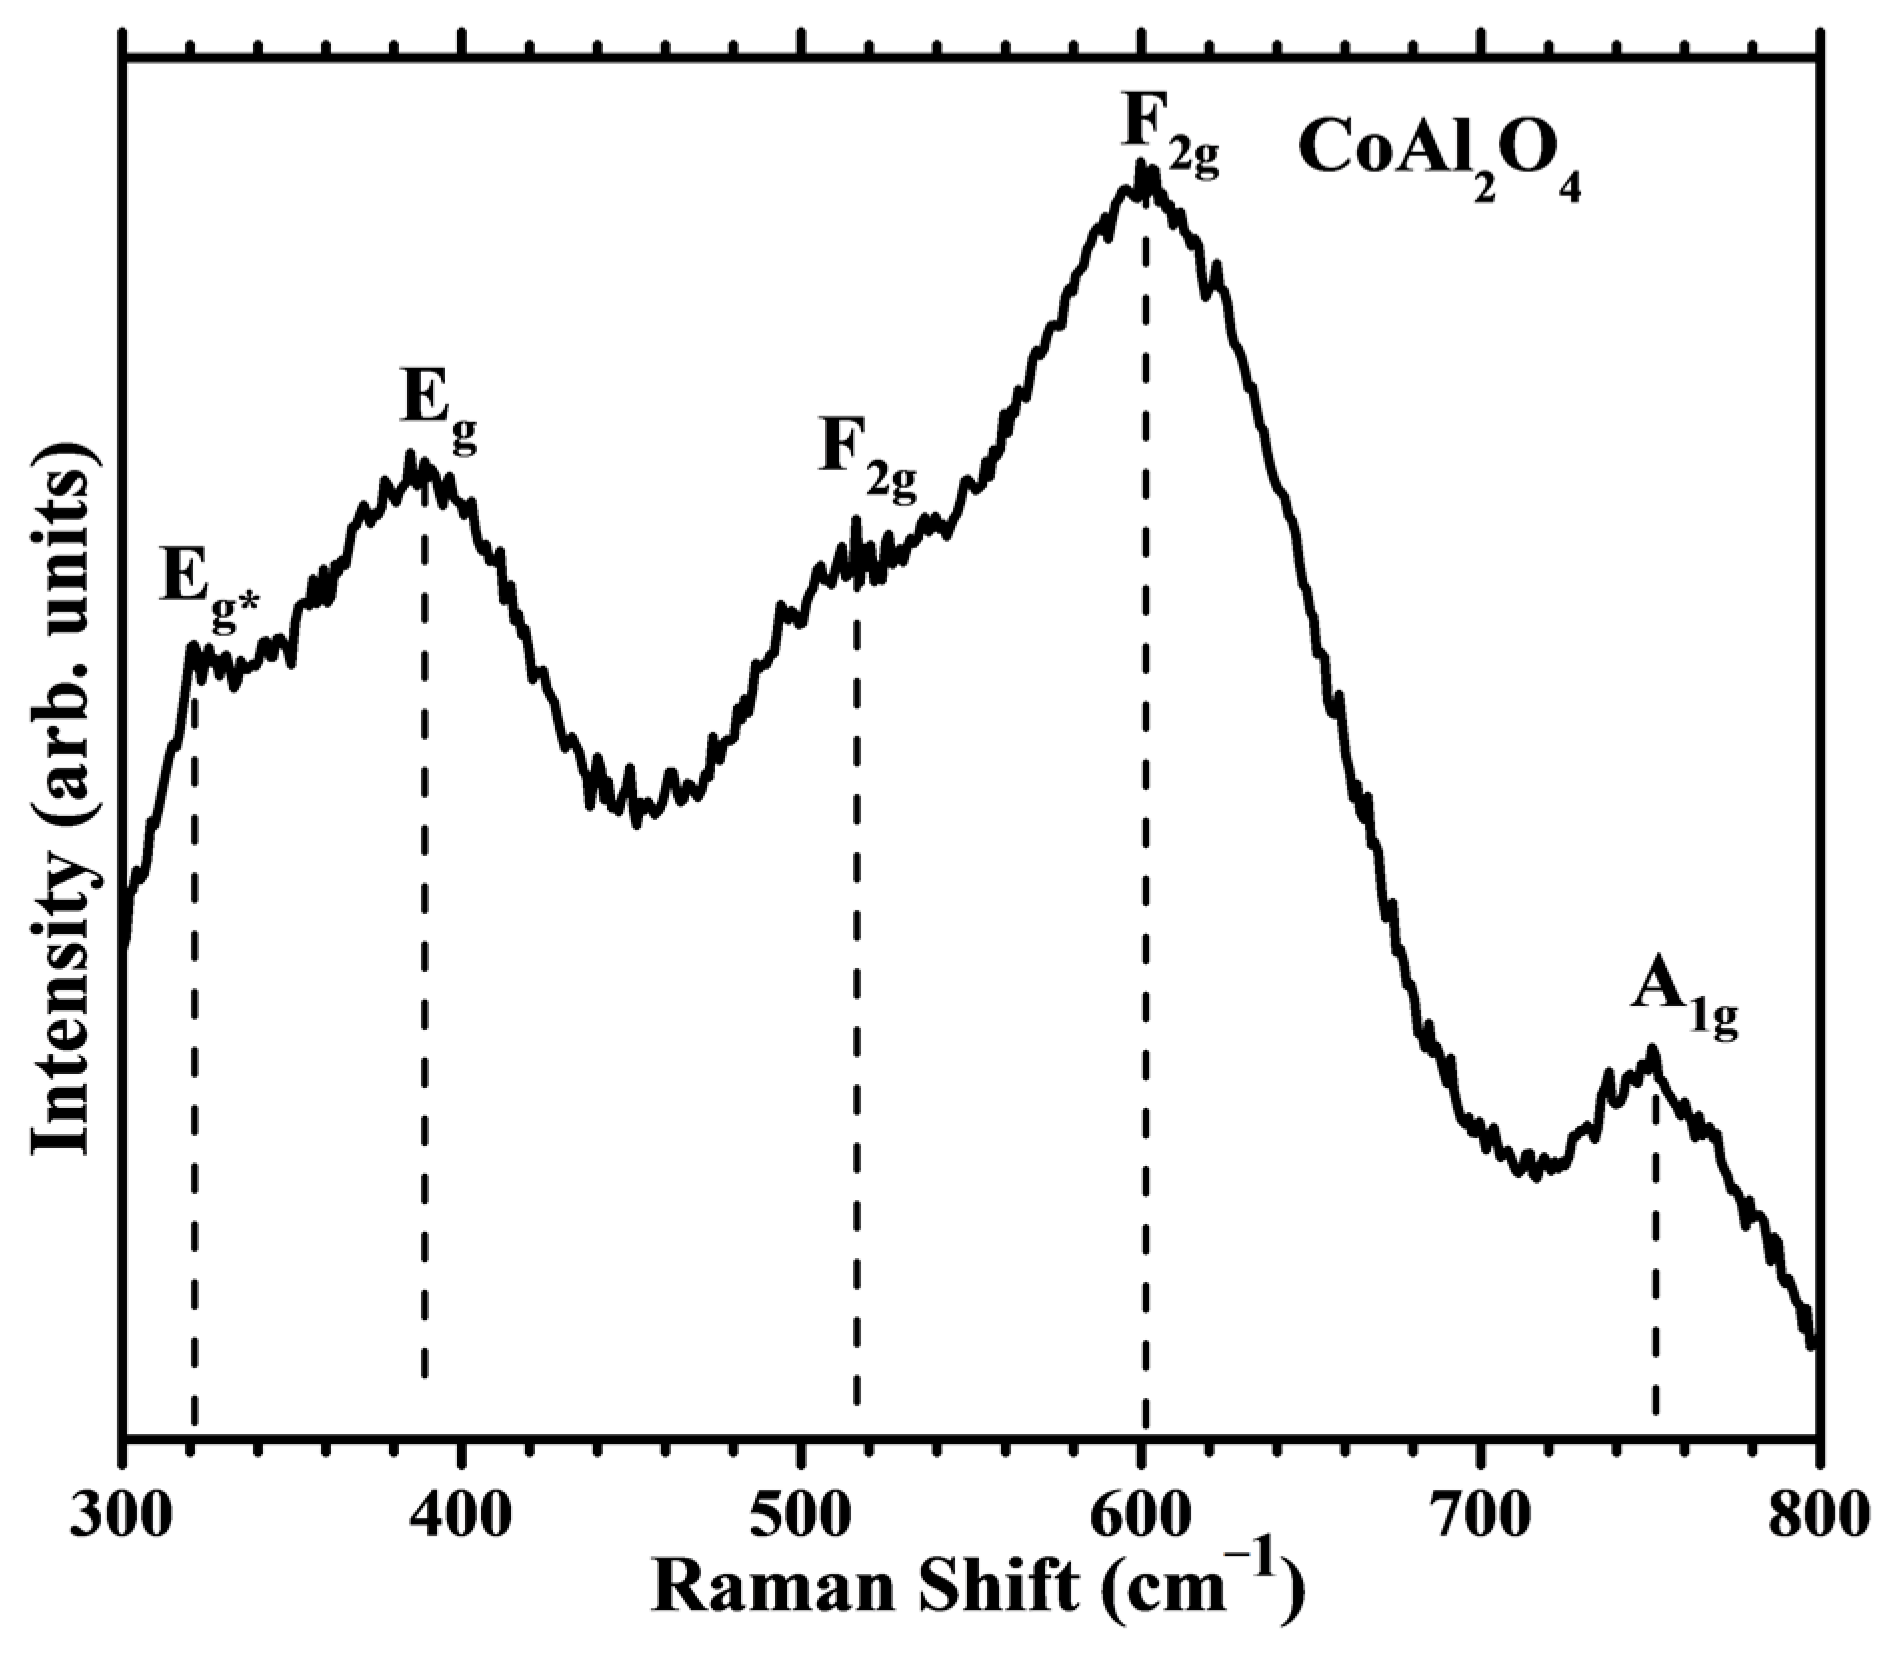
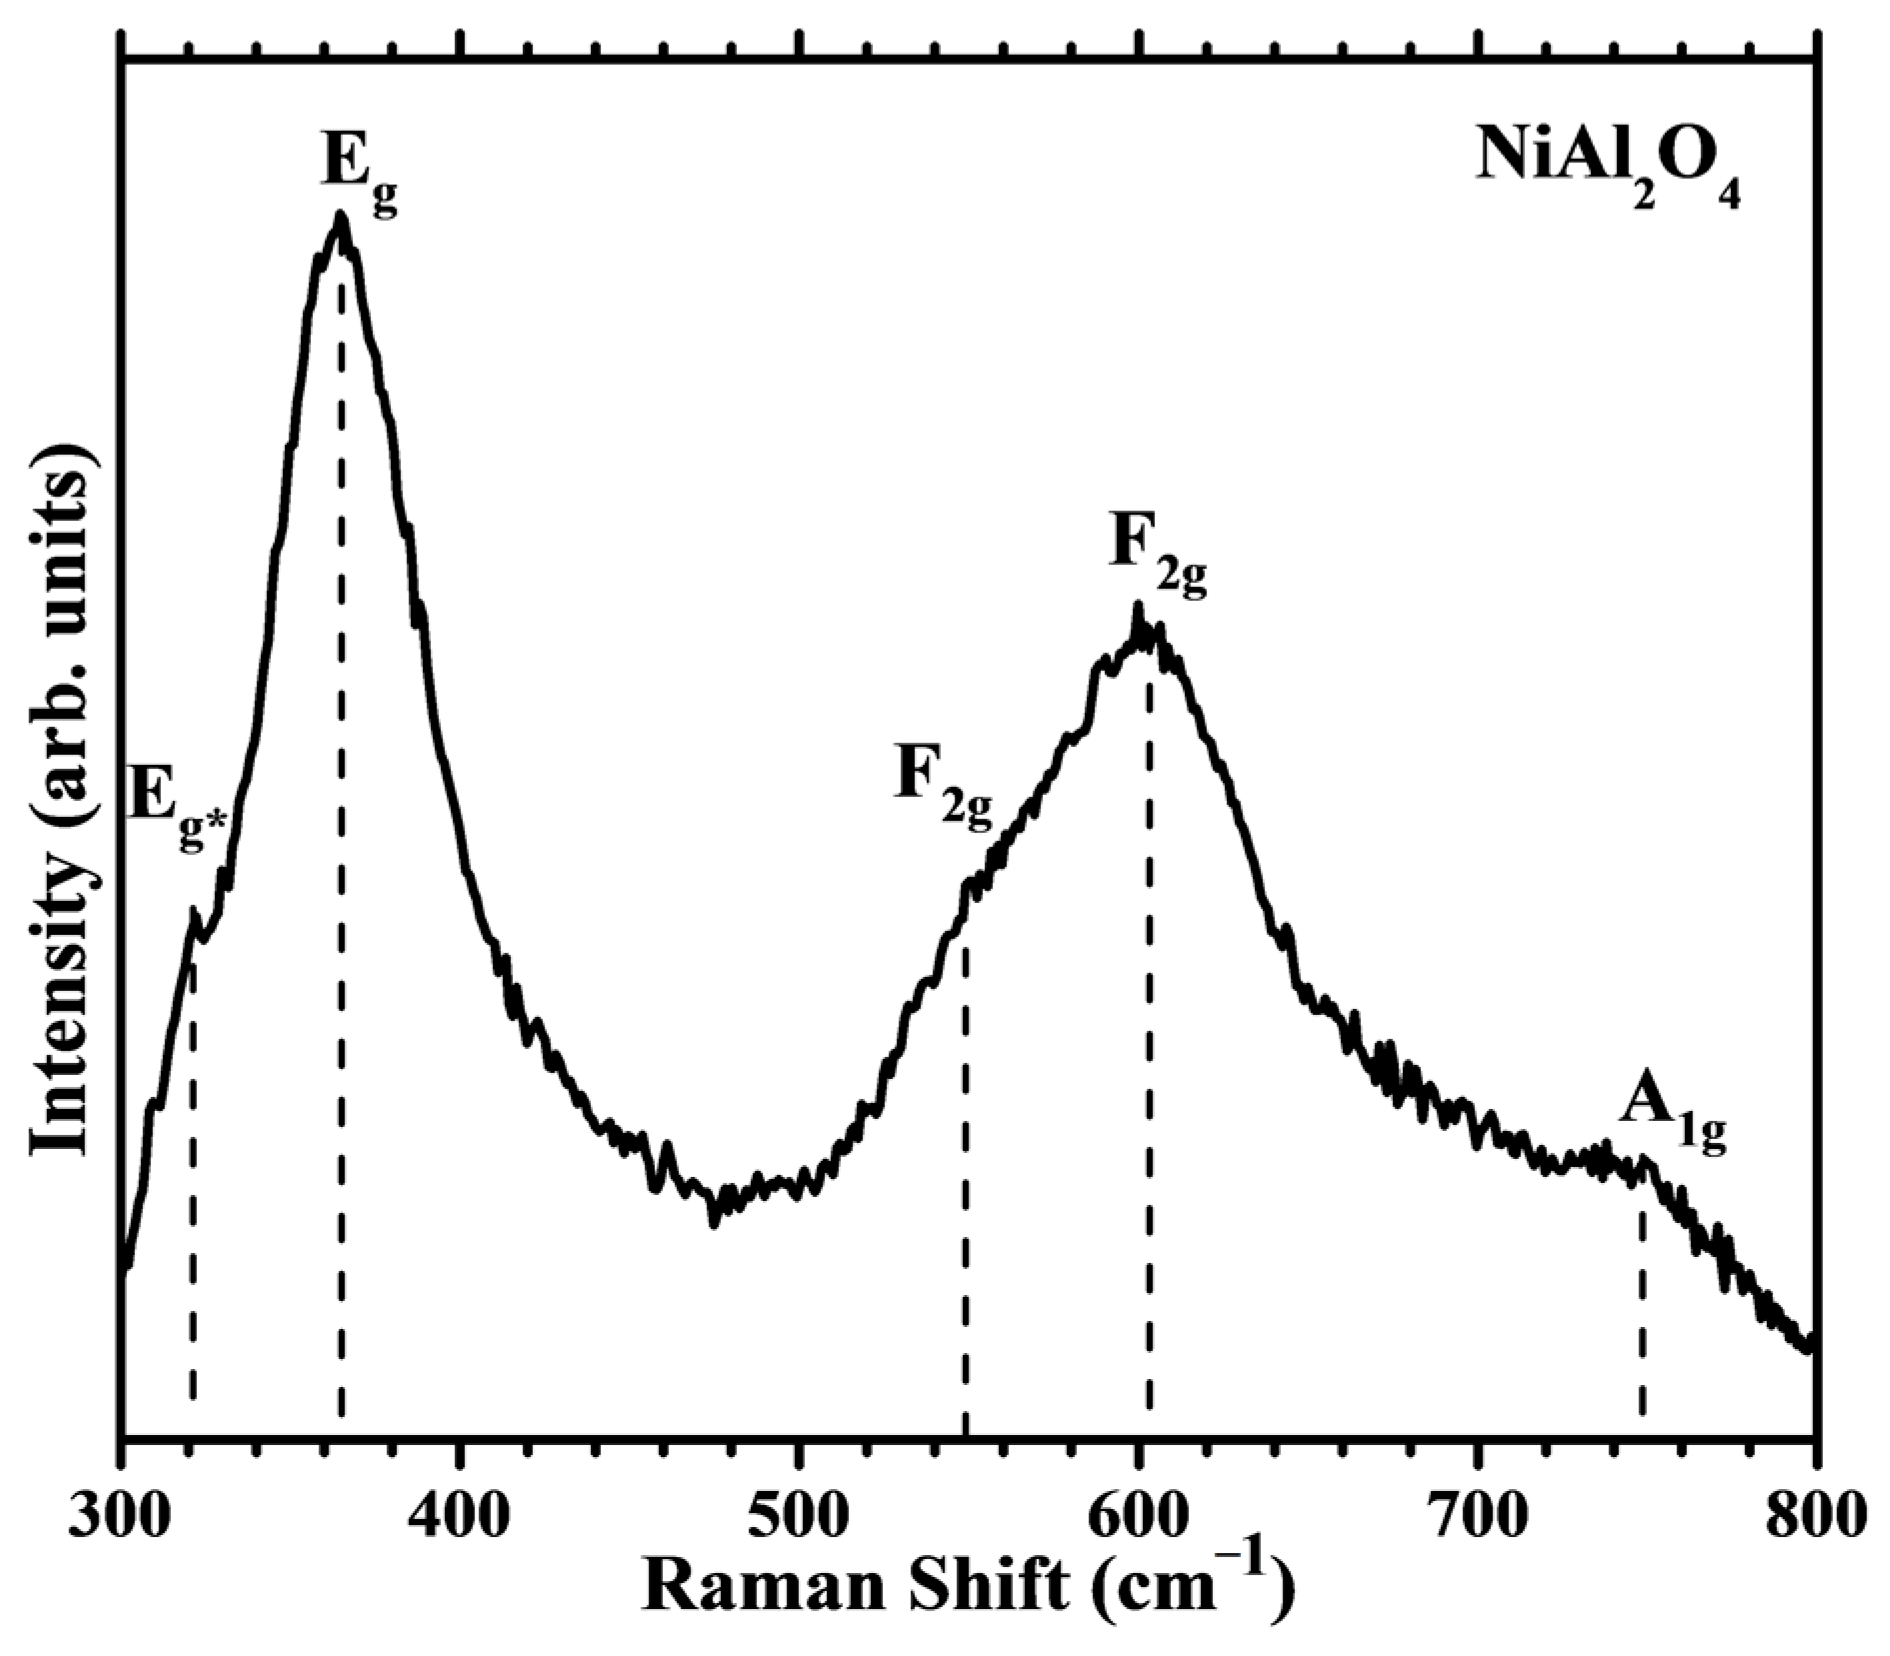
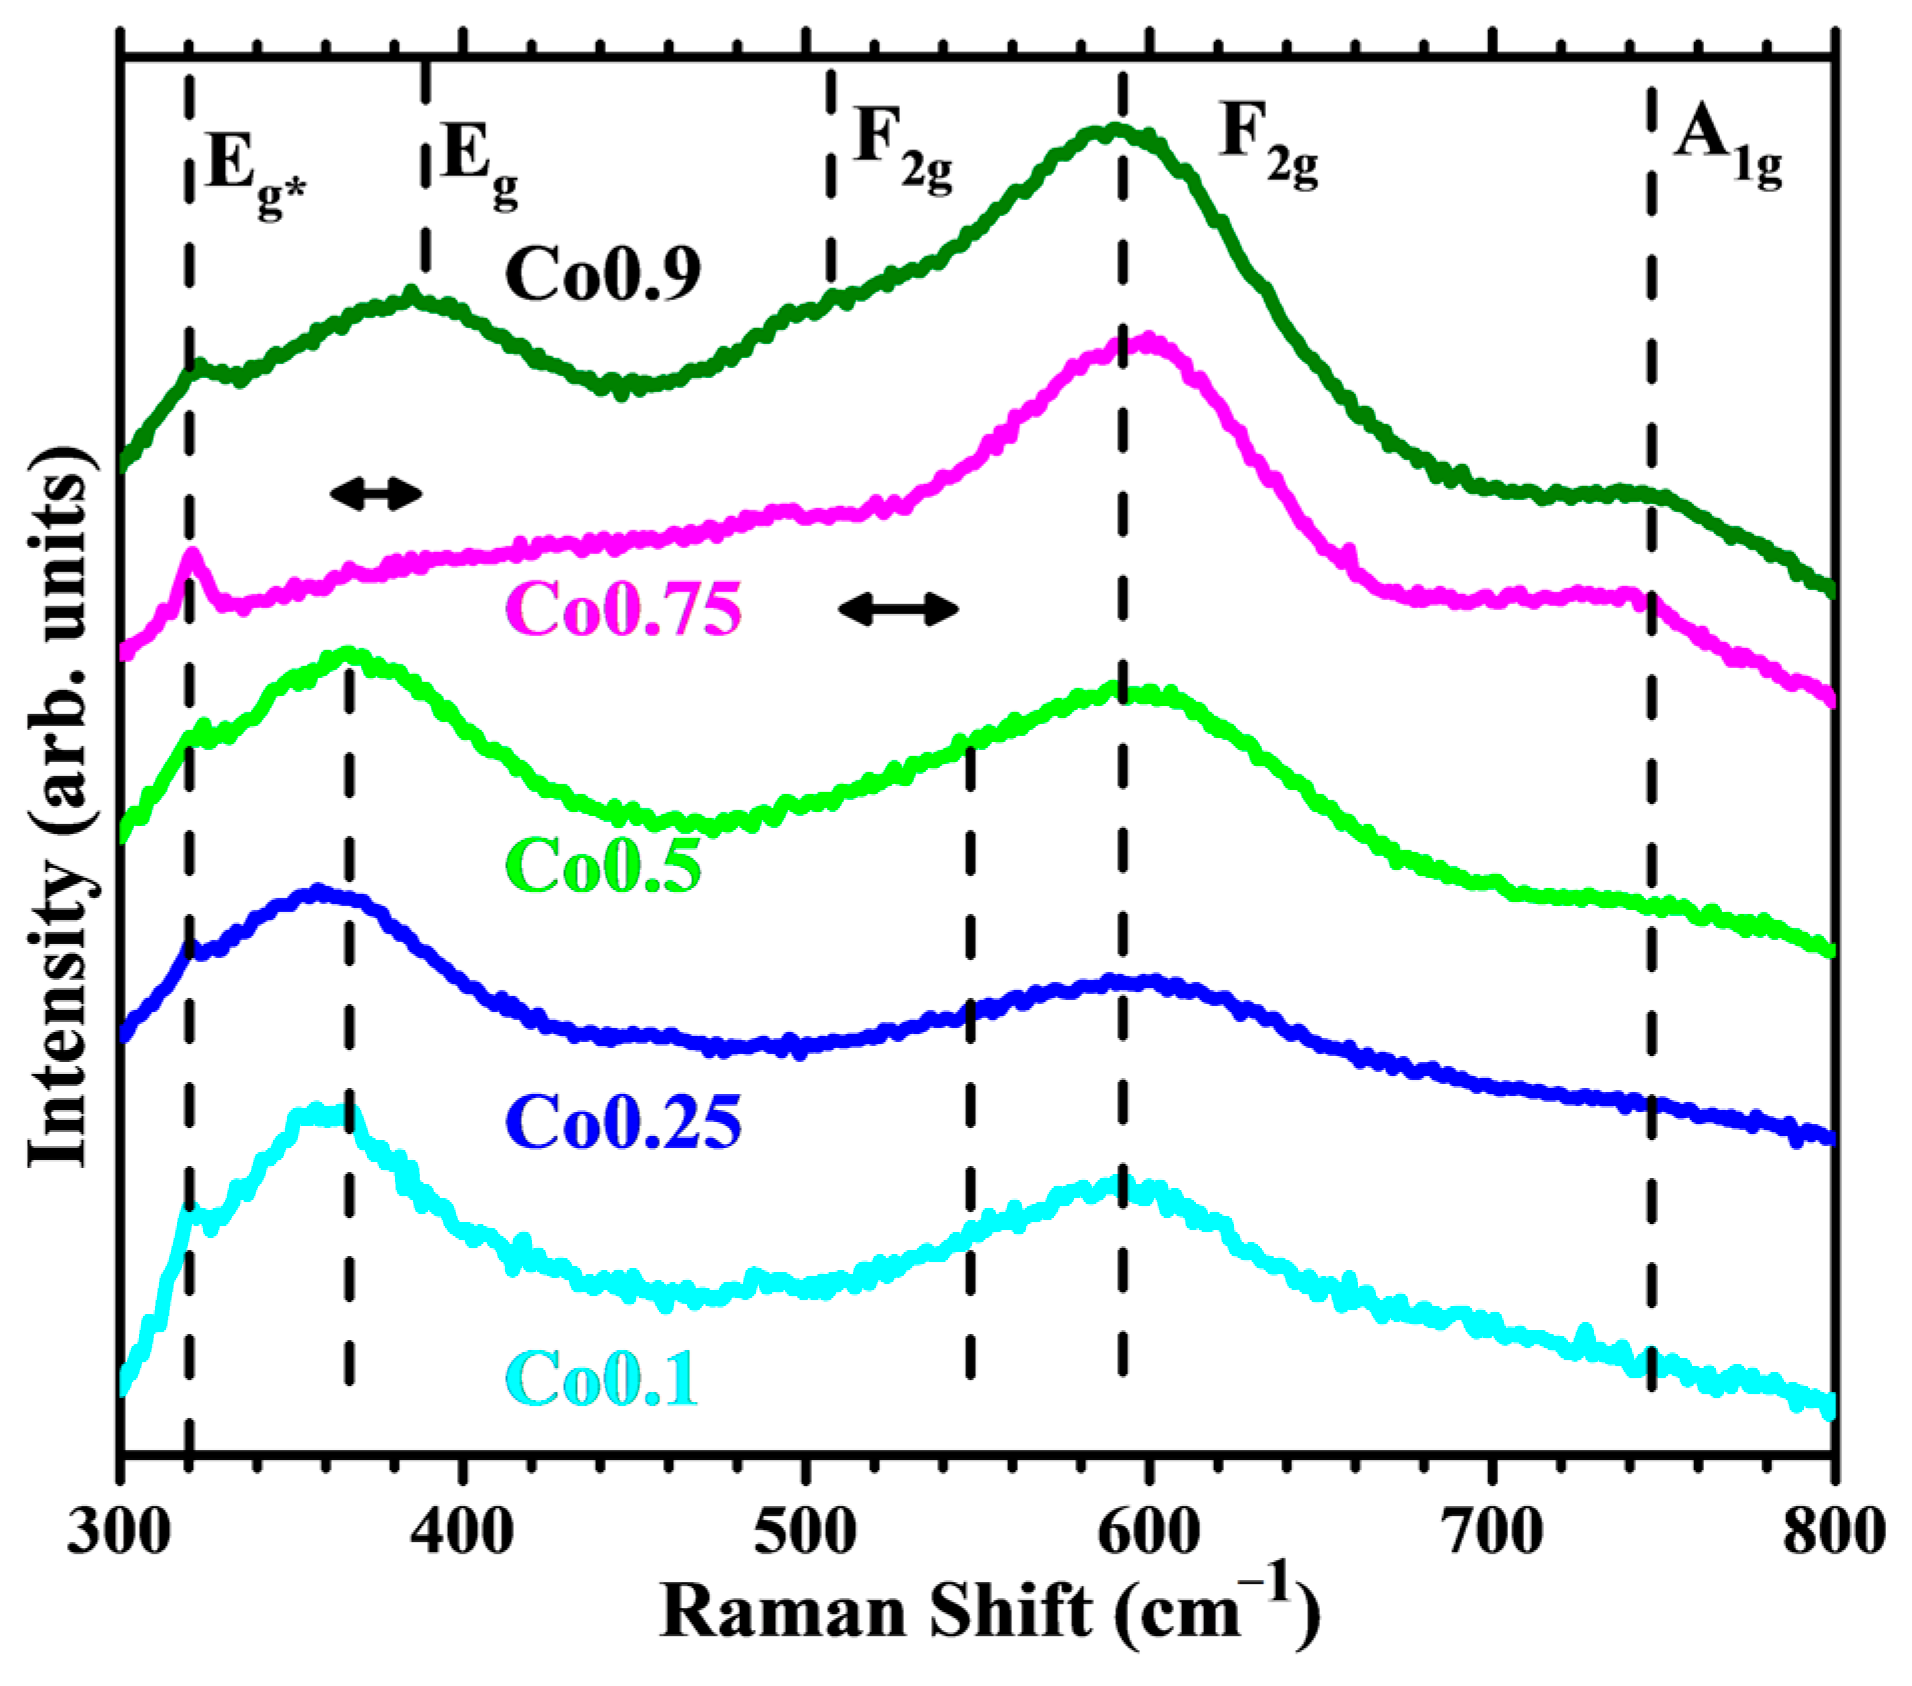
2.2.4. Raman Spectroscopy

The aluminates, with the general formula AAl2O4 are mainly normal spinels, with the A2+ cation mostly ordered at the tetrahedral sites and Al at the octahedral sites. The Raman spectrum of the end-member free of Ni, CoAl2O4 (Figure 8), shows five bands, at 320 (Eg*), 388 (Eg), 516 (F2g), 602 (F2g), and 751 (A1g) cm−1. Cobalt blue, CoAl2O4, does not exist in nature, but has been commonly used as a blue pigment since the discovery of its industrial synthesis route. The positions of the observed bands are in agreement with those reported in the literature for synthesized cobalt blue [35].
The F2g mode observed at 515 cm−1 is characteristic of Co-bearing spinels and is assigned to the Co–O stretching vibration at tetrahedrally coordinated sites. This peak is usually weaker in other aluminates [36]. An Eg mode at ~400 cm−1 is distinctive of the CoAl2O4 spinel [37]. The Eg band is associated with the asymmetric bending motion of oxygen atoms within tetrahedral sites. According to D’Ippolito et al. [37], the Eg* shoulder observed at ~320 cm−1 can be caused by some degree of spinel inversion, with trivalent Al3+ occupying tetrahedral sites.
The Raman spectrum of the end-member NiAl2O4 (Figure 9) also shows five bands, at 322 (Eg*), 365 (Eg), 549 (F2g), 601 (F2g), and 748 (A1g) cm−1. The position of the F2g band characteristic of the metal–oxygen vibration at tetrahedral sites can be observed at 549 cm−1. The position of this band depends on the cation size [37], shifting to higher wavenumbers with lower ionic radius. The presence of different cations at the tetrahedral sites also influences the Eg mode. The position of Eg at 365 cm−1 is considerably low for an aluminate spinel and indicates a significant degree of inversion.
The evolution of the Raman features with Co and Ni content in the intermediate compositions Co1−xNixAl2O4 (x = 0.1, 0.25, 0.5, 0.75, 0.9) is shown in Figure 10. Only two bands change their positions: the Eg band, which moves to higher wavenumbers with higher Co content and the F2g band at 515–550 cm−1. On the other hand, the A1g band at ~750 cm˗1 and the F2g band at ~600 cm−1 reveal little dependence on the type of divalent cation. These two bands do not change their positions significantly.
In conclusion, the Raman study indicates that the Eg band around 400 cm−1 is the most suitable Raman feature to detect compositional changes in aluminate spinels and that a distinguishable F2g band at 515 cm−1 identifies the presence of cobalt blue spinel.

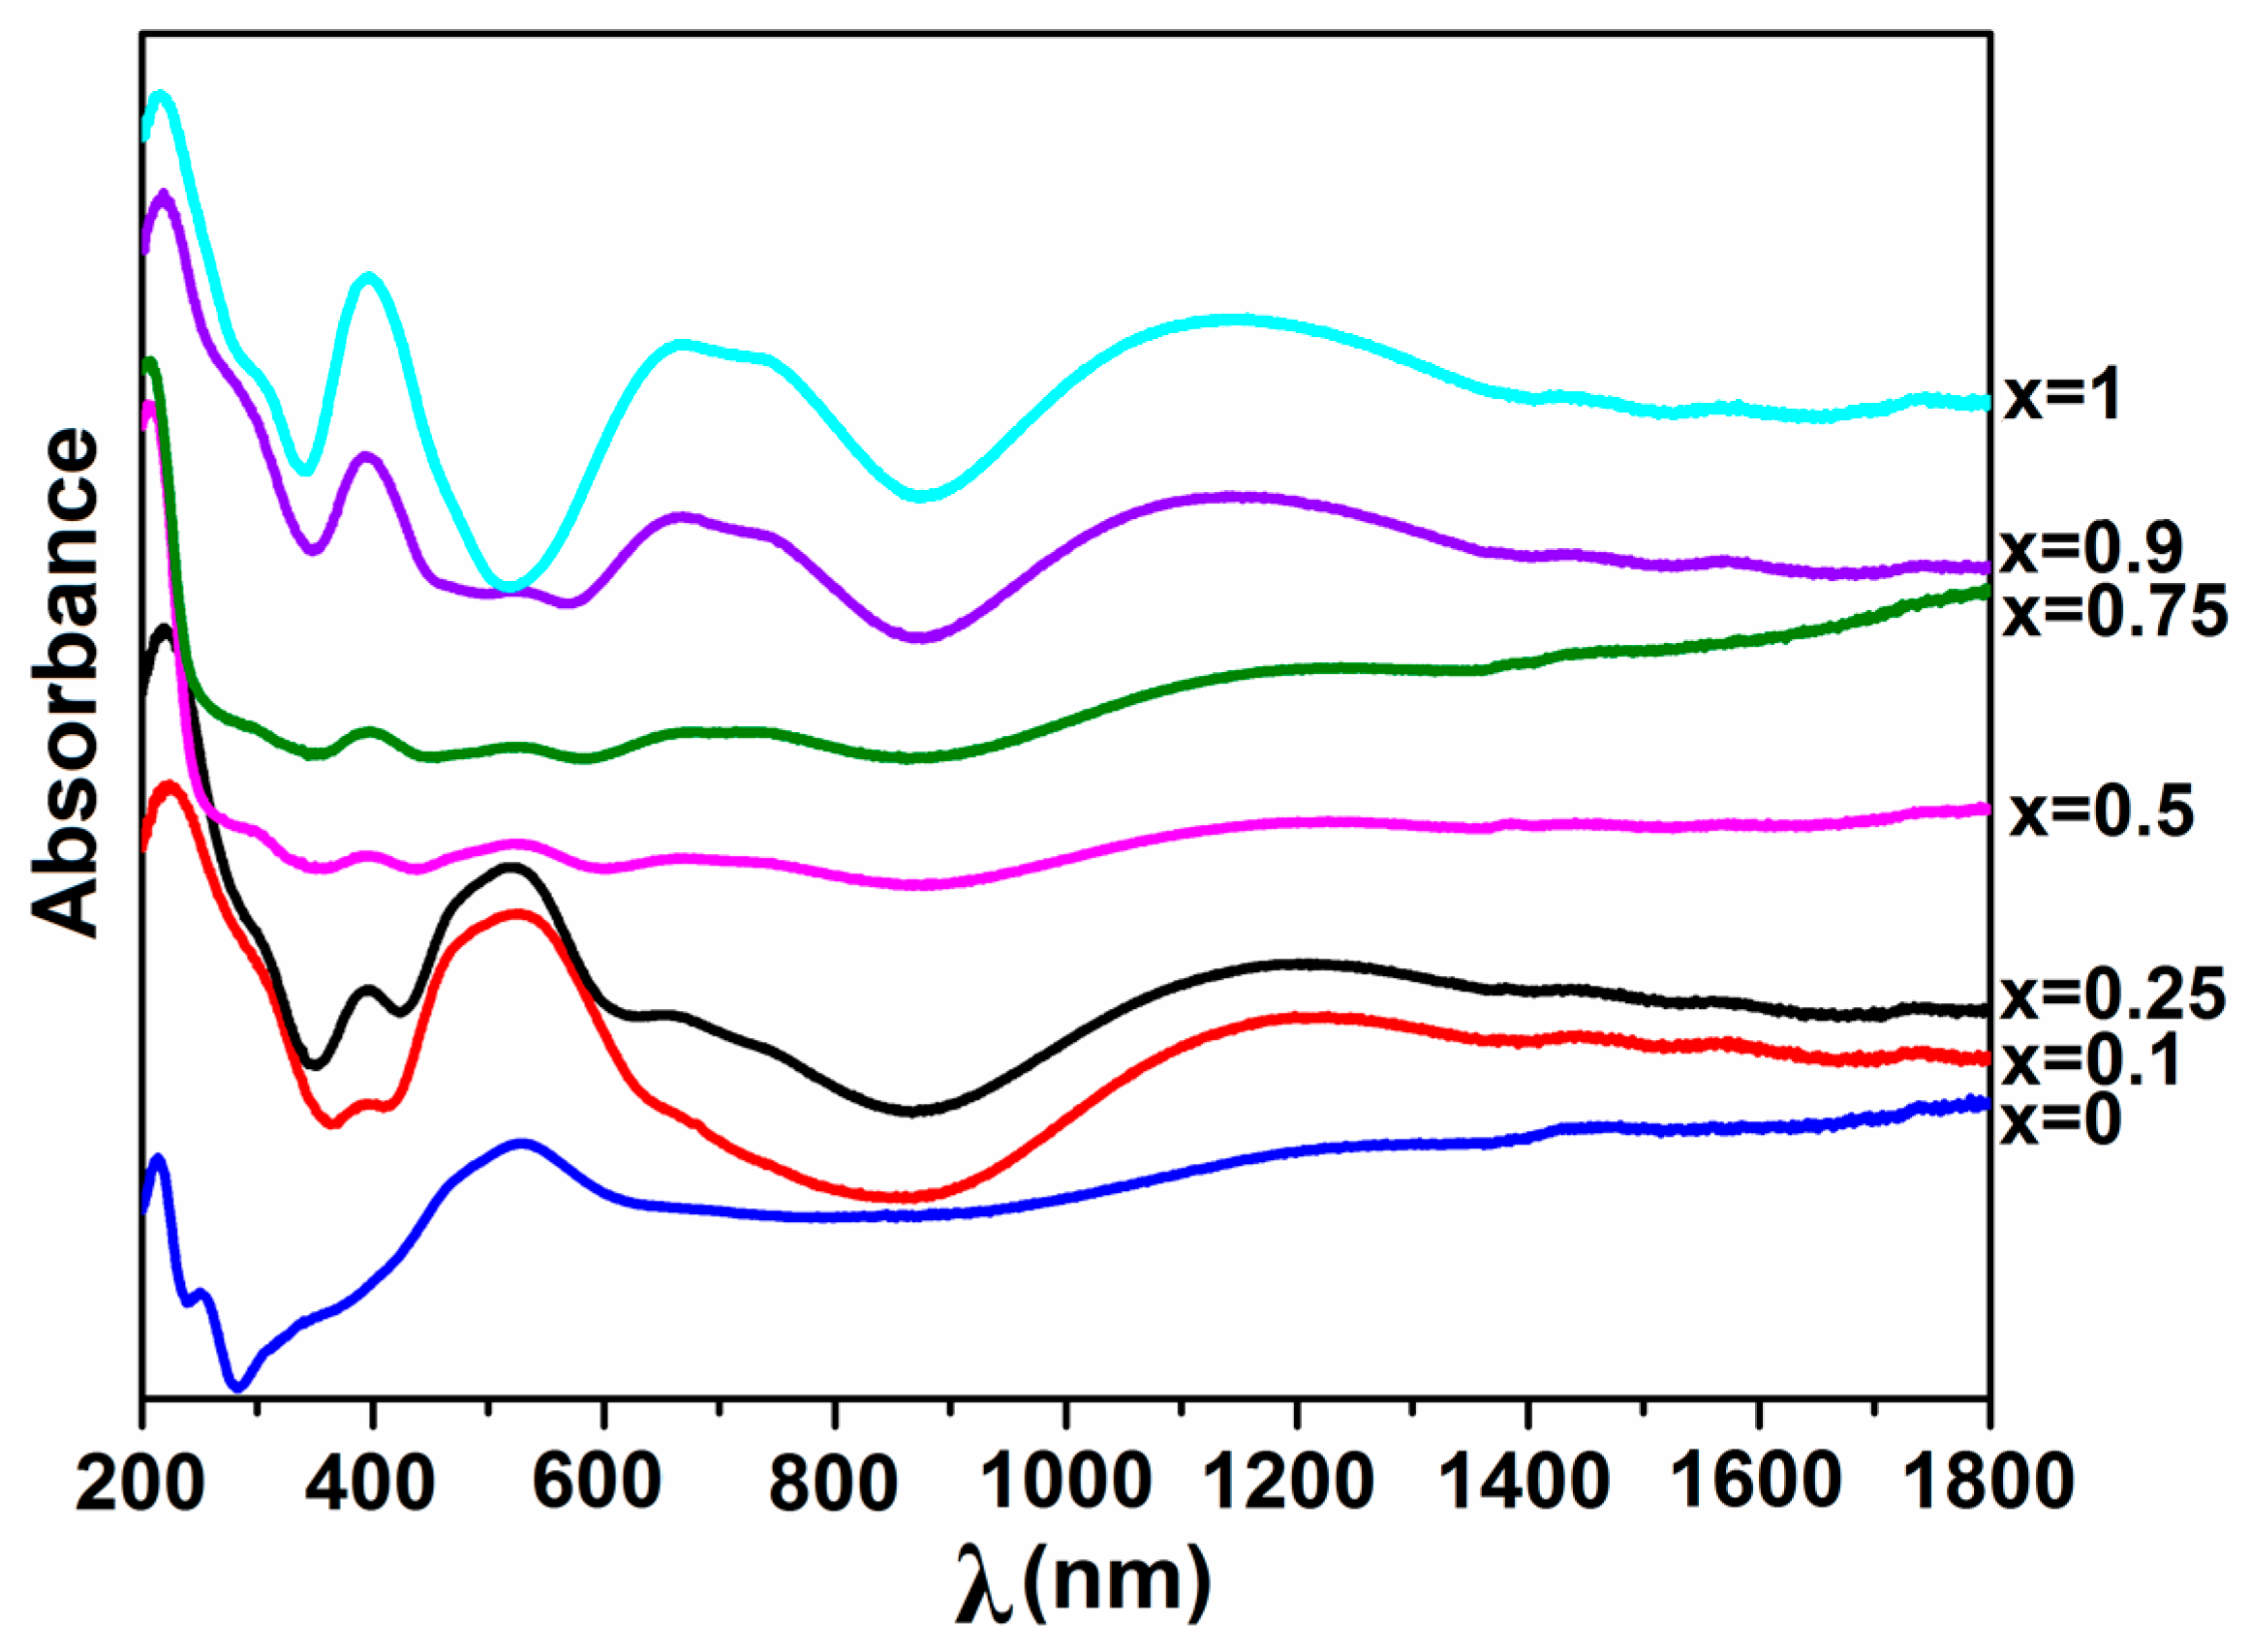
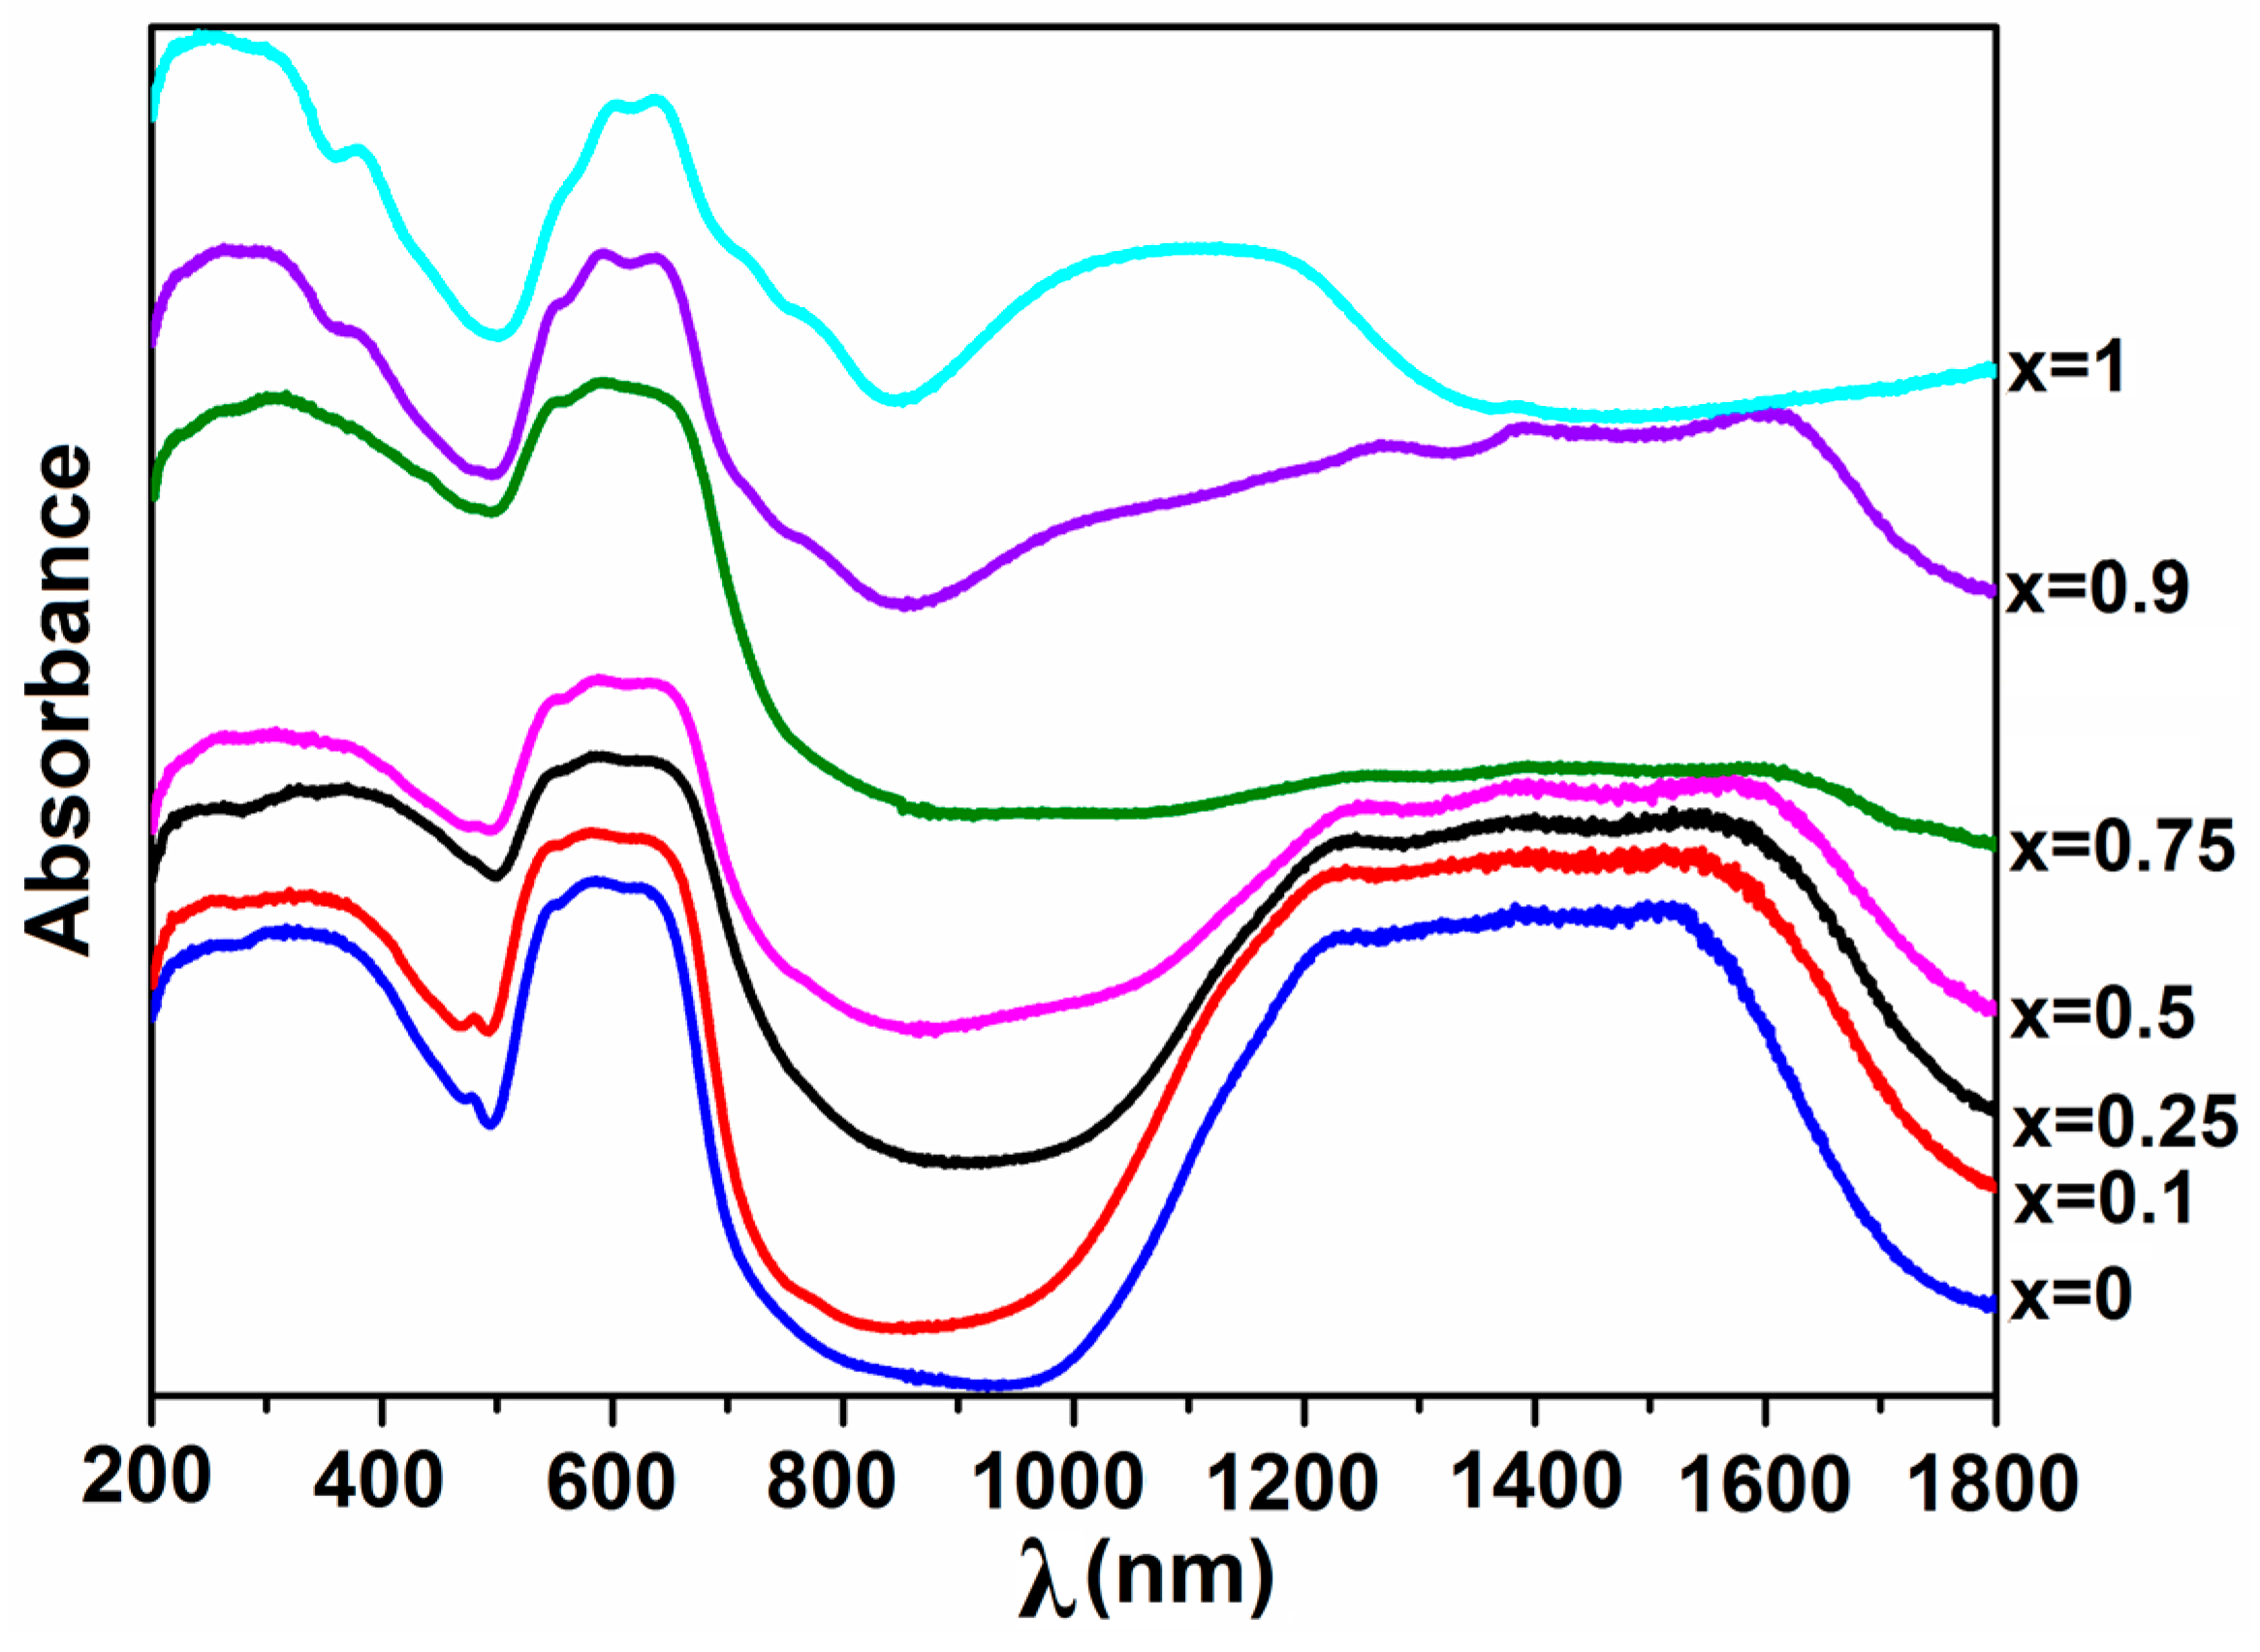
2.2.5. UV–Vis–NIR Spectroscopy

Figure 11 depicts the UV–Vis–NIR spectra of Co1−xNixAl2O4 samples. The electronic spectra of the substituted Co1−xNixAl2O4 oxides shows, as in the case of the precursor compounds, the characteristic bands of cobalt(II) and nickel(II) in tetrahedral surroundings, influenced by the metal(II) content. The spectra of tetrahedral cobalt(II) and nickel(II) species have multiple absorption bands in the near infrared and visible regions, respectively.
In all absorbance spectra of mixed oxide samples, there are two bands at 210–250 nm due to the fundamental band-to-band electron excitations (between filled O 2p orbitals and empty Al 3s orbitals) and at 360–380 nm as charge transfer (CT) bands [30,38]. For the samples with nickel content, this last band could also be due to the octahedral coordination of Ni2+ ions with 3A2g3T1g spin allowed transition.
In the visible region, in the range 500–700 nm, it can be observed an intensive and triple band associated with the tetrahedral coordination of Co2+ ions attributed to the 4A24T1(P) (ν3) allowed transition. This band is split due to the spin orbit coupling between the excited and the neighboring doublet states 2A1(G) and 2T2(G). Also in this region, at ~625 nm is the band corresponding to the d-d transition of Ni2+ ions in a tetrahedral environment, assigned to the 3T13T1(P) (ν3) spin allowed transition [39]. The split profile of this band for the nickel-substituted cobalt aluminate samples, with a shoulder around 760 nm, is most probably due to 3T11T2,1E(1D) spin forbidden transition of Ni2+ in tetrahedral coordination, thus confirming the incorporation of Ni2+ in the CoAl2O4 matrix [30,38].
In the UV–Vis–NIR spectra of the spinelic oxides containing cobalt, a broad band is highlighted in the 1100–1700 nm region characteristic of the Co2+ ions in the tetrahedral configuration. This band is assigned to the 4A24T1(F) (ν2) d-d transition. In the near infrared region, 900–1300 nm, a broad NIR absorption is assigned at the ν2 spin allowed transition (3T13A2), characteristic of the Ni2+ ions in the tetrahedral configuration. In contrast to the tetrahedral cobalt(II) ion, this band is not usually split, probably also because the excited state in this case is an orbital singlet. Thus, depending on the higher concentration of nickel(II) and/or cobalt(II), more pronounced absorption bands characteristics to tetrahedral geometry of Ni(II) or Co(II) appear in the electronic spectra of oxides.
The calculated band gap energies for Co1−xNixAl2O4 samples are 2.35 eV (x = 0), 2.25 eV (x = 0.1), 1.93 (x = 0.25), 2.06 eV (x = 0.5), 2.00 eV (x = 0.75), 2.43 eV (x = 0.9) and 2.60 eV (x = 1). It can be noticed that the substitution with nickel in the cobalt aluminate structure does not have a significant effect on these values and there is no correlation between the degree of nickel substitution and the band gap energy values. The obtained values are in accord with those reported in the literature for CoAl2O4 and Ni-substituted CoAl2O4 (1.83–2.85 eV) obtained by nitrate and Pechini routes [5,10] and lower than those obtained through microwave combustion method (3.67–4.15 eV) [4].

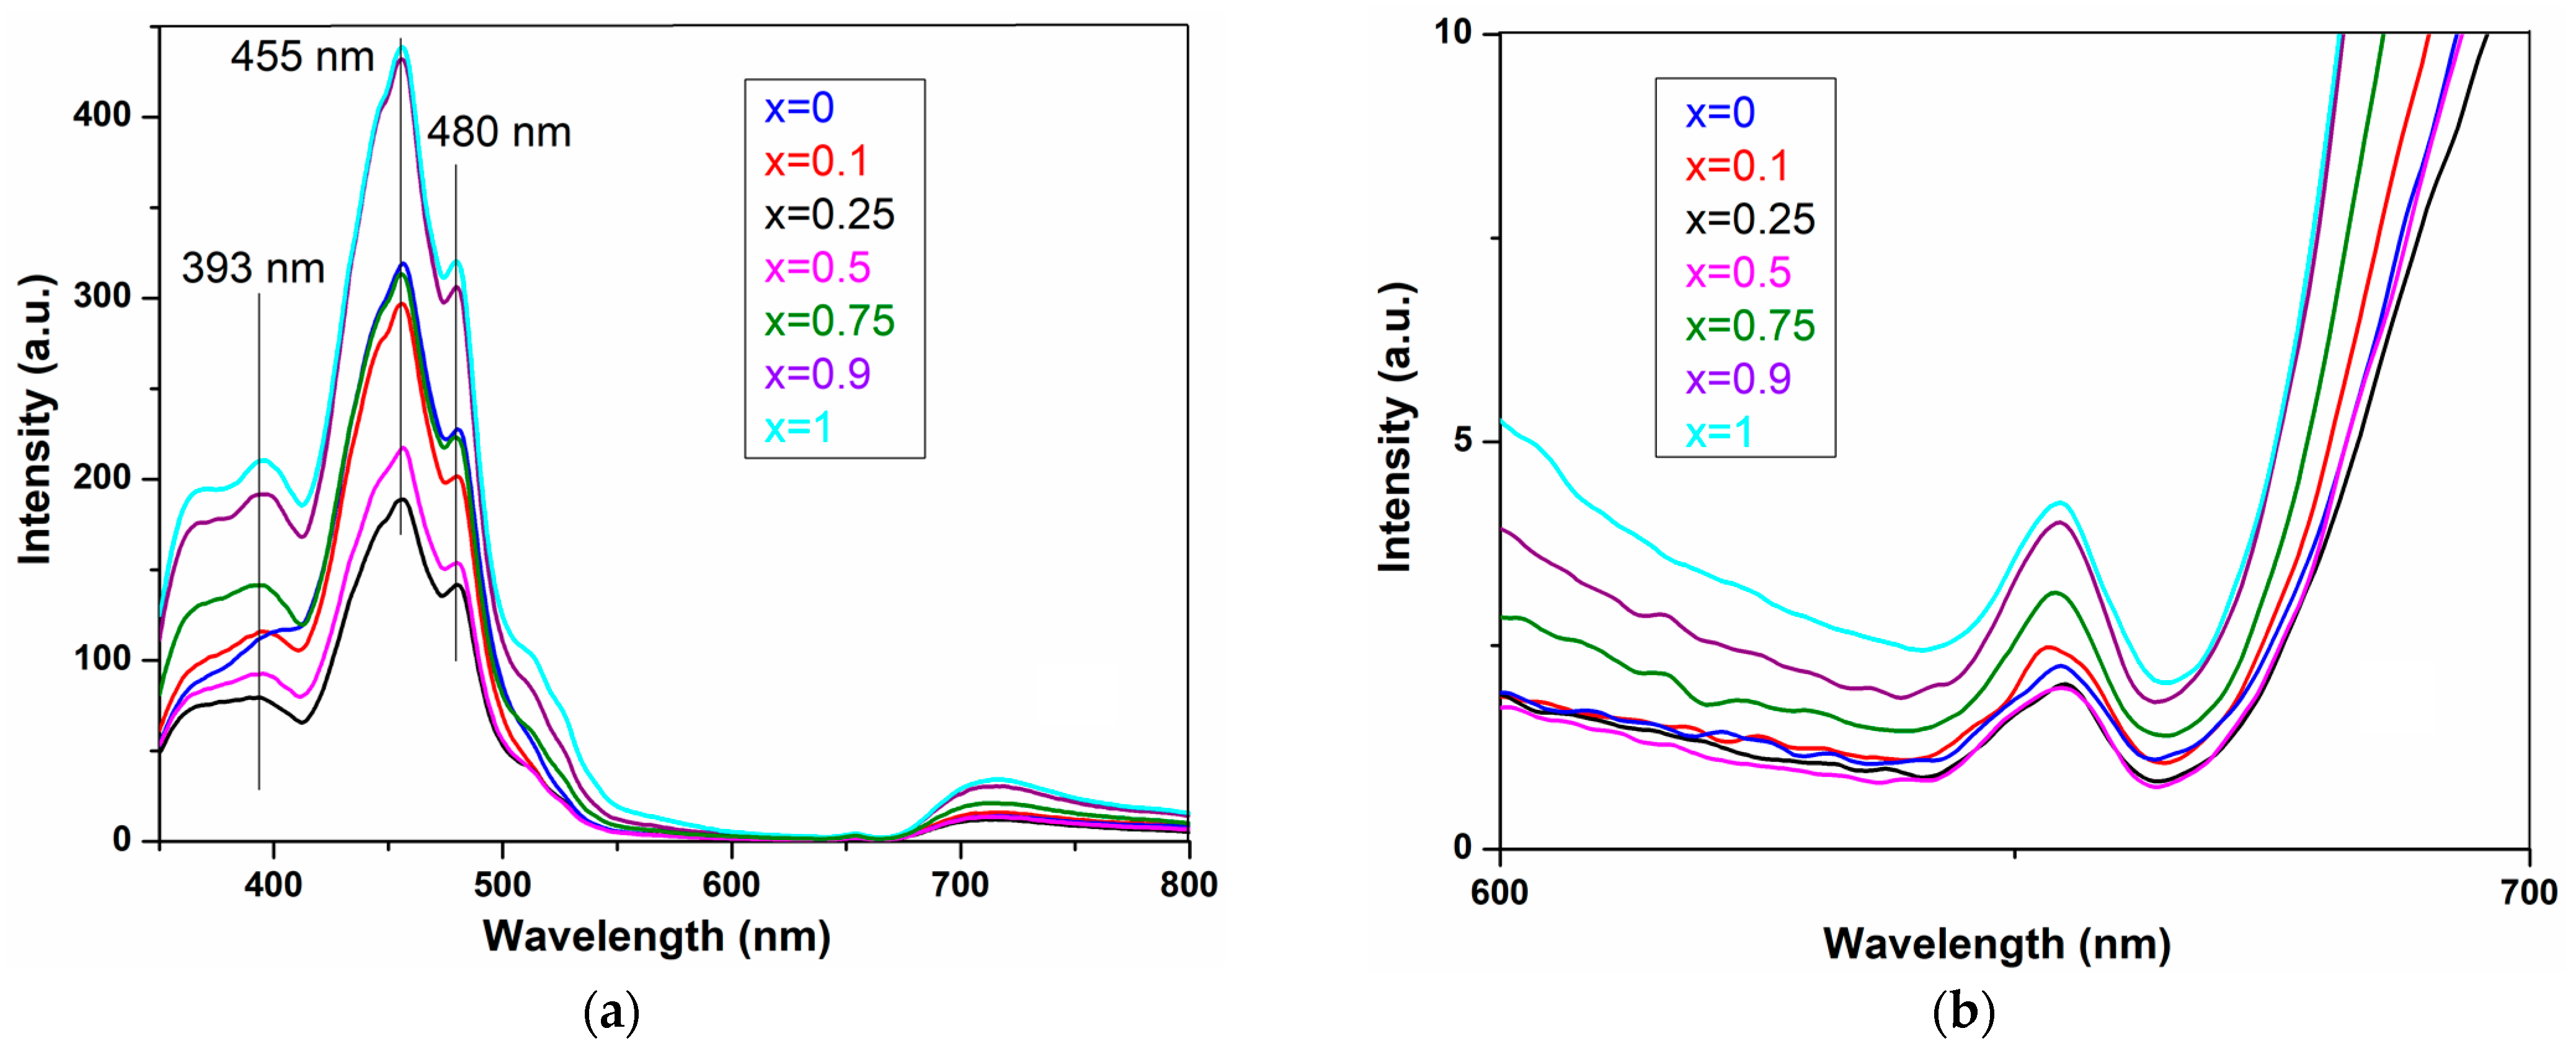
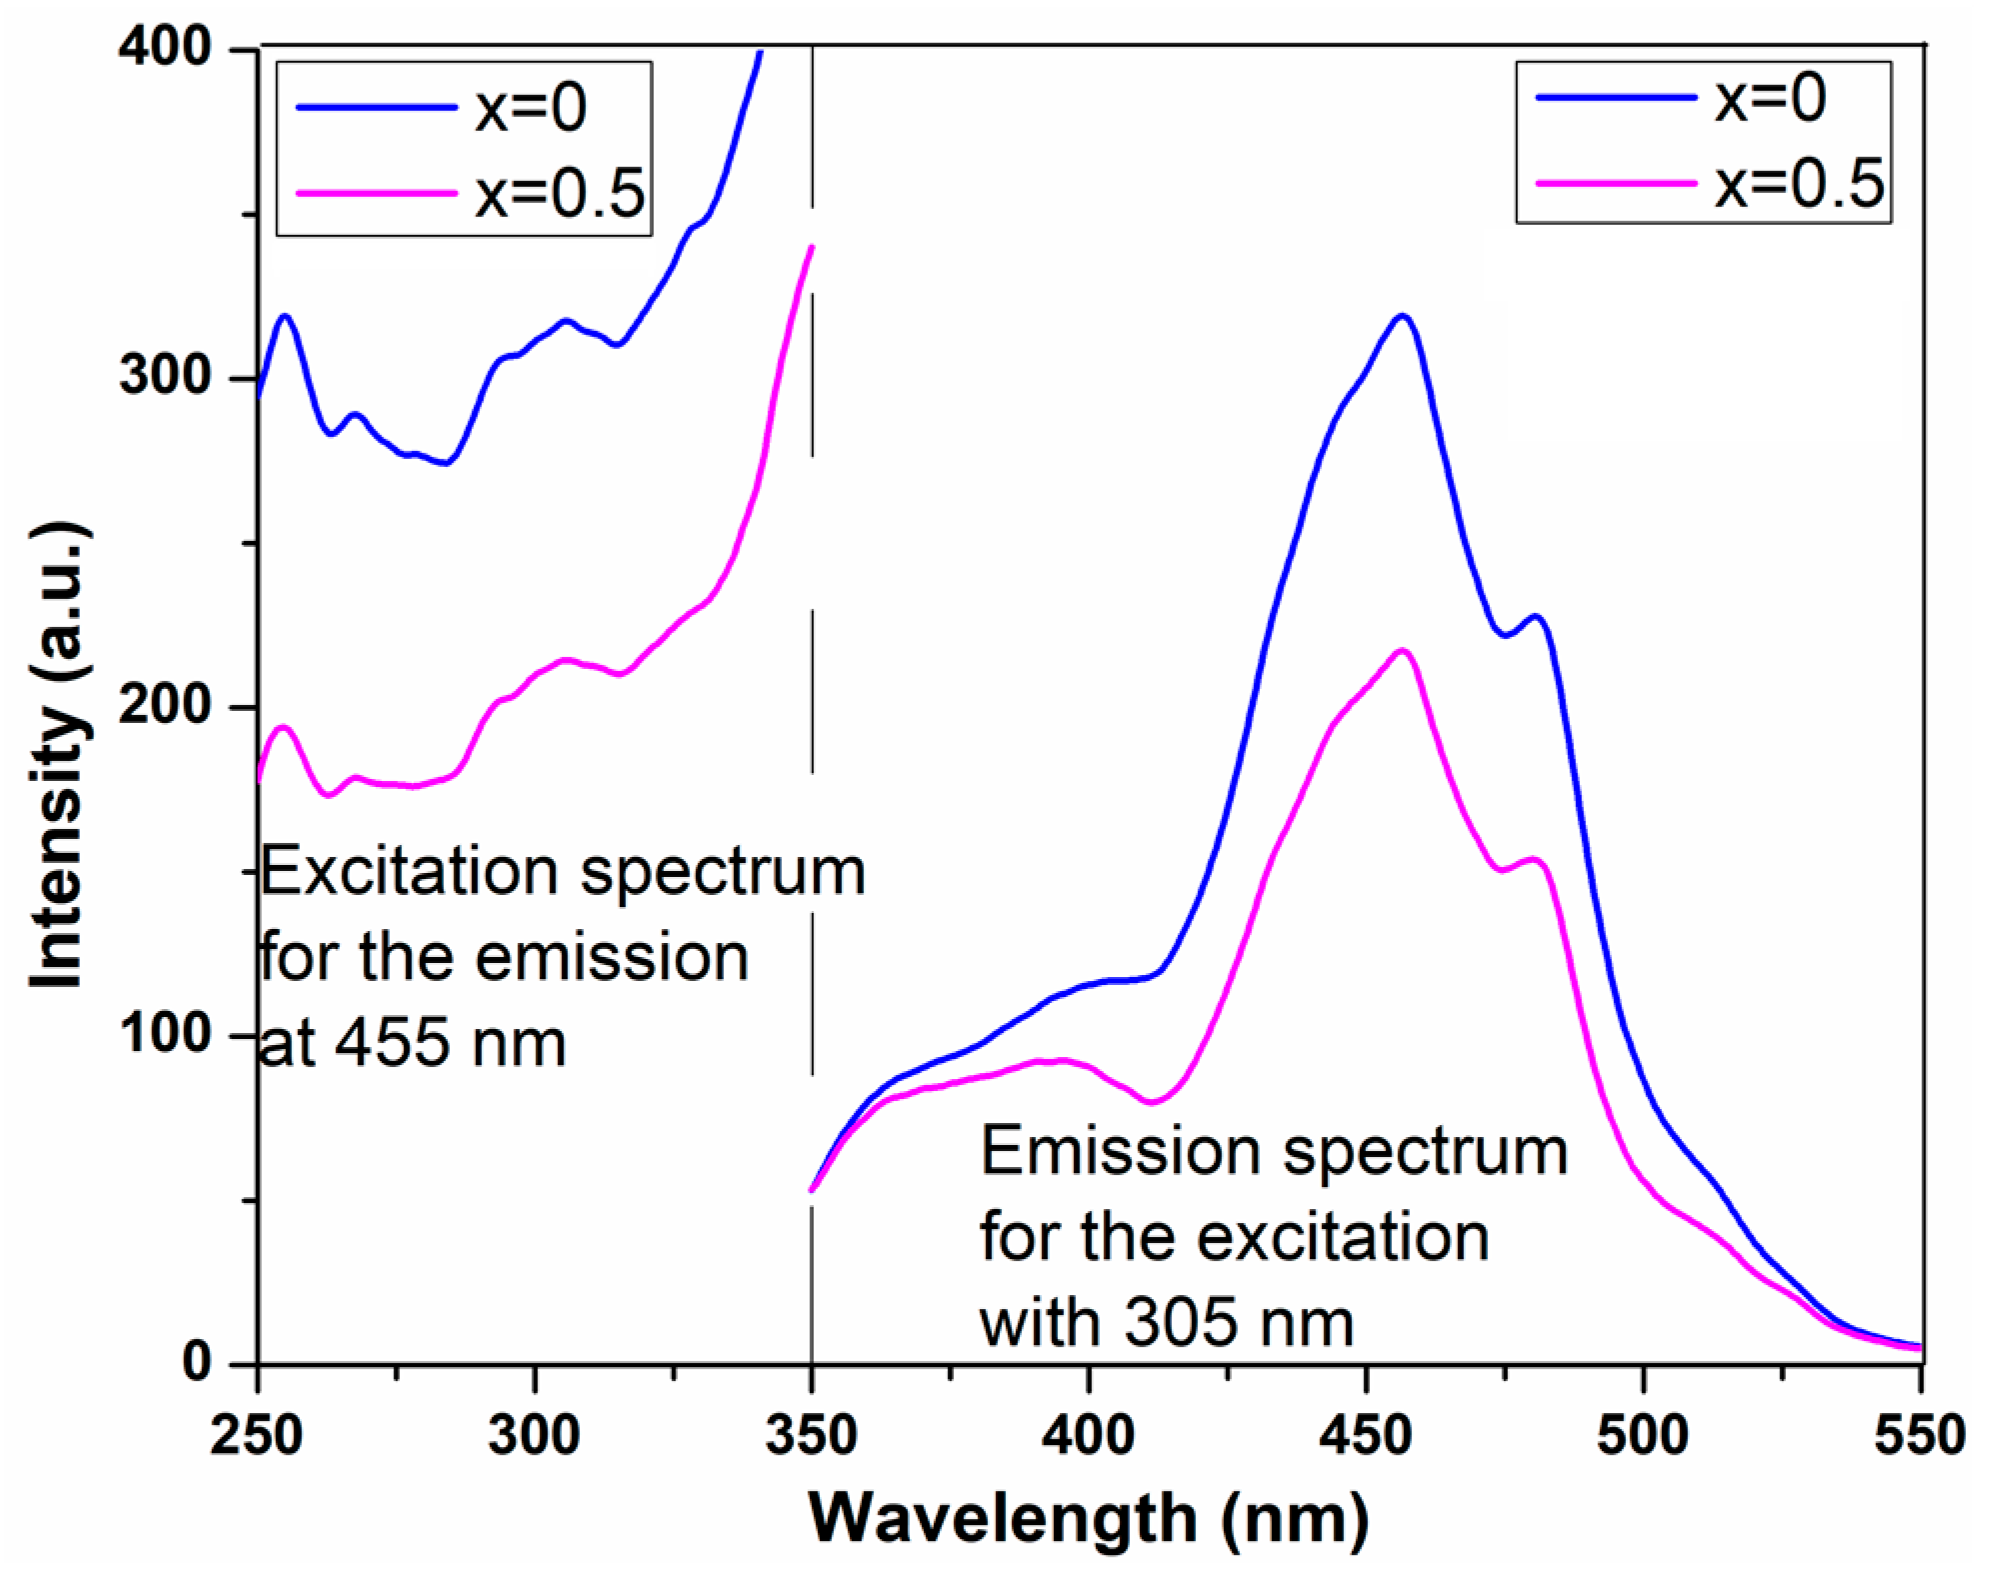
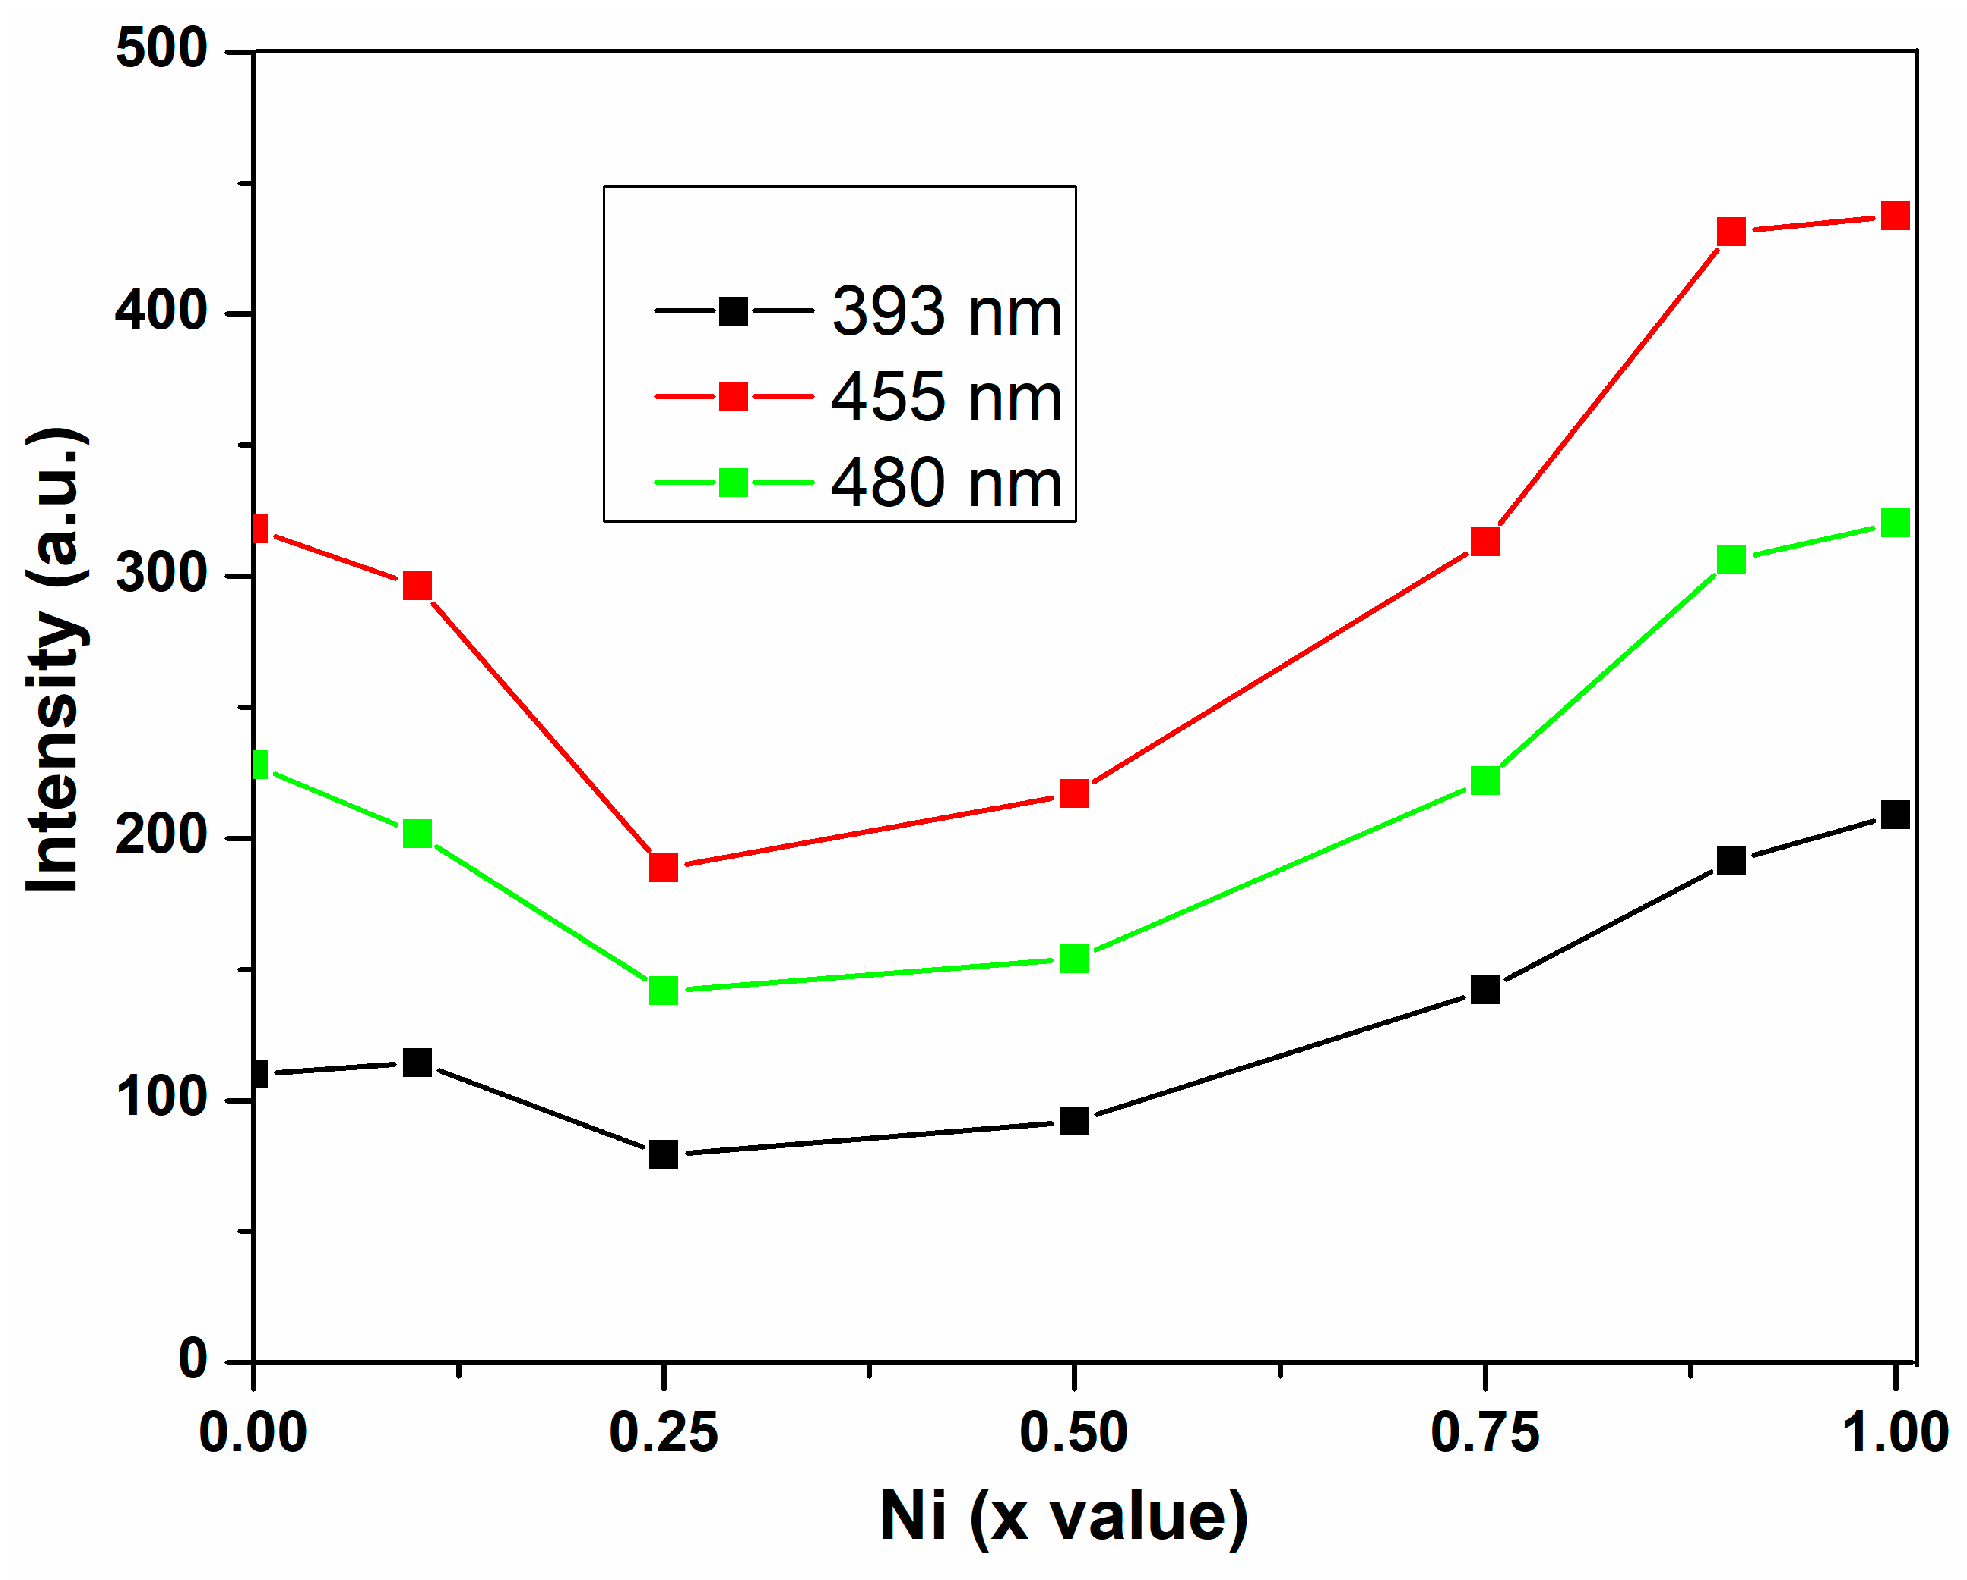
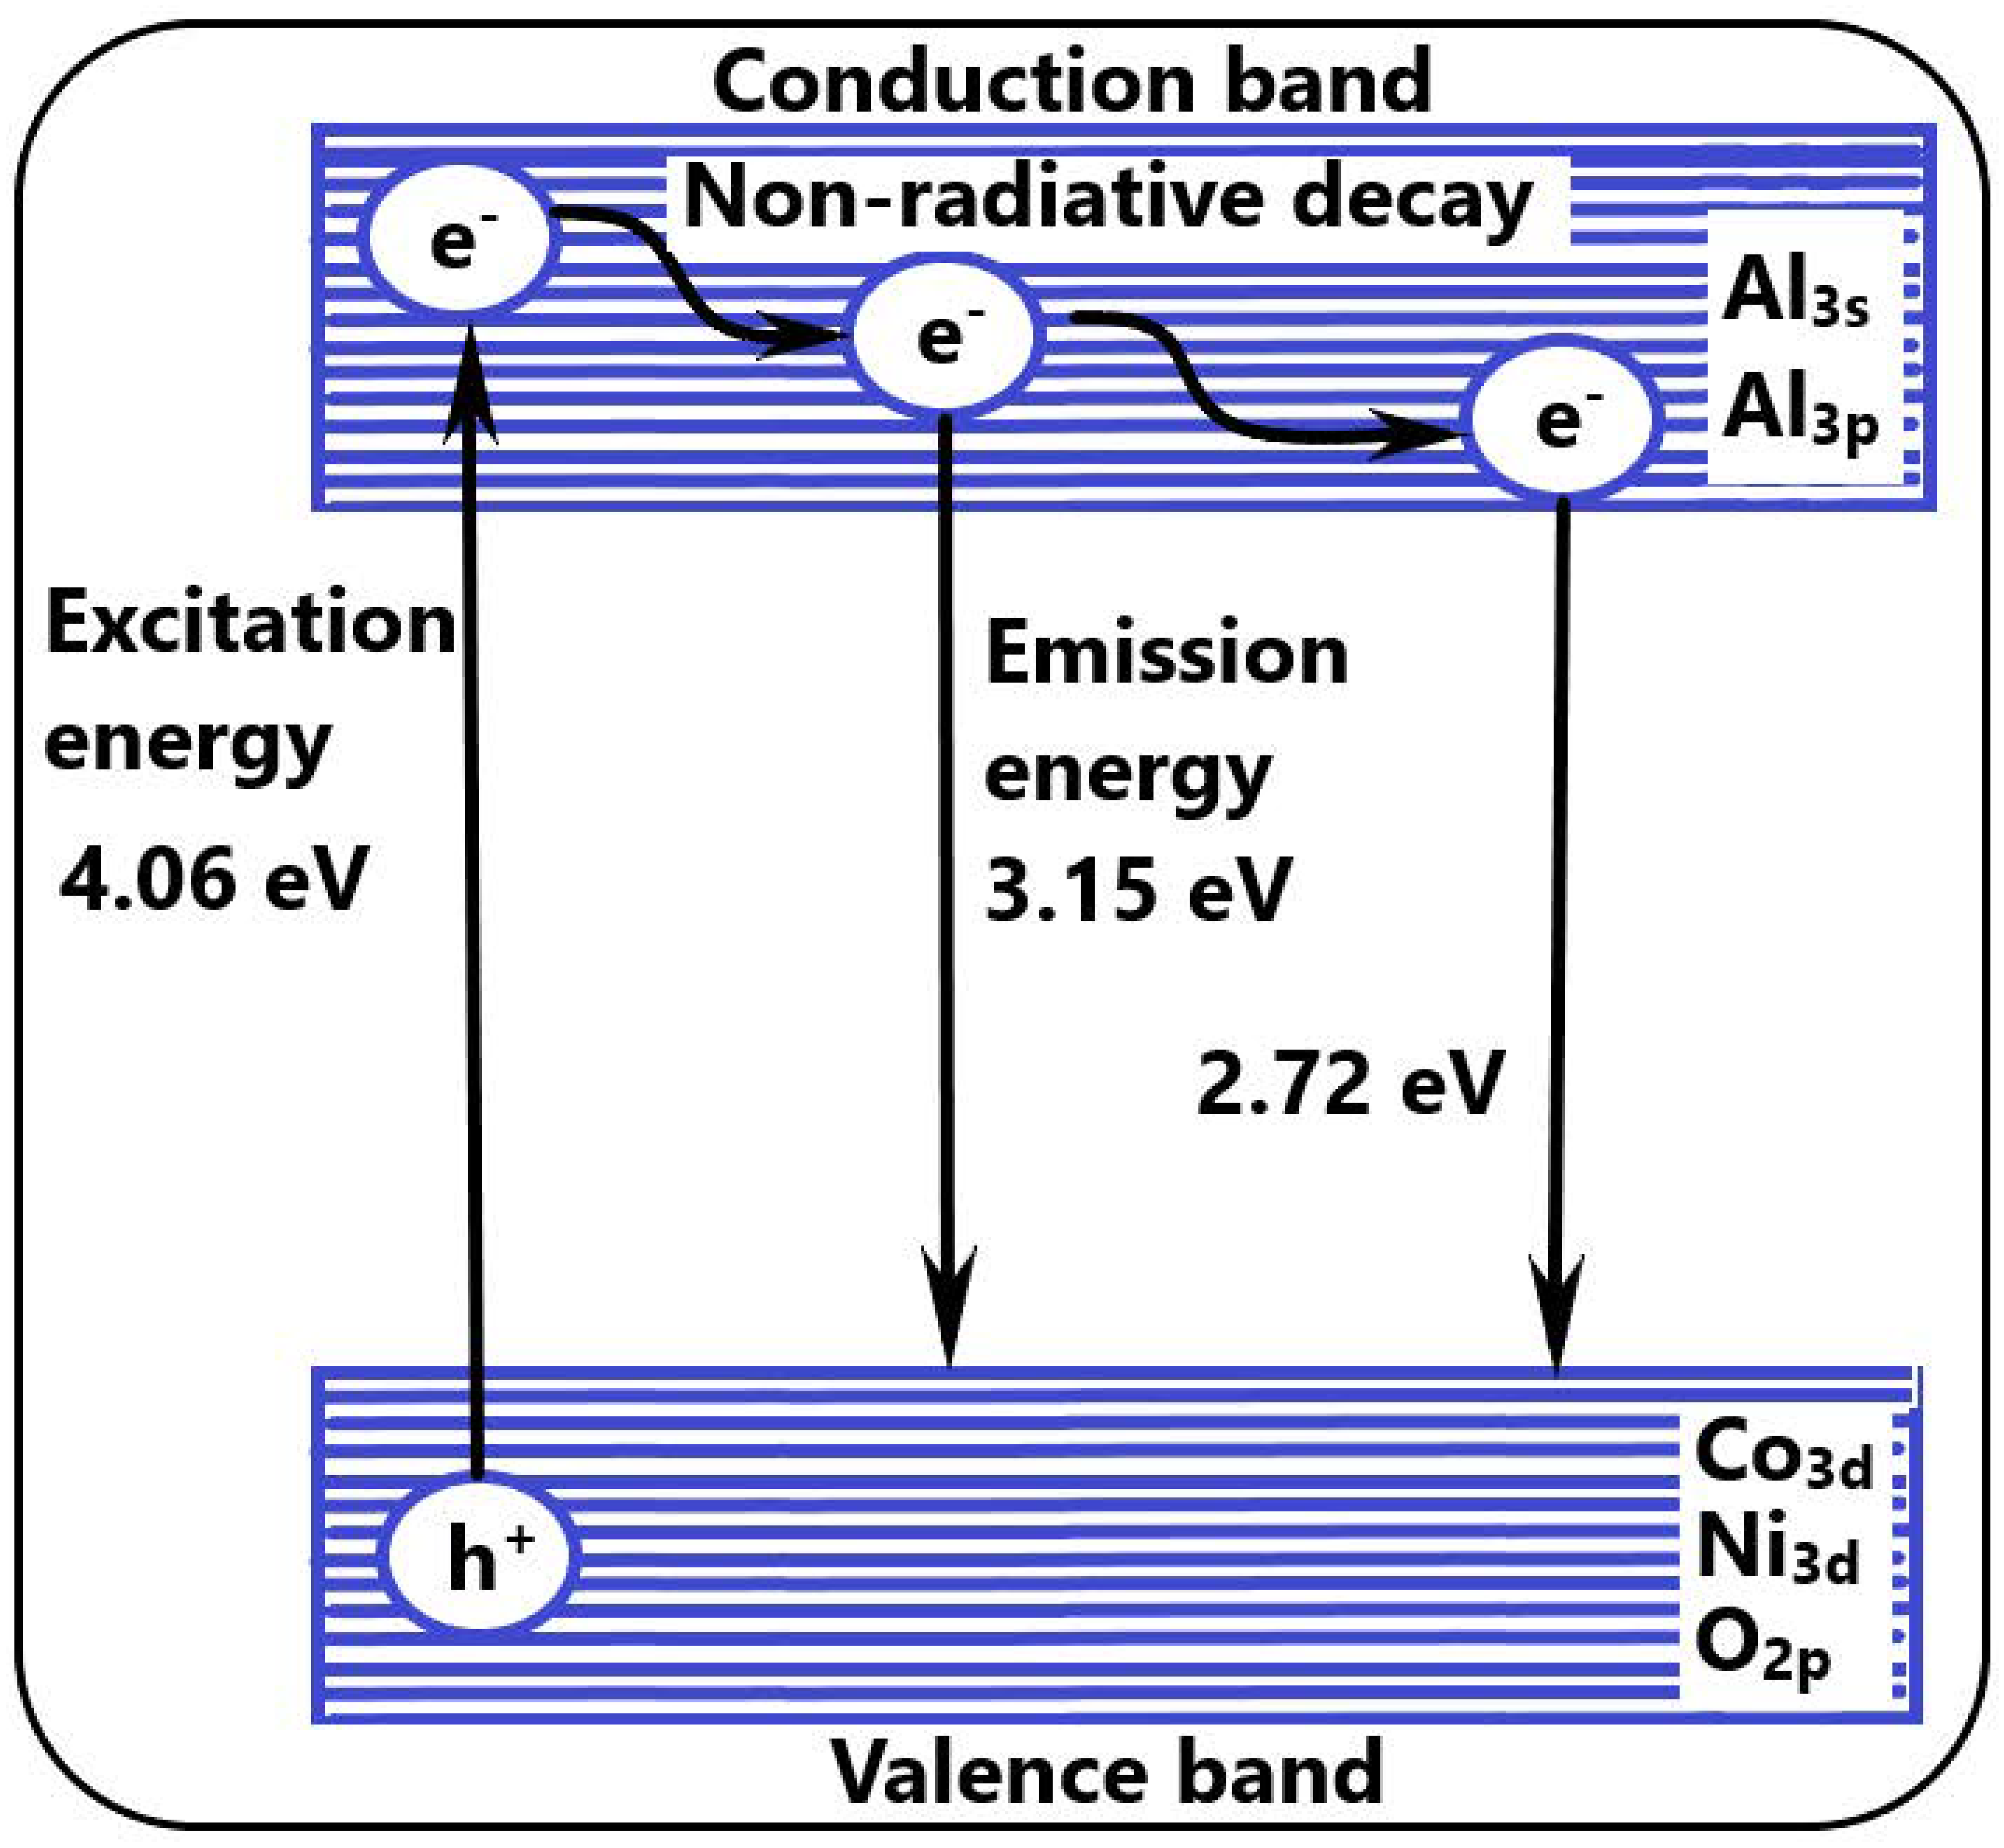
2.2.6. Photoluminescence Spectra

In Figure 12, the emission spectra for the Co1−xNixAl2O4 samples are presented. These spectra were obtained with an excitation wavelength of 305 nm (see Figure 13). The fluorescence spectra have similarly shaped and positioned emission bands for all the samples, pointing out a similar mechanism, but with different emission intensities. The bulk of the spectrum is positioned in the UV domain, with a maximum at 393 nm and in the blue region of the visible spectrum, with maxima at 455 and 480 nm. Both emission peaks, in UV and at around 455 nm, are split, indicating the presence of two closer energy levels. Previous reports from the literature assign the UV and 455 nm emissions to the presence of M2+ in tetrahedral voids in the crystalline lattice [40] but also to the presence of surface defects induced by the manufacturing process.
In other reports from the literature, oxides like ZnO, exhibit a similar pattern, generated by the exciton recombination (the UV band) [41] and the presence of various oxygen defects (visible emission) [42]. Agilandeswari et al. [43] have indicated the presence of emission peaks in the 600–750 nm interval, related to the 2E(2G)→4A2(4F) and 4T1(4P)→4A2(4F) transitions of the Co2+ ion.
Figure 14 represents the variation of the fluorescence peaks (from 393, 455 and 480 nm) intensity and the nickel content of the sample. It can be seen that a minimum intensity is obtained at x = 0.25, while both CoAl2O4 and NiAl2O4 present higher intensities. Among the pure spinels, the NiAl2O4 presents a higher emission intensity, which is in concordance with the more stable 3d8 configuration vs. cobalt’s 3d7 which offers free electrons for non-radiative de-excitation. Two maxima are obtained for the samples with no nickel content and for the sample with x = 0.75. In addition, as oxygen defects play a crucial role in fluorescence intensity, we can state that these two samples present the highest concentration of surface defects.
The fluorescence mechanism (Figure 15) implies the excitation of an electron from the valence band (VB) to the conduction band (CB), followed by the emission of a photon when the electron is returning to the VB. In CoAl2O4 the 3s and 3p orbitals of Al3+ are part of the CB, while the O 2p and Co2+/Ni2+ 3d orbitals form the VB [40,44]. If the λex > band gap is then under irradiation, one electron can absorb a high energy photon and jump from VB to CB. From this high energy level, the electron can decay to the CB edge by a non-radiative mechanism. From the CB edge, the electron will jump back in VB, recombining with a positive hole, a photon being emitted in this process. The additional defect levels induced by the oxygen vacancies and oxygen interstitials generate slightly different photon energies.

3. Materials and Methods

3.1. Chemicals

To synthesize single and mixed Ni-Co aluminate samples, the following chemicals were purchased: cobalt nitrate (Co(NO3)2∙6H2O), nickel nitrate (Ni(NO3)2∙6H2O), aluminum nitrate (Al(NO3)3⋅9H2O), and DL-malic acid (C4H6O5) from Merck (Darmstadt, Germany), methanol and acetone from Lach-Ner (Neratovice, Czech Republic), and ammonia solution 25% from Chimreactiv (Bucharest, Romania). All chemicals were used as received without any purification.

3.2. Synthesis of Co1−xNixAl2O4 (x = 0, 0.1, 0.25, 0.5, 0.75, 0.9, 1)

The malate complex compounds were synthesized as precursors of cobalt aluminate, nickel-substituted cobalt aluminates, and nickel aluminate, starting from (1−x)Co(NO3)2∙6H2O:xNi(NO3)2∙6H2O:2Al(NO3)3∙9H2O:4C4O5H42− systems, where x = 0, 0.1, 0.25, 0.5, 0.75, 0.9, and 1.
The malic acid was dissolved in the minimum amount of distilled water and added to the well-mixed aqueous solution of metal nitrates. The resulting solution was then vigorously and continuously stirred until a homogeneous solution was obtained. By adding methanol and a solution of NH4OH:CH3OH (1:1) it was noticed that the precipitated species are very soluble. When adding acetone, intense precipitation was observed. The pH was raised to 6. The solutions were maintained at 4 °C for 24 h, then filtered and the obtained precipitates dried over P4O10. The color of the malate compound precursors varied from pink, pink purple, to green, depending on the x value from the systems mentioned above. The heating of the precursors was performed at 900 °C for 2 h in an air atmosphere to obtain the final aluminates with colors from blue to cyan.
The obtained malate precursors and single/mixed Ni-Co aluminates were then studied using different characterization techniques.

3.3. Characterization Techniques

The FTIR spectra were recorded in the 4000–400 cm−1 range with a JASCO FT/IR 4700 spectrophotometer (JASCO Corporation, Tokyo, Japan) using the KBr pellet technique. The thermal behavior of the polynuclear complex compounds (malate precursors) was analyzed with a Netzsch STA 449C Jupiter apparatus (NETZSCH-Gerätebau GmbH, Selb, Germany). The samples were heated from room temperature up to 900 °C with 10 °C∙min−1, under a dried air flow of 50 mL min−1. X-ray diffraction measurements were carried out using a Rigaku Ultima IV diffractometer (Rigaku, Tokyo, Japan) operating at 40 kV, 30 mA, CuKα radiation (λ = 1.5406 Å) and a graphite (200) monochromator. The measurements were performed in θ-2θ mode, in the 5–85° range with a 0.02° step size and 2°/min scan speed. The phase identification was carried out using the Search/Match method, connected to the ICDD PDF-2. The Whole Pattern Powder Fitting (WPPF) module of the Rigaku PDXL v. 1.8.0.3 software was used for the determination and refinement of the structural parameters. The average crystallite size (D) was calculated using the Williamson–Hall (W–H) plot (Equation (1)):
β cos θ λ = 1 D + 4 ε s i n θ λ
where D is the crystallite size, λ is the wavelength of the X-ray used, θ is the angle of reflection, and β is the full width at half maximum or the broadening of the diffraction line in radians. Unit cell parameter, a, and oxygen occupancy (or oxygen positional parameter), u, determined by the Rietveld (or WPPF) method, were used to determine the unit cell volume, X-ray density, the dislocation density, the bond lengths on tetrahedral (A) sites and octahedral (B) sites, the structural radii, and the average cationic radii, using the equations below (Equations (2)–(9)):
ρ x = 8 M N A × a 3
where ρx is the X-ray density, M represents the molecular weight, NA is Avogadro’s number and a is the lattice constant [45];
δ = 1 D 2
where δ is the dislocation density and D is the average crystallite size [46];
d t = a 3 ( u 0.125 )
d o = a 3 u 2 2 u + 0.375
where dt and do are the bond lengths at the tetrahedral sites and octahedral sites, respectively, of the cubic spinel structure, u and a as described before [47];
r t = d t r O 2
r o = d o r O 2
where rt and ro are the cation radii of the tetrahedral sublattice and octahedral sublattice, respectively [47], and assuming that the radius of tetrahedrally coordinated O2− is r O 2 = 1.38 Å [48];
r t = ( 1 λ ) [ ( 1 x ) ( r C o 2 + , t ) + x ( r N i 2 + , t ) ] + λ ( r A l 3 + , t )
r o = λ [ ( 1 x ) ( r C o 2 + , o ) + x ( r N i 2 + , o ) ] + ( 2 λ ) ( r A l 3 + , o ) 2
where <rt> and <ro> are the average cation radii for the tetrahedral sites and octahedral sites, respectively, λ, the inversion degree, is the fraction of tetrahedral sites occupied by Al3+ according to the estimated site occupation factors, ( r X n + , s ) are the effective cation radii, as expressed by Shannon [48], and x is the nickel-substituted cobalt fraction; adapted from [49,50]. The microstructure of the as obtained powders was studied after calcination by scanning electron microscopy (SEM) in a FEI Quanta 3D FEG apparatus (Thermo Fisher Scientific, Hillsboro, OR, USA) operating at accelerating voltages between 1 and 5 kV, using secondary electron images. Unpolarized Raman spectra were recorded using a Horiba Jobin–Yvon LabRam HR spectrometer (Horiba Ltd., Kyoto, Japan), with a He-Cd laser (excitation wavelength of 325 nm). The Raman shift was recorded from 300 to 800 cm−1 and the integration time of the measurements 60 s. UV–Vis–NIR spectra of the malate precursors and nickel-substituted cobalt aluminates have been recorded between 200 and 1800 nm using a JASCO V-670 spectrophotometer (JASCO Corporation, Tokyo, Japan). The optical band gap energy Eg (eV) has been obtained from UV–Vis–NIR spectra of nickel-substituted cobalt aluminates using Tauc’s formula [26]:
( α h ν ) n   =   A ( h ν E g )
where α is the absorption coefficient, is the photon energy, A is an energy independent constant, and n is the power coefficient of allowed transition (direct or indirect). In the case of a direct transition n = ½, while for an indirect transition, n = 2. The direct band gap energy can be determined from the plot of (αhν)2 versus () using the data from the absorption spectra by linear extrapolation of the curves towards the (αhν)2 = 0. A Perkin Elmer (Waltham, MA, USA) LS55 spectrometer was used to measure the photoluminescence spectrum (PL). A Xe lamp was used as a UV light source at ambient temperature, the fluorescence being measured in the range 350–800 nm. The spectra were recorded with a scan speed of 200 nm min−1, excitation and emission slits of 10 nm, and a 350 nm cut-off filter. An excitation wavelength of 305 nm was used.

4. Conclusions

In this study, the precursor method—malate route—was employed to obtain seven polynuclear complex compounds as precursors of Co/Ni-based aluminates with different structural and fluorescent properties. The introduction of nickel ions into the cobalt aluminate composition leads to the conversion from a normal to an inverse spinel structure. The size of the crystallites decreases from 17 to 4 nm when the nickel content increases. The agglomeration degree of the obtained Co1−xNixAl2O4 (x values from 0 to 1) also decreases with increasing nickel content. FTIR and Raman spectra sustain the formation of spinel phase. The UV–Vis–NIR spectra of the spinelic oxides evidenced the absorption bands characteristics of the tetrahedral geometry of Ni(II) or Co(II). The band gap values for Co1−xNixAl2O4 samples fall within the range 1.93–2.60 eV. The emission peaks at around 393 nm and 455 nm are split, indicating the presence of two closer energy levels. The obtained results show that the simple and mixed Ni-Co spinel aluminates could be used in the field of photocatalysis and optical materials.

Author Contributions

Conceptualization, D.G.; investigation, O.O., G.M., J.M.C.M., D.C.C., V.-A.S., and S.P.; writing—original draft preparation, D.G., O.O., G.M., J.M.C.M., D.C.C., and S.P.; writing—review and editing, D.G. and S.P.; and supervision, D.G. and S.P. All authors have read and agreed to the published version of the manuscript.

Funding

This research received no external funding.

Data Availability Statement

Not applicable.

Conflicts of Interest

The authors declare no conflict of interest.

References

  1. Tangcharoen, T.; Klysubun, W.; T-Thienprasert, J.; Kongmark, C. Cation exchange in Ni–Cu–Zn aluminate spinels revealed by EXAFS. J. Solid State Chem. 2020, 292, 121695. [Google Scholar] [CrossRef]
  2. Ali, A.A.; El Fadaly, E.; Ahmed, I.S. Near-infrared reflecting blue inorganic nano-pigment based on cobalt aluminate spinel via combustion synthesis method. Dye. Pigment. 2018, 158, 451–462. [Google Scholar] [CrossRef]
  3. Álvarez-Docio, C.M.; Portela, R.; Reinosa, J.J.; Rubio-Marcos, F.; Pascual, L.; Fernández, J.F. Performance and stability of wet-milled CoAl2O4, Ni/CoAl2O4, and Pt,Ni/CoAl2O4 for soot combustion. Catalysts 2020, 10, 406. [Google Scholar] [CrossRef]
  4. Suguna, S.; Shankar, S.; Jaganathan, S.K.; Manikandan, A. Novel synthesis and characterization studies of spinel NixCo1−xAl2O4 (x = 0.0 to 1.0) nano-catalysts for the catalytic oxidation of benzyl alcohol. J. Nanosci. Nanotechnol. 2018, 18, 1019–1026. [Google Scholar] [CrossRef]
  5. Boudiaf, S.; Nasrallah, N.; Mellal, M.; Belabed, C.; Belhamdi, B.; Meziani, D.; Mehdi, B.; Trari, M. Synthesis and characterization of semiconductor CoAl2O4 for optical and dielectric studies: Application to photodegradation of organic pollutants under visible light. Optik 2020, 219, 165038. [Google Scholar] [CrossRef]
  6. Gaudonn, M.; Robertson, L.C.; Lataste, E.; Duttine, M.; Ménétrier, M.; Demourgues, A. Cobalt and nickel aluminate spinels: Blue and cyan pigments. Ceram. Int. 2014, 40, 5201–5207. [Google Scholar] [CrossRef]
  7. Yancheshmeh, M.S.; Sahraei, O.A.; Aissaoui, M.; Iliuta, M.C. A novel synthesis of NiAl2O4 spinel from a Ni-Al mixed-metal alkoxide as a highly efficient catalyst for hydrogen production by glycerol steam reforming. Appl. Catal. B 2020, 265, 118535. [Google Scholar] [CrossRef]
  8. Rahimi-Nasrabadi, M.; Ahmadi, F.; Eghbali-Arani, M. Different morphologies fabrication of NiAl2O4 nanostructures with the aid of new template and its photocatalyst application. J. Mater. Sci. Mater. Electron. 2017, 28, 2415–2420. [Google Scholar] [CrossRef]
  9. Rahman, M.A.; Faruque, M.R.I.; Islam, M.T. Preparation of flexible substrate for patch antenna based on nickel aluminate (NiAl2O4) synthesized by sol–gel method. J. Electron. Mater. 2019, 48, 2932–2939. [Google Scholar] [CrossRef]
  10. Irshad, A.; Shahid, M.; El-Bahy, S.M.; El Azab, I.H.; Mersal, G.A.M.; Ibrahim, M.M.; Agboola, P.O.; Shakir, I. Nickel doped CoAl2O4@CNT nanocomposite: Synthesis, characterization, and evaluation of sunlight driven catalytic studies. Phys. B Condens. Matter 2022, 636, 413873. [Google Scholar] [CrossRef]
  11. Roniboss, A.; Subramani, A.; Ramamoorthy, R.; Yuvaraj, S.; Sundararajan, M.; Dash, C.S. Investigation of structural, optical and magnetic behavior of MAl2O4 (M=Zn and Co) nanoparticles via microwave combustion technique. Mater. Sci. Semicond. Process. 2021, 123, 105507. [Google Scholar] [CrossRef]
  12. Deraz, N.M. Formation and characterization of cobalt aluminate nano-particles. Int. J. Electrochem. Sci. 2013, 8, 4036–4046. [Google Scholar] [CrossRef]
  13. Zhao, S.; Guo, J.; Li, W.; Guo, H.; You, B. Fabrication of cobalt aluminate nanopigments by coprecipitation method in threonine waterborne solution. Dye. Pigment. 2018, 151, 130–139. [Google Scholar] [CrossRef]
  14. Akika, F.Z.; Benamira, M.; Lahmar, H.; Tibera, A.; Chabi, R.; Avramova, I.; Suzer, Ş.; Trari, M. Structural and optical properties of Cu-substitution of NiAl2O4 and their photocatalytic activity towards Congo red under solar light irradiation. J. Photochem. Photobiol. A 2018, 364, 542–550. [Google Scholar] [CrossRef]
  15. Srisawad, N.; Chaitree, W.; Mekasuwandumrong, O.; Praserthdam, P.; Panpranot, J. Formation of CoAl2O4 nanoparticles via low-temperature solid-state reaction of fine gibbsite and cobalt precursor. J. Nanomater. 2012, 2012, 108369. [Google Scholar] [CrossRef]
  16. Laguna-Bercero, M.A.; Sanjuan, M.L.; Merino, R.I. Raman spectroscopic study of cation disorder in poly- and single crystals of the nickel aluminate spinel. J. Phys. Condens. Matter. 2007, 19, 186217. [Google Scholar] [CrossRef]
  17. Kim, J.-H.; Son, B.-R.; Yoon, D.-H.; Hwang, K.-T.; Noh, H.-G.; Cho, W.-S.; Kim, U.-S. Characterization of blue CoAl2O4 nano-pigment synthesized by ultrasonic hydrothermal method. Ceram. Int. 2012, 38, 5707–5712. [Google Scholar] [CrossRef]
  18. Aghaali, M.H.; Firoozi, S. Enhancing the catalytic performance of Co substituted NiAl2O4 spinel by ultrasonic spray pyrolysis method for steam and dry reforming of methane. Int. J. Hydrogen Energy 2021, 46, 357–373. [Google Scholar] [CrossRef]
  19. Mindru, I.; Marinescu, G.; Gingasu, D.; Patron, L.; Ghica, C.; Giurginca, M. Blue CoAl2O4 spinel via complexation method. Mater. Chem. Phys. 2010, 122, 491–497. [Google Scholar] [CrossRef]
  20. Gingasu, D.; Patron, L.; Mindru, I.; Stanica, N.; Balint, I. Copper ferrite prepared by soft chemical method. Rev. Roum. Chim. 2004, 49, 669–674. [Google Scholar]
  21. Suciu, C.; Patron, L.; Mindru, I.; Carp, O. Nickel aluminate spinel by thermal decomposition of polynuclear malate complexes. Rev. Roum. Chim. 2006, 51, 385–389. [Google Scholar]
  22. Mitran, G.; Nguyen, T.L.P.; Seo, D.-K. The influence of complexing agents on the cobalt-based catalysts properties and activities. J. Ind. Eng. Chem. 2022, 114, 446–455. [Google Scholar] [CrossRef]
  23. Zhou, N.; Li, Y.; Zhang, Y.; Shu, Y.; Nian, S.; Cao, W.; Wu, Z. Synthesis and characterization of Co1−xCaxAl2O4 composite blue nanopigments by the polyacrylamide gel method. Dye. Pigment. 2018, 148, 25–30. [Google Scholar] [CrossRef]
  24. Jafari, M.; Hassanzadeh-Tabrizi, S.A.; Ghashang, M.; Pournajaf, R. Characterization of Ba2+-added alumina/cobalt nanoceramic pigment prepared by polyacrylamide gel method. Ceram. Int. 2014, 40, 11877–11881. [Google Scholar] [CrossRef]
  25. De Souza, L.K.C.; Zamian, J.R.; Da Rocha Filho, G.N.; Soledade, L.E.B.; Dos Santos, I.M.G.; Souza, A.G.; Scheller, T.; Angelica, R.S.; Da Costa, C.E.F. Blue pigments based on CoxZn1−xAl2O4 spinels synthesized by the polymeric precursor method. Dye. Pigment. 2009, 81, 187–192. [Google Scholar] [CrossRef]
  26. Kanithan, S.; Vignesh, N.A.; Baskar, S.; Nagaraja, S.; Abbas, M.; Aabid, A.; Baig, M. Structural, morphology and optical properties of strontium-doped cobalt aluminate nanoparticles synthesized by the combustion method. Materials 2022, 15, 8180. [Google Scholar] [CrossRef] [PubMed]
  27. Lu, Q.; Wei, Z.; Wu, X.; Huang, S.; Ding, M.; Ma, J. Electronic structure and optical properties of spinel structure Zn1−xNixAl2O4 nanopowders synthesized by sol–gel method. Chem. Phys. Lett. 2021, 772, 138582. [Google Scholar] [CrossRef]
  28. Patil, P.S.; Dhivare, R.S.; Mirgane, S.R.; Pawar, B.G.; Mane, T.R. Cobalt-Doped Nickel Aluminate Nanomaterials Synthesis, Characterization, and Catalytic Properties. Macromol. Symp. 2020, 393, 2000163. [Google Scholar] [CrossRef]
  29. Max, J.-J.; Chapados, C. Infrared Spectroscopy of Aqueous Carboxylic Acids: Malic Acid. J. Phys. Chem. A 2002, 106, 6452–6461. [Google Scholar] [CrossRef]
  30. Lever, A.B.P. Inorganic Electronic Spectroscopy; Elsevier Publishing Company: Amsterdam, The Netherlands, 1968. [Google Scholar]
  31. Rotan, M.; Tolchard, J.; Rytter, E.; Einarsrud, M.-A.; Grande, T. On the solid solution of the spinel phase in the system NiO–Al2O3. J. Solid State Chem. 2009, 182, 3412–3415. [Google Scholar] [CrossRef]
  32. Chokkaram, S.; Srinivasan, R.; Milburn, D.R.; Davis, B.H. Conversion of 2-octanol over nickel-alumina, cobalt-alumina, and alumina catalysts. J. Mol. Catal A 1997, 121, 157–169. [Google Scholar] [CrossRef]
  33. Shamsi, A.; Hashemian, S. Structural, magnetic and adsorptive properties of nano spinel of cobalt aluminate doped with nickel for Cr(VI) removal. J. Mol. Struct. 2022, 1255, 132412. [Google Scholar] [CrossRef]
  34. Gholami, T.; Salavati-Niasari, M.; Varshoy, S. Electrochemical hydrogen storage capacity and optical properties of NiAl2O4/NiO nanocomposite synthesized by green method. Int. J. Hydrogen Energy 2017, 42, 5235–5245. [Google Scholar] [CrossRef]
  35. Kock, L.D.; De Waal, D. Raman studies of the underglaze blue pigment on ceramic artefacts of the Ming dynasty and of unknown origins. J. Raman Spectrosc. 2007, 38, 1480–1487. [Google Scholar] [CrossRef]
  36. Bouchard, M.; Gambardella, A. Raman microscopy study of synthetic cobalt blue spinels used in the field of art. J. Raman Spectrosc. 2010, 41, 1477–1485. [Google Scholar] [CrossRef]
  37. D’Ippolito, V.; Andreozzi, G.B.; Bersani, D.; Lottici, P.P. Raman fingerprint of chromate, aluminate and ferrite spinels. J. Raman Spectrosc. 2015, 46, 1255–1264. [Google Scholar] [CrossRef]
  38. Visinescu, D.; Papa, F.; Ianculescu, A.C.; Balint, I.; Carp, O. Nickel-doped zinc aluminate oxides: Starch-assisted synthesis, structural, optical properties, and their catalytic activity in oxidative coupling of methane. J. Nanoparticle Res. 2013, 15, 1456. [Google Scholar] [CrossRef]
  39. Goga, F.; Bortnic, R.A.; Avram, A.; Zagrai, M.; Tudoran, L.B.; Mereu, R.A. The effect of Ni2+ ions substitution on structural, morphological, and optical properties in CoCr2O4 matrix as pigments in ceramic glazes. Materials 2022, 15, 8713. [Google Scholar] [CrossRef] [PubMed]
  40. Gao, H.; Yang, H.; Wang, S.; Li, D.; Wang, F.; Fang, L.; Lei, L.; Xiao, Y.; Yang, G. A new route for the preparation of CoAl2O4 nanoblue pigments with high uniformity and its optical properties. J. Sol-Gel Sci. Technol. 2018, 86, 206–216. [Google Scholar] [CrossRef]
  41. Motelica, L.; Oprea, O.-C.; Vasile, B.-S.; Ficai, A.; Ficai, D.; Andronescu, E.; Holban, A.M. Antibacterial activity of solvothermal obtained ZnO nanoparticles with different morphology and photocatalytic activity against a dye mixture: Methylene Blue, Rhodamine B and Methyl Orange. Int. J. Mol. Sci. 2023, 24, 5677. [Google Scholar] [CrossRef]
  42. Motelica, L.; Vasile, B.-S.; Ficai, A.; Surdu, A.-V.; Ficai, D.; Oprea, O.-C.; Andronescu, E.; Jinga, D.C.; Holban, A.M. Influence of the alcohols on the ZnO synthesis and its properties: The photocatalytic and antimicrobial activities. Pharmaceutics 2022, 14, 2842. [Google Scholar] [CrossRef]
  43. Agilandeswari, K.; Kumar, A.R. Synthesis, characterisation, optical and luminescence properties of CoAl2O4. AIP Conf. Proc. 2015, 1665, 120022. [Google Scholar] [CrossRef]
  44. Ahn, K.-S.; Yan, Y.; Kang, M.-S.; Kim, J.-Y.; Shet, S.; Wang, H.; Turner, J.; Al-Jassim, M. CoAl2O4–Fe2O3 p-n nanocomposite electrodes for photoelectrochemical cells. Appl. Phys. Lett. 2009, 95, 022116. [Google Scholar] [CrossRef]
  45. Islam, M.A.; Akther Hossain, A.K.M.; Ahsan, M.Z.; Bally, M.A.A.; Samir Ullah, M.; Hoque, S.M.; Khan, F.A. Structural characteristics, cation distribution, and elastic properties of Cr3+ substituted stoichiometric and non-stoichiometric cobalt ferrites. RSC Adv. 2022, 12, 8502–8519. [Google Scholar] [CrossRef]
  46. Bindu, P.; Thomas, S. Estimation of lattice strain in ZnO nanoparticles: X-ray peak profile analysis. J. Theor. Appl. Phys. 2014, 8, 123–134. [Google Scholar] [CrossRef]
  47. Ferreira, T.A.S.; Waerenborgh, J.C.; Mendonça, M.H.R.M.; Nunes, M.R.; Costa, F.M. Structural and morphological characterization of FeCo2O4 and CoFe2O4 spinels prepared by a coprecipitation method. Solid State Sci. 2003, 5, 383–392. [Google Scholar] [CrossRef]
  48. Shannon, R.D. Revised Effective Ionic Radii and Systematic Studies of Interatomie Distances in Halides and Chaleogenides. Acta Cryst. 1976, A32, 751–767. [Google Scholar] [CrossRef]
  49. Knyazev, A.V.; Demidov, D.N.; Knyazeva, S.S. High- and Low-Temperature X-Ray Diffraction Studies of Aluminate Spinels in the CoAl2O4–NiAl2O4 System. Inorg. Mater. 2017, 53, 190–199. [Google Scholar] [CrossRef]
  50. O’Neill, H.S.C.; Navrotsky, A. Cation distributions and thermodynamic properties of binary spinel solid solutions. Am. Min. 1984, 69, 733–753. [Google Scholar]
Figure 1. FTIR spectra of the malate precursors obtained from the (1−x)Co(NO3)2∙6H2O:xNi(NO3)2∙6H2O:2Al(NO3)3∙9H2O:4C4O5H42− systems.
Inorganics 11 00371 g001
Figure 2. Absorbance spectra of the malate precursors obtained from the (1−x)Co(NO3)2∙6H2O:xNi(NO3)2∙6H2O:2Al(NO3)3∙9H2O:4C4O5H42− systems.
Inorganics 11 00371 g002
Figure 3. Thermal analysis of the malate precursors obtained from the (1−x)Co(NO3)2·6H2O:xNi(NO3)2·6H2O:2Al(NO3)3·9H2O:4C4O5H42- systems.
Inorganics 11 00371 g003
Figure 4. XRD patterns of Co1−xNixAl2O4 (x = 0, 0.1, 0.25, 0.5, 0.75, 0.9, 1) samples obtained by thermal decomposition of malate precursors, calcined at 900 °C for 2 h.
Inorganics 11 00371 g004
Figure 5. SEM micrographs at different magnifications: 4000× (a,b); 40,000× (c,d) of the CoAl2O4 (a,c) and NiAl2O4 (b,d) powders obtained by thermal decomposition of malate precursors and calcined at 900 °C/2 h.
Inorganics 11 00371 g005
Figure 6. SEM micrographs (40,000×) of the Co1−xNixAl2O4 (x = 0.1, 0.25, 0.5, 0.75, 0.9) samples: Co0.9Ni0.1Al2O4 (a); Co0.75Ni0.25Al2O4 (b); Co0.5Ni0.5Al2O4 (c); Co0.25Ni0.75Al2O4 (d); Co0.1Ni0.9Al2O4 (e) obtained by thermal decomposition of malate precursors and calcined at 900 °C/2 h.
Inorganics 11 00371 g006
Figure 7. FTIR spectra of Co1−xNixAl2O4 samples obtained by thermal decomposition of malate precursors at 900 °C/2 h.
Inorganics 11 00371 g007
Figure 8. Raman spectrum of CoAl2O4 obtained by thermal decomposition of malate precursor at 900 °C/2 h.
Inorganics 11 00371 g008
Figure 9. Raman spectra of NiAl2O4 obtained by thermal decomposition of malate precursor at 900 °C/2 h.
Inorganics 11 00371 g009
Figure 10. Raman spectra of Co1−xNixAl2O4 (x = 0.1, 0.25, 0.5, 0.75, and 0.9) samples obtained by thermal decomposition of malate precursors at 900 °C/2 h.
Inorganics 11 00371 g010
Figure 11. Absorbance spectra of Co1−xNixAl2O4 samples obtained by thermal decomposition of malate precursors, calcined at 900 °C/2 h.
Inorganics 11 00371 g011
Figure 12. (a) The emission spectra for the Co1−xNixAl2O4 samples, obtained at excitation with λex = 305 nm; (b) Detail (zoom in the 600–700 nm interval) for the emission spectra for the Cox−1NixAl2O4 samples, obtained at excitation with λex = 305 nm.
Inorganics 11 00371 g012
Figure 13. The emission spectra for the Co1−xNixAl2O4 samples, obtained at excitation with λex = 305 nm, and excitation spectra for the maximum emission wavelength, λem = 455 nm, for the strongest fluorescent samples (x = 0 and x = 0.5).
Inorganics 11 00371 g013
Figure 14. Variation of fluorescence intensity for each Co1−xNixAl2O4 sample, at the maximum peak (393, 455 and 480 nm).
Inorganics 11 00371 g014
Figure 15. The proposed fluorescence mechanism for Co1−xNixAl2O4 samples [40].
Inorganics 11 00371 g015
Table 1. Principal data for the thermal analysis of the malate precursors obtained from the (1−x)Co(NO3)2·6H2O:xNi(NO3)2·6H2O:2Al(NO3)3·9H2O:4C4O5H42- systems.
SamplesMass Loss
RT–200 °C
Endo EffectMass Loss
200–360 °C
Mass Loss
360–550 °C
Exo EffectResidual Mass
x = 014.79%91.1 °C18.70%42.37%459.9 °C22.56%
x = 0.111.97%98.7 °C20.09%44.69%474.9 °C21.96%
x = 0.2512.89%106.2 °C22.61%42.35%469.9 °C21.18%
x = 0.512.82%97.9 °C17.55%44.47%459.4 °C24.01%
x = 0.759.68%101.1 °C26.52%43.20%455.0 °C19.18%
x = 0.911.41%107.0 °C35.17%34.81%453.3 °C18.04%
x = 111.72%112.0 °C17.77%46.58%465.9 °C22.96%
Table 2. The structural and microstructural parameters of Co1−xNixAl2O4 samples, obtained after thermal decomposition of malate precursors, calcined at 900 °C/2 h.
Co1−xNixAl2O4 SamplesMolar Mass
(g·mol−1)
Lattice Constant
(Å)
Unit Cell Volume
3)
Crystallite Size
(nm)
X-ray Density, ρx
(g·cm−3)
Dislocation Density, δ (Å−2)
x = 0176.98.1111533.6229184.403852.12 × 10−3
x = 0.1176.878.1091533.2342164.406312.32 × 10−3
x = 0.25176.8258.1047532.3666164.412372.30 × 10−3
x = 0.5176.758.0894529.3593124.435553.75 × 10−3
x = 0.75176.6758.0522522.087974.495421.53 × 10−2
x = 0.9176.638.0554522.710664.488921.48 × 10−2
x = 1176.68.0600523.606654.480481.89 × 10−2
Table 3. Various structural parameters of Co1−xNixAl2O4 samples, calculated according to the oxygen occupancy and the spinel degree of inversion.
Co1−xNixAl2O4 SamplesOxygen Occupancy, uDegree of Inversion, λBond LengthStructural RadiiAverage Cation Radii
dtdortro<rt><rt>
ÅÅÅÅÅÅ
x = 00.2645170.1981.96001.91730.58000.53730.542380.55579
x = 0.10.2633280.2081.94291.92530.56290.54530.538100.55626
x = 0.250.2566090.2831.84751.97410.46750.59410.520850.56276
x = 0.50.2602360.5021.89481.94310.51480.56310.477150.58080
x = 0.750.2527270.8641.78141.99130.40140.61130.412780.6079
x = 0.90.2518660.8721.77011.99890.39010.61890.410860.60497
x = 10.2515260.9181.76632.00280.38630.62280.403120.60614
Table 4. The lattice parameters and the mean crystallite size of single and mixed Co-Ni aluminates, obtained by different synthesis methods.
SampleSynthesis Method, Thermal TreatmentLattice Constant
(Å)
Crystallite Size
(nm)
Reference
CoAl2O4Microwave combustion8.12521.47[4]
CoAl2O4Polyacrylamide gel, 1000 °C/2 h-51[23]
Co0.8Ni0.2Al2O4Microwave combustion8.20220.59[4]
Co0.75Ni0.25Al2O4Sol–gel combustion, 900 °C8.1231.31[28]
Co0.5Ni0.5Al2O4Sol–gel, 900 °C-38[33]
Co0.25Ni0.75Al2O4Sol–gel combustion, 900 °C8.0122.26[28]
NiAl2O4Co-precipitation, 800 °C/5 h8.069220.70[14]
NiAl2O4Sol–gel, 450 °C8.04813[9]
NiAl2O4Microwave combustion8.12218.93[4]
Disclaimer/Publisher’s Note: The statements, opinions and data contained in all publications are solely those of the individual author(s) and contributor(s) and not of MDPI and/or the editor(s). MDPI and/or the editor(s) disclaim responsibility for any injury to people or property resulting from any ideas, methods, instructions or products referred to in the content.

