Article

Effect of Multiple Doping Elements on Polarity Switching of Polycrystalline SnSe Semiconductor

1
Faculty of Materials, Metallurgy and Recycling, Technical University of Košice, Letná 9, 042 00 Košice, Slovakia
2
Institute of Materials Research Slovak Academy of Science, Watsonova 47, 040 01 Košice, Slovakia
3
Faculty of Electrical Engineering and Informatics, Technical University of Košice, Letná 9, 042 00 Košice, Slovakia
*
Author to whom correspondence should be addressed.
Inorganics 2024, 12(4), 103; https://doi.org/10.3390/inorganics12040103
Submission received: 29 February 2024 / Revised: 28 March 2024 / Accepted: 2 April 2024 / Published: 5 April 2024
(This article belongs to the Special Issue Advances of Thermoelectric Materials)

Abstract

:
Material selection for thermoelectric modules and generators presents a considerable challenge. In commercially available thermoelectric generators, alloys with a high percentage of doping element are used to achieve different semiconductor polarity. This introduces mechanical stresses to the system due to the varying thermal expansion rates. Previous studies have demonstrated that the semiconductor polarity of SnSe alloys can be altered through Sb or Bi doping. This paper outlines a modified, scalable and cost-effective direct synthesis process for SnSe alloys, employing Sb, Bi, Ag, Ni, In and Mg as dopants. Polarity switching in the synthesized materials was observed with Bi doping, occurring in similar regions as observed with monocrystalline Sb. Additionally, In doping led to a significant increase in the Seebeck coefficient. Doping elements exhibited minimal influence on the crystal lattice of the material, with only minor shifts in lattice parameters noted. Crystallography analysis revealed a significant preferred orientation, consistent with the material’s documented propensity to form and align in layers, a characteristic observable even to the naked eye and confirmed through optical and electron microscopy. Furthermore, we have developed and thoroughly calibrated an in-house apparatus for determining the Seebeck coefficient of thermoelectric materials, based on the already published methodology, which describes a method for determining the electrical conductivity of disk- and rod-shaped samples.

1. Introduction

Thermoelectric materials facilitate the reversible conversion between thermal and electrical energy. Although known for two centuries, their widespread application has been limited to niche sectors such as Radioactive Thermoelectric Generators (RTGs) in space missions [1,2]. These materials offer specific advantages, including reliable and predictable power generation, absence of moving parts, no maintenance requirements and light-weight construction [3,4,5]. However, their main drawback lies in their relatively low conversion efficiency compared to other energy generation methods [4]. Efficiency in thermoelectric materials is quantified by the dimensionless figure of merit (ZT), defined as: ZT = (S2σ/κ)T, where S, σ and κ represent the Seebeck coefficient, the electrical conductivity and the thermal conductivity, respectively [6,7,8,9,10]. These parameters are interrelated, necessitating careful balancing to achieve higher efficiency [3,7,11]. Additionally, selecting more abundant elements can help improve manufacturing costs, thus enabling wider applications [9,10].
SnSe, a stable semiconductor with a band gap of 0.9–1.0 eV, exhibits p-type polarity in both its mono and polycrystalline forms [3,11,12]. Composed of abundant elements, it arranges in layers with an orthorhombic unit cell, resulting in high anisotropy [3,6,7,8,9,10,11]. SnSe shows great promise for thermoelectric use with the highest known ZT value of 2.6 along one axis in monocrystals at 923 K. This is primarily due to its intrinsically low thermal conductivity [3,6,9,10]. SnSe undergoes phase transition from Pnma to Cmcm space group at ~750 K, accompanied by a significant reduction in thermal conductivity [10]. However, to be viable in thermoelectric modules, materials with n-type polarity are also required. Doping, which replaces either Sn or Se, has been utilized to achieve this [3,6,9,10]. The most promising dopants include Bi, with reported n-type polarity in both mono- and polycrystalline materials, and Sb, with n-polarity reported in monocrystals [3,11,12,13]. Other elements such as alkali metals, halogens, lead and others have been tried with varying success [14,15,16].
While monocrystalline materials face challenges in their future large-scale application due to difficulties with crystal growth, bulk polycrystal are easier to manufacture on a large scale. However, additional grain boundaries in polycrystals reduce electrical conductivity, which should in turn decrease thermal conductivity [17,18]. Yet in polycrystalline SnSe, thermal conductivity can increase. This occurs because of SnO which is present on the Sn surface before synthesis. This oxide moves to the grain boundaries after synthesis and acts as pathways for phonons. Special treatment of Sn can be used to mitigate this effect. [19]. ZT values of 0.5 have been observed for polycrystalline SnSe at 850 K and up to 0.6 for Ag-doped material at 750 K. Similarly, in the search for n-type materials, other dopants and doping techniques are being explored to enhance the thermoelectric performance of these bulk polycrystals [16,19].
In this study, we synthesized polycrystalline SnSe alloys doped with the following elements: Sb, Bi, Ag, Ni, Mg and In, replacing Sn. Doping element concentration ranged from 0.5 to 10 atomic %. A modified direct solid-state synthesis route has been used to prepare the materials. The typical sintering temperature of 500 °C has also been increased to 650 °C, and the effects of different sintering temperatures on material density and mechanical properties were examined [12,19,20]. Additionally, the materials were characterized using electron microscopy and X-ray diffraction.

2. Results and Discussion

The powders for the doped SnSe materials were weighed according to the Sn(1-N)Me(N)Se(1) ratio (where Me represents a single dopant and N denotes the doping percentage). Our primary aim was to target the region where polarity switching had been reported in the Sb-doped monocrystal. Additionally, pure SnSe was synthesized for comparison purposes. Upon synthesis, the polycrystalline SnSe and doped alloys exhibited a silvery metallic color after polishing and demonstrated a propensity to separate into layers akin to graphite. This posed a significant challenge during sample preparation for optical microscopy, as some pieces tended to separate and scratch the surface even when using satin sheets for polishing. Alloys individually doped with varying concentrations of elements Sb, Bi, Ag, Ni, Mg and In were successfully prepared. Doping with Ga was attempted, but drops of Ga remained afloat on the SnSe melts surface and, therefore, did not incorporate into the bulk structure properly.

2.1. Spark Plasma Sintering

Before commencing the spark plasma sintering (SPS) of doped materials, we decided to optimize the sintering process due to inconsistent results observed in the initial batch of samples doped with Bi. The initial samples were sintered at 500 °C, following the procedure outlined by Yamamoto [12]. The density of pure SnSe sintered at 500 °C was only 5.558 g/cm3, which equated to 89.95% of the theoretical maximum density of 6.179 g/cm3. The recommended temperature for SPS is approximately 80% of the material’s melting temperature. Therefore, we selected 600 and 650 °C to get closer to the 80% of 861 °C melting point of pure SnSe [21]. Sintered samples were mechanically snapped into two pieces after determining their density. Upon closer examination of the broken regions using the electron microscope, we identified regions of loose, unincorporated particles in samples sintered at both 500 °C and 600 °C (Figure 1c). Increasing the sintering temperature to 600 °C improved the density to 5.778 g/cm3 (93.52%), and further increasing it to 650 °C resulted in a density of 5.940 g/cm3 (96.13%). Unincorporated particles were no longer observed in the sample sintered at 650 °C (Figure 1d). However, the samples doped with the highest amount of Ag and In experienced a small spill during sintering at 650 °C, suggesting that further increases in temperature may not be suitable for all doping elements. In addition to the density increase, mechanical properties also improved with the rise in sintering temperature, as depicted in Figure 2. Unfortunately, the Sb5 sample was lost during a malfunction of the SPS equipment, and due to unsatisfactory results, it was not remade.

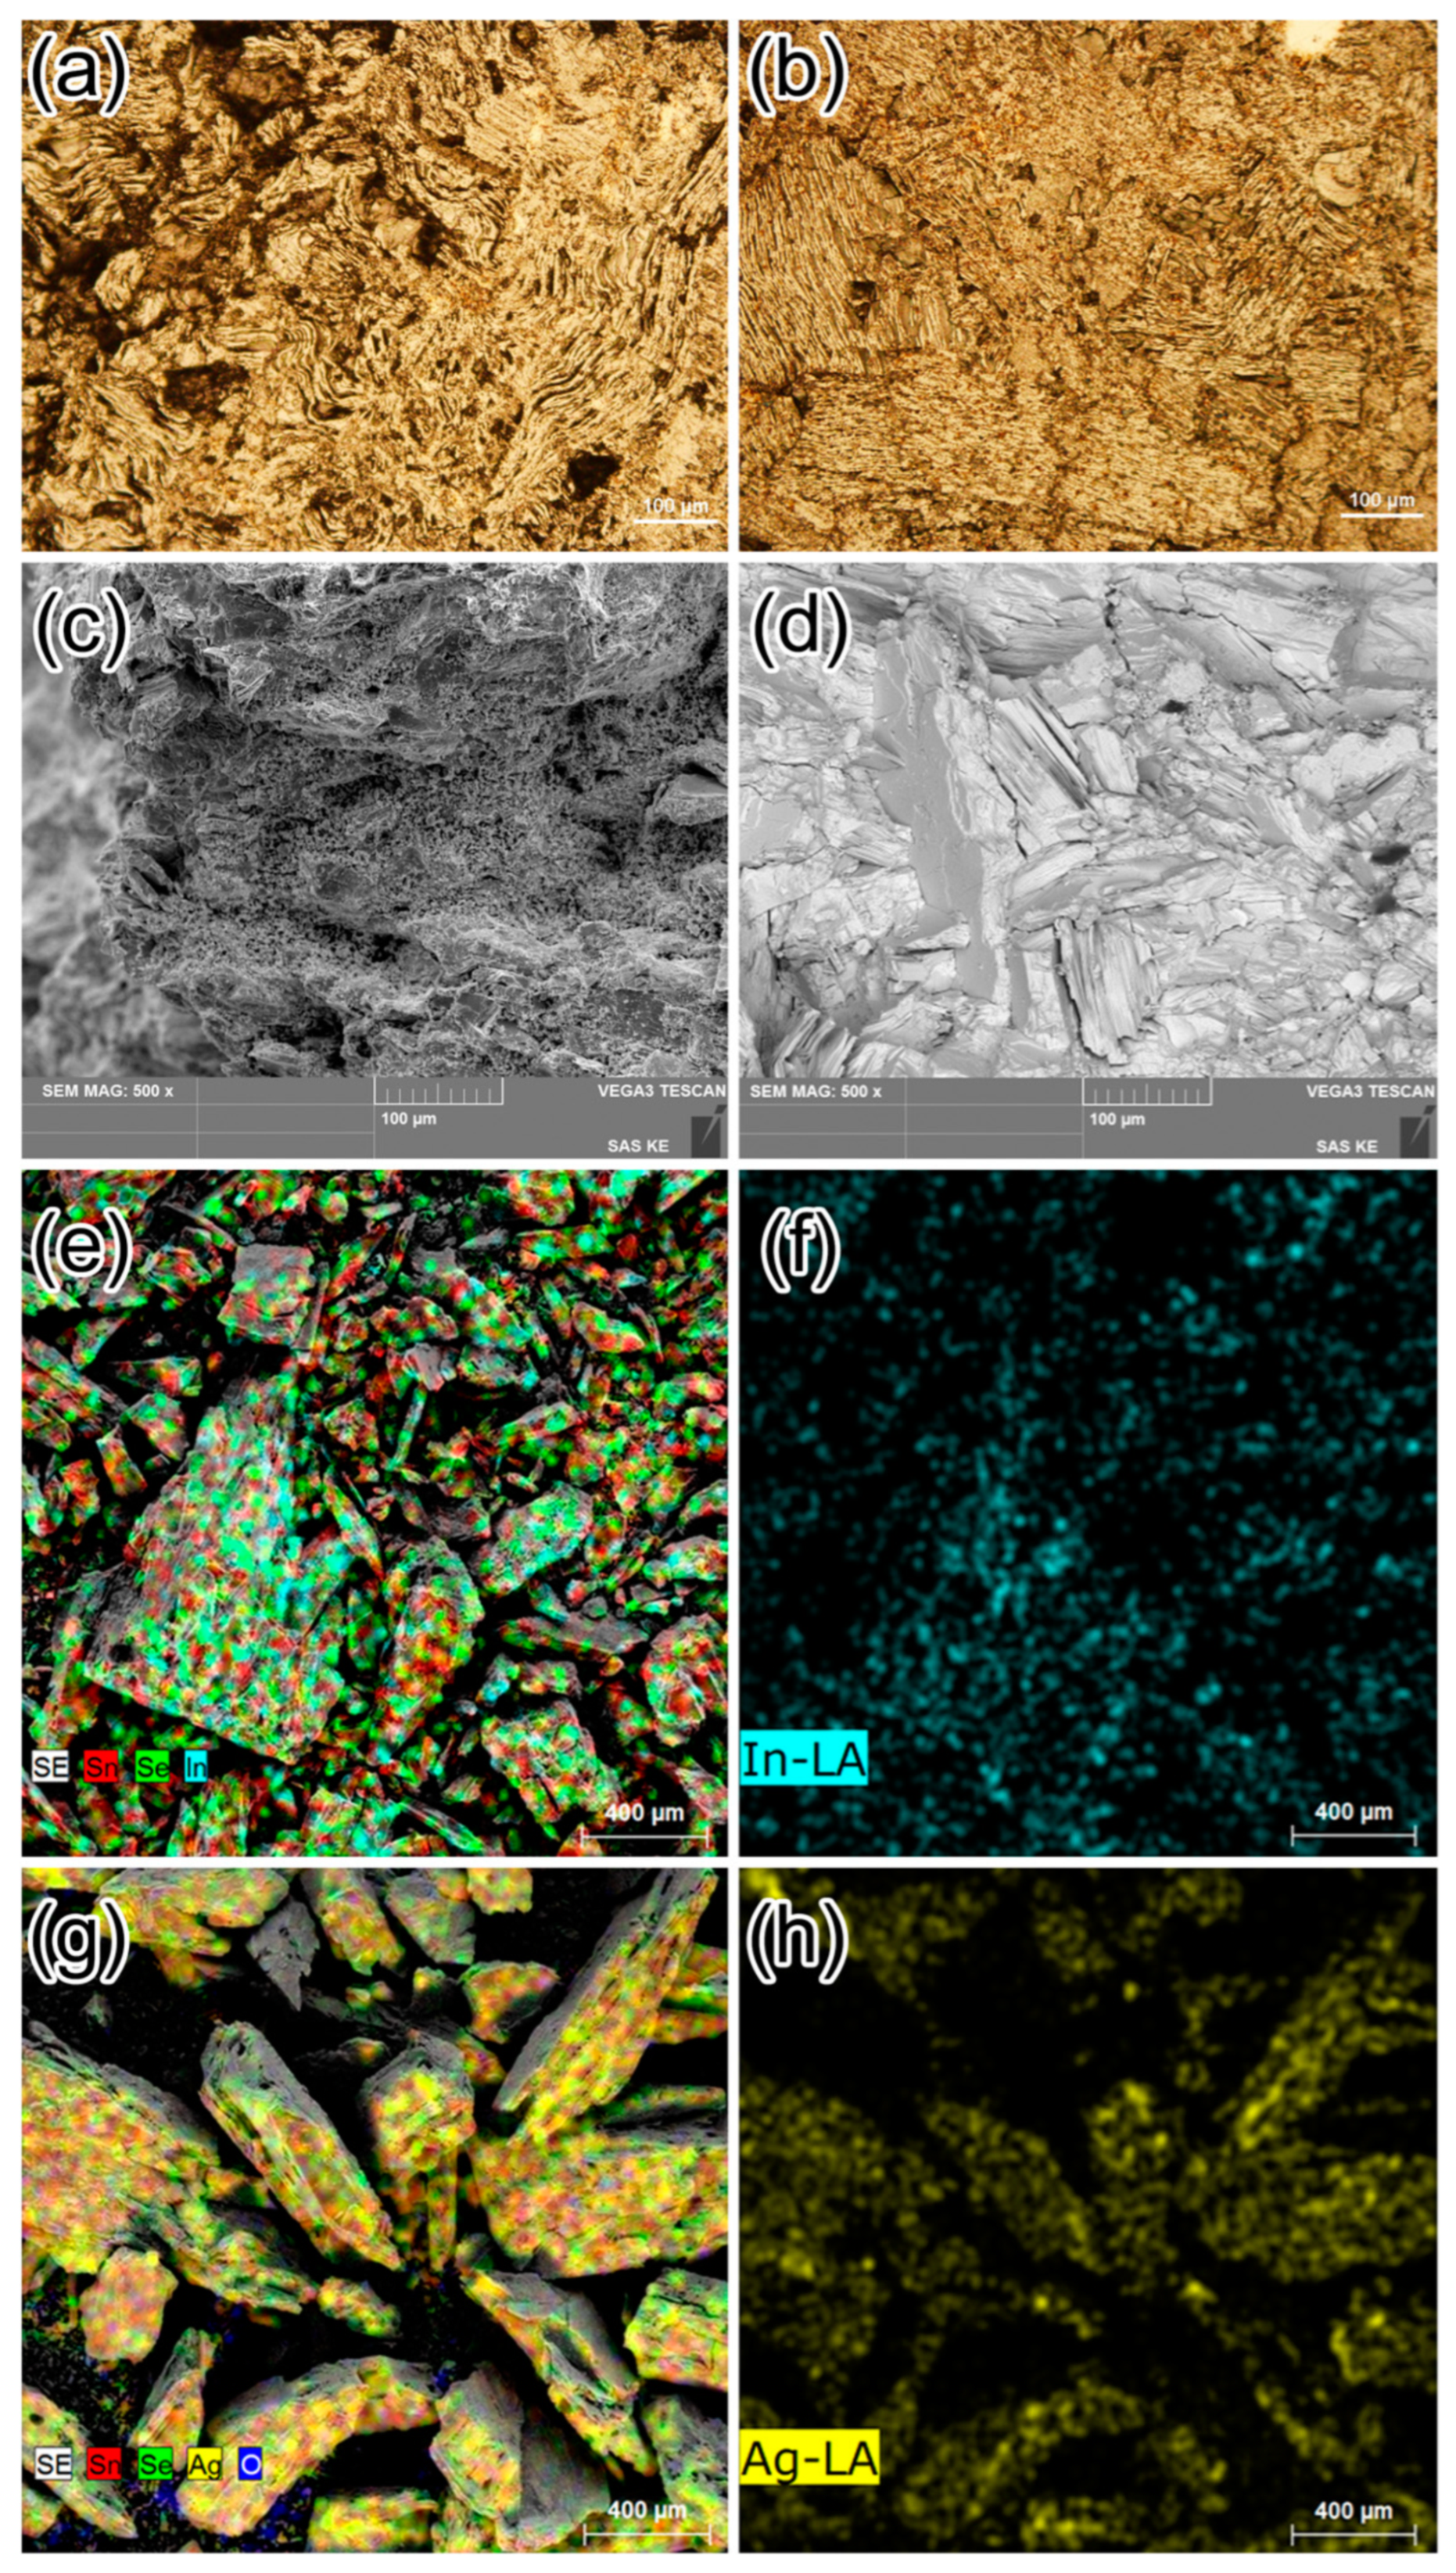
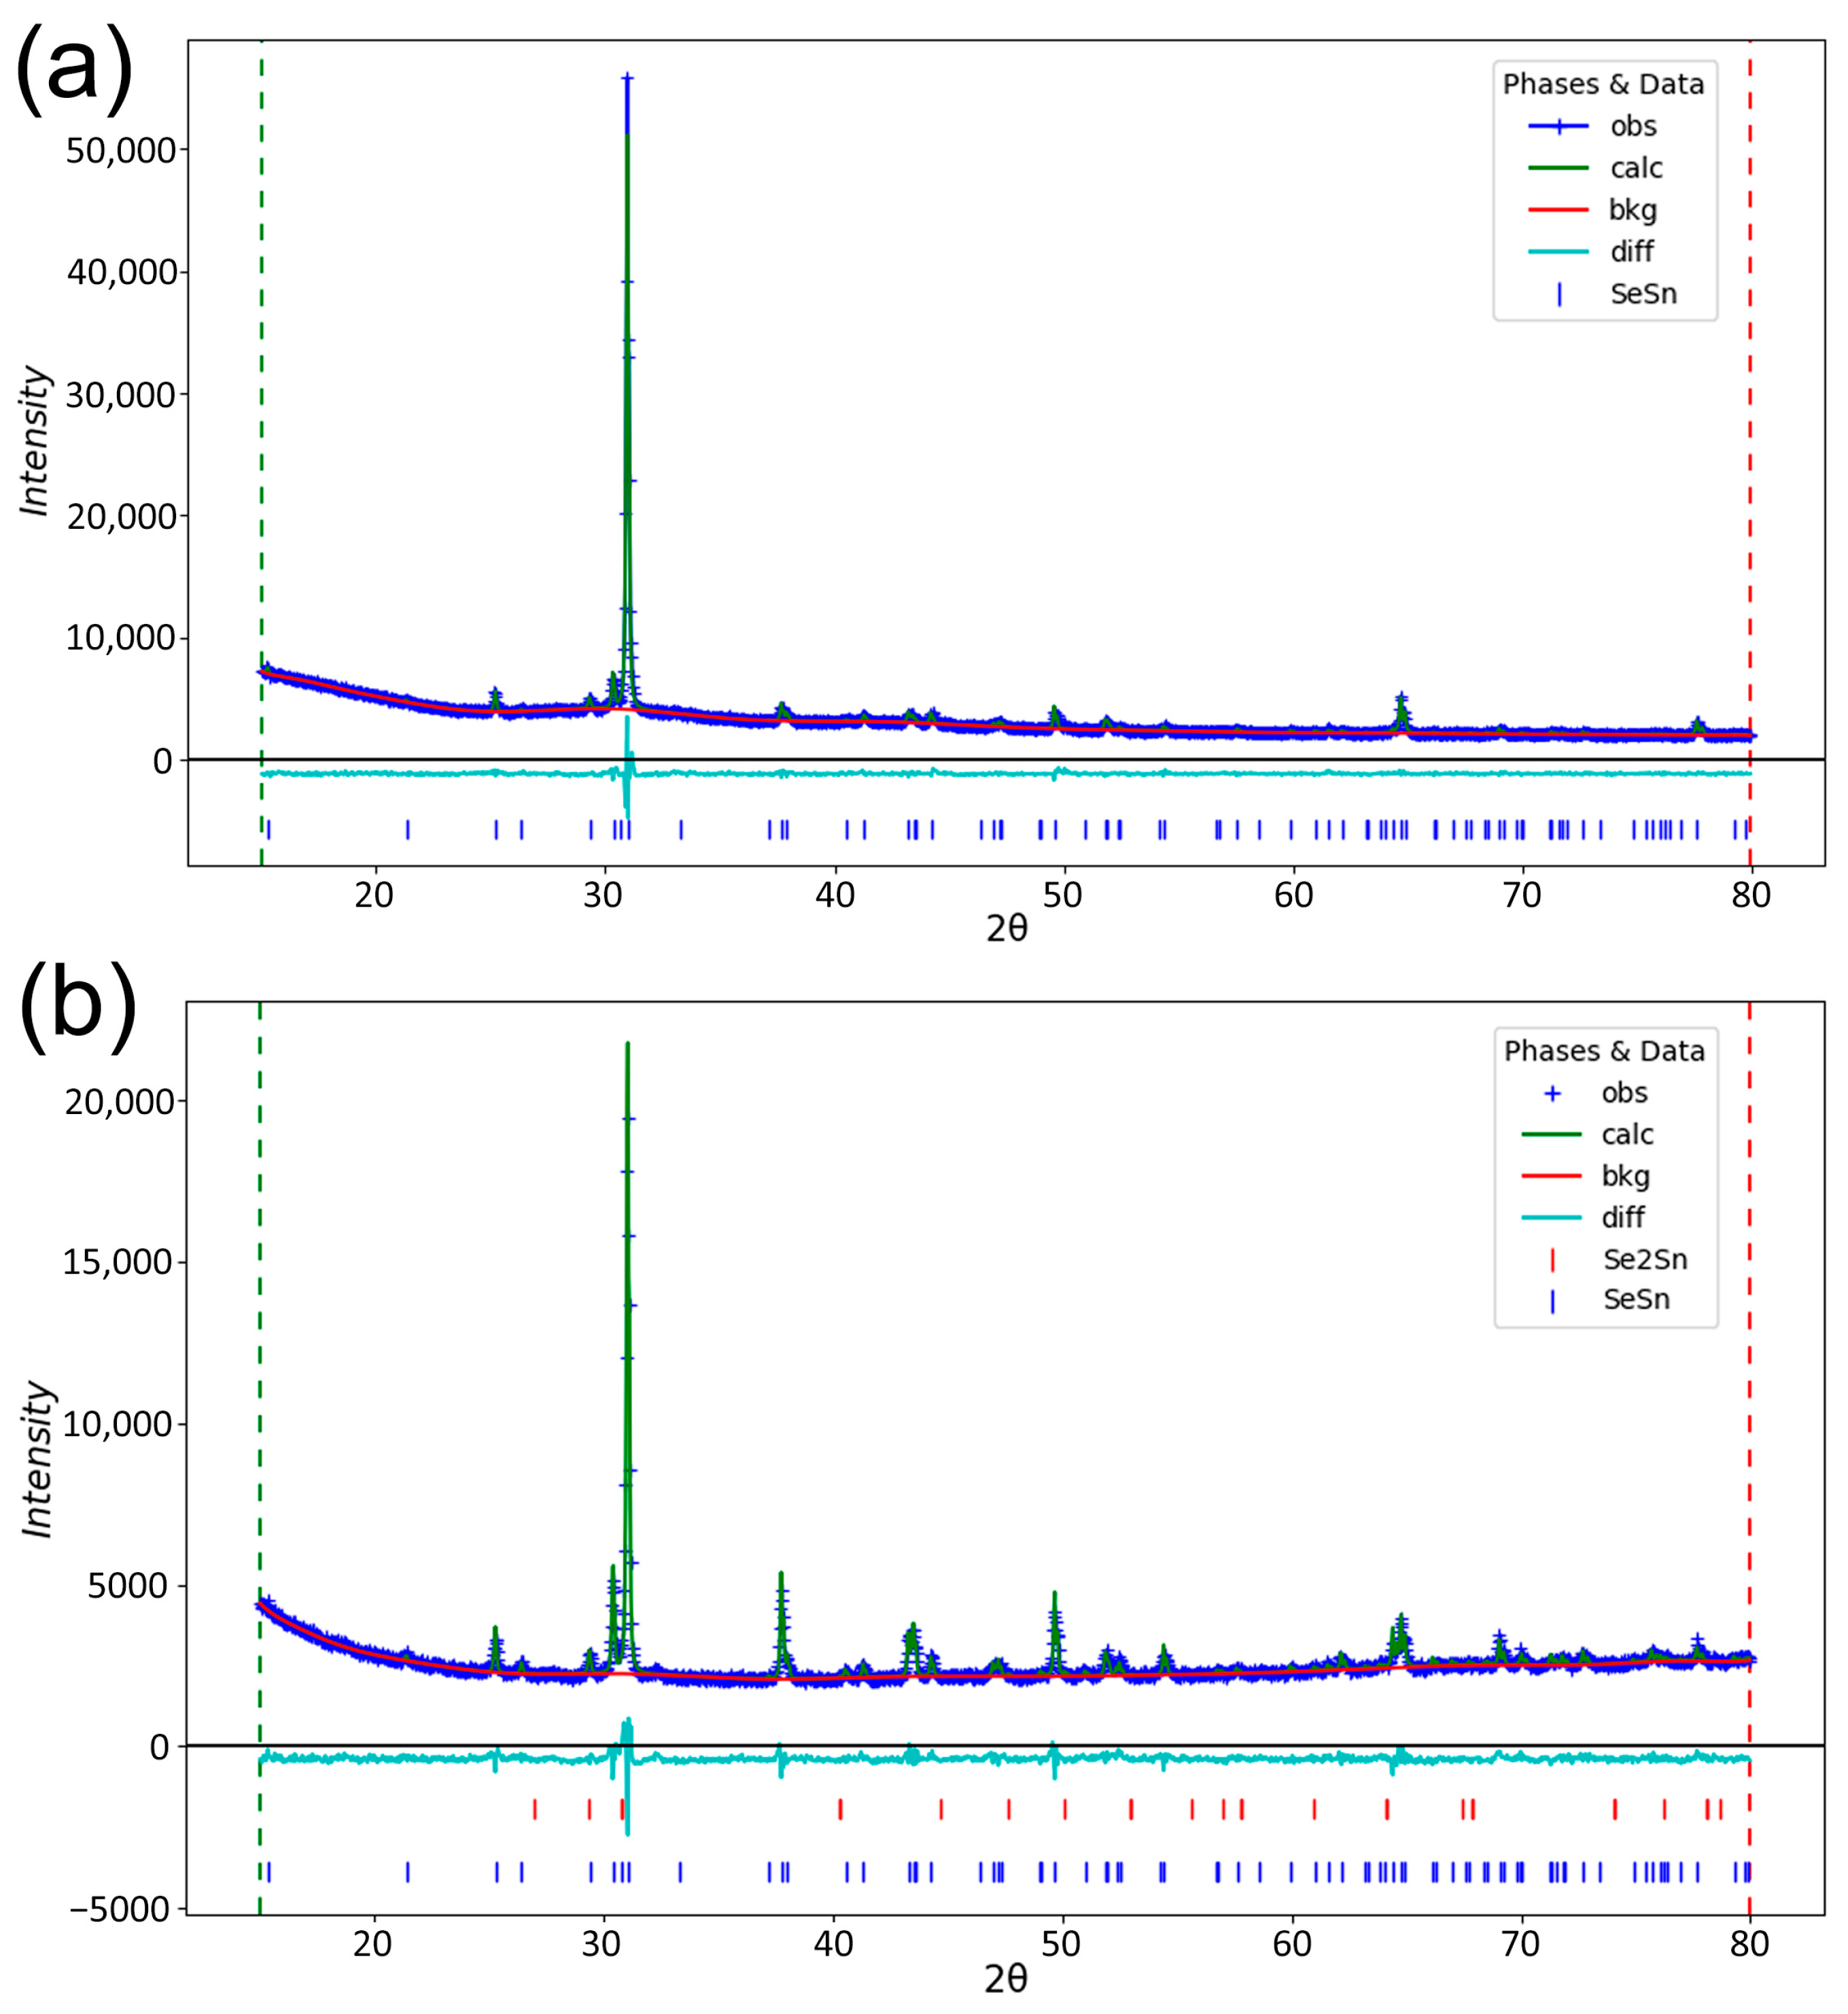
2.2. Electron Microscopy and X-ray Diffraction

The chemical composition of each prepared composition was verified using energy-dispersive X-ray spectroscopy (EDS) analysis (Table 1), and the distribution of elements was confirmed with mapping. Elements were evenly distributed in every composition, and no grouping was observed. Discrepancies in the composition are attributed to the large particle size of the crushed melts and variations in the composition of the particle surfaces. Finer powders could not be prepared because the material began to form a film rather than being crushed into smaller pieces. Additionally, for Ag, the loss can be attributed to the very low solubility of silver in SnSe [22,23,24]. Increased SnO formation is attributed to the higher-than-expected percentage of dopant present in Bi- and Mg-doped materials. Sn was removed from the material in its oxide form, therefore increasing the dopant concentration. This oxide has formed from residual oxygen left even after three argon flushes. When doping with Mg, it was also observed that the dopant was concentrating on the surface. Craters that were present on the powder particles allowed for EDS analysis deeper into the material, showing lower concentrations of dopant inside the craters than on the surface of the particles, a possible cause for higher-than-expected Mg concentrations when using surface EDS.
The same powders examined under the electron microscope were used for XRD. Despite imperfections in the chemical composition, XRD analysis confirmed the majority orthorhombic SnSe phase in every material. Rietveld refinement was used to determine the basic unit cell parameters of the SnSe phase (Figure 3). Materials doped with Mg, Ni, and some with Bi contained only this phase. Other materials also had a minor trigonal SnSe2 phase present. Due to negligible changes in the unit cell parameters (Table 1) caused by the dopants, we are led to believe that the dopants were not incorporated into the unit cell, but instead are individually and evenly spread throughout the material, affecting the bulk properties. XRD data also revealed a strong tendency of SnSe for layer arrangement, with a significant preferred orientation observed.

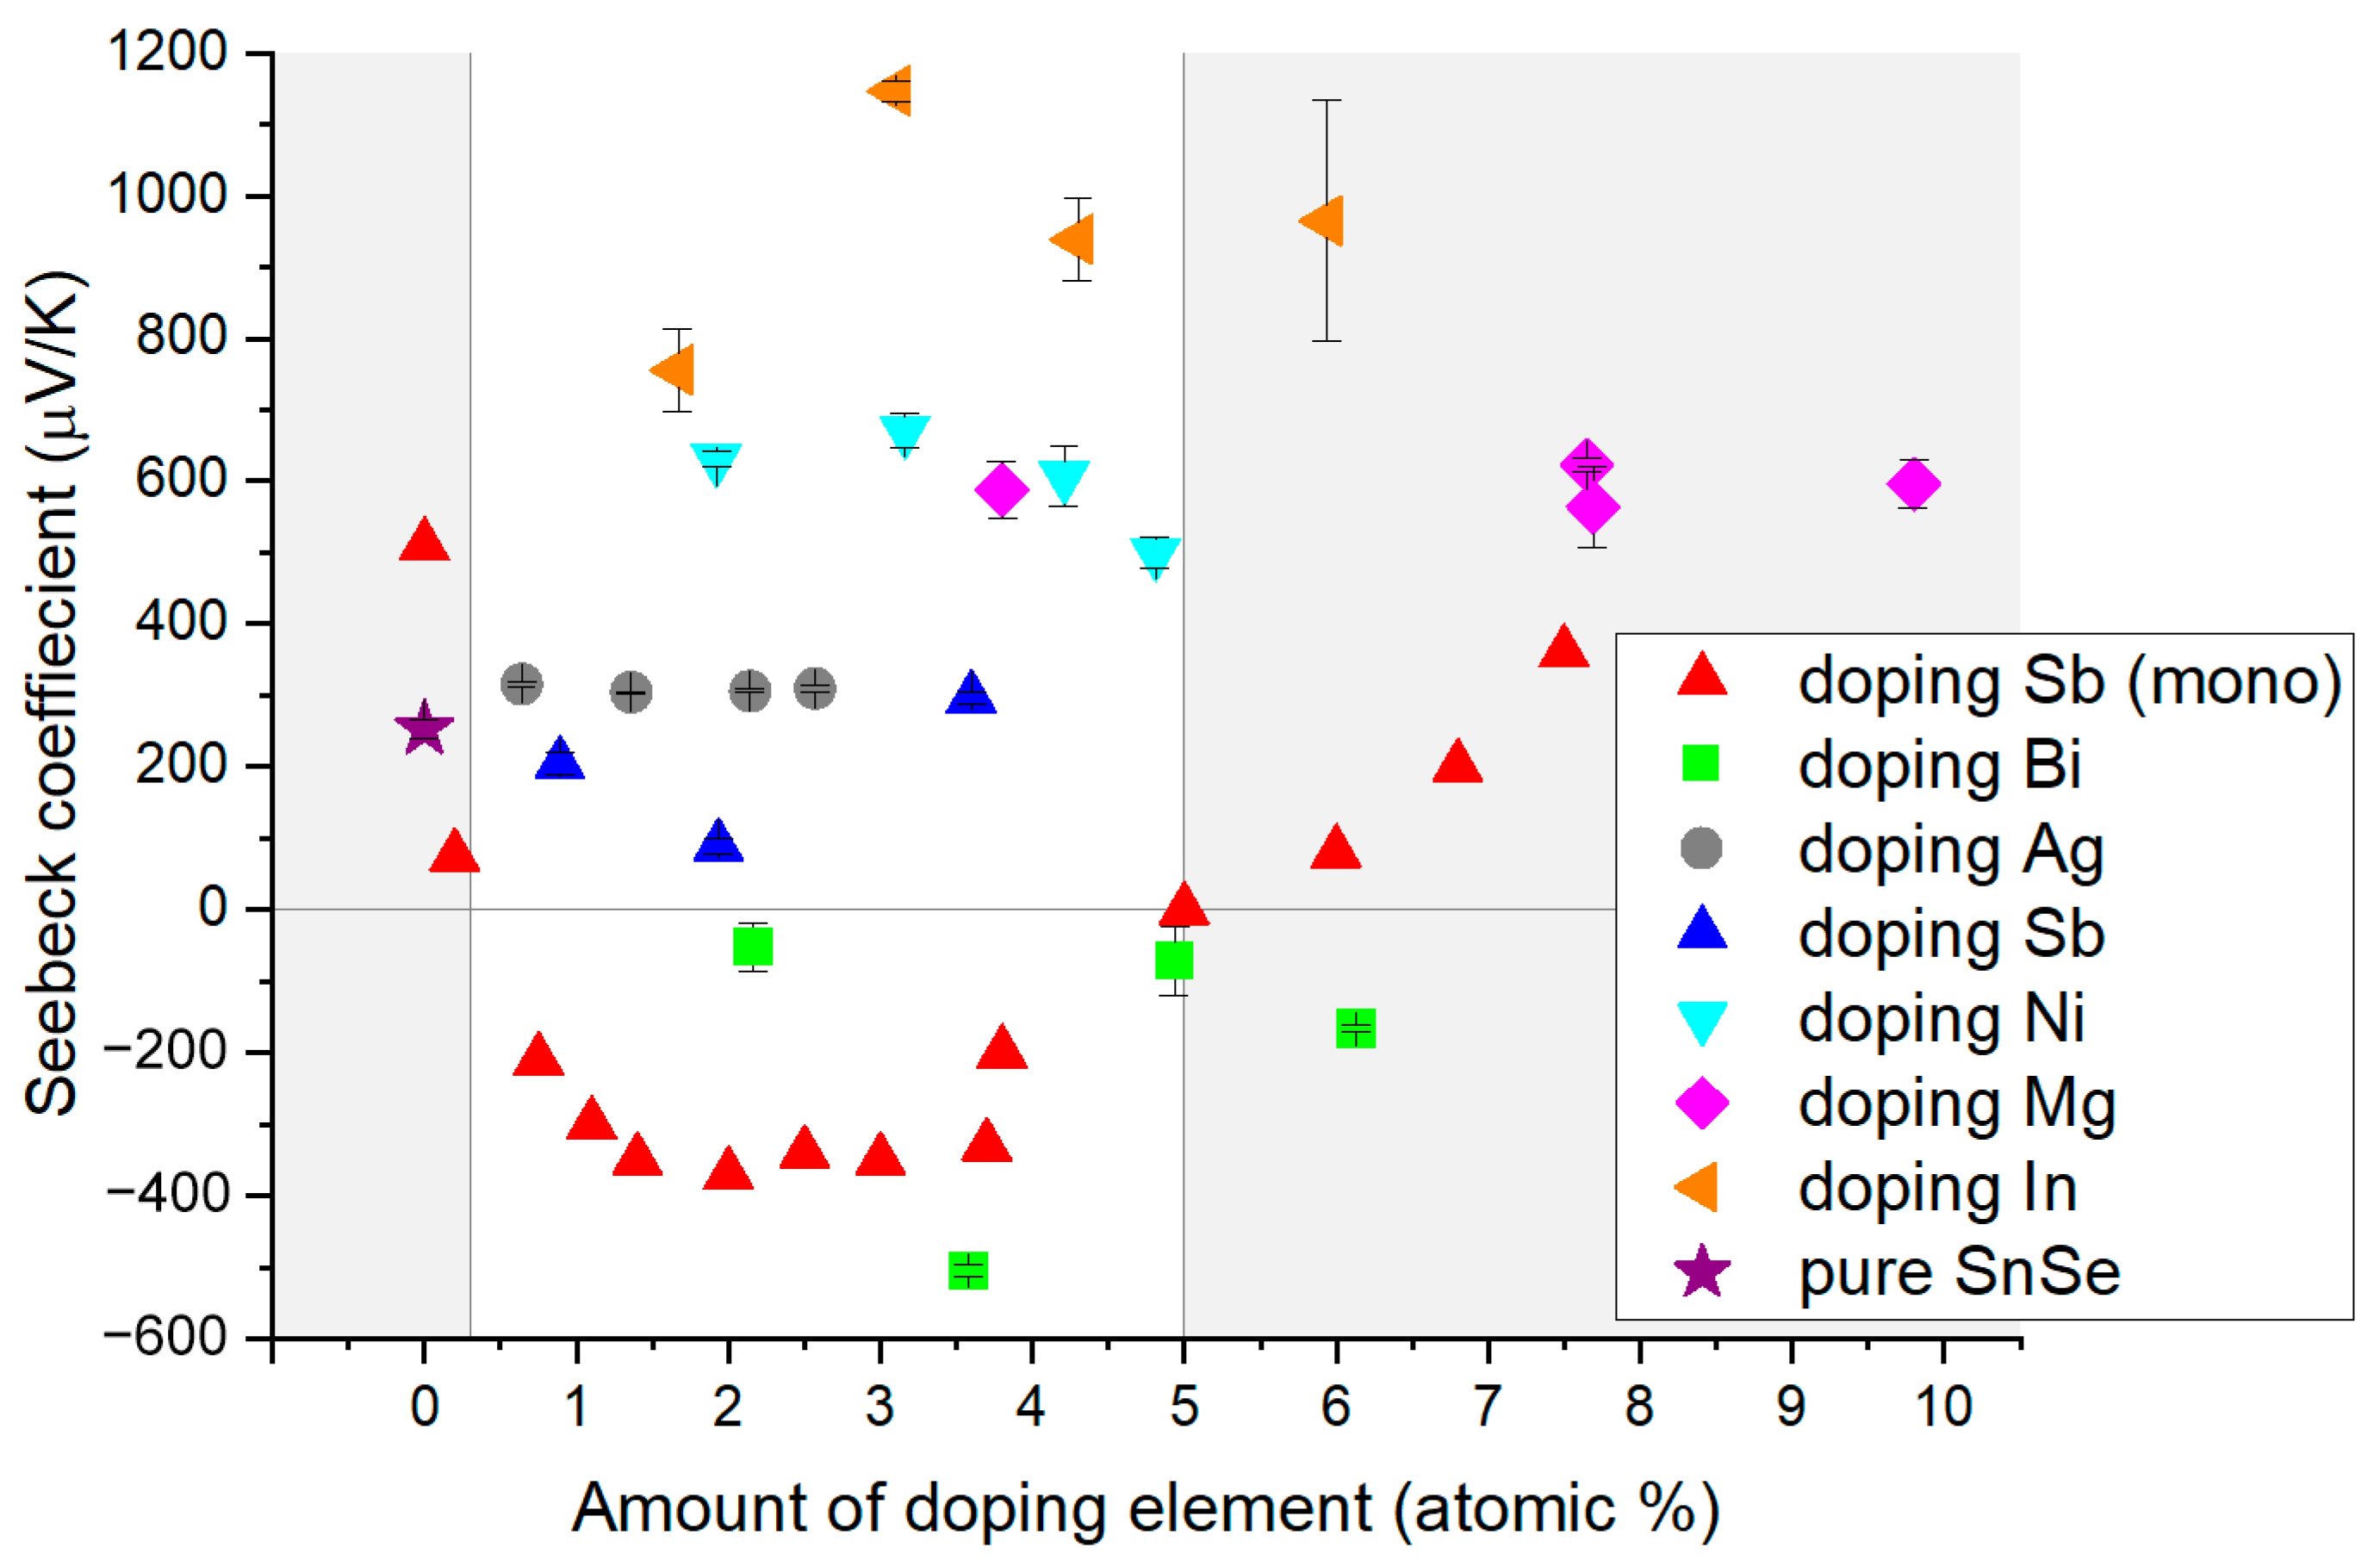
2.3. Seebeck Coefficient

The Seebeck coefficient was determined at room temperature using disk-shaped samples. Each sample underwent three measurements, with the disk rotated to a random position each time. Holders were clamped across the diameter of the disk. Our polycrystalline SnSe, doped with Sb, did not exhibit polarity switching, and the absolute values of the Seebeck coefficient were lower than those reported for the monocrystal. The effect of additional free electrons from Sb is noticeable mainly in the Sb3 sample with a lower positive Seebeck coefficient. However, this effect is less profound than in mono-crystalline material, but also shows that polarity change is highly dependent on dopant concentration, with higher amounts of Sb increasing the Seebeck coefficient again, similarly to monocrystal [12]. Doping with Bi induced a polarity change to the N region. The highest absolute value of the Seebeck coefficient was observed in the sample with 3.58 atomic % of Bi. Free electrons from Bi were enough to induce a polarity switch in the polycrystalline SnSe across all Bi concentrations. Doping with Ag had minimal effect on the bulk Seebeck coefficient values, although they were slightly higher than those of pure SnSe. The values decreased with an increase in concentration, but the measurements were the most stable among all the materials tested. Ni doping improved the absolute value of the Seebeck coefficient. Doping with Mg, similar to Ag, did not significantly affect the Seebeck coefficient with changes in Mg concentration, but these materials exhibited high instability. The polished surface of the samples began to develop damage, such as holes and craters, after exposure to air for 1 h. We attribute lower density values to the presence of these imperfections (Table 1). They were observable also on powders under SEM as well and reformed on the surface of sintered materials. Indium doping significantly increased the Seebeck coefficient of materials. This increase in p-type behavior is mainly caused by an increase in the number of free holes introduced to the bulk material with In. Interestingly, it seems that multiple different dopants incur the biggest change in the material properties around 3 atomic % (both in In and Bi). This finding suggests that this region might be the most suitable for doping in SnSe. Seebeck coefficients are compared in Figure 4.

3. Materials and Methods

Doped SnSe alloys were prepared via powder metallurgy. Pure elements in powder form (purity 99.9+%) were weighed and thoroughly mixed. The mixed powder was placed into a porcelain vessel, which was then vacuumed (up to at least 1 × 10⁻² mbar) and flushed with argon three times to reach atmospheric pressure. Subsequently, the sample was gradually heated to 500 °C (at a rate of 5 °C/min) under an argon atmosphere. This temperature was maintained for 12 h, followed by gradual cooling at the same rate. Black brittle flakes of SnO sometimes formed on the edges of the porcelain vessel and sometimes on the alloy surface. They were removed from the surface with a brush or low grit sandpaper until only the typical silvery color of SnSe was present.
The resulting melts were crushed into powders and subjected to analysis using electron microscopy (Tescan Mira, Czechia) including EDS and X-ray diffraction (Philips X’Pert Pro, Cu lamp, Amsterdam, The Netherlands). XRD data were analyzed using GSAS-II (Version 5526) software [25]. Powders (4 g) were compacted into disks with a diameter of 12.7 mm (1/2″) using spark plasma sintering (SPS, FCT Systeme GmbH SPS HP D10-SD, Frankenblick, Germany). Graphite dies, a sintering pressure of 40 MPa, and a sintering time of 10 min at the highest temperature were employed. Different maximum temperatures of 500, 600, and 650 °C were utilized. Sintered disks were polished to remove graphite paper residue and to flatten them for further analysis of the Seebeck coefficient. Samples for optical microscopy and nanoindentation were mounted using mounting compound and further polished using satin. The density of the sample disks was determined using the Archimedes method.

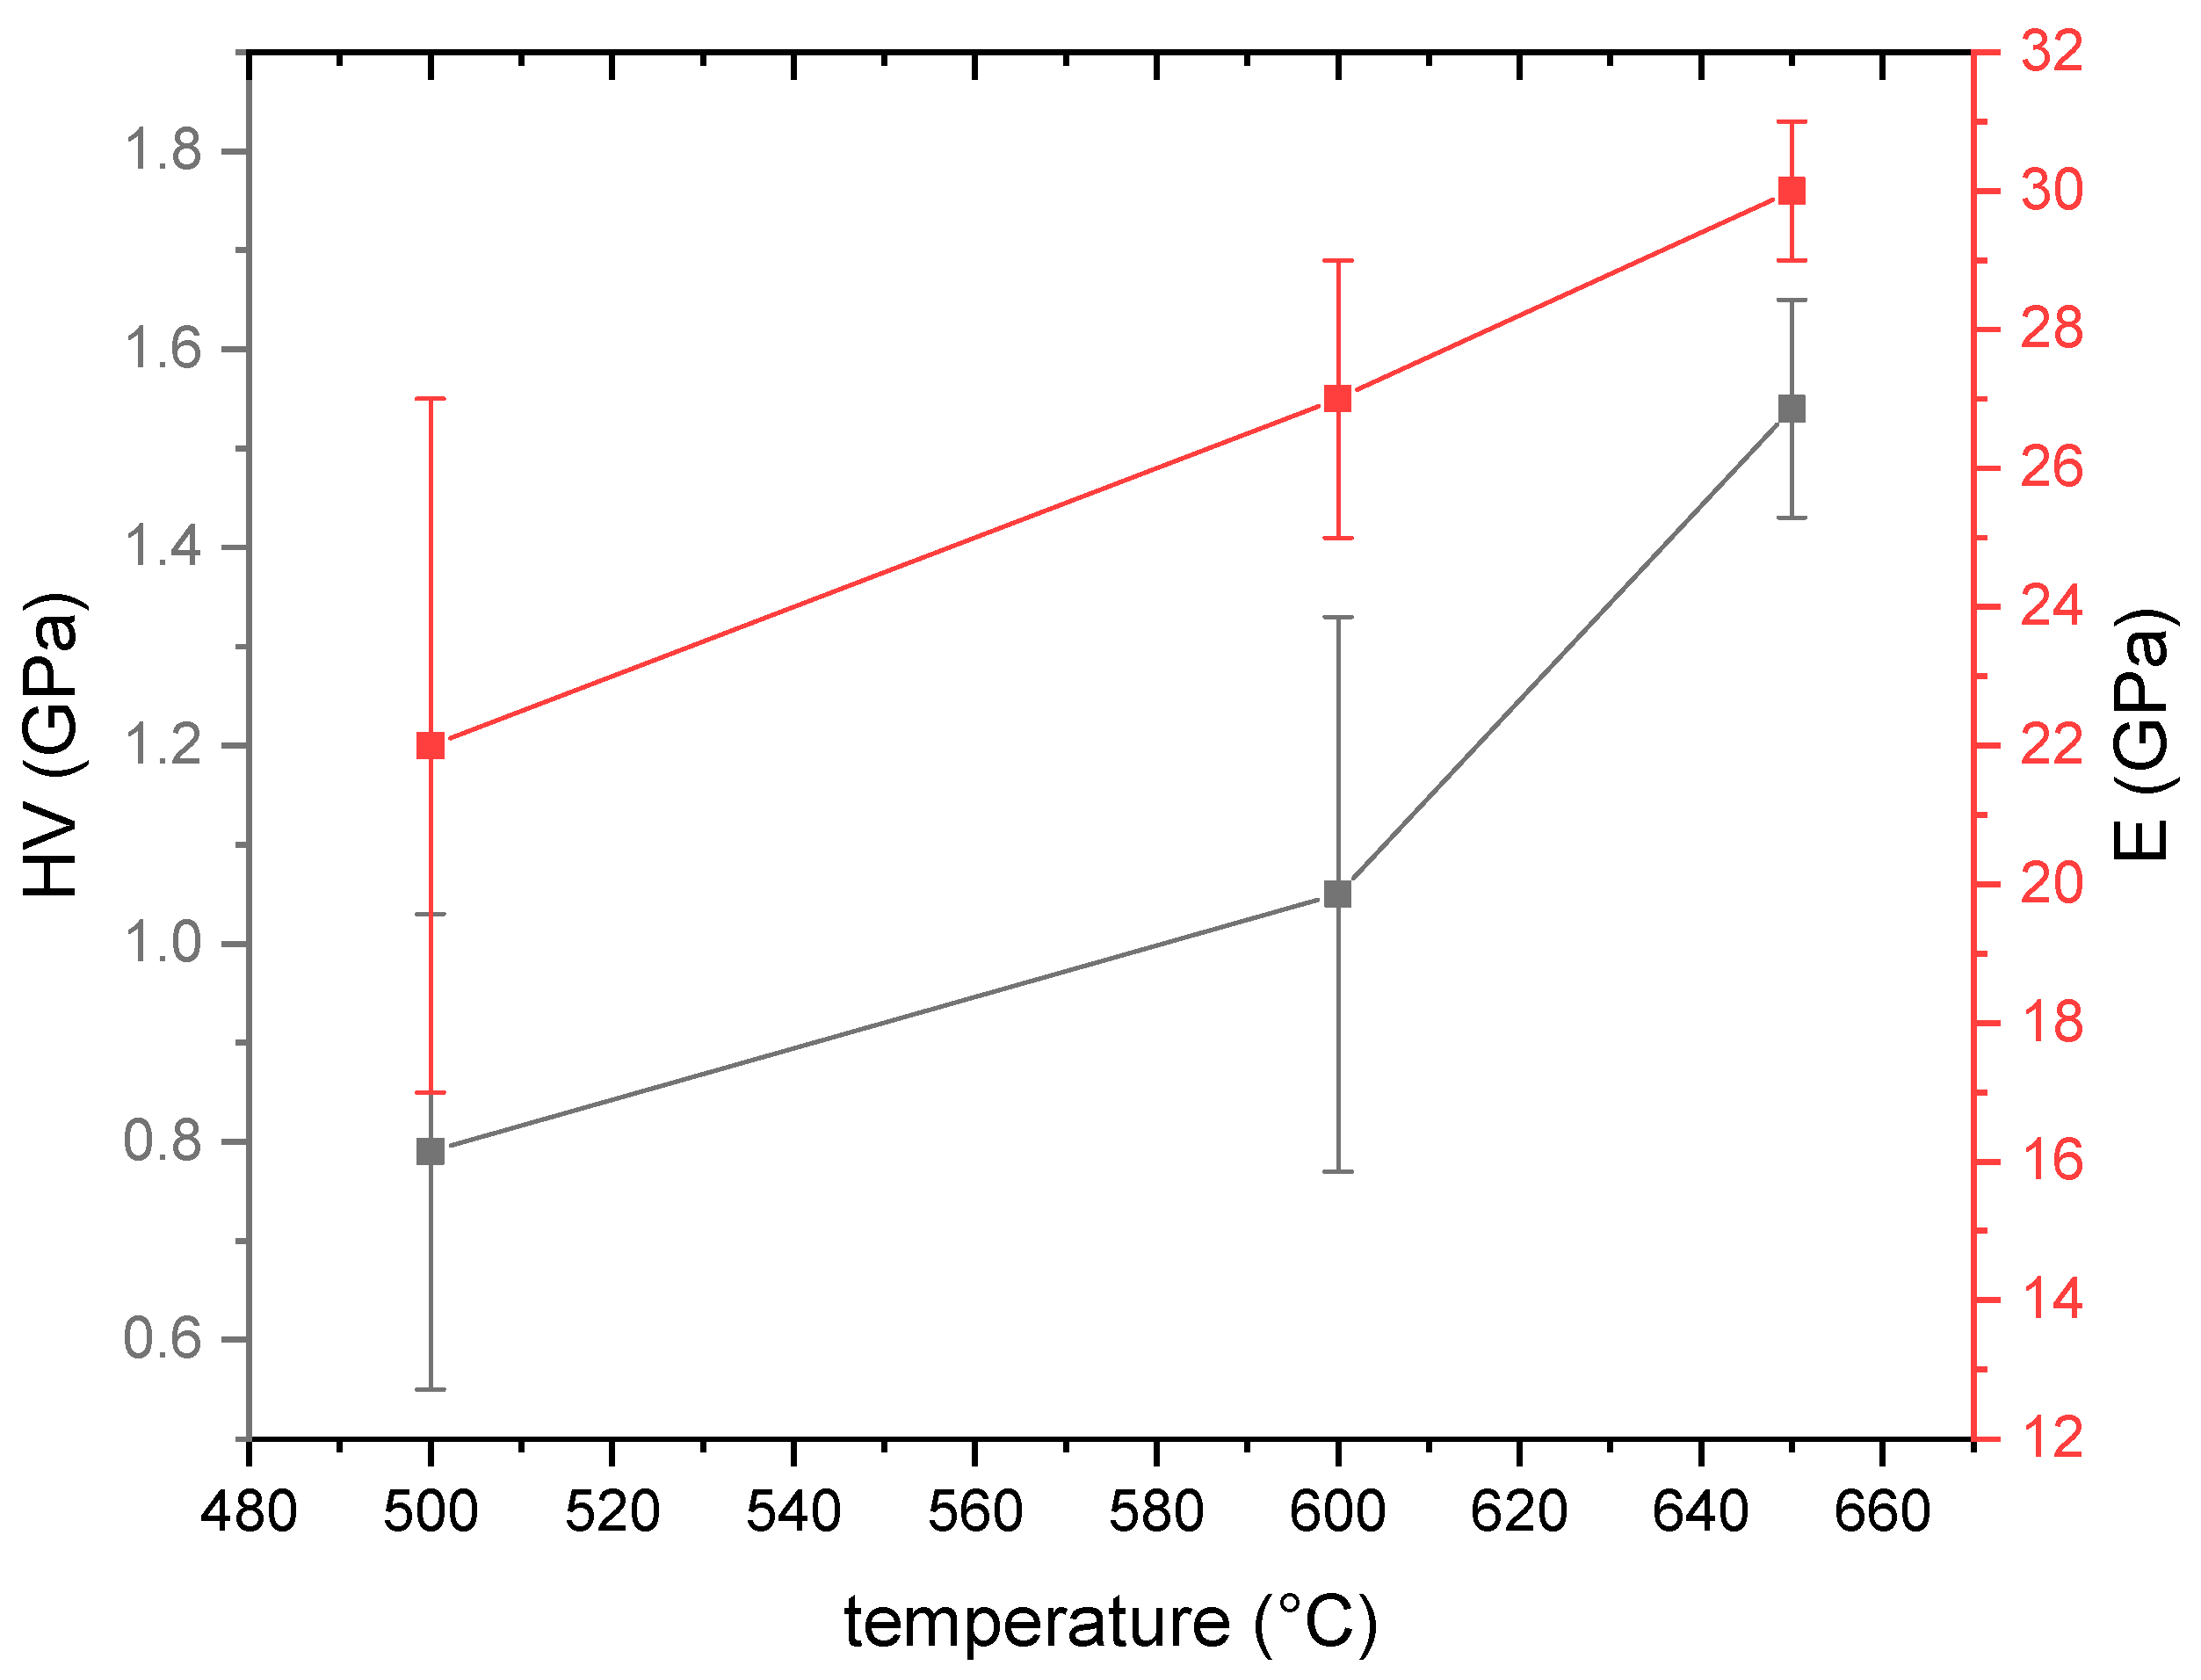
3.1. Mechanical Properties

The hardness and elastic modulus were measured using depth-sensing indentation (DSI), a technique based on controlled loading and simultaneous precise (<0.1 nm) measurement of the indenter penetration depth into the tested material. Measurements were conducted using a nano-indentation tester (Anton Paar, TTX-NHT, Zagreb, Croatia), with a Berkovich pyramid diamond tip in linear mode loading at a frequency of 10 Hz. A load of 30 mN was applied with a loading and unloading rate of 60 mN/min, and a 10 s pause was incorporated. The resulting load–penetration (P-h) curves were evaluated according to the analysis method proposed by Oliver and Pharr (1992), and values of the hardness and elastic modulus as functions of depth, as well as elastic and plastic deformation energies, were calculated. Up to 20 indentations were performed, and the obtained data were statistically evaluated.

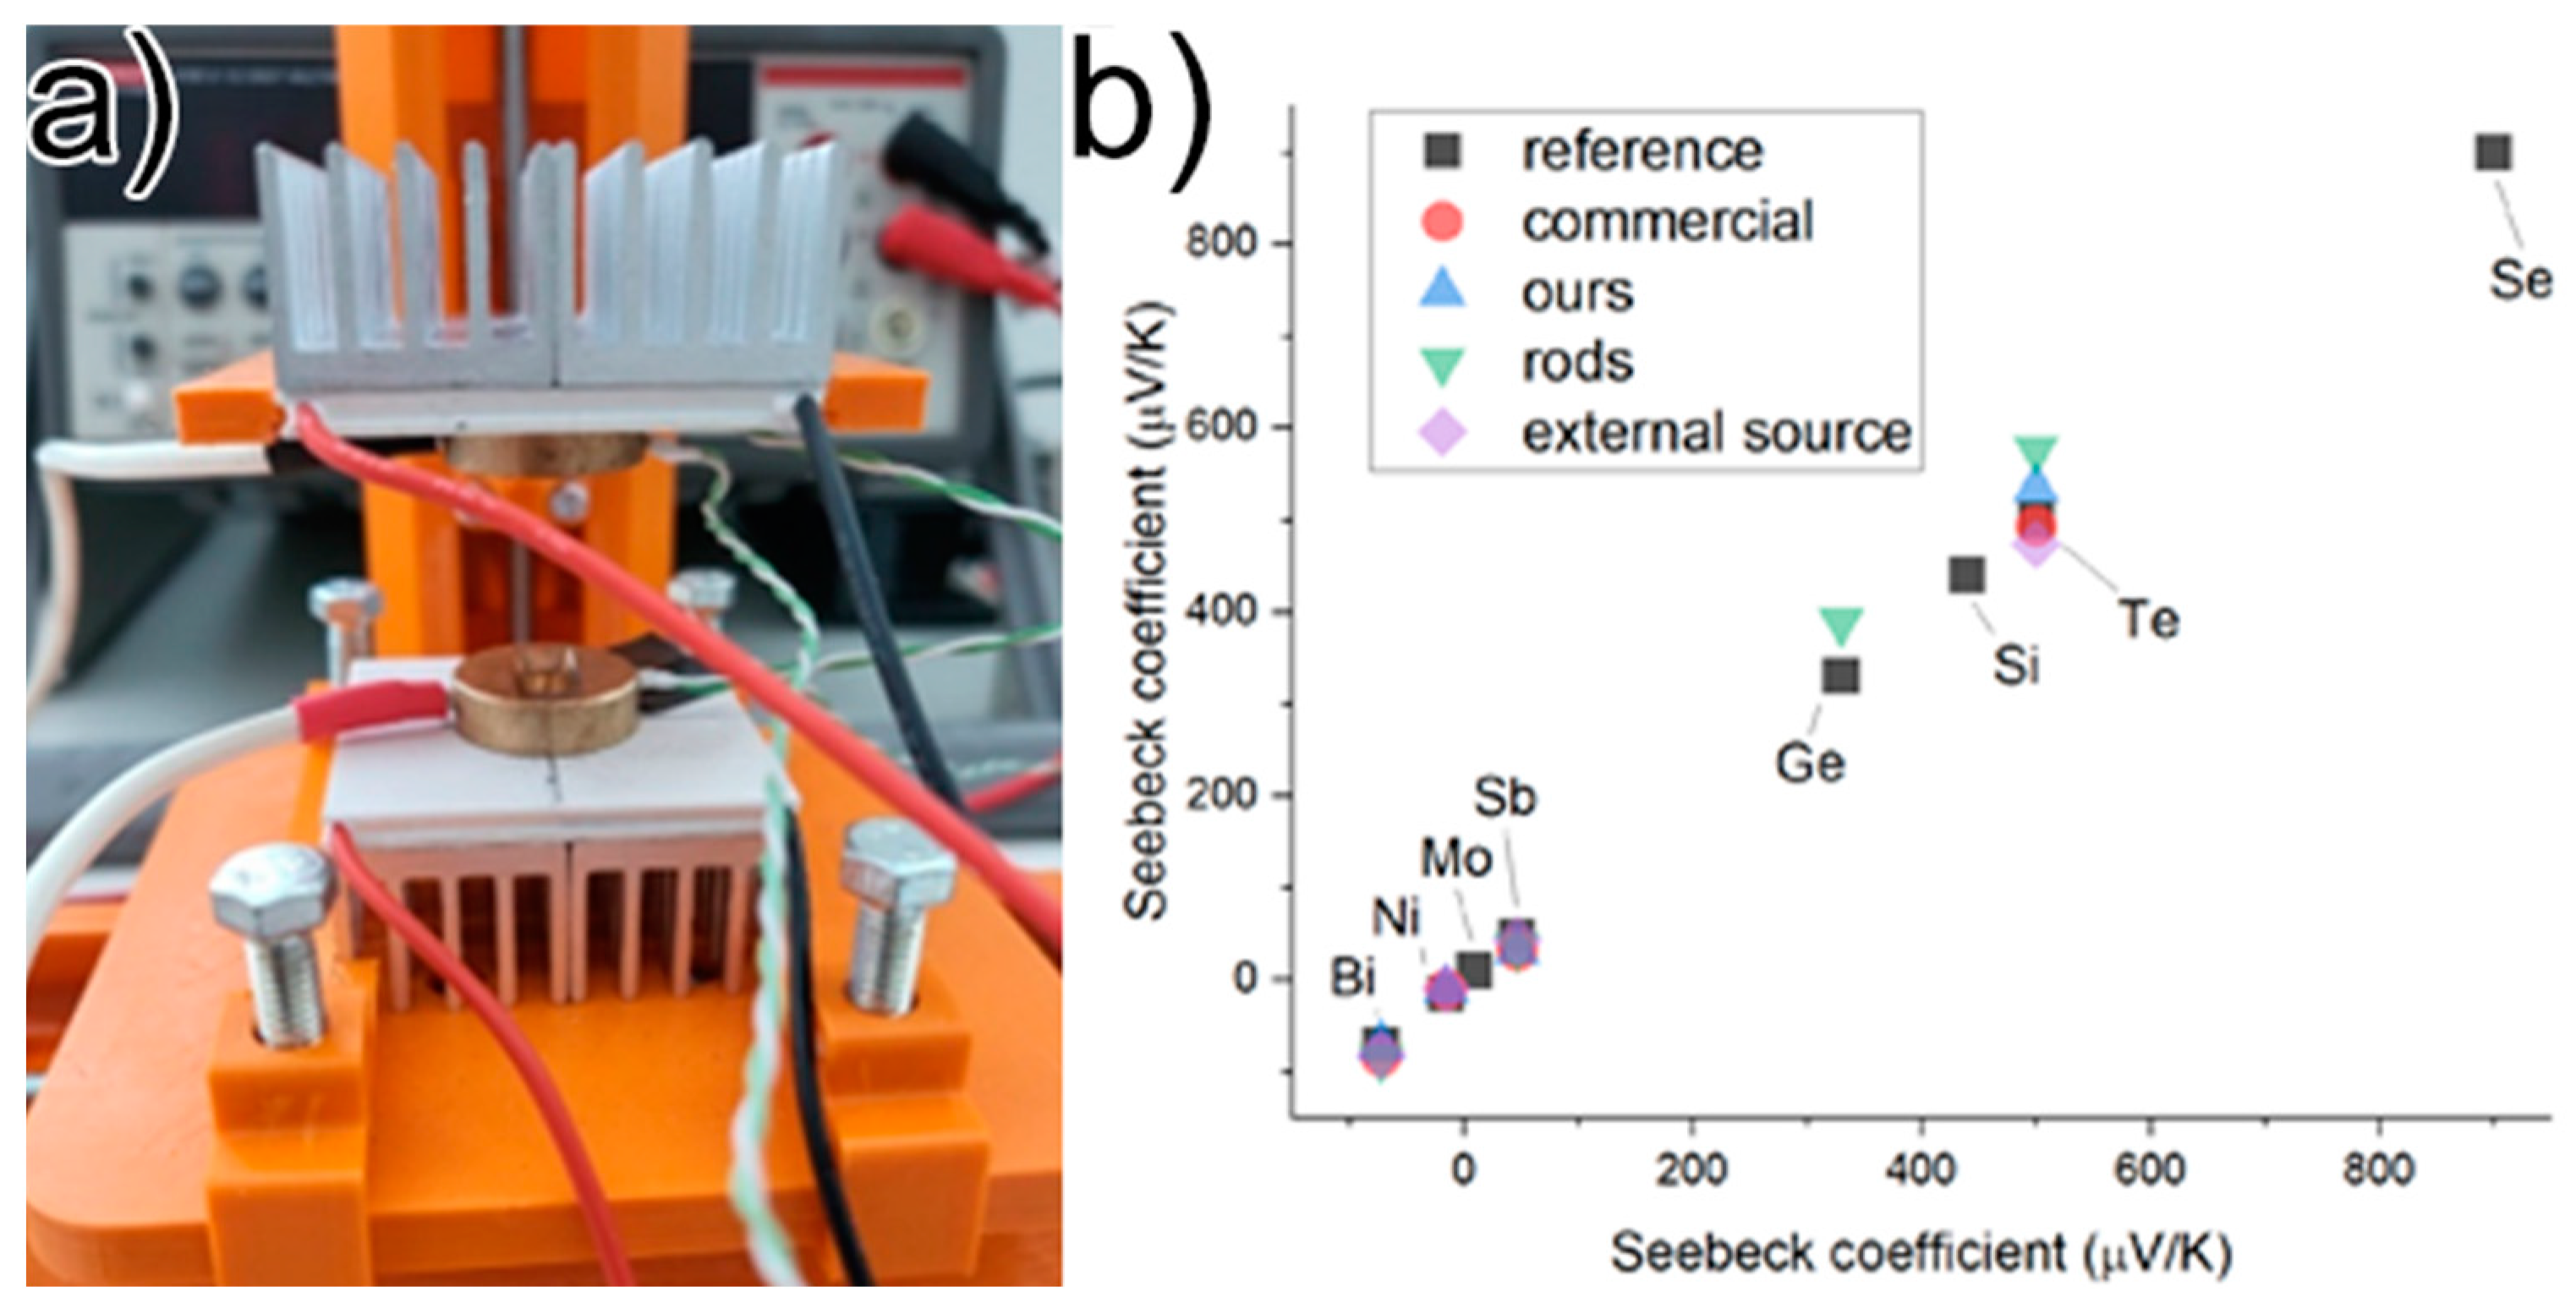
3.2. Apparatus Used for Measuring Seebeck Coefficient at Room Temperature

Our current in-house developed apparatus for measuring thermoelectric properties at room temperature is named THEMA (THermo Electric Measuring Apparatus, Figure 5a). The methodology of this apparatus was inspired by the work of de Boor [26]. The apparatus comprises two Peltier modules (one for heating and one for cooling) utilized to create a temperature gradient across the sample. The sample is mounted between two identical brass sample holders with cutouts specifically designed for holding disk- and rod-shaped samples of varying dimensions. Additionally, these sample holders have two holes: one for a potential wire and the second for the K-type thermocouple, which is electrically insulated from the sample holder. Constant pressure is applied to the sample to ensure sufficient and stable electrical contact. To mitigate errors introduced by the sample holder, the entire apparatus was calibrated using disks of pure elements (Bi, Ni, Sb, Te, with 99.9+% purity, provided by Moorfield Nanotechnology Limited, Knutsford, UK). This calibration resulted in a linear correction formula that was subsequently applied to data for materials with unknown Seebeck coefficients. The same calibration procedure was conducted for disks of pure elements sintered with SPS and for cast rods. Additionally, for samples with very low electrical conductivity, we calibrated a method in which an external power source (12 V in this case) was used to assist the multimeter (Figure 5b). The apparatus collects potential data (Keithley 2100, Cleveland, OH, USA) and temperature data (Pico Technology TC-08, UK) from the sample during the creation and equilibration of the temperature gradient. A temperature gradient of 7 °C was employed. Furthermore, we have developed our own Python script to collect and synchronize all data from the instruments. These data were utilized to determine the Seebeck coefficient with the applied correction formula.

4. Conclusions

This work presents a modified, direct, optimized and scalable pathway for preparing polycrystalline SnSe alloys using powder metallurgy and spark plasma sintering. Through this method, SnSe crystallizes into layers exhibiting a strong preferred orientation, as suggested by microscopy techniques and confirmed by XRD analysis. Doping this polycrystalline alloy with Bi induces polarity switching to the N region across all doping concentrations. However, unlike Sb-doped monocrystals, the polarity switch does not revert to P polarity. This is beneficial during the mass production as less precision is needed to produce n-type material. Additionally, the absolute value of the Seebeck coefficient for Bi-doped material was higher at room temperature than in previously reported polycrystalline Bi-doped materials, justifying synthesis and sintering modifications [3]. Moreover, doping with Ag, Ni, Mg, and In also fails to cause polarity switching. Notably, doping with In significantly improves the Seebeck coefficient. These doping elements do not incorporate into the unit cell of SnSe; instead, they are evenly spread across the bulk material. In particular, a sample doped with 3 atomic % Bi (Bi3) and another one doped with 3 atomic % In (In3) would be very suitable for N and P legs, respectively. Similar materials are an ideal choice for N and P legs, resulting in comparable thermal expansion, effectively reducing mechanical stresses in the thermoelectric generator, thereby enhancing its reliability and longevity. Additionally, this work characterizes an in-house developed apparatus and a multi-element calibration method for the reliable and rapid determination of the Seebeck coefficient of differently shaped samples at room temperature.

Author Contributions

Conceptualization, F.M. and K.S.; methodology, F.M.; software, F.M. and K.S.; investigation, F.M., G.H., V.P., J.S., B.B. and R.D.; writing—original draft preparation, F.M.; writing—review and editing, F.M., B.B. and K.S.; visualization, F.M.; supervision, K.S. All authors have read and agreed to the published version of the manuscript.

Funding

This work was created with financial support from VEGA 2/0039/22 and APVV projects SK-PL-21-0022, APVV-20-205, APVV-20-0138, APVV-21-0274.

Data Availability Statement

XRD, SEM and Seebeck coefficient data from this submission can be provided upon reasonable request with a clear intent stated.

Conflicts of Interest

The authors declare no conflicts of interest.

References

  1. Ojovan, M.I.; Lee, W.E.; Kalmykov, S.N. Power Utilisation of Nuclear Energy. In An Introduction to Nuclear Waste Immobilisation; Elsevier: Amsterdam, The Netherlands, 2019; pp. 57–70. ISBN 978-0-08-102702-8. [Google Scholar]
  2. Yuan, Z.; Tang, X.; Liu, Y.; Xu, Z.; Liu, K.; Zhang, Z.; Chen, W.; Li, J. A Stacked and Miniaturized Radioisotope Thermoelectric Generator by Screen Printing. Sens. Actuators A Phys. 2017, 267, 496–504. [Google Scholar] [CrossRef]
  3. Nguyen, V.Q.; Nguyen, T.H.; Duong, V.T.; Lee, J.E.; Park, S.-D.; Song, J.Y.; Park, H.-M.; Duong, A.T.; Cho, S. Thermoelectric Properties of Hot-Pressed Bi-Doped n-Type Polycrystalline SnSe. Nanoscale Res. Lett. 2018, 13, 200. [Google Scholar] [CrossRef] [PubMed]
  4. Jouhara, H.; Żabnieńska-Góra, A.; Khordehgah, N.; Doraghi, Q.; Ahmad, L.; Norman, L.; Axcell, B.; Wrobel, L.; Dai, S. Thermoelectric Generator (TEG) Technologies and Applications. Int. J. Thermofluids 2021, 9, 100063. [Google Scholar] [CrossRef]
  5. Jaziri, N.; Boughamoura, A.; Müller, J.; Mezghani, B.; Tounsi, F.; Ismail, M. A Comprehensive Review of Thermoelectric Generators: Technologies and Common Applications. Energy Rep. 2020, 6, 264–287. [Google Scholar] [CrossRef]
  6. Sassi, S.; Candolfi, C.; Vaney, J.-B.; Ohorodniichuk, V.; Masschelein, P.; Dauscher, A.; Lenoir, B. Assessment of the Thermoelectric Performance of Polycrystalline p-Type SnSe. Appl. Phys. Lett. 2014, 104, 212105. [Google Scholar] [CrossRef]
  7. Zhao, L.-D.; Chang, C.; Tan, G.; Kanatzidis, M.G. SnSe: A Remarkable New Thermoelectric Material. Energy Environ. Sci. 2016, 9, 3044–3060. [Google Scholar] [CrossRef]
  8. Wang, X.; Xu, J.; Liu, G.; Fu, Y.; Liu, Z.; Tan, X.; Shao, H.; Jiang, H.; Tan, T.; Jiang, J. Optimization of Thermoelectric Properties in n -Type SnSe Doped with BiCl3. Appl. Phys. Lett. 2016, 108, 083902. [Google Scholar] [CrossRef]
  9. Tang, G.; Wen, Q.; Yang, T.; Cao, Y.; Wei, W.; Wang, Z.; Zhang, Z.; Li, Y. Rock-Salt-Type Nanoprecipitates Lead to High Thermoelectric Performance in Undoped Polycrystalline SnSe. RSC Adv. 2017, 7, 8258–8263. [Google Scholar] [CrossRef]
  10. Zhao, L.-D.; Lo, S.-H.; Zhang, Y.; Sun, H.; Tan, G.; Uher, C.; Wolverton, C.; Dravid, V.P.; Kanatzidis, M.G. Ultralow Thermal Conductivity and High Thermoelectric Figure of Merit in SnSe Crystals. Nature 2014, 508, 373–377. [Google Scholar] [CrossRef]
  11. Duong, A.T.; Nguyen, V.Q.; Duvjir, G.; Duong, V.T.; Kwon, S.; Song, J.Y.; Lee, J.K.; Lee, J.E.; Park, S.; Min, T.; et al. Achieving ZT = 2.2 with Bi-Doped n-Type SnSe Single Crystals. Nat. Commun. 2016, 7, 13713. [Google Scholar] [CrossRef]
  12. Yamamoto, C.; He, X.; Katase, T.; Ide, K.; Goto, Y.; Mizuguchi, Y.; Samizo, A.; Minohara, M.; Ueda, S.; Hiramatsu, H.; et al. Double Charge Polarity Switching in Sb-Doped SnSe with Switchable Substitution Sites. Adv. Funct. Mater. 2021, 31, 2008092. [Google Scholar] [CrossRef]
  13. Dona, J.; Archana, J.; Kamalakannan, S.; Prakash, M.; Hara, K.; Harish, S.; Navaneethan, M. Double Charge Polarity Switching in Sb-Doped SnSe for Enhanced Thermo-Electric Power Generation. J. Alloys Compd. 2022, 899, 163269. [Google Scholar] [CrossRef]
  14. Yang, R.; Li, Y.; Lin, W.; Xu, J.; Wang, L.; Liu, J. The Improvement of Thermoelectric Properties of SnSe by Alkali Metal Doping. Mod. Phys. Lett. B 2024, 38, 2450052. [Google Scholar] [CrossRef]
  15. Tang, Y.; Shen, L.; Chen, Z.; Sun, L.; Liu, W.; Liu, J.; Deng, S. The N-Type Pb-Doped Single Crystal SnSe Thermoelectric Material Synthesized by a Sn-Flux Method. Phys. B Condens. Matter 2019, 570, 128–132. [Google Scholar] [CrossRef]
  16. Lee, Y.K.; Luo, Z.; Cho, S.P.; Kanatzidis, M.G.; Chung, I. Surface Oxide Removal for Polycrystalline SnSe Reveals Near-Single-Crystal Thermoelectric Performance. Joule 2019, 3, 719–731. [Google Scholar] [CrossRef]
  17. Bishara, H.; Lee, S.; Brink, T.; Ghidelli, M.; Dehm, G. Understanding Grain Boundary Electrical Resistivity in Cu: The Effect of Boundary Structure. ACS Nano 2021, 15, 16607–16615. [Google Scholar] [CrossRef] [PubMed]
  18. Lin, Y.; Wood, M.; Imasato, K.; Kuo, J.J.; Lam, D.; Mortazavi, A.N.; Slade, T.J.; Hodge, S.A.; Xi, K.; Kanatzidis, M.G.; et al. Expression of Interfacial Seebeck Coefficient through Grain Boundary Engineering with Multi-Layer Graphene Nanoplatelets. Energy Environ. Sci. 2020, 13, 4114–4121. [Google Scholar] [CrossRef]
  19. Zhou, C.; Lee, Y.K.; Yu, Y.; Byun, S.; Luo, Z.-Z.; Lee, H.; Ge, B.; Lee, Y.-L.; Chen, X.; Lee, J.Y.; et al. Polycrystalline SnSe with a Thermoelectric Figure of Merit Greater than the Single Crystal. Nat. Mater. 2021, 20, 1378–1384. [Google Scholar] [CrossRef] [PubMed]
  20. Li, F.; Wang, W.; Ge, Z.-H.; Zheng, Z.; Luo, J.; Fan, P.; Li, B. Enhanced Thermoelectric Properties of Polycrystalline SnSe via LaCl3 Doping. Materials 2018, 11, 203. [Google Scholar] [CrossRef]
  21. Chen, Z.-G.; Shi, X.; Zhao, L.-D.; Zou, J. High-Performance SnSe Thermoelectric Materials: Progress and Future Challenge. Prog. Mater. Sci. 2018, 97, 283–346. [Google Scholar] [CrossRef]
  22. Chen, C.-L.; Wang, H.; Chen, Y.-Y.; Day, T.; Snyder, G.J. Thermoelectric Properties of P-Type Polycrystalline SnSe Doped with Ag. J. Mater. Chem. A 2014, 2, 11171–11176. [Google Scholar] [CrossRef]
  23. Huo, H.; Zhang, Y.; Guo, K.; Yang, X.; Xing, J.; Li, S.; Zhang, J.; Luo, J. Improvement of Anisotropic Thermoelectric Performance in Polycrystalline SnSe by Metallic AgSnSe2 Compositing. J. Alloys Compd. 2022, 908, 164649. [Google Scholar] [CrossRef]
  24. Vasudevan, R.; Zhang, L.; Ren, Q.; Wu, J.; Cheng, Z.; Wang, J.; Lin, S.; Zhu, F.; Zhang, Y.; Hölzel, M.; et al. Secondary Phase Effect on the Thermoelectricity by Doping Ag in SnSe. J. Alloys Compd. 2022, 923, 166251. [Google Scholar] [CrossRef]
  25. Toby, B.H.; Von Dreele, R.B. GSAS-II: The Genesis of a Modern Open-Source All Purpose Crystallography Software Package. J. Appl. Crystallogr. 2013, 46, 544–549. [Google Scholar] [CrossRef]
  26. de Boor, J.; Zabrocki, K.; Frohring, J.; Müller, E. Electrical Conductivity Measurements on Disk-Shaped Samples. Rev. Sci. Instrum. 2014, 85, 075104. [Google Scholar] [CrossRef]
Figure 1. (a) Pure SnSe after sintering at 500 °C (optical microscope); (b) at 650 °C; (c) pure SnSe after sintering at 500 °C with loose particles visible (SEM); (d) at 650 °C with a characteristic layered structure shown; (e) EDS mapping for the doped In5 powder sample before sintering; (f) homogeneous distribution of In in sample In5; (g) EDS mapping for the doped Ag5 powder sample before sintering; (h) homogeneous distribution of Ag in sample Ag5.
Inorganics 12 00103 g001
Figure 2. Comparison of hardness (HV) and elastic modulus (E) for different sintering temperatures.
Inorganics 12 00103 g002
Figure 3. Details of Rietveld refinement for samples single-phase Ni3 (a) and dual-phase In3 (b).
Inorganics 12 00103 g003
Figure 4. Comparison of Seebeck coefficients at room temperature for different doping elements. Datapoints for (mono) were used from the work of Yamamoto [12]. Grey regions are P polarity for monocrystalline SnSe doped with Sb.
Inorganics 12 00103 g004
Figure 5. (a) THEMA apparatus; (b) calibration plot comparing commercial, SPS prepared (ours), cast (rods) materials and disk with external power source used (external source) against known reference values after applying correction formula.
Inorganics 12 00103 g005
Table 1. List of unit cell parameters for major orthorhombic phase SnSe and phase distribution in the samples.
SeriesSample Name (Atomic % of Dopant)a (Å)b (Å)c (Å)SnSe
%
SnSe2
%
Density (g/cm3)
pure SnSeSnSe11.4976 ± 0.00034.1541 ± 0.00024.4437 ± 0.000290105.940
SnSe phase dopant SbSb1 (0.89)11.4986 ± 0.00024.1529 ± 0.00024.4480 ± 0.00039916.011
Sb3 (1.94)11.4957 ± 0.00054.1529 ± 0.00044.4271 ± 0.000510005.956
Sb7 (3.60)11.5036 ± 0.00184.1621 ± 0.00114.4115 ± 0.001410005.963
SnSe phase dopant BiBi1 (2.16)11.5414 ± 0.00194.1268 ± 0.00184.4417 ± 0.00199555.973
Bi3 (3.58)11.5042 ± 0.00104.1541 ± 0.00104.3865 ± 0.001010005.963
Bi5 (4.94)11.5106 ± 0.00034.1649 ± 0.00034.4375 ± 0.00049736.017
Bi7 (6.13)11.5080 ± 0.00184.1628 ± 0.00074.4176 ± 0.001210006.064
SnSe phase dopant AgAg1 (0.64)11.4995 ± 0.00034.1533 ± 0.00034.4503 ± 0.000388126.057
Ag3 (1.36)11.4998 ± 0.00054.1560 ± 0.00044.4463 ± 0.00059376.036
Ag5 (2.15)11.4965 ± 0.00054.1548 ± 0.00044.4465 ± 0.00059466.025
Ag7 (2.57)11.4982 ± 0.00054.1526 ± 0.00064.4471 ± 0.00069286.062
SnSe phase dopant NiNi1 (1.92)11.4985 ± 0.00034.1541 ± 0.00034.4450 ± 0.000310006.045
Ni3 (3.16)11.4976 ± 0.00034.1519 ± 0.00044.4380 ± 0.000410006.003
Ni5 (4.21)11.4977 ± 0.00094.1559 ± 0.00064.4484 ± 0.000610006.062
Ni7 (4.81)11.4966 ± 0.00044.1536 ± 0.00034.4454 ± 0.000310006.069
SnSe phase dopant MgMg1 (3.8)11.4971 ± 0.00054.1560 ± 0.00044.4454 ± 0.000410005.947
Mg3 (7.65)11.4993 ± 0.00064.1572 ± 0.00044.4494 ± 0.000310006.014
Mg5 (7.69)11.4929 ± 0.00044.1506 ± 0.00034.4431 ± 0.000310005.975
Mg7 (9.8)11.4916 ± 0.00104.1492 ± 0.00064.4415 ± 0.000710005.907
SnSe phase dopant InIn1 (1.67)11.4965 ± 0.00054.1546 ± 0.00054.4488 ± 0.000683176.027
In3 (3.10)11.4989 ± 0.00044.1531 ± 0.00024.4433 ± 0.00039376.036
In5 (4.30)11.4978 ± 0.00054.1578 ± 0.00054.4511 ± 0.00049646.001
In7 (5.94)11.5010 ± 0.00064.1581 ± 0.00054.4466 ± 0.00059376.050
Disclaimer/Publisher’s Note: The statements, opinions and data contained in all publications are solely those of the individual author(s) and contributor(s) and not of MDPI and/or the editor(s). MDPI and/or the editor(s) disclaim responsibility for any injury to people or property resulting from any ideas, methods, instructions or products referred to in the content.

