Article

The Effect of Ge Doping on α-Ag2S’s Thermoelectric and Mechanical Properties

1
Department of Technologies in Electronics, Faculty of Electrical Engineering and Informatics, Technical University of Kosice, 04001 Kosice, Slovakia
2
Faculty of Materials, Metallurgy and Recycling, Technical University of Kosice, 04001 Kosice, Slovakia
3
Institute of Materials Research, Slovak Academy of Science Kosice, 04001 Kosice, Slovakia
4
Department of Biomedical Engineering and Measurement, Faculty of Mechanical Engineering, Technical University of Kosice, 04001 Kosice, Slovakia
*
Author to whom correspondence should be addressed.
Inorganics 2024, 12(4), 98; https://doi.org/10.3390/inorganics12040098
Submission received: 1 February 2024 / Revised: 14 March 2024 / Accepted: 25 March 2024 / Published: 28 March 2024
(This article belongs to the Section Inorganic Materials)

Abstract

:
Thermoelectric materials are capable of generating electrical energy in response to a temperature gradient. Non-renewable energy resources are depleting, so the development of renewable energy sources that are environmentally sustainable is essential. One potential application of these materials as an alternative energy source is in wearable electronics. Thermoelectric materials are used in common electrical devices, as well as by the military, in healthcare, and in space. As a ductile N-type semiconducting material, silver sulfide is one of the most promising materials in terms of thermoelectric potential. The properties of Ag2S can be improved by choosing the appropriate dopants. This study investigates the methods by which the thermoelectric, mechanical, and hardness properties of Ag2S are improved via Ge doping. The addition of Ge increases the Seebeck coefficient to a maximum of −87 μV·K−1 from −1051 μV·K−1 to P-type, bringing it closer to transitioning. In order to work, a thermoelectric generator requires both N- and P-type materials. By applying homojunctions made from similar materials, internal stresses caused by the varying thermal expansion rates of different materials are reduced. In order to demonstrate Ge integration, scanning electron microscopy and X-ray diffraction were applied to the sample microstructure. In addition, supplementation was used to increase the ductility and malleability of materials to make them suitable for power generation in wearable electronics. These materials showed significant power factor values according to room-temperature measurements. This proves that materials capable of generating usable voltage lie in the recommended ambient temperature range for the user’s body, thus rendering them potential candidates for wearable electronics.

1. Introduction

In a thermoelectric material, the thermoelectric effect is the immediate transformation of a temperature difference into electric voltage, or vice versa. An electric voltage is generated by thermoelectric materials when the temperatures at their extremities differ. Furthermore, this phenomenon exhibits reversibility; that is, the application of electric voltage to the opposite extremities of a thermoelectric material causes heat transfer, thereby generating a disparity and a temperature gradient between those extremities. Substrates, and electrically conductive materials in general, exhibit thermoelectric effects. The Seebeck effect, the Peltier effect, and the Thomson effect are the three main thermoelectric effects [1,2,3]. Over the course of the last decade, numerous industrial, medical, space, and military applications have been built upon thermoelectric effects [4,5,6,7]. Lead and chalcogenides (PbX, X = S, Se, Te; zTMAX = 2.1), bismuth telluride (zTMAX = 1.4) [4], SiGe alloys (zTMAX < 1) [8], Zintl phases (zTMAX < 1.3) [9], half-Heusler alloys (zTMAX = 1.52) [10], and organic thermoelectrics (zTMAX < 0.42) [11] are a few of the previously developed thermoelectric alloys. Environmental friendliness, quiet operation, durability, dependability, resistance to wear, and the absence of moving parts are the primary benefits of thermoelectric devices. Thermoelectric devices are easily manipulated and exhibit an immediate response to changes in power requirements. In general, thermoelectric devices fall into two classifications: those used for power generation, cooling, or heating, and those designated for temperature measurement (zT ≈ 10−6–10−3). The Peltier and Seebeck effects are utilized by the majority of thermoelectric refrigerators and generators, respectively [1,12,13,14]. Thermoelectric cooling devices that are commercially available find application in a wide range of fields and sectors, such as aerospace, consumer products, laboratory and scientific devices, industrial temperature regulation, and restaurant equipment, among others [12,13,14,15,16,17,18].
The Peltier effect is a phenomenon wherein the injection of an electric current in a material (or two different materials) produces a temperature gradient. By utilizing this temperature difference, an object can be either heated or cooled. If a temperature difference exists between the hot and cold extremities of a thermoelectric device, it can operate as an electric power generator [15,19]. Wearable electronics, such as smart glasses, jewelry, and wristwatches, represent a viable domain in which flexible thermoelectric generators can be effectively utilized. These devices are capable of converting waste energy from the human body into electrical energy essential for charging wearable devices.
Given the impending depletion of specific energy sources and environmental concerns, as well as the possibility of an energy crisis, it is expected that these electronics will find substantial utility in the future [4,18,19,20,21,22,23]. As a result, attention must be focused on alternative energy sources, including thermoelectric devices.
Due to its ductile characteristics [24,25,26,27], Ag2S demonstrates significant promise as a material suitable for integration into flexible thermoelectric generators; thus, it can serve as the foundation for thermoelectric devices that will experience mechanical stresses. Ag2S is also polymorphic, which signifies that its crystal structure alters with increasing temperature [28,29,30,31]. Acanthite is a naturally occurring mineral composed of monoclinic α-Ag2S. α-Ag2S is present at temperatures below 177 °C. A phase transition occurs from a monoclinic crystal structure to a body-centered cubic β-Ag2S when the temperature surpasses 177 °C. β-Ag2S is naturally present in the form of the mineral argentite at temperatures ranging from 177 °C to 592 °C. The final crystal modification of Ag2S is γ-Ag2S, a mineral with a cubic face-centered crystal structure. The temperature range of γ-Ag2S spans from 592 °C to 837 °C, which corresponds to its melting point [32]. At ambient temperature, monoclinic α-Ag2S exhibits the following properties as an N-type non-degenerate semiconductor: a low electron concentration of 1.6 × 1014 cm−3, a high negative Seebeck coefficient of −1051 μV·K−1, a low electrical conductivity σ ranging from 0.09 to 0.16 S·m−1, and a low thermal conductivity κ 0.5 W·m−1·K−1 [27,30,33,34]. Pure α-Ag2S is deemed unsuitable for use as a thermoelectric material due to its negligible zT value (≈0), which limits its effective application, in the absence of impurities. Significant improvement in its thermoelectric properties can be achieved through doping with an appropriate chalcogen or metalloid. Se and Te are the chalcogens that have the potential to improve the thermoelectric characteristics of Ag2S. An additional category of elements that can substitute for S in Ag2S is metalloids. Suitable metalloids, with the exception of Te, comprise the subsequent elements: B, Si, Ge, As, and Sb. Pure elements, including Te, Se, Sb, and Ge, have been proposed to be capable of occupying the S positions in the Ag2S compound [2,26,35].
A study has shown the effective synthesis of non-α Ag2S thermoelectric materials doped with Se and Te (with Te serving as a substitute for S) [36]. Nevertheless, our goal was to analyze Ge-doped α-Ag2S material using a monoclinic unit cell in order to produce a P-type material, preferably with minimal doping.
The power factor PF and the figure of merit zT are the two most significant thermoelectric parameters that characterize a thermoelectric material. The figure of merit (zT), which indicates the thermoelectric efficiency of a material, is defined as follows:
z T = α 2 ·   σ κ · T ,
where α represents the Seebeck coefficient, σ represents the electrical conductivity, κ represents the thermal conductivity, and T is the thermodynamic temperature [8,11,25,37,38,39,40,41]. Thermoelectric materials that are used for heat transfer or electricity generation generally possess zT values not exceeding 1 and PF = α2·σ values starting from tens of μW·cm−1·K−2. Therefore, for a material to be considered effectively thermoelectric, it is essential that it possesses the maximum power generation/conversion efficiency (zT). This is achieved by specifying large values for σ and α, while maintaining a low value for κ [2].

2. Results

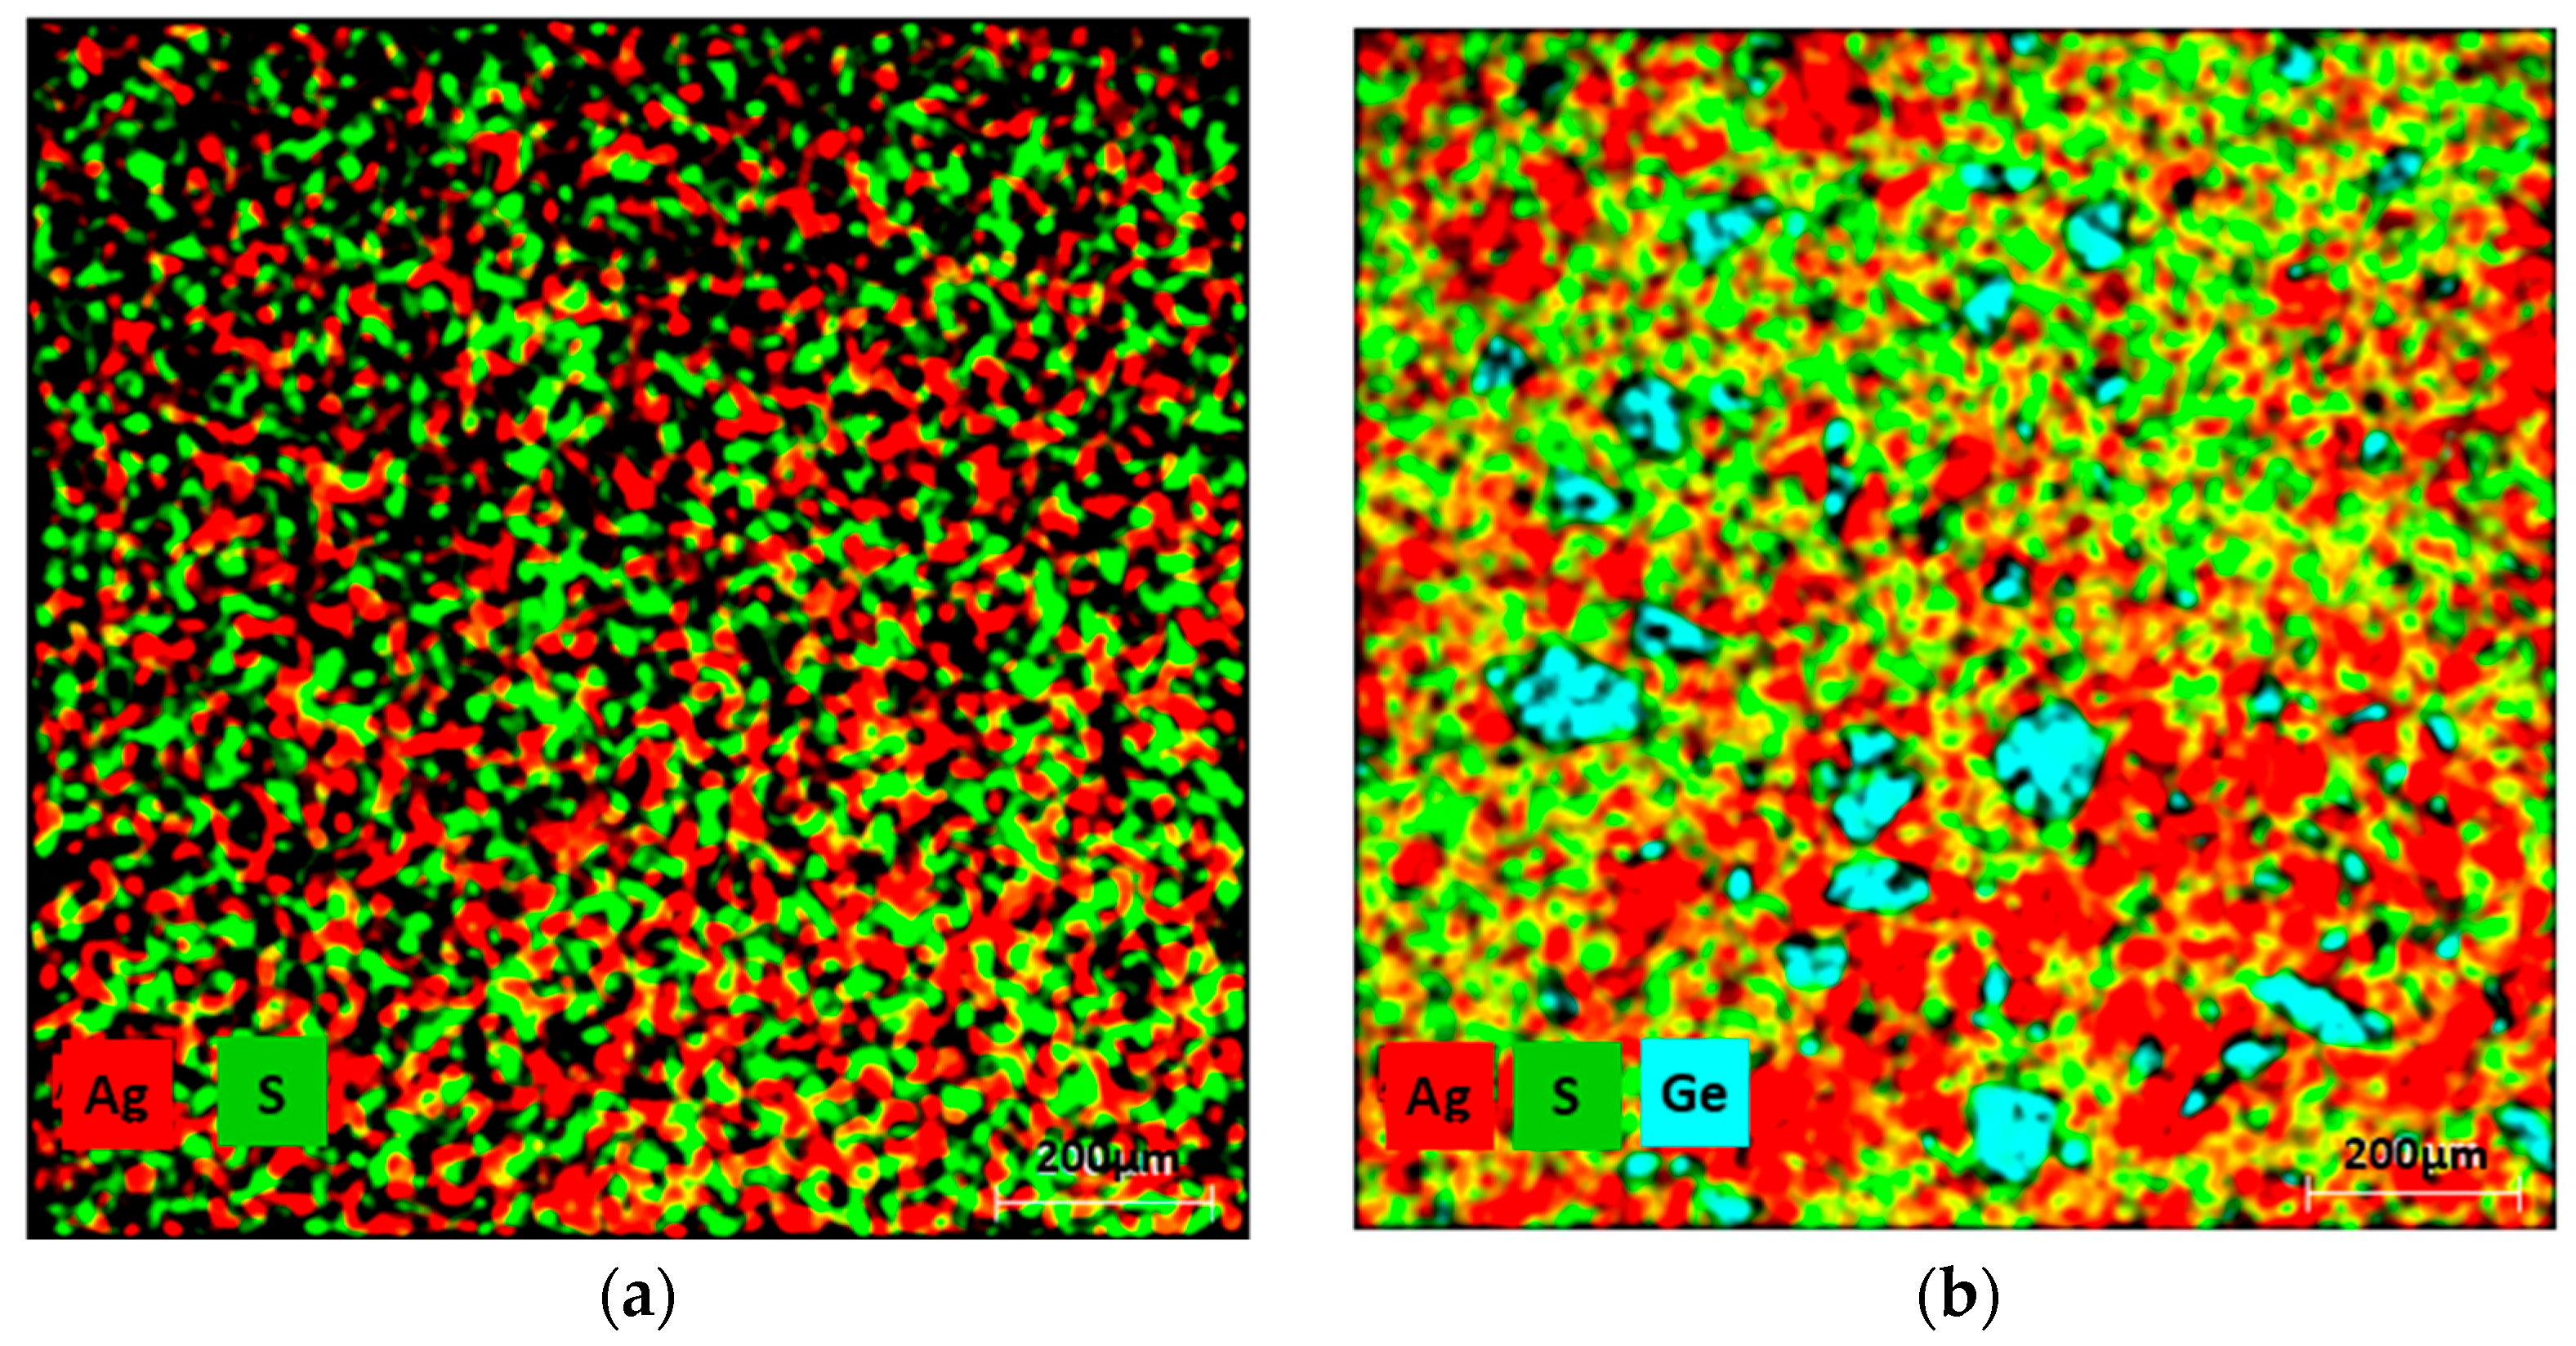
2.1. Chemical Composition and Electron Microscopy Analysis of the Microstructure

A local scanning electron microscopy with energy dispersive X-ray spectroscopy SEM EDX point analysis was carried out on a 1 mm by 1 mm area for each sample. The elemental content (Ag, S, Ge) values for each sample, predicted and measured through EDX, are presented in Table 1 and Figure 1. The known cause for the discrepancies observed in the powder mixtures is the inadequate homogenization of the constituent elements or powders.
SEM (Scanning electron microscopy) cross-sections of the Ag2S and Ag2Ge0.3S0.7 samples are shown in Figure 1. The annealing conditions resulted in the formation of a single crystalline phase α-Ag2S from Ag and S. On the other hand, the Ag2Ge0.3S0.7 sample, rich in Ge, exhibited microstructural characteristics (dark crystallites) that span a spectrum of dimensions, from nearly imperceptible particles to sizable entities exceeding 100 μm. The crystallites consisted entirely of Ge or a compound consisting of Ag, S, and Ge. Ge segregation took place despite the inclusion of Ge particles in the initial mixture. Meanwhile, the sample matrix is defined and illustrated in Figure 2, Figure 3 and Figure 4 as α-Ag2S. Therefore, it is obvious that the Ge particles were not completely incorporated into the α-Ag2S powder through the solid-state reaction. As a result, the material could not have been adequately homogenized at 160 °C (Ge has a melting point of 938 °C). In order to obtain a more comprehensive understanding of the microstructure of the Ag2S and Ag2Ge0.3S0.7 samples, 2D EDX cross-section mapping was carried out (Figure 2 and Figure 3). Ag and S are clearly distributed uniformly in both Ag2S and Ag2Ge0.3S0.7. The exception to this rule is Ag2Ge0.3S0.7, which contains germanium sites (i.e., particles larger than 100 μm or nearly invisible particles); these sites indicate that Ge atoms have not been incorporated into the α-Ag2S unit cell, and thus Ge generates a separate crystalline phase. Ge influenced the overall characteristics of the Ag2S material by forming a small segregated area in the Ag2S matrix.

2.2. X-ray Diffraction Analysis of the Microstructure

The crystalline phases and unit cell parameters of the α-Ag2S-based samples were determined using X-ray diffraction. Diffraction patterns were obtained at room temperature (Figure 4) within the 2θ range of 20–80°. The steps were carried out with a duration of 80 s, and a step size of Δ2θ = 0.03°. The crystalline nature of the samples under investigation was confirmed by the presence of Bragg peaks [42]. The diffraction data were subjected to structural analysis utilizing GSAS-II (Version 5111) software [43]. In order to determine the parameters of the α-Ag2S unit cell, Rietveld refinement was applied. The unit cell parameters of α-Ag2S are as follows, as reported by the Crystallography Open Database (COD): a = 4.229 Å, b = 6.931 Å, c = 7.862 Å, and β = 99.61°. In order to enhance legibility, the observed diffraction patterns were restricted to the range of 2θ = 25–55°.
Figure 4. X-ray diffraction patterns of Ag2GexS(1−x) powder samples; purple vertical lines represent the position of diffraction peaks from the COD database [44].
Inorganics 12 00098 g004
The patterns show that the relative intensity of the individual Bragg peaks differed based on the sample composition. The granules under investigation contained relatively large particles (α-Ag2S, Ge), which significantly contributed to the observed patterns of apparent preferred orientation. Furthermore, a variation in the concentration of the α-Ag2S peaks resulting from a modification in the α-Ag2S unit cell content could potentially be caused by the addition of Ge atoms into the α-Ag2S unit cell. Additionally, the formation of new crystalline phases consisting of pairs, such as Ag and Ge, or S and Ge, could potentially play a role.
The Rietveld refinement of the α-Ag2S crystalline phase (Figure 5) indicates that the volume of α-Ag2S increased slightly with the incorporation of Ge atoms into the α-Ag2S unit cell (Table 2). This resulted in an increase in the dimensions of the unit cell (a, b, and c). The variation in the values of a, b, and c with respect to the Ge content of the samples can be attributed to a modification in the basic cell dimensions. The diffraction data did not reveal the presence of any additional crystalline phases, with the exception of small amounts of Ge in Ag2Ge0.3S0.7 (Figure 5).

2.3. Thermoelectric Properties

In order to evaluate and measure the thermoelectric parameters (α, σ, PF) of the Ag2S-based samples, we utilized rod-shaped samples with a diameter of 4 mm that were fabricated using cold extrusion from annealed powders.
According to the results presented in Figure 6 and Table 3, the absolute value of the Seebeck coefficient decreased as the Ge content of the samples increased. The determined negative value of pure α-Ag2S is α = −1051 µV·K−1.
According to the electrical conductivity measurements (Figure 6, Table 3), an increase in the Ge content of the samples results in a related increase in electrical conductivity. The absolute value of α-Ag2S in pure form is 0.102 S·m−1. The electrical conductivity value provided for each composition is the average of five measurements. Table 4 presents a summary of the materials of Ag2S-based doped Se and Te in various stoichiometric compositions.
According to the PF values (Figure 6, Table 3), an increase in the Ge concentration in the samples results in a related rise in PF. PF is presented at its maximal value for the sample containing the largest quantity of Ge-Ag2Ge0.3S0.7. The PF values of characterized thermoelectric materials, including clathrates (PFMIN = 1.5 μW·cm−1·K−2), Zintl phases (PFMIN = 1.3 μW·cm−1·K−2), and polymer material PEDOT:PSS (PFMIN = 0.01 μW·cm−1·K−2), are comparable to those of the samples under investigation [8,46]. As a result, it is expected that the recently developed thermoelectric material Ag2Ge0.3S0.7 will serve as an acceptable option for implementation in thermoelectric devices.

2.4. Mechanical Properties and Hardness

We selected the density, elastic modulus, microhardness, and nanohardness of Ag2S-based materials for determination in order to characterize their mechanical properties and hardness. An increase in dopant concentration resulted in a stronger Ag2S-based material. Table 5 indicates that the density of the material with the highest doping is 0.13 g·cm−3. The maximal deformation of the samples (compression-induced shrinkage) was 30% of the initial height of the test body, as determined by the uniaxial compression test. Ag2Ge0.3S0.7 showed the greatest variation in yield strength among the materials listed in Table 5. By reducing the yield strength of a material, Ge enhances its resistance to the external compression of the sample.
The Ge content of materials influences their hardness. The microhardness of the thermoelectric materials decreases as the dopant (Ge) content increases, as measured by the Vickers indenter HV 0.1 (Table 5). The microhardness value of the purified Ag2S sample is nearly identical to that of the sample containing the greatest amount of dopant (Table 4). The investigated Ag2S-based materials had a higher microhardness than other frequently used thermoelectric materials, such as PbTe (HV = 0.41 MPa), half-Heusler alloys (HV = 9.1–12.8 MPa), and Mg2Se (HV = 5.3 MPa) [42,47].
The increased microhardness of this material can be ascribed to the substantial quantity of unmelted Ge particles, which lacked adequate homogenization within the powder mixture (see Figure 7a), where a d1 and d2 are diagonals. Pure Ge is classified as one of the hardest elements on the Mohs hardness scale, possessing a hardness of 6. Conversely, S and Ag hold lesser positions on the same scale. Nevertheless, microhardness measurements revealed regions of the sample surfaces that were harder than the Ag2S matrix. Consequently, we decided to measure the nanohardness using the Berkovich indenter HVIT. Figure 7b, which shows the nanohardness measurement, demonstrates that the sample was not homogeneous, as the boundaries of the matrix and Ge particles are evident.
The highest force that could be applied to Ag2Ge0.3S0.7 was 47 GPa. When comparing Ag2S to the most doped material, the force applied to Ag2S was double. Therefore, the mechanical properties of the samples are improved by the addition of Ge.
The results of the present investigation indicate that the Ag2Ge0.3S0.7 material shows improved ductility and resistance to mechanical damage, making it viable for application in thermoelectrical devices that are susceptible to mechanical strain (see Table 5).

3. Discussion

Ag2S that has been doped shows potential as a thermoelectric material. Five samples containing different concentrations of Ge were produced, utilizing the previously mentioned techniques. The chemical composition was verified by means of SEM EDX analysis. The observed values of the components were virtually equivalent to the expected values. It is obvious from the initial Ag and S mapping that the matrix includes regions that are absent (darker). We determined, using EDX analysis, that these regions represent Ge particles that were too large to be incorporated into the structure of the matrix. In order to achieve a more seamless integration into the structure, it becomes essential to consider alternative homogenization techniques.
The addition of Ge causes an increase in the matrix parameter. The correlation between the measured values and the expected values obtained from the COD database was validated by X-ray diffraction. The sample with the greatest amount of Ge showed a measurement error of 13.09% (Rw). The possible cause of this error is an excessive quantity of additive doping that failed to be fully integrated into the Ag2S structure, as indicated in Table 2. It is clear that Ag2Ge0.3S0.7 is a two-phase compound due to inadequate Ge incorporation. As the quantity of doping increases, so do the thermoelectric parameters. From that point forward, the absolute value of the Seebeck coefficient fell by two orders. Conversely, the electrical conductivity exhibited a fourfold increase in comparison to pure Ag2S. The Seebeck coefficient of Ag2Ge0.3S0.7 indicates that as the amount of dopant increased, we approached the N-P-type transition.
The elastic modulus exhibited a range of 18–47 GPa. Between 0 and 0.1 atomic percent Ge, the value of the elastic modulus increased and then decreased; as the amount of Ge increased, the most doped sample achieved its maximum value.
The influence of doping is obvious from the hardness and individual mechanical property measurements. The mechanical properties of the thermoelectric material have been significantly improved as a result of doping. The yield strength decreased from 122 MPa to 71 MPa. Materials doped with Ge exhibit enhanced elasticity, as indicated by the rise in elastic modulus (Table 5).
The microhardness values showed variability, rising from 0.9 GPa to 0.4 GPa, with no discernible correlation. In order to improve the characterization of the mechanical properties of Ag2S-based materials, hardness measurements are indispensable. Hardness could be used to classify the material in its entirety, encompassing its heterogeneous elements.
The endeavor to enhance the properties of Ge by increasing its quantity encounters formidable challenges, primarily attributed to the incomplete integration of Ge within the crystalline lattice. In response to this predicament, we acknowledge the imperative to explore alternative synthesis methodologies aimed at achieving full Ge incorporation into the unit cell. While the introduction of Ge has demonstrated notable enhancements in bulk electrical conductivity, it is imperative to acknowledge the potential inadvertent consequence of heightened thermal conductivity. Accordingly, forthcoming research endeavors will be directed towards surmounting these obstacles and devising strategies to optimize the thermoelectric properties of AgS-based materials.
Furthermore, the partial inclusion of Ge within Ag2S-based materials engenders notable advancements in mechanical and thermoelectric performance. The impact of Ge incorporation on the overall material characteristics underscores the necessity to investigate alternative synthesis techniques that may facilitate complete Ge integration. Noteworthy is the observation that the incorporation of Ge augments the bulk electrical conductivity of the material. However, it is essential to recognize that the concomitant elevation in electrical conductivity may give rise to undesirable increments in thermal conductivity.

4. Materials and Methods

The Ag2S-based samples were manufactured using pure Ag, S, and Ge powders. Each material possessed a purity level of 99.99%. The following particle mixtures were produced by mixing the pure powders in their respective proportions: Ag2S, Ag2Ge0.05S0.95, Ag2Ge0.1S0.9, Ag2Ge0.2S0.8, and Ag2Ge0.3S0.7 (atom. ratio). In determining the doping amounts of the individual samples, it was guaranteed that the amount did not surpass 50% of the overall weight. Then, through a solid-state reaction caused by the melting of sulfur, powder mixtures were annealed for ten hours at 160 °C in a steel container under an argon atmosphere in order to generate homogeneous α-Ag2S-based powders. The annealing temperature was selected in order to inhibit the generation of β-Ag2S within the particles. Following annealing, the granules were compacted through cold extrusion into compact rods measuring 100 mm in length and 4 mm in diameter. These compacted bulk materials were used in order to determine sample properties and analyze the microstructure.
One sample of pure α-Ag2S was produced for the purpose of standardization. The reason Ge was chosen as the dopant in α-Ag2S was due to its classification as a metalloid, and more precisely as a semiconducting element. However, further research is required to determine the impact of Ge on the properties of α-Ag2S. The objective of our investigation was to modify the thermoelectric characteristics of α-Ag2S through the replacement of S in its unit cell with Ge.
Two scanning electron microscopes (SEM), JSM 7000F JEOL (Japan) and Vega 3 LMU Tescan (Czechia), were utilized to analyze the chemical composition and microstructure of the samples. Prior to each SEM examination, a 10 mm-long section of the cold-extruded rods was cut. These sections were then cold-mounted with a mounting compound to expose their cross-sections, followed by grinding and polishing. Each microscope was equipped with an EDX analyzer to measure elemental energy dispersive X-rays. The Tescan Vega 3 LMU was used for elemental composition mapping via EDX, while the JEOL JSM 7000F was employed to validate the chemical composition.
In order to discover the phase composition and unit cell parameters of α-Ag2S in powder samples that were not compact, X-ray diffraction was applied. A X-Pert Pro diffractometer Philips (Amsterdam, The Netherlands) was used with a Cu X-ray tube and a value of λ = 1.5418 Å.
The Seebeck coefficient of the 10 mm rods was measured using a device developed in-house. The Keithley 2100/230-240 MULTIMETER served as the potential measuring instrument. Type K thermocouples were employed for temperature measurement, while two Peltier modules were utilized for heating and cooling. Temperature and potential data were collected using brass receptacles (see Figure 8). To ensure stable electrical and thermal contact, the samples were firmly pressed between two brass holders under constant pressure. A hole was created in one brass holder to ensure close contact of the type K thermocouples with the sample, while apertures on the opposing side facilitated cable access for potential measurement. Peltier modules were positioned at both ends of the apparatus to establish a temperature gradient. Electrical conductivity was measured using the same setup, with minor changes. Peltier modules were turned on and additional steel needle spring-loaded probes were pressed against the sample. The rest of the wiring used was copper.
Prior to the measurements, the entire apparatus was calibrated using rods composed of purified elements (Bi, Ni, Sb, and Te) with known Seebeck coefficient values. A 5 °C temperature difference was maintained between the cooled and heated ends of the rod samples, with the cooled end slightly below ambient temperature. Temperature and potential measurements were conducted during the heating, stabilization, and cooling phases. The Seebeck coefficient value was determined by analyzing the temperature difference against the potential for both heating and cooling phases, and a linear function was applied to the data. A linear correction factor, based on the calibration, was then applied. A separate comprehensive explanation and characterization of the apparatus is currently being developed.
Two independent tests were chosen to evaluate the mechanical properties of the prepared samples: the uniaxial compression test and the hardness test.
The purpose of conducting hardness tests, which include both nanohardness and microhardness tests, was to assess the resistance of small samples to plastic deformation induced by a standardized source. The objective of these experiments was to investigate the influence of the dopant on the mechanical properties of the samples.
The methodology employed for measuring the elastic modulus and nanohardness involves depth sensing indentation (DSI) using TTT-NHT testing apparatus (CSM Instruments, Peseux, Switzerland). The tests were conducted in linear mode with a Berkovich pyramid diamond tip. A force of 50 mN was applied to each sample for a duration of 10 s, with loading and unloading processes occurring at a speed of 150 mN/min. The load-penetration depth (P-h) profiles obtained were analyzed following the Oliver and Pharr method [48]. This analysis included the calculation of elastic and plastic deformation energies, as well as the determination of hardness and elastic modulus values as a function of depth. A maximum of 15 indentations were performed, and the resulting data underwent statistical analysis [47,48].
Using a Vickers indenter and a Wilson–Wolper Tukon 1102 microhardness instrument (Esslinger, Germany), the microhardness HV was determined to be 0.1. Each sample was examined a maximum of ten times with a 10-s hold and a 100 mN force.
The purpose of the uniaxial compression tests was to determine the behavior of the samples under crushing stresses. The examinations were performed utilizing a TIRATEST 2300 instrument (TIRA, Schalkau, Germany). Cylindrical test samples with a diameter-to-length ratio of 1:2 were manufactured in accordance with the ASTM-E9-89 standard [49,50].
The length of the analyzed samples was 8 mm, with a diameter of 4 mm. To ensure the reproducibility of the results, a minimum of five samples of each composition were produced for data collection. The compression of the samples occurred at a rate of 0.2 mm/min. The densities of the samples were determined using Archimedes’ method, for which each sample was weighed at least five times to ensure accuracy.

5. Conclusions

The addition of Ge significantly improves the power factor of materials based on Ag2S. Cold extrusion using a hydraulic press is a potentially effective manufacturing technique that yields increased hardness levels. The following material compositions—Ag2S, Ag2Ge0.05S0.95, Ag2Ge0.1S0.9, Ag2Ge0.2S0.8, and Ag2Ge0.3S0.7—were manufactured and characterized. The power factor (PF) value of pure Ag2S is close to zero. However, Ge doping significantly enhances the electrical conductivity and produces a more positive Seebeck coefficient. Our attempt to create an entirely P-type material for use in thermoelectric homojunctions with minimal dopant quantities failed. The sample containing Ag2Ge0.3S0.7 had the highest PF. In subsequent attempts to achieve more efficient dopant–material integration, an alternative homogenization technique should be implemented. The results suggest that the materials created contain two distinct phases, namely, Ag2S and unincorporated Ge. As previously established, the basic cell retains its dimensions; furthermore, X-ray diffraction indicates that dopant integration into the structure is only partial. The crystalline character of the Bragg diffraction peaks is consistent with previously available data. Additionally, SEM EDX confirmed that Ge was not incorporated into the Ag2S, but rather dispersed throughout the sample as larger Ge grains. Insufficient dopant integration was achieved through the selected procedure. The results obtained from the measurements clearly indicate that the dopant had an impact on various properties, including mechanical and hardness characteristics, even when present as individual granules of Ge within the structure. Alternative synthesis techniques might be more appropriate for achieving complete Ge incorporation into the unit cell. The incorporation of Ge into the material results in an enhancement of its bulk electrical conductivity. A rise in thermal conductivity, on the other hand, could be an unintended consequence of an increase in electrical conductivity. Doping increases the elasticity and flexibility of the material, which suggests potential applications in the field of ubiquitous electronic devices and sensors. In conclusion, the potential of Ag2S-based materials partially doped with Ge to exhibit enhanced mechanical and thermoelectric properties was demonstrated. However, it is evident that the achieved power factor of 0.38 μWcm−1K−2 falls short of the levels required for practical thermoelectric applications. Future research efforts should focus on optimizing the synthesis method to fully incorporate Ge into the unit cell and exploring strategies to significantly enhance the power factor by at least one order of magnitude. It is essential to consider the trade-off between improving electrical conductivity and minimizing the undesirable increase in thermal conductivity associated with Ge doping.

Author Contributions

Conceptualization, G.H., F.M. and K.S.; methodology, R.D., Z.M., B.B., P.L., A.P. and K.S.; investigation, W.M., G.H. and F.M.; data curation, G.H. and F.M.; writing—review and editing, G.H. and F.M. All authors have read and agreed to the published version of the manuscript.

Funding

This work was supported by the Slovak Research and Development Agency (contract nos.: APVV-20-0138, APVV-20-0205, and APVV-22-0289); the Scientific Grant Agency of the Ministry of Education, Science, Research and Sport of the Slovak Republic and the Slovak Academy of Sciences (VEGA project no.: 2/0039/22; KEGA project no.: 011TUKE-4/2023); and the Technical University of Kosice (grant number: 05/TUKE/2023). This research was funded in part by the international project EIG CONCERT- Japan/2021/215/EHSAL.

Data Availability Statement

The data presented in this study are available upon request from the corresponding author.

Conflicts of Interest

The authors declare no conflicts of interest.

References

  1. Lundstrom, M.; Jeong, C. Near-Equilibrium Transport: Fundamentals and Applications; Lessons from Nanoscience; World Scientific: Singapore; Hackensack, NJ, USA, 2013; Volume 2. [Google Scholar]
  2. Goldsmid, H.J. Introduction to Thermoelectricity; Springer Series in Materials Science; Springer: Berlin/Heidelberg, Germany, 2016; Volume 121. [Google Scholar] [CrossRef]
  3. Goldsmid, H.J. The Physics of Thermoelectric Energy Conversion; IOP Publishing: Bristol, UK, 2017. [Google Scholar] [CrossRef]
  4. Wei, J.; Yang, L.; Ma, Z.; Song, P.; Zhang, M.; Ma, J.; Yang, F.; Wang, X. Review of current high-ZT thermoelectric materials. J. Mater. Sci. 2020, 55, 12642–12704. [Google Scholar] [CrossRef]
  5. Jayathilaka, W.A.D.M.; Qi, K.; Qin, Y.; Chinnappan, A.; Serrano-García, W.; Baskar, C.; Wang, H.; He, J.; Cui, S.; Thomas, S.W.; et al. Significance of Nanomaterials in Wearables: A Review on Wearable Actuators and Sensors. Adv. Mater. 2019, 31, 1805921. [Google Scholar] [CrossRef] [PubMed]
  6. He, R.; Schierning, G.; Nielsch, K. Thermoelectric Devices: A Review of Devices, Architectures, and Contact Optimization. Adv. Mater. Technol. 2018, 3, 1700256. [Google Scholar] [CrossRef]
  7. Yang, S.; Qiu, P.; Chen, L.; Shi, X. Recent Developments in Flexible Thermoelectric Devices. Small Sci. 2021, 1, 2100005. [Google Scholar] [CrossRef]
  8. Wolf, M.; Hinterding, R.; Feldhoff, A. High Power Factor vs. High zT—A Review of Thermoelectric Materials for High-Temperature Application. Entropy 2019, 21, 1058. [Google Scholar] [CrossRef]
  9. Sootsman, J.R.; Chung, D.Y.; Kanatzidis, M.G. New and Old Concepts in Thermoelectric Materials. Angew. Chem. Int. Ed. 2009, 48, 8616–8639. [Google Scholar] [CrossRef]
  10. Mitra, M.; Benton, A.; Akhanda, M.S.; Qi, J.; Zebarjadi, M.; Singh, D.J.; Poon, S.J. Conventional Half-Heusler alloys advance state-of-the-art thermoelectric properties. Mater. Today Phys. 2022, 28, 100900. [Google Scholar] [CrossRef]
  11. Tian, Z.; Lee, S.; Chen, G. Comprehensive review of heat transfer in thermoelectric materials and devices. Annu. Rev. Heat Transf. 2014, 17, 425–483. [Google Scholar] [CrossRef]
  12. Riffat, S.B.; Ma, X. Thermoelectrics: A review of present and potential applications. Appl. Therm. Eng. 2003, 23, 913–935. [Google Scholar] [CrossRef]
  13. Chen, L.; Liu, R.; Shi, X. General principles of thermoelectric technology. In Thermoelectric Materials and Devices; Elsevier: Amsterdam, The Netherlands, 2021; pp. 1–18. [Google Scholar] [CrossRef]
  14. Dahal, T.; Jie, Q.; Joshi, G.; Chen, S.; Guo, C.; Lan, Y.; Ren, Z. Thermoelectric property enhancement in Yb-doped n-type skutterudites YbxCo4Sb12. Acta Mater. 2014, 75, 316–321. [Google Scholar] [CrossRef]
  15. Bell, L.E. Cooling, Heating, Generating Power, and Recovering Waste Heat with Thermoelectric Systems. Science 2008, 321, 1457–1461. [Google Scholar] [CrossRef] [PubMed]
  16. Zuhud, A.M.; Mochammad, F.; Widayat, W. Thermoelectric application in energy conservation. E3S Web Conf. 2018, 73, 01009. [Google Scholar] [CrossRef]
  17. Liu, Z.; Tian, B.; Li, Y.; Guo, Z.; Zhang, Z.; Luo, Z.; Zhao, L.; Lin, Q.; Lee, C.; Jiang, Z. Evolution of Thermoelectric Generators: From Application to Hybridization. Small 2023, 19, 2304599. [Google Scholar] [CrossRef]
  18. Lv, H.; Liang, L.; Zhang, Y.; Deng, L.; Chen, Z.; Liu, Z.; Wang, H.; Chen, G. A flexible spring-shaped architecture with optimized thermal design for wearable thermoelectric energy harvesting. Nano Energy 2021, 88, 106260. [Google Scholar] [CrossRef]
  19. Luan, W. Recent developments of thermoelectric power generation. Chin. Sci. Bull. 2004, 49, 1212. [Google Scholar] [CrossRef]
  20. Demirbas, A. Global Renewable Energy Projections. Energy Sources Part B Econ. Plan. Policy 2009, 4, 212–224. [Google Scholar] [CrossRef]
  21. Polozine, A.; Sirotinskaya, S.; Schaeffer, L. History of development of thermoelectric materials for electric power generation and criteria of their quality. Mater. Res. 2014, 17, 1260–1267. [Google Scholar] [CrossRef]
  22. Cao, T.; Shi, X.-L.; Chen, Z.-G. Advances in the design and assembly of flexible thermoelectric device. Prog. Mater. Sci. 2023, 131, 101003. [Google Scholar] [CrossRef]
  23. Dhass, A.D.; Babu, L.G.; Pradhan, R.; Murthy, G.V.K.; Sreenivasan, M. Energy Harvesting Through Thermoelectric Generators. In Materials and Technologies for a Green Environment; Harikrishnan, S., Ed.; Bentham Science Publishers: Soest, The Netherlands, 2023; pp. 32–66. [Google Scholar] [CrossRef]
  24. Zhou, W.-X.; Wu, D.; Xie, G.; Chen, K.-Q.; Zhang, G. α-Ag2S: A Ductile Thermoelectric Material with High ZT. ACS Omega 2020, 5, 5796–5804. [Google Scholar] [CrossRef]
  25. Zhu, M.; Shi, X.-L.; Wu, H.; Liu, Q.; Chen, Z.-G. Advances in Ag2S-based thermoelectrics for wearable electronics: Progress and perspective. Chem. Eng. J. 2023, 473, 145236. [Google Scholar] [CrossRef]
  26. Wei, T.; Qiu, P.; Zhao, K.; Shi, X.; Chen, L. Ag2Q-Based (Q = S, Se, Te) Silver Chalcogenide Thermoelectric Materials. Adv. Mater. 2023, 35, 2110236. [Google Scholar] [CrossRef] [PubMed]
  27. Shi, X.; Chen, H.; Hao, F.; Liu, R.; Wang, T.; Qiu, P.; Burkhardt, U.; Grin, Y.; Chen, L. Room-temperature ductile inorganic semiconductor. Nat. Mater. 2018, 17, 421–426. [Google Scholar] [CrossRef] [PubMed]
  28. Živković, D.; Sokić, M.; Živković, Ž.; Manasijević, D.; Balanović, L.; Štrbac, N.; Ćosović, V.; Boyanov, B. Thermal study and mechanism of Ag2S oxidation in air. J. Therm. Anal. Calorim. 2013, 111, 1173–1176. [Google Scholar] [CrossRef]
  29. Gusev, A.I.; Sadovnikov, S.I. Acanthite–argentite transformation in nanocrystalline silver sulfide and the Ag2S/Ag nanoheterostructure. Semiconductors 2016, 50, 682–687. [Google Scholar] [CrossRef]
  30. Liang, J.; Wang, T.; Qiu, P.; Yang, S.; Ming, C.; Chen, H.; Song, Q.; Zhao, K.; Wei, T.R.; Ren, D.; et al. Flexible thermoelectrics: From silver chalcogenides to full-inorganic devices. Energy Environ. Sci. 2019, 12, 2983–2990. [Google Scholar] [CrossRef]
  31. Li, L.; Peng, C.; Chen, J.; Ma, Z.; Chen, Y.; Li, S.; Wang, J.; Wang, C. Study the effect of alloying on the phase transition behavior and thermoelectric properties of Ag2S. J. Alloys Compd. 2021, 886, 161241. [Google Scholar] [CrossRef]
  32. Pal’yanova, G.A.; Chudnenko, K.V.; Zhuravkova, T.V. Thermodynamic properties of solid solutions in the system Ag2S–Ag2Se. Thermochim. Acta 2014, 575, 90–96. [Google Scholar] [CrossRef]
  33. Wang, H.; Ma, H.; Duan, B.; Geng, H.; Zhou, L.; Li, J.; Zhang, X.; Yang, H.; Li, G.; Zhai, P. High-Pressure Rapid Preparation of High-Performance Binary Silver Sulfide Thermoelectric Materials. ACS Appl. Energy Mater. 2021, 4, 1610–1618. [Google Scholar] [CrossRef]
  34. Tarachand; Mukherjee, B.; Saxena, M.; Kuo, Y.K.; Okram, G.S.; Dam, S.; Hussain, S.; Lakhani, A.; Deshpande, U.; Shripathi, T. Ag-Nanoinclusion-Induced Enhanced Thermoelectric Properties of Ag2S. ACS Appl. Energy Mater. 2019, 2, 6383–6394. [Google Scholar] [CrossRef]
  35. Wakhare, S.Y.; Deshpande, M.D. Structural, electronic and optical properties of metalloid element (B, Si, Ge, As, Sb, and Te) doped g-ZnO monolayer: A DFT study. J. Mol. Graph. Model. 2020, 101, 107753. [Google Scholar] [CrossRef]
  36. Chen, H.; Shao, C.; Huang, S.; Gao, Z.; Huang, H.; Pan, Z.; Zhao, K.; Qiu, P.; Wei, T.R.; Shi, X. High-Entropy Cubic Pseudo-Ternary Ag2 (S, Se, Te) Materials With Excellent Ductility and Thermoelectric Performance. Adv. Energy Mater. 2023, 14, 2303473. [Google Scholar] [CrossRef]
  37. Singh, J.; Verma, S.S. Global Journal of Researches in Engineering Electrical and Electronics Engineering. Comp. Fig. Merit Some Common Thermocouples High Temp. Range 2013, 11, 1–7. [Google Scholar]
  38. Chen, L.; Liu, R.; Shi, X. Strategies to optimize thermoelectric performance. In Thermoelectric Materials and Devices; Elsevier: Amsterdam, The Netherlands, 2021; pp. 19–50. [Google Scholar] [CrossRef]
  39. Giri, K.; Wang, Y.-L.; Chen, T.-H.; Chen, C.-H. Challenges and strategies to optimize the figure of merit: Keeping eyes on thermoelectric metamaterials. Mater. Sci. Semicond. Process. 2022, 150, 106944. [Google Scholar] [CrossRef]
  40. Tripathi, M.N.; Bhandari, C.M. Material parameters for thermoelectric performance. Pramana J. Phys. 2005, 65, 469–479. [Google Scholar] [CrossRef]
  41. Dehkordi, A.M.; Zebarjadi, M.; He, J.; Tritt, T.M. Thermoelectric power factor: Enhancement mechanisms and strategies for higher performance thermoelectric materials. Mater. Sci. Eng. R Rep. 2015, 97, 1–22. [Google Scholar] [CrossRef]
  42. Guttmann, G.M.; Gelbstein, Y. Mechanical Properties of Thermoelectric Materials for Practical Applications. In Bringing Thermoelectricity into Reality; Aranguren, P., Ed.; InTech: London, UK, 2018. [Google Scholar] [CrossRef]
  43. Toby, B.H.; Von Dreele, R.B. GSAS-II: The genesis of a modern open-source all purpose crystallography software package. J. Appl. Crystallogr. 2013, 46, 544–549. [Google Scholar] [CrossRef]
  44. Gražulis, S.; Daškevič, A.; Merkys, A.; Chateigner, D.; Lutterotti, L.; Quiros, M.; Serebryanaya, N.R.; Moeck, P.; Downs, R.T.; Le Bail, A. Crystallography Open Database (COD): An open-access collection of crystal structures and platform for world-wide collaboration. Nucleic Acids Res. 2012, 40, D420–D427. [Google Scholar] [CrossRef] [PubMed]
  45. Chen, H.; Wei, T.R.; Zhao, K.; Qiu, P.; Chen, L.; He, J.; Shi, X. Room-temperature plastic inorganic semiconductors for flexible and deformable electronics. InfoMat 2021, 3, 22–35. [Google Scholar] [CrossRef]
  46. Gayner, C.; Kar, K.K. Recent advances in thermoelectric materials. Prog. Mater. Sci. 2016, 83, 330–382. [Google Scholar] [CrossRef]
  47. Qian, L.; Li, M.; Zhou, Z.; Yang, H.; Shi, X. Comparison of nano-indentation hardness to microhardness. Surf. Coat. Technol. 2005, 195, 264–271. [Google Scholar] [CrossRef]
  48. Oliver, W.C.; Pharr, G.M. An improved technique for determining hardness and elastic modulus using load and displacement sensing indentation experiments. J. Mater. Res. 1992, 7, 1564–1583. [Google Scholar] [CrossRef]
  49. E33 Committee. Classification for Determination of Single-Number Metrics for Impact Noise; ASTM International: West Conshohocken, PA, USA, 2021. [Google Scholar] [CrossRef]
  50. E28 Committee. Test Methods of Compression Testing of Metallic Materials at Room Temperature; ASTM International: West Conshohocken, PA, USA, 2022. [Google Scholar] [CrossRef]
Figure 1. SEM images of (a) Ag2S and (b) Ag2S0.03S0.7 via JEOL.
Inorganics 12 00098 g001
Figure 2. Combined elemental distribution obtained via TESCAN EDX mapping, where red represents Ag, green represents S, and turquoise represents Ge: (a) Ag2S, (b) Ag2Ge0.3S0.7.
Inorganics 12 00098 g002
Figure 3. Elemental distribution via TESCAN EDX mapping: (a) Ag2S, (b) Ag2Ge0.3S0.7.
Inorganics 12 00098 g003
Figure 5. Rietveld refinement of the α-Ag2S crystalline phase: (a) Ag2S, (b) Ag2Ge0.05S0.95, (c) Ag2Ge0.1S0.9, (d) Ag2Ge0.2S0.8, (e) Ag2Ge0.3S0.7. The green line shows calculated diffraction patterns; other colored lines show observed diffraction patterns; the black line shows the difference between observed and calculated data.
Inorganics 12 00098 g005
Figure 6. Thermoelectric parameters vs. Ge content in α-Ag2S-based samples: (a) Seebeck coefficient, (b) electrical conductivity σ, (c) power factor (PF), the black symbols represent error bars.
Inorganics 12 00098 g006
Figure 7. (a) Vickers indenter applied in the matrix of Ag2S; (b) particle of Ag2Ge0.05S0.95 incorporated via Berkovich indenter.
Inorganics 12 00098 g007
Figure 8. Schematic of the apparatus used for (a) Seebeck coefficient and (b) electrical conductivity measurements.
Inorganics 12 00098 g008
Table 1. Chemical composition of the analyzed materials.
Expected CompositionAg2SAg2Ge0.05S0.95Ag2Ge0.1S0.9Ag2Ge0.2S0.8Ag2Ge0.3S0.7
MeasuredAg (at.%)2.062.051.951.831.85
Ge (at.%)00.0720.230.420.51
S (at.%)0.940.880.820.750.64
Table 2. Parameters of the α-Ag2S unit cell obtained via the Rietveld refinement of X-ray diffraction data, and the standard deviation of the parameters of the unit cell.
a [Å]b [Å]c [Å]β [°]Rw
Ag2S4.228 ± 0.0016.928 ± 0.0017.864 ± 0.00299.649 ± 0.0044.57
Ag2Ge0.05S0.954.225 ± 0.0016.926 ± 0.0017.862 ± 0.00299.662 ± 0.0045.17
Ag2Ge0.1S0.94.228 ± 0.00026.929 ± 0.00027.865 ± 0.00199.652 ± 0.0023.44
Ag2Ge0.2S0.84.230 ± 0.0016.931 ± 0.0017.867 ± 0.00399.656 ± 0.0075.12
Ag2Ge0.3S0.74.224 ± 0.0026.924 ± 0.0027.852 ± 0.00599.692 ± 0.01313.09
Table 3. Thermoelectric properties of the α-Ag2S based samples.
Ag2SAg2Ge0.05S0.95Ag2Ge0.1S0.9Ag2Ge0.2S0.8Ag2Ge0.3S0.7
σ [S·m−1]0.1022.3 ± 0.614.2 ± 658.2 ± 16.55106.2 ± 172
α [µV·K−1]−1051−408 ± 10−397 ± 5−243 ± 12−87 ± 4
PF [μW·cm−1·K−2]0.00110.00390.02240.03430.3873
Table 4. Thermoelectrical properties of Ag2S-based materials; TC represents the phase-transition temperature of composition [25,45].
MaterialTC [°C]ZTPF [μW·cm−1·K−2]
Ag2S1776.3 × 10−50.0011
Ag2S0.9Se0.11477.6 × 10−40.013
Ag2S0.7Se0.31090.0751.08
Ag2S0.5Se0.5820.264.84
Ag2S0.4Se0.63501.0821.45
Ag2S0.8Te0.2-0.255.3
Ag2S0.5Se0.45Te0.05570.444.96
Table 5. Mechanical properties of Ag2S-based materials.
Ag2SAg2Ge0.05S0.95Ag2Ge0.1S0.9Ag2Ge0.2S0.8Ag2Ge0.3S0.7
ρ [g·cm−3]7.227.247.267.397.35
Rp0,2 [MPa]12284739171
HV 0.13632262634
HIT [GPa]0.5 ± 0.040.8 ± 0.020.4 ± 0.050.4 ± 0.010.9 ± 0.02
EIT [GPa]24 ± 130 ± 122 ± 218 ± 247 ± 6
Disclaimer/Publisher’s Note: The statements, opinions and data contained in all publications are solely those of the individual author(s) and contributor(s) and not of MDPI and/or the editor(s). MDPI and/or the editor(s) disclaim responsibility for any injury to people or property resulting from any ideas, methods, instructions or products referred to in the content.

