Article

Deep Impact: A Study on the Impact of Data Papers and Datasets in the Humanities and Social Sciences

1
Department of Digital Humanities, King’s College London, London WC2R 2LS, UK
2
Institut des Sciences du Langage (ISLa), University of Neuchâtel, 2000 Neuchâtel, Switzerland
3
The Alan Turing Institute, London NW1 2DB, UK
4
Department of Law and Criminology, Royal Holloway, University of London, London TW20 0EX, UK
5
Department of Theoretical and Applied Linguistics, University of Cambridge, Cambridge CB2 1TN, UK
6
Department of Psychology, University of Johannesburg, Johannesburg 2000, South Africa
7
Department of Humanities, Ca’ Foscari University of Venice, 30123 Venice, Italy
*
Author to whom correspondence should be addressed.
Publications 2022, 10(4), 39; https://doi.org/10.3390/publications10040039
Submission received: 19 July 2022 / Revised: 23 September 2022 / Accepted: 10 October 2022 / Published: 15 October 2022
(This article belongs to the Special Issue Research Data and Data Papers)

Abstract

:
The humanities and social sciences (HSS) have recently witnessed an exponential growth in data-driven research. In response, attention has been afforded to datasets and accompanying data papers as outputs of the research and dissemination ecosystem. In 2015, two data journals dedicated to HSS disciplines appeared in this landscape: Journal of Open Humanities Data (JOHD) and Research Data Journal for the Humanities and Social Sciences (RDJ). In this paper, we analyse the state of the art in the landscape of data journals in HSS using JOHD and RDJ as exemplars by measuring performance and the deep impact of data-driven projects, including metrics (citation count; Altmetrics, views, downloads, tweets) of data papers in relation to associated research papers and the reuse of associated datasets. Our findings indicate: that data papers are published following the deposit of datasets in a repository and usually following research articles; that data papers have a positive impact on both the metrics of research papers associated with them and on data reuse; and that Twitter hashtags targeted at specific research campaigns can lead to increases in data papers’ views and downloads. HSS data papers improve the visibility of datasets they describe, support accompanying research articles, and add to transparency and the open research agenda.

1. Introduction

The notion of ‘openness’ in research is defined by the Open Knowledge Foundation as ‘A piece of content or data is open if anyone is free to use, reuse, and redistribute it—subject only, at most, to the requirement to attribute and share-alike’ 1. Open research not only covers open access academic articles, but more broadly the open publication of artefacts such as data, protocols, or other research products 2. In recent years, the values of open research have been promoted via a series of initiatives, institutions and projects, and we are witnessing a growing awareness among the scholarly community of the benefits that can arise from the implementation of open access practices. In different countries, public funding has imposed increasing requirements on research results to be published in open access venues. The FAIR principles 3 were published in 2016 with the goal to provide guidelines for the management of the research workflow, particularly with regard to data, respecting the criteria of findability, accessibility, interoperability, and reuse. Since 2018, Coalition S has supported Plan S, an initiative which requires scientific publications resulting from research funded publicly to be published in “compliant Open Access journals of platforms” 4. Among the institutions that have joined this initiative are UK Research and Innovation, The Research Council of Norway, and the National Science Centre in Poland.
In this context, attention to questions around open research in the humanities and social sciences (HSS) has gradually grown in recent years. This has been enabled by a range of factors. First, the increasing availability of digital collections and the application of data-intensive methods in digital humanities (DH) has made it possible to answer research questions at a scale which was unimaginable before. Born-digital data such as dynamic data from social networks and human-generated or machine-generated web content are widely used, and present infrastructural challenges that are being noticed and addressed (see, e.g., [1]). In the field of HSS, projects and networks such as the Social Sciences & Humanities Open Cloud project (SSHOC) 5, the Association of European Research Libraries (LIBER) 6, and the Common Language Resources and Technology Infrastructure [2], among others, contribute to promoting open research values and offer researchers a support network to pursue them. These principles guarantee more transparency concerning the data, methods and tools employed in the research process; they open to collaborative working, allowing other researchers to offer their input, thus improving the data and the results themselves; they provide new and different options for the dissemination of individual research, widening the audience that can be reached; indirectly, they improve the quality of the datasets that are publicly released, encouraging researchers to provide cleaner data and metadata, alongside a rich documentation.
With varying intensity, research councils around the world have been creating policies to incentivise open research practices and make funded research available to the widest possible audience. Accordingly, the effects of open scholarship and the practices that facilitate it are substantial, both for the research and broader community who can access the data, as well as for the authors who benefit from increased reach of their research, measured in terms of downloads and citations. Having greater visibility and detailed descriptions of openly available datasets, usually in the form of data papers, has started to be recognised as an important practice within open scholarship. This paper therefore focuses on the role data papers play in the impact of HSS research and in their effect on the visibility of research. In the rest of Section 1 we present an overview of the current landscape of data journals and data papers as situated within the pyramid structure of the research and dissemination ecosystem, with a particular focus on the two journals dedicated to the dissemination of HSS data papers, the Journal of Open Humanities Data (JOHD) and Research Data Journal for the Humanities and Social Sciences (RDJ). Section 2 describes the data and methods used in this study, while Section 3 presents our results and Section 4 ends with a final discussion and conclusion.

1.1. Data Journals and Data Papers

The academic publishing landscape has followed (and in some cases anticipated) the trend towards the adoption of open research practices via the introduction of a number of innovative approaches. These include the launch of new publishing venues that target non-traditional research outputs, such as data, code and hardware. In this context, starting from 2012, Ubiquity Press has launched a series of so-called “metajournals” which publish articles focussed on research data, software, hardware and bioresources 7. Their goal is to incentivise the open sharing of these resources according to best practices. In return, the journals provide authors with a publication, associated opportunities for citations, and the ability to publicise and increase the reuse of their resources. Data journals are peer-reviewed academic journals dedicated to the publication of data papers, i.e., research articles that describe one or more proficiently curated datasets. Unlike traditional research journals, which typically focus on theoretical insights or on the methods and/or interpretation of the results of the research process, data journals focus on an aspect of the research workflow often undervalued, namely the creation, management, processing, access and usage issues around datasets. This is particularly important because, under the current publications-focused rewards system, in many disciplines the researchers producing the data do not receive due academic recognition for their contributions.
The literature presents a prolific discussion on how data papers should be defined. The debate covers the type of content a data paper should include, the criteria that should be adopted in order to evaluate it, and the possibility of a standard peer review. Callaghan et al. [3] define a data paper as an article that aims at describing a dataset that is available in open access, the context in which it was created, the process of creation behind it and its reuse potential (the ‘what, where, why, how and who of the data’). Schöpfel et al. [4] give an overview of the discussion by presenting the different objectives outlined by journals that launched their data paper sections. They mention, for instance, the opportunity to obtain datasets of higher quality, offer other researchers and students the chance to access the data, open to new insights or research angles on the data. The same authors also show that not only the objectives, but the very definition of data paper is far from being settled. Slightly different definitions are given, for instance, by Bordelon et al. [5], who define it as a paper meant to present the data and the tools being used in a research process; Pärtel [6] rather considers the data paper as an “abstract” that is meant to document the deposited data; Penev et al. [7] consider it as a scholarly journal publication which is focused on the description of the data and not on the illustration of an investigation process.

1.1.1. The Research and Dissemination Ecosystem in Data-Driven Projects

Data papers are one of the ways in which the scientific community can improve its research in view of open science research and data sharing. Data papers form part of a multi-layer research and dissemination ecosystem in data-driven projects. In [8] we proposed to visualise this ecosystem as a pyramid: (1) the project repository (e.g., GitHub), (2) the data repository (e.g., Figshare or Zenodo), (3) the data paper, and (4) the research paper (see Figure 1). The traditional reward mechanism in HSS focuses almost exclusively on the analytical research paper on the top of this pyramid and fails to give due credit to the work undertaken at the underlying layers of data-driven open research projects. The pyramid model also makes it explicit that the analytical research paper on top presents only one possible interpretation of the collected data which are open for alternative analyses. For the purpose of impact and reuse, the structured dataset and the methods used for creating them may be more important than the one interpretation recorded in the research paper.
The four layers of the pyramid are explained here on the example of a DH research project investigating the structure and language of Emperor Justinian’s Roman law compendium known as the Digest (533 CE). At the bottom of the pyramid lies the project repository which contains all resource and intermediary files, supporting documents, and the programming scripts used for processing the data. The project repository [9] is the researcher’s public workplace where version control (via git, for example) guarantees that no work is lost, and one can toggle back to previous versions in case one direction of research proves to be a dead end. The project repository’s corresponding documentation requires a fine balance: it needs to be detailed enough to make the research transparent and reproducible, but it should not slow down the project unnecessarily. The second layer of the pyramid is the dataset deposited in a public repository. The structured data are presented here with lean documentation and the necessary instructions for its reuse. The pyDigest project used Figshare which was also the location of the revised database [10]. Figshare, like other repositories, makes it possible to publish version updates without deleting previous ones. The repository has one digital object identifier (DOI) which is marked with the appropriate version number. In our case, a published SQLite database was accompanied with sample queries.
The third layer of the pyramid is the data paper [11] which points to and describes the data published in the public repository. The data paper directs attention to the resource and emphasises its reuse potential. It gives an opportunity to describe the historical and methodological context of the project and provides a narrative summary of producing the structured data. The data paper also indicates possible avenues of research which take the structured data as the point of departure. While the data were created with a specific question in mind for the purpose of producing an analytical research paper, the data paper ideally opens up the data for projects well beyond that scope.
The analytical research paper [12] sits at the top of the pyramid. It is the prized result of academic scholarship which all too often adopts a narrow view of research and dismisses the work that researchers are able to make public in the first three layers. While the trend is shifting, publishing a research paper is still a notoriously slow process, and in many cases produces a paper which is trapped behind a subscription paywall. Clearly, such delay and limited access creates friction with the previous three layers, where results are made available immediately to everyone. In order to avoid such friction, one could consider publishing in a gold open access format in an online journal where the review process is rapid, but not compromised. The example project has chosen this route by publishing a data paper in JOHD [11] and an MDPI journal for the corresponding research paper [12]. If the four layers of the pyramid are published in relatively quick succession, and if they adhere to similar open research principles, researchers give their work the best chance of making an impact.

1.1.2. Humanities and Social Sciences Data Journals

The first data journal, the Journal of Chemical and Engineering Data, was launched in 1956 [13], but the number of data journals has grown only in recent times. Schöpfel et al. [4], who updated the study performed by Candela et al. [14] on the number of data journals and the areas of interest covered by them, show that the number of data journals did not increase dramatically during those five years (from 20 data journals in 2015 to 28 in 2019, some of them no longer active), while the number of data papers published rose sharply from 846 in 2013 to 11,500 in 2019. Likewise, Walters [15], found that of the 169 journals that reported to publish research relating to data, only 19 journals (11.2%) were classified as “pure” data journals, such that at least half the journals’ publications were data reports, 109 (64.5%) devoted some publications to data reports (about 1.6%) but prioritised other types of publications, 21 (12.4%) journals failed to publish any data reports, and 20 (11.8%) of these journals are no longer publishing data reports or research of any kind. Garcia-Garcia et al. [13] note how the publication of data papers for the humanities started much later compared to the scientific disciplines. The first data journal dedicated to a humanistic discipline is the Journal of Open Archaeology Data, launched in 2012. The results on the situation of data papers and data journals in the humanities given by Walters [15], show that the field of humanities is still far behind that of the sciences for what concerns the number of data journals and data papers published. This study reveals that, in 2020, only four data journals were dedicated to HSS disciplines. These include the Journal of Open Archaeology Data (2012), the Journal of Open Psychology Data (2013), the Journal of Open Humanities Data (JOHD, 2015) 8, and Research Data Journal for the Humanities and Social Sciences (RDJ, 2016) 9.
The reason for this later impact of data papers in the humanities can be explained by a number of factors. Compared to the so-called Science, Technology, Engineering, and Mathematics (STEM), and Health disciplines, the humanities field is very heterogeneous. Linguistics, social sciences, film studies, philology, history, game studies, philosophy are just a few of the areas covered by the term “Humanities”. This means that not only are the disciplines concerned with completely different objects of study, which can also be said for the Sciences, but the objects that they study and the data that they produce are extremely different. One of the main problems for the humanities is the definition of the “data” themselves. These could be represented by collections of texts (corpora), recordings of spoken dialogues, videos, collections of tablets, geographic coordinates, statistics, digital editions, library and archive collections, and many more. These types of data are very different from one another, because they are often not comparable and are not measurable in the same way, with the same metrics or systems. For example, analysing a recorded dialogue in order to detect different phonetic variations is very different, in terms of reasoning, analysis and approach, from publishing a digital edition of an unpublished manuscript. However, both types of work lead to the creation of data. This has an impact on the way in which most researchers in the humanities conceive their work. Alongside these definitional issues, different humanities disciplines have different sets of criteria for determining whether a dataset can be openly published. Those disciplines working with closed sets (i.e., objects of study that can no longer be expanded, such as historical records, as opposed to, for example, born-digital data) often do not see their data as ready to be formally described until they successfully capture properties of the whole object of study (i.e., until it has led to some research results). For instance, a researcher working with sources spanning the whole period of the industrial revolution may think that a dataset produced from a small sample of those sources (e.g., spanning only a few years of the period of interest) is of no real value to other researchers. Data papers, however, shift the focus from the objectives of a particular research project or question to how the data are collected and presented, and to whether the same method can be replicated with similar data sources. The historian working with sources from the industrial revolution may therefore decide to describe that small sample of data in a data paper if the same process will be applied to the rest of the sources, especially if the process itself required careful planning, regardless of whether the dataset they describe is already representative of some aspect of the industrial revolution. Under this light, humanities scholars working with open datasets, such as born-digital objects (e.g., Twitter data or news media), are not so different from historians of the industrial revolution: collecting, organising and describing data is a process that deserves credit in its own right, provided that the researcher can provide insights into how this process may benefit others.
For an overview of the data journals whose scope includes HSS disciplines, see Table 1. In the rest of this paper, we will focus on the two multidisciplinary journals specifically dedicated to HSS research, JOHD and RDJ because they offer us an opportunity to describe the landscape of data journals in HSS beyond the scope of individual disciplines.
JOHD was launched in 2015 as one of the ‘metajournals’ published by Ubiquity Press with the aim of promoting values of data sharing and reuse in the humanities. JOHD publishes data-focussed articles and aims to play a key role in growing a community of humanities researchers sharing data. A fundamental requirement for publication in JOHD is having deposited a dataset in an open access repository. JOHD publishes both short data papers (1000 words) and research papers (3000–5000 words).
Over the past three years, JOHD has significantly expanded. The reasons for this have several sources. The editor-in-chief has devoted a lot of attention to promoting the journal and increasing its profile among both the academic and library communities, expanding the disciplinary and geographical reach of the journal by growing the editorial board and engaging in numerous activities across various countries. The team has also grown considerably, with a number of different roles filled by students and early stage career researchers. This has meant that editorial tasks are shared among editorial members. At the same time, the social media management benefits from a consistent and regular contribution by the journal’s social media editor. Moreover, the editorial team have led a number of thought-leadership activities, including organising events, giving interviews, talks, and poster presentations at a number of international venues, taking part in panels and publishing blog posts and academic publications [16]. Finally, a targeted editorial strategy has led to the launch of special collections which has allowed JOHD to reach communities in specialised sectors and research areas.
The social media strategy of the journal has aimed to increase the size of its audience, mainly by growing JOHDs follower base. In order to do this, the team has compiled a set of hashtags that orient its audience to specific types of information shared. By using the hashtags #johdagenda and #johdsuggestions, the journal engages in the conversation about open data and DH on social media, retweeting news and events advertised by associations and projects active in these fields; the hashtags #johdguides and #johdpapers describe the journal’s policies and editorial process and give updates on its publications; finally, the hashtags #johdnews and #johdCfP keep the journal’s audience up-to-date about the activities of the team and calls for papers, respectively. All these efforts have helped position JOHD at the forefront of data publishing in the humanities and have led to a growing number of publications, which itself has contributed to raising the profile of the journal and the community’s awareness of it. It has published an increasing number of articles and launched new themed special collections of articles.
RDJ is an international peer-reviewed digital-only open access journal founded by DANS in 2016 and published by Brill. RDJ publishes data papers of medium length (with a maximum of 2500 words) containing a description of a dataset and the research context. It requires that the dataset being described is deposited in a trusted digital archive or repository, and contains a persistent identifier. One of its strengths is its interdisciplinary scope. According to the RDJ webpage, the main topics and domains discussed in their scholarly publications are archaeology and geo-archaeological research, social and economic history, oral history, language and literature audio-visual media.

1.2. Previous Work

There is little dispute that research practices are dynamic and accordingly adapt in response to the demands of best practice and the ever-increasing open research agenda [17]. An area of considerable attention within open research has led to a strong focus on data dissemination and sharing, and the ensuing impacts observed as an offshoot of such practices. Data sharing not only facilitates research transparency in line with the Royal Society’s motto “nullius in verba” (“take nobody’s word for it”), but also promotes a culture of openness and adds repositories of data to the cumulative labour of researchers’ contributions. Academic journals increasingly encourage and, in some cases, require researchers to accompany their manuscripts with access to datasets [18,19], while in principle, such data sharing initiatives are beneficial to the open data agenda, such commitment to data sharing is not always adhered to and can be seen as laborious, non-incentivised, and in conflict with researchers’ future applications of the data [20,21]. Data journals have been a direct response to these concerns, and are dedicated to the promotion of data dissemination, while simultaneously providing academic credit to authors who may otherwise not be sufficiently recognised in traditional research papers. An important question to address is whether data papers are impactful and worthwhile to authors, but also to the broader academic community as well as non-academic stakeholders. A means to answer this question is to evaluate the utility of open data. Tracking the metrics of data journals allows for the quantification of its impact. These can and have most commonly included citation and Altmetric information [22].
Data citation count is the most popular and traditional metric of data sharing impact evaluation and literature about its influence and impact is steadily growing. Citation information provides a quantitative referent for an article’s long-standing impact within the academic realm of evaluation. That is, the more academic citations an article accumulates, the greater its overall impact is assumed to be. Altmetrics, on the other hand, are more immediate snapshots of usage impact (e.g., article views, downloads) that are not only confined to academic circles, since they are also visible across non-academic media and community settings, and generate attention and interest via news coverage, blog posts, and tweets. Particular attention has been paid to the impact of different data sharing practices on article citation counts [23,24,25], but also to the predictive value of Altmetrics on citation counts [26,27,28]. For instance, while data citation counts have been found to increase in association with high Altmetrics counts in clinical and translational research [29], as well as physics, mathematics, astrophysics, and condensed matter research [30], the majority of studies within Health and Science disciplines have failed to report any strong associations between Altmetrics and citation counts [31,32,33,34,35] leading to uncertainty about the true impact of Altmetric ‘splashes’ as forecasts of academic success.
Importantly, though, corroborative literature across an array of disciplines mainly within the sciences, has shown a positive association between data sharing and citation counts (e.g., [25,36,37,38,39,40]). Indeed, similar advantages have been observed between data sharing practices and an associated greater citation count in the analysis of specific journals (e.g., [23,41]). Furthermore, in a study investigating the influence of journal policy change (specifically, data publication requirements prior to and post data sharing policies in conjunction with the publication of a research paper) on citation count, it was found that authors who shared their data ended up with more citations over time, but the effect of these policies on the impact of the articles and journals themselves was not increased unless data sharing was enforced [24]. Positive citation impacts have also been observed as an outcome of code sharing [42]. In terms of the impact of data papers specifically, positive correlations have been found between overall engagement with a data paper (indirectly captured by the number of views and Twitter mentions) and data reuse (using dataset downloads as a proxy) [8]. Furthermore, in an analysis of the utility of a mega data paper journal, Data in Brief, it was found that while open data seldom led to data reuse in the short-term, the overall contributions of the data journal were positive and facilitated the sharing of diverse types of data, spanning various disciplines that ultimately resulted in Altmetric and citation increases [43].
Overall, there is a proven, albeit preliminary, link between data sharing practices and improved metrics of citations and impact. Of note, however, is that little descriptive and empirical work has investigated the scope and impact of data journals beyond investigations into citation trends, such as analyses relating to the time of publication of data papers/datasets/associated research papers and the relation between various impact metrics of such papers. Indeed, Stuart [44] cautions the reliance on citation and Altmetric quantifiers as complete evaluations of data paper utility given that the norms of data publishing and citation have yet to be fully established. Moreover, most of the existing research pursuits evaluating data sharing impact have not considered HSS disciplines but have rather prioritised STEM and Health disciplines as these fields have been at the forefront of data sharing efforts.

1.3. Research Questions and Contributions of This Study

Although this is changing and there is increased attention from research funders, institutions, libraries and archives, and publishers, the idea of sharing datasets as outputs of HSS research is still not as widespread as it might be for disciplines in the Sciences. This can be explained by a number of factors. First, data are often undervalued as research outputs. For example, data journals are often not included in the lists of journals recognised for academic credit in many countries. Furthermore, when it comes to evaluating research results, data papers are not valued to the same extent as traditional research articles. For example, in the REF (Research Excellence Framework) in England, which deals with evaluating the research results of English universities, the results submitted for evaluation are for the most part articles published in traditional journals. Consequently, the workflow of humanities researchers does not typically include the publication of the data, which leads to datasets that are often not well documented and obscure to an external audience, and therefore require additional work in order to be made publishable. Other aspects include the difficulty, for some researchers, to access the financial resources that would allow them to publish their data. This is often due to the lack of funds to support the costs of data storage or the article processing charge (APC) for the publication of data papers, and the scarce knowledge of the existing infrastructures that deal with data sustainability issues. Many infrastructures dedicated to data storage have not been designed and are therefore often not suitable for the storage of data produced by human disciplines. To deal with these types of problems, for example, the SSHOC project and its partners aim to set up integrated networks of interconnected data infrastructures for HSS research.
Despite these generalisations, it is important to take a positive view of the encouraging trend in recent years concerning data sharing in the HSS. Many factors have contributed to these results. We have already mentioned the important contribution of ongoing projects, conferences and funding institutions to the strengthening of the principles of open research. Another important trigger for the creation and sharing of HSS data is the increasing number of projects that aim at the digitalisation of physical collections (books, cuneiform tablets, works of art among others). In general, with respect to the past, the different disciplines in the humanities can rely on a greater number of digital resources such as high-performing programming languages, programmes for building, reading or analysing different types of datasets. Finally, the recent emergence of data science as a discipline has given a major input to the acknowledgment of the existence of data in the humanities: it has given new perspectives of analysis on them, but has also highlighted the necessity to make them openly accessible and provide them a long-term storage.
In this study, we analyse the current state of the art in the landscape of data journals in HSS, with a particular focus on JOHD and RDJ, the two interdisciplinary data journals dedicated to the broad spectrum of humanities research. Following a surge in studies dedicated to the impact of data sharing on the success of the associated research papers reviewed in Section 1.2, our focus is on exploring the added value of data papers for research impact and data reuse in the humanities. Our broad research questions are the following:
(1)
Do data papers have a positive impact on the metrics of associated research papers?
(2)
Do data papers effectively encourage data reuse?
(3)
Can social media have a positive impact on the metrics of data papers?
Corresponding to the pyramid structure of the research and dissemination ecosystem in data-driven projects presented in Section 1.1.1, for the purpose of measuring performance and impact of data-driven projects in HSS, we propose to move away from a single metric, namely the number of citations of research papers. Instead, we propose to look at the “deep impact” of the three DOI-stamped elements of the diagram presented in Figure 1, where the performance of each element affects the others. While we have established metrics to measure the performance of research papers with citations and that of datasets with downloads, there is no obvious metric for measuring the performance of data papers which usually act as catalysts, to boost the performance of the other two. It should also be noted that there is no standard practice to link the three elements of the triangle. This means that measuring deep impact by looking at all three DOI-stamped elements of the open research triangle relies on linking the pieces manually or semi-automatically. Moreover, it should be noted that citation metrics are not an optimal measure of data reuse, as a paper may cite a dataset or its corresponding data paper simply as background information or because the authors actually used that dataset in their research. Therefore, we have operationalised our broad research questions as the following specific questions:
A.
Are higher-impact data papers associated with higher-impact datasets and research papers?
B.
Do research papers with associated data papers have higher metrics (i.e., citations, Altmetric scores) than the average research paper in the HSS?
C.
Do deposited datasets with associated data papers have higher citation and altmetrics scores than the average deposited dataset in HSS?
D.
Does tweeting about a paper on JOHD’s Twitter account have a positive impact on its visibility?
E.
What is the best strategy to draw the attention of the users towards the contents of the paper mentioned in a tweet?
Our findings indicate that data papers in the HSS have a positive impact on both the metrics of the associated research papers and on the reuse of the associated datasets.

2. Materials and Methods

This study focuses on the two major multidisciplinary data journals specifically dedicated to HSS: JOHD and RDJ. The data for this study consist of six main sets for the period between 29 September 2015 and 4 June 2022, that is, between the publication of the first article in JOHD 10 and the selected end date of our study. These include:
(1)
A dataset of all articles published in JOHD and RDJ and their respective research fields (Section 2.1);
(2)
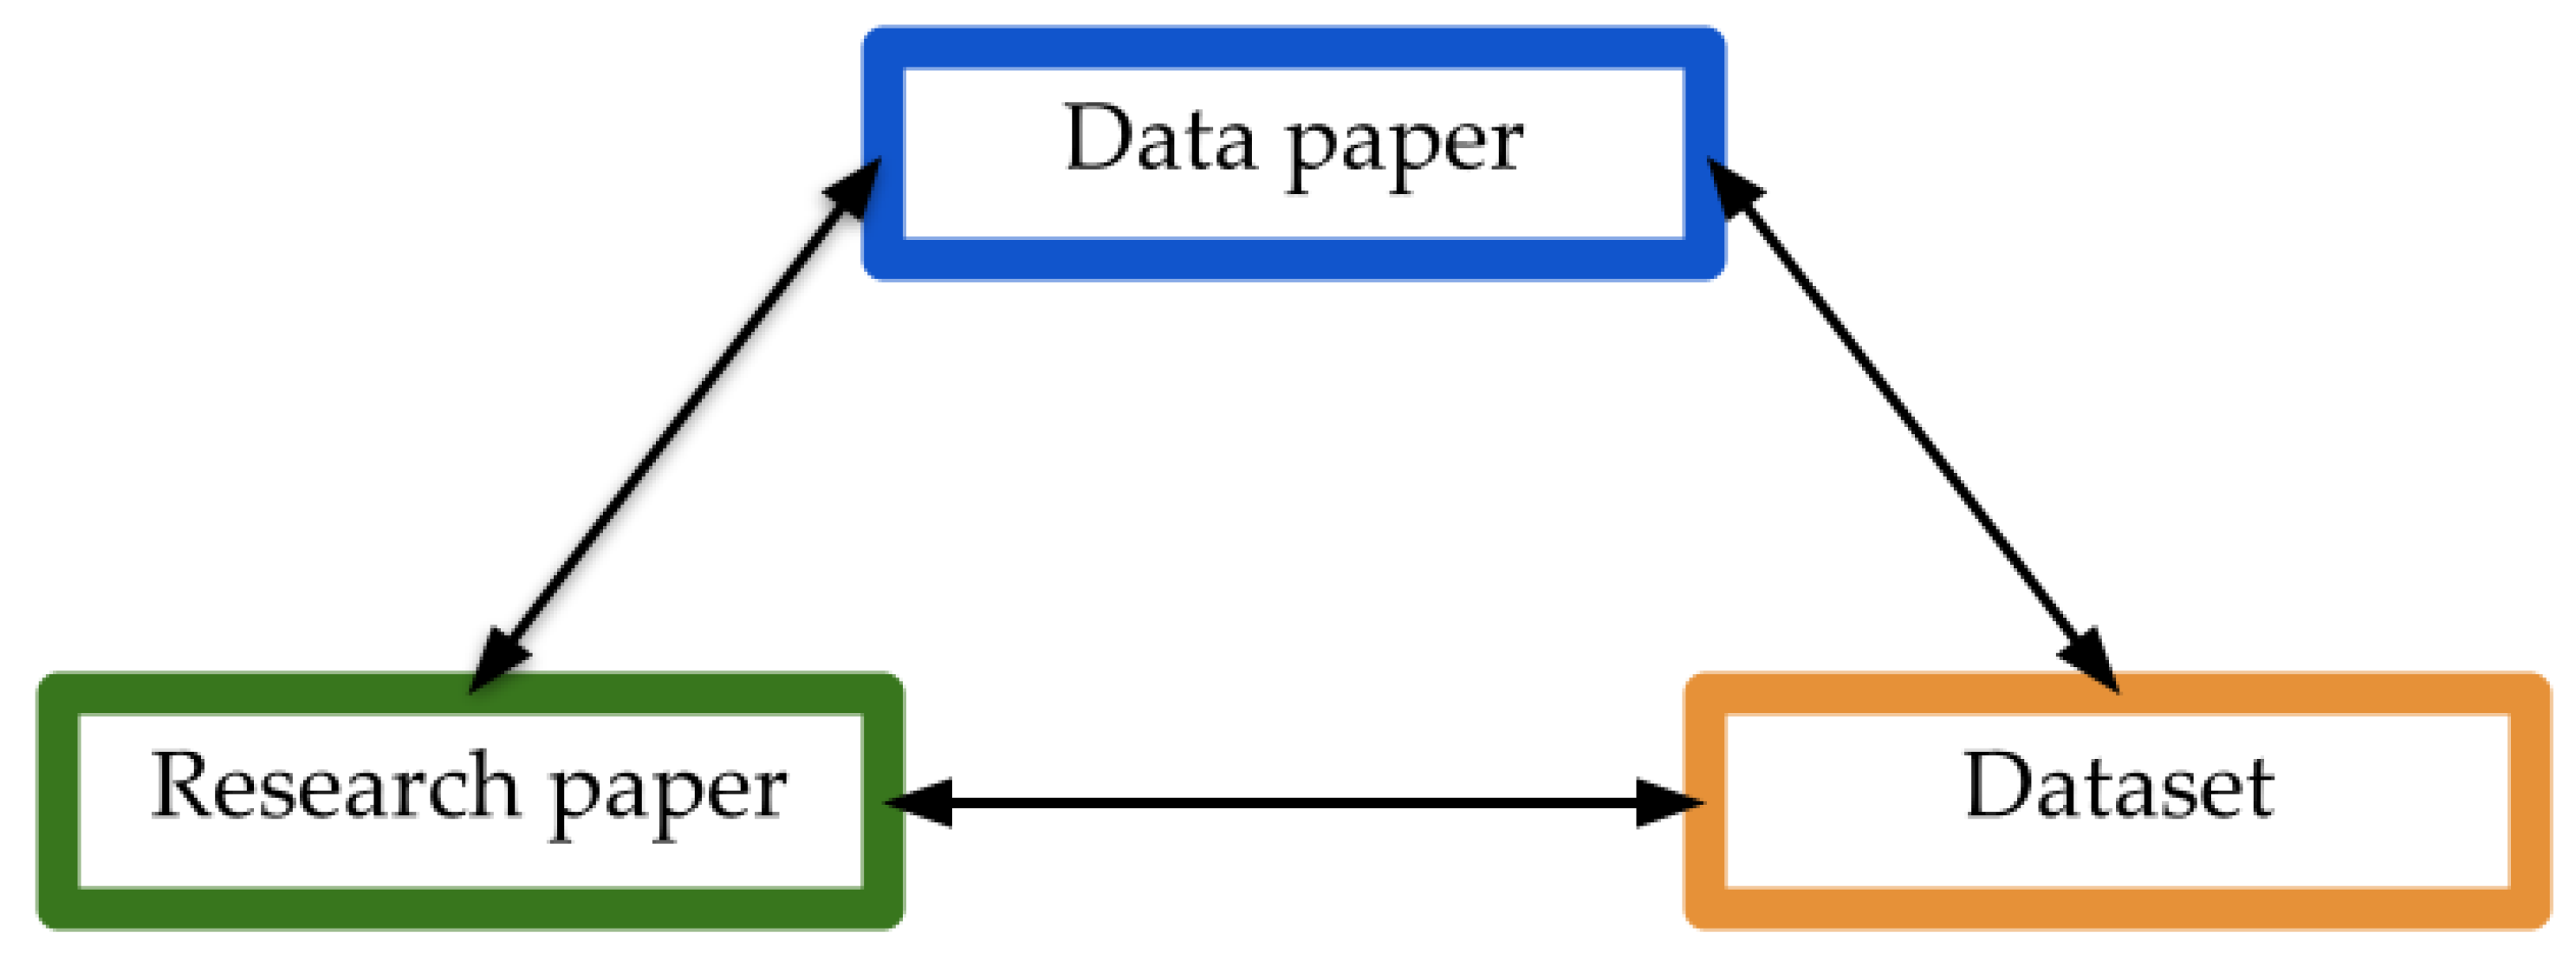
A dataset linking the three elements of the “deep-impact” triangle in Figure 2: datasets, data papers and research papers provided that all three were produced and published (Section 2.2.1);
(3)
The citation and Altmetric counts of articles listed in (2) and those of their corresponding datasets (Section 2.2.2);
(4)
A large dataset about the performance of research articles in HSS exported from Dimensions.ai and structured for the purpose of the current study (Section 2.2.3);
(5)
A large dataset about the performance of datasets in HSS harvested from the Zenodo REST API and structured for the purpose of the current study (Section 2.2.4);
(6)
JOHD’s Twitter activity on newly published articles, updates on the activities of the journal, events related to the journal’s scope and campaigns aimed at encouraging the community to engage in the conversation about Open Humanities data (Section 2.3).

2.1. Publication Data

We manually collected the data regarding articles published in JOHD and RDJ from the journal’s websites. For each article, we collected the following characteristics: DOI, paper type (data paper or research paper according to the categorization of JOHD’s articles), publication year, and keywords.
During the submission process of a data or research paper to JOHD, authors are required to provide a list of keywords. They can enter up to five keywords that are meant to indicate the fields, topics or techniques discussed in their paper. The journal does not provide a list of keywords, so authors are free to choose the words that they feel are most relevant to their article. In the case of RDJ, authors must supply two to eight keywords. We manually retrieved all the keywords that have been used to describe the papers published by JOHD and RDJ, and we organised them into different groups according to their main topic or subject area. In this way, we were able to outline the areas that are more productive with respect to this type of publication, and to identify the areas in which it still needs to grow. The subject classification was done with the Medical Subject Headings (MeSH) thesaurus 11. MeSH is a controlled and hierarchically organised vocabulary created by the National Library of Medicine, widely used in scientometrics research [45,46]. As MeSH is mainly used for indexing, cataloguing, and searching of biomedical and health-related information, its usage in the classification of the various and heterogeneous topics of the humanities might be challenging in some cases. For instance, there is no label in MeSH thesaurus for the field of DH. Another example is that, even though we established the third level of the hierarchy as the last one to use, we had to dig into the fourth level in the case of Archaeology [I01.076.201.208]. However, we selected MeSH as its indexing allowed us to search at different levels of granularity simultaneously, thanks to its hierarchy. More specific headings are found at lower (more granular) levels of the hierarchy, and a MeSH term can be part of one or more hierarchies. As JOHD and RDJ publications include both scientific and humanities subjects, and are thus interdisciplinary, MeSH vocabulary represented the best option in order to identify the proper hierarchy level and label for each article. It is considered a sophisticated keyword optimization service, and it is used in bibliometric analysis [47]. We only associated one MeSH term to each article, to make it easier to visualise the distribution of disciplines in the data. We identified 18 research fields represented in the articles published in the two journals: Archaeology [I01.076.201.208], Art [K01.093], Communications Media [L01.178], Computing Methodologies [L01.224], Data Science [L01.305], Environment Design [I01.283], History [K01.400], Information Management [L01.399], Information Science [L01], Journalism [L01.737.498], Library Science [L01.583], Linguistics [L01.559.598], Literature [K01.517], Motion Pictures [K01.093.545], Music [K01.602], Publishing [L01.737], Religion [K01.844], and Social Sciences [I01]. We are aware that these labels are not necessarily comparable, as they cover disciplines and methods. The same paper often had keywords belonging to different labels, which highlights the interdisciplinarity of the articles published by JOHD and RDJ.
Data analysis and data visualisation have been performed on clean data using code written in Python 3. The results obtained from analysing the data will be discussed in Section 3.1.

2.2. Impact of Data Papers, Research Papers and Datasets

For the purpose of measuring the deep impact of the data-driven projects in HSS, it is crucial to identify the constituent elements of the triangle (Figure 3). In the present study, the point of departure is the data paper which, by definition, is linked to (usually) one dataset it describes. Our working hypothesis is that datasets in HSS are created for the purpose of answering a research question. The answer is usually worked out as an interpretation of the deposited data in an analytical research paper which is the third element of the triangle. Measuring deep impact means that we do not simply look at performance metrics of research papers, datasets and data papers in isolation, but we look at them as part of a network.

2.2.1. Linking Datasets, Data Papers and Research Papers

Data papers published in JOHD and RDJ describe publicly deposited datasets with a permanent DOI. JOHD recommends public repositories such as Zenodo, Figshare or Dataverse which guarantee that the deposited datasets will stay accessible in perpetuity. Any given dataset’s DOI is included in the corresponding JOHD and RDJ data papers. We manually checked these DOIs to create a curated spreadsheet linking datasets and data papers.
Linking potential research papers to datasets and data papers is less straightforward. Analytical research papers offering an interpretation of the published data may not be directly and explicitly linked to the datasets themselves. Linking was carried out manually by directly inspecting data papers, datasets and their citation information on Dimensions.ai. For the purpose of this exercise, we linked a research paper and a data paper if:
(1)
at least one of the following three conditions was satisfied:
(a)
the research paper appeared in the reference list of the data paper;
(b)
the research paper was cited in the dataset repository;
(c)
the research paper was listed as one citing the data paper on Dimensions [48];
(2)
and the following two conditions were also satisfied:
(a)
at least one person was an author of both the data and the research paper;
(b)
the research paper was a substantial, analytical interpretation of the dataset associated with the data paper.
The number of associated datasets per data paper is usually one for each data paper; only one data paper has two associated datasets and another one has three. The number of associated research papers is usually one for each data paper, and 10 have two associated research papers. For the purpose of this study, we kept only one dataset and one research paper per data paper. In total, the dataset contains 107 data papers with 107 associated datasets and 35 research papers.

2.2.2. Impact Metrics of Data Papers and Associated Datasets and Research Papers

After linking data papers with the associated datasets and research papers, as described in Section 2.2.1, we assessed the availability and reliability of different metrics on each of these publication types.
For data papers, the availability and reliability of citation counts are virtually identical to those of any research paper. We exported the total citation counts from Dimensions, which at the same time allowed us to obtain the Altmetric score of each data paper. Dimensions is a database of scientific publications developed by the technology company Digital Science: it provides citation and usage statistics (alongside other information) of over 106 million publications. We then gathered usage statistics (i.e., total views and total downloads) for each publication by scraping the journal’s website. Usage statistics and Altmetric are a valuable complementary tool to assess impact across the board, especially when data reuse is a variable one is interested in. Previous studies already showed positive correlations between Altmetric scores and citations counts of research papers (see Section 1.2) and can be considered to provide a broader, more complex picture of research impact [49,50]. Turning to metrics beyond citations is especially crucial for data papers, since they are generally not treated as traditional research papers. Studies have shown clear difficulties in mapping the publication of a data paper to a clear citation advantage (of the data paper itself or of linked research papers) and to the reuse of the associated datasets [43], so that usage statistics, Altmetric and citation counts should all play a role in evaluating their impact.
For the datasets associated with each data paper, we obtained usage statistics from the respective data repositories via Python scripts. However, since not all repositories readily provide total view and download counts, we had to exclude a number of datasets from the analysis presented in Section 3. Table 2 shows the total number of data papers by JOHD and RDJ with a breakdown of the usage statistics we were able to gather on the associated datasets. Table 3 provides an overview of the type of usage statistics available from each data repository used by JOHD and RDJ data papers.
Besides the repositories included in Table 3, there are a number of data papers referring to research repositories under the domain of an academic institution (e.g., https://repository.upenn.edu/ (accessed on 15 July 2022) or research library (e.g., https://bl.iro.bl.uk/ (accessed on 15 July 2022) and https://www.loc.gov/ (accessed on 15 July 2022), which do not always provide total usage statistics systematically. As can be inferred from Table 2, we managed to gather at least some usage statistics for 58 datasets associated with JOHD or RDJ data papers.
Gathering citation counts for the datasets associated with the data papers was instead altogether unfeasible. The only repository that provides information on citations (Figshare) reportedly indexes the citation count from Dimensions 12, which, however, does not provide citation counts for datasets (as of the time of this study). We found that, in fact, the count provided by Figshare corresponded to the citation count of the associated data paper by the same title 13, so that even the few data citations we could gather turned out to be unusable. This was not surprising, considering how several studies on dataset and software citation have pointed out the lack of common citation standards for data compared to standard peer-reviewed papers and that informal mentions (i.e., mainly in the form of URL to the data in the text or in footnotes) are instead much more widespread [51,52,53,54]. Although there has been great progress in this direction, as evidenced, for instance, by the Joint Declaration of Data Citation Principles (JDDCP) [55], the Scholix initiative [56] and the Make Data Count project [57], current methods for tracking data reuse via citations still remain unreliable and they would be likely to underestimate actual reuse counts [58].

2.2.3. Impact Metrics of HSS Research Papers

In order to assess the relative impact of data papers on the associated research papers, we collected metrics on all HSS research papers published in the UK and the US between 2015 and 2022 (corresponding to the whole period of activity of JOHD and RDJ). The goal was to gather as wide a ground for comparison as possible with the general performance of research papers regardless of whether these have an associated data paper. We used the Dimensions webpage to filter out papers by year of publication and we limited the search to the fields within the scope of JOHD and RDJ. The fields available for filtering are those of the Australian and New Zealand Standard Research Classification (ANZSRC), which Dimensions has implemented in their Fields of Research (FOR) system.14 We agreed upon the following as loosely defining the bulk of HSS publications currently in JOHD and RDJ:
  • 18 Law and Legal Studies
  • 20 Language, Communication and Culture
  • 21 History and Archaeology
  • 22 Philosophy and Religious Studies
Since several publications span different fields, we filtered out duplicate entries, which resulted in a final dataset containing 358,770 titles, each with information on publication date, total citations, and Altmetric score.

2.2.4. Impact Metrics of HSS Datasets

In order to have a representative baseline for the datasets, we harvested information about the performance of datasets deposited on the public repository Zenodo which were published for HSS research during the period matching JOHD’s activity. As explained in the Jupyter notebook on the project’s GitHub repository (zenodo.ipynb) [59], we queried the Zenodo REST API with a free individual access token. The Zenodo REST API service enables programmatic upload and publication of data to the Zenodo repository, but the service’s ‘records’ endpoint can be also used to access information about the deposited datasets and their performance statistics 15. We created a list of stemmed expressions corresponding with the Units of Assessment in Panels C (Social Sciences) and D (Humanities) of the UK’s Research Excellence Framework 2021 16, and fed this list to a Zenodo query in parameter ‘q’ to restrict the disciplinary focus of the search to HSS projects. Please note that we added the ‘humanit’ expressions for ‘humanities’ and removed the expression ‘international’ (corresponding with UoA 19 ‘Politics and International Studies’). The latter understandably resulted in many hits which fell outside the HSS domain. The Zenodo search was limited to datasets that were made publicly accessible (‘open’) during the period between 29 September 2015 and 4 June 2022. Our programmatic query looped through the dates in the period to extract identifier, publication date, downloads and views (as of 4 June 2022) from the individual .json hits. We then built a dataset saved in .csv format and deposited it on our project’s Figshare repository (zenodo_humss_datasets.csv) [60]. The dataset includes information on 39,290 HSS datasets arranged in chronological order.
Table 4 summarises the content of the data we gathered. Note that the number of datasets associated with a data paper corresponds to the number of datasets for which either downloads, view counts or both were available. For a detailed breakdown, see Table 2.
On the basis of these data, we were interested in exploring whether data papers in HSS have a positive effect on the metrics of associated research papers and whether they effectively encourage data reuse. In particular, we aimed to answer questions A–C outlined in Section 1.3:
Question A was investigated by carrying out correlation analyses between the metrics on data papers (Type of publication a. in Table 4) and those on research papers and datasets with an associated data paper (Type of publication b. and c. in Table 4). If the publication of data papers has a positive effect on the metrics of associated research papers and on dataset reuse, we should be able to observe at least some positive correlations between metrics on the former and metrics on the latter. In terms of statistical measures, we used Spearman’s rank correlation coefficient (ρ or rho), following [61] for interpreting the strength in correlation and setting the significance level (α) to 0.05.
For questions B and C, we compared the metrics on the research papers and the datasets collected from Dimensions and Zenodo, as described above (Type of publication d. and e. in Table 4), with the metrics on research papers and datasets with an associated data paper (Type of publication b. and c. in Table 4). This time, we wanted to test whether the average metrics on research papers and datasets known to have an associated data paper are statistically different from the average metrics on the wider population of research papers and datasets to which they belong by discipline. For this task, we ran both a one-tailed Mann–Whitney U-test and a Welch’s t-test to test the hypothesis that the means of the two populations (i.e., the metrics on research papers and datasets with and without associated data papers) are equal. If the publication of a data paper has a positive effect on the metrics of associated research papers and on the reuse of associated datasets, then research papers and datasets with a data paper should score significantly better than the average research paper and dataset in the same discipline.
For questions A through C, before running the tests, we normalised the metrics by paper/dataset age, i.e., we divided each metric by the number of days since publication. Age-normalisation is naturally an approximation, since the rate with which metrics increase with time is generally expected to slow down with age, until it reaches a plateau. However, this is arguably a necessary minimum step to allow for quantitative comparison between older papers and datasets, which have had more time to gain impact, and newer ones, since there is not enough data to only consider recent articles nor does every data repository provide recent usage statistics, which would at least allow us to consider recent metrics only (recent citations, downloads and views).
Given the large number of research papers and datasets collected from Dimensions and Zenodo (Type of publication d. and e. in Table 4), the analyses for questions B and C were run 10 times with different random samples consisting of 5000 observations each time. We considered the results reliable if they were consistent throughout this 10-fold process.
Finally, for the analyses related to questions B and C, we also removed outliers from all Types of publications b. through e. in Table 4, considering as outliers any data point more than 1.5 interquartile ranges below the first quartile or above the third quartile.

2.3. Twitter Data

Since 2021, JOHD has invested significant efforts in its social media presence, with a specific focus on Twitter. The journal’s social media strategy aims to reach a larger audience and participate in the conversation around open research and specifically around Open Humanities data. The other main data journal for the humanities, RDJ, is not active on Twitter. As we could not perform a comparative analysis of the social media activity of the two journals, we focused our analysis on JOHD’s social media presence only.
JOHD’s Twitter account has two main goals: to provide updates on the journal’s publications and activities, and more generally, to engage with those members of the Twitter community who are interested in open research, open data and DH. In order to support these goals, starting from January 2021 the journal’s social media editor developed the set of hashtags described in Section 1.1.2, which were designed to draw the attention of the audience to the specific content of each tweet. JOHD’s activity on Twitter also aims at raising awareness around open research and data sharing values. To support this aim, the journal’s Twitter account launched the campaign #showmeyourdata in June 2021. In the framework of this initiative, authors who published an article with JOHD were invited to post a tweet showcasing an image of the dataset that they described in their article. Most authors published a screenshot of their dataset, illustrating just how varied the definition of “data” can be within the humanities. This initiative led to the posting of images of repositories, networks, code, maps and spreadsheets.
As the hashtag system and the #showmeyourdata campaign were both launched in 2021, we do not yet have enough data to evaluate how successful the different types of hashtags are in terms of engagement rate. Therefore, we tried to relate our Twitter activity with the metrics of visibility and reuse that could be found on JOHD’s website (see Section 2.2), by addressing questions D-E outlined in Section 1.3.
In order to provide answers to these questions, we analysed the impact of the #showmeyourdata campaign and of the hashtag #johdpapers on the number of downloads, views and citations of the papers mentioned in conjunction with the two hashtags. The hashtags #showmeyourdata and #johdpapers both aim at giving visibility to the journal’s publications, but they address two different types of content. The hashtag #johdpapers is used for announcing new publications, and in this sense, it belongs to the group of hashtags designed to update the community on the journal’s activities. Tweets featuring this hashtag contain simple information, consisting of the title of the paper, the name of the authors (or their Twitter handle if they have an account on the platform) and the DOI of the paper. The #showmeyourdata hashtag was instead designed with the aim of engaging with users, and especially authors. The format of the campaign requires that the authors retweet the journal’s #showmeyourdata tweet that mentions them and their paper, and that by doing so, they also share an image of the data described in their paper.
As the social media strategy was adopted in 2021, not all papers published by the journal thus far have appeared as tweets along with the hashtags #johdpapers or #showmeyourdata (most of the oldest papers were not announced on the Twitter account). Out of a total of 66 papers published (until data collection), 42 were tweeted about on the journal’s Twitter account (#johdpapers) 17 and 24 papers were not announced at all. The #showmeyourdata campaign featured 38 papers (at the time of the data collection), with 28 papers that have not yet been mentioned in the campaign. This allowed us to verify the impact of two different types of communication about publications on social media. We tried to determine the impact of the #shomeyourdata campaign by comparing the metrics associated with the papers that participated in the #showmeyourdata campaign to the ones associated with papers that have not yet participated. We performed the same type of analysis for papers that were tweeted about on the journal’s account with the #johdpapers hashtag.
The timespan chosen to perform the analysis was from January 2015, when the journal joined Twitter, to June 2022, the date of data collection. Twitter data were manually collected from Twitter analytics. This tool allows for the download of a dataset covering the timespan of up to one month. Therefore, we merged the files and extracted the tweets by hashtag, in order to obtain the tweets presenting the hashtags #showmeyourdata and #johdpapers in two separate files. Building on this, we manually collected separate lists for the following:
  • papers tweeted with the hashtag #showmeyourdata and papers that were not;
  • papers tweeted with the hashtag #johdpapers and papers that were not. For these, we manually retrieved and added eight papers that were tweeted about without the hashtag.
The number of views, downloads and total citations for each paper were scraped from the journal’s website (see Section 2.2). Each value was normalised by the number of days between the publication of the article and the date of data collection. We used a Welch’s test to determine if there was a difference in terms of citations, downloads and views between papers that appeared in the #showmeyourdata campaign and papers that did not. A Welch’s test was also applied to the papers tweeted as #johdpapers and the papers that had not been announced on the journal’s account.

3. Results

3.1. Publication Data

In the case of JOHD, the number of papers published between 2015 and 2019 ranges from two or three in a year to only one in 2019. RDJ shows a similar pattern, with slightly higher numbers of publications in its first two years. Between 2017 and 2020, RDJ publications were higher in number compared to JOHD. However, since 2020 JOHD has rapidly grown. In 2020, JOHD published nine articles, while RDJ published 14 articles. However, JOHD has now published 67 papers in total, while RDJ has published 46 data papers (see Table 1). The number of publications over the years for both JOHD and RDJ is displayed in Figure 3.
Looking at the disciplines covered (Figure 4), the most productive area for both data papers and research papers in JOHD is undoubtedly Linguistics [L01.559.598]. The category Social Sciences [I01] covers some of the papers that deal with COVID-19 datasets, in terms of social and cultural effects on specific communities [62], the impact on social media [63], and the spread of fake news and their detection [64]. These papers were published in JOHD’s special collection ‘Humanities Data in the time of COVID-19’ 18 which hosts studies on the mechanisms and consequences of the COVID-19 pandemic from the point of view of the humanities disciplines. The least represented areas are Motion Pictures [K01.093.545], Music [K01.602], and Journalism [L01.737.498]. See Appendix A for an analysis of the distribution of research fields according to paper type.
In the case of RDJ, the classification through MeSH revealed a different pattern. Among the most published fields of research are History [K01] and Social Sciences [I01]. In RDJ, Linguistics [L01.559.598] is one of the least popular fields in data papers. These results can be seen in Appendix A (Figure A3).
The distribution of research fields in both JOHD and RDJ regarding the most present research fields differs between the journals (Figure 4). In JOHD, papers are especially focused on humanities subjects, whereas social sciences and history (which is often considered a Social Science) are the main research fields in RDJ.

3.2. Impact of Data Papers and Datasets

3.2.1. Publication Times of Data Papers, Datasets and Research Articles

Figure 5 and Figure 6 give an overview of the time elapsing between the publication of a data paper in JOHD and RDJ and the publication of its associated research paper and dataset. We have calculated the average time distance using the median (M), rather than the mean, since there are clear outliers in the data (e.g., anything above 2000 in the x-axis). For the same reason, in the histogram we indicated the median absolute deviation (MAD), instead of the standard deviation. As Figure 5 shows, virtually all data papers in JOHD and RDJ were published after the associated datasets had been deposited in a repository. The only apparent exception is due to a new version of the same dataset being published after the data paper had been published, without, however, retaining the original dataset, which made it impossible for us to retrieve the data of the latter. This reflects the intuition that all data papers are based on a published dataset, and they are thus expected to all be published after the associated dataset. We can see that the average data paper in JOHD and RDJ was published 170 days (circa five and a half months) after the associated dataset had been deposited in a public repository, with the majority of them being published within three years of the dataset being deposited.
Similarly, the histogram in Figure 6 gives an overview of the time elapsing between the publication of a research paper and the publication of the associated data paper in JOHD and RDJ. Although, once again, the average data paper is published after the associated research paper (with a median of 136 days, i.e., circa four and a half months afterwards), this time we can see a more balanced split between data papers published before and after their associated research paper. This also reflects the intuition that a data paper can complement a research paper in different ways, either by providing a peer-reviewed (thus citable following standard citation practice) title to an upcoming research paper, or by retrospectively giving visibility to the data used in a research paper, thus making it open and reusable.

3.2.2. Impact Metrics

Before proceeding to the correlation analysis, it is useful to provide a brief overview of the counts for the metrics collected on data papers, since they will be the figures against which impact will be assessed in the next section. In Figure 7 we present the overall raw counts for total citations and Altmetric score by means of box plots, whereas Figure 8 shows the difference in (age-normalised) counts for the same metrics depending on the age of publication by means of scatter plots.
Figure 7 shows that citation counts among JOHD and RDJ data papers range between 0 and 20. The average citation count according to the median, however, is 0, with the mean lying just above that, at 1 citation. Moreover, citation counts above 2 are marked as outliers, as we can see from the seven data points beyond the upper whisker. The upper interquartile range (IQR) at 1 also indicates that most data papers received either 1 or no citations at all.
Because most data papers receive one or no citations, together with the overall scarcity of data, it is extremely hard to assess the development of citation counts over time. Each dot in the scatter plot in Figure 8 corresponds to a 3-month average citation count for data papers published within that timespan. The number of years on the x-axis corresponds to the number of years elapsed between 2022 and 2015, so that the further away from the y-axis a dot is, the older the data papers represented by that dot in the plot. Overall, it appears that more recent articles have received on average more citations than older ones. However, we cannot interpret this as a trend until more data are gathered.
The Altmetric scores of JOHD and RDJ data papers (Figure 9) range between 1 and 62, with most papers receiving a score between 3 and 14.8 (with a median of 4.5 and a mean of 11.2) and anything above 31 being classified as an outlier. In other words, all data papers in our datasets received at least some attention, although in order to assess how they fared compared to other papers, the scores would have to be categorised into finer-grained subjects. Our dataset includes papers across different disciplines, albeit all within HSS, and each of them should be considered separately when evaluating Altmetric scores on their own, as reflected by the current criteria with which the highest-scoring papers are announced each year by Altmetric (i.e., following the division into subfields provided by Dimensions)19. Since we are interested in the relationship between different impact metrics, we leave this task for future research.
Figure 10 seems to indicate a slightly clearer upward trend from older to newer data papers when it comes to Altmetric scores, compared to the same figure on citations. While we should still be cautious given the scarcity of data, the scatter plot may reflect the intuition that the discourse on HSS research on social media has been steadily intensifying since 2015, particularly in correspondence to the COVID-19 pandemic. Another potential reason for the steady increase may be a restructuring of the editorial team within JOHD, which in the two years preceding this study (where the steepest increase can be observed) has also included in-house Social Media Editors for the first time, which has led to a significant increase in the level of activity of the journal on Twitter.
For a comparison with the counts of metrics on research papers and datasets, we have included the box plots and scatter plots for those metrics in the Appendix B.

3.2.3. Correlation between the Different Impact Metrics

Following the questions and methods laid out in Section 2.2, in this section we present the result of our analysis on the impact of data papers on the metrics of associated research papers and datasets.
The first question is whether higher-impact data papers are associated with higher-impact datasets and research papers. Table 5 shows the results of the correlation analysis which we carried out between pairs of metrics.
Table 6 shows the pairs of variables that were found to have some form of (positive or negative) correlation, with either a significant p-value, or a p-value very close to the alpha (i.e., 0.05). These borderline cases can be classified as trends, rather than statistically significant observations, and they may point to the fact that, should more data be gathered, stronger trends may be detected and the p-value, as a result, may drop, making the association significant. As the table shows, there is a moderate to strong significant correlation between the Altmetric score of research papers with an associated data paper and the total citations of data papers, as well as between the Altmetric score of those research papers and the total downloads of data papers. From the Open Humanities perspective, this is promising, and it could either indicate that a research paper draws more social media attention when the associated data paper is cited, or, conversely, that higher online attention to a piece of research also draws attention to the associated data paper, which, in turn, receives more downloads (thus, reads). Additionally, note that the opposite situation could be classified as a trend, since the total citations of research papers have a weak to moderate correlation with the Altmetric scores of the data papers.
The next two questions aimed to compare the research papers and datasets associated with a JOHD or RDJ data paper, with the information we gathered from Dimensions and Zenodo, respectively, on HSS research papers and datasets published between 2015 and 2022, regardless of whether they had an associated data paper. Starting with research papers, we wanted to test the hypothesis that research papers with an associated data paper perform highly, metrics-wise, within the publishing landscape of research papers in HSS as a whole. Figure 11 and Table 6 show the results of this comparison.
The mean citation count for research papers with an associated data paper is higher, and both the Mann–Whitney U-test and Welch’s t-test returned a highly significant p-value. Note that the box plots in Figure 11 above were produced after a random sampling of 5000 observations from the dataset with all HSS research papers. Repeating the random sampling will likely result in slightly different box plots, although all with the median of the box plot on the left lying above the upper quartile of the box plot on the right, as confirmed by Table 6, reporting consistent results for both tests for the entire 10-fold random sampling.
Both tests also agreed that the Altmetric scores of research papers with an associated data paper are statistically higher than those of research papers in the HSS as a whole (Figure 12 and Table 7). We can say that these results indicate that data papers boost both the citation counts of and the online attention to associated research papers, which is obviously encouraging for Open Humanities and, specifically, for Open Humanities data publishing.
Finally, we compared the metrics of the datasets with an associated data paper with those of all datasets in the Humanities deposited in Zenodo between 2015 and 2022 (Figure 13 and Figure 14; Table 8 and Table 9).
Table 8 and Table 9 show that the averages of both total views and total downloads are significantly higher for datasets with an associated data paper than the average views and downloads of HSS datasets in Zenodo from the same period. Both the U-test and Welch’s t-test achieve highly significant p-values, indicating that we can confidently reject the null hypothesis (namely, that there is no difference in mean between the two groups of datasets).

3.3. Twitter Data

Building on the premises presented in Section 2.3, in this section we will illustrate (1) how the use of a platform such as Twitter can tangibly contribute to increasing the visibility of a paper, and (2) how the framework in which the paper is presented on Twitter can influence (positively or negatively) the impact of the platform on the visibility of the paper itself.
As illustrated in Section 2.3, we performed the analysis on the impact of the two hashtags related to JOHD’s papers, namely #showmeyourdata and #johdpapers. We first calculated the means of the three metrics collected from JOHD’s website (downloads, views and citations) for the two datasets #johdpapers and #showmeyourdata (Table 10). The means of the metrics associated with papers that were tweeted on the journal’s account (column 1) and papers that were not tweeted about (column 2) show similar values. The hashtag #johdpapers does not seem to produce a noticeable increase in any of the metrics observed in the study. On the other hand, the number of downloads of the papers appeared in the #showmeyourdata campaign (column 3) doubles the downloads of papers that did not appear in the campaign (column 4). The same type of result in the #showmyourdata dataset is observed for the number of views.
We performed a Welch’s test to see whether the #showmeyourdata campaign really had a significant impact on at least two of the three metrics considered. We performed the same test for #johdpapers in order to detect whether the two hashtags indeed have a different impact on the visibility of the papers, i.e., to determine if there was a statistical difference between metrics associated with papers that appeared in #showmeyourdata and papers that did not.
Table 11 illustrates the results for the two groups for #showmeyourdata. With α = 0.05, we obtained a significative result for both the number of downloads (p = 0.0479) and the number of views (p = 0.0310) between the two groups. The #showmeyourdata campaign seems to have produced a positive outcome on the number of downloads and views of the paper on the website, for those papers that appeared in the campaign. Table 12 illustrates the results for the two groups for #johdpapers. With α = 0.05, none of the metrics seems to show significative differences between papers whose publication was announced on the journal’s Twitter account and the papers that were not tweeted about.
From the results of the tests, we can conclude that (1) Twitter can be a powerful tool to increase the visibility of publications, but (2) not every type of content automatically works in this sense. In fact, only the #showmeyourdata campaign was found to be successful, increasing the number of views and downloads on the journal’s website for those papers that appeared in the campaign. This is probably due to the different nature of the types of content featured by the two hashtags. As explained in Section 2.3, the #showmeyourdata campaign aims at directly involving the community, mentioning the authors by name (or Twitter handle) and inviting them to retweet and share an image of the data described in the paper mentioned in our tweet. On the other hand, #johdpapers is simply used for announcing new publications and does not always lead to further action from the authors and the Twitter community.

4. Discussion and Conclusions

The combined use of project repositories, data repositories, data papers and traditional research articles, all freely accessible, can maximise the impact of each of these means of publication towards more open and transparent research. The objective of this study was to take stock of the publication of data papers in the humanities and social sciences. The history of data journals over time reveals an important difference between the sciences and HSS disciplines. As mentioned in the Introduction, there are several reasons for this. On the one hand, the very definition of the term “data” is debated and understood differently by different humanities disciplines. This results in low levels of awareness of the importance of datasets as integral parts of the research process. Our study has used data from the two main data journals dedicated to HSS, JOHD and RDJ. While JOHD does not explicitly include social sciences in its title and its focus is indeed primarily on the humanities, it does publish articles which can be classified as social sciences, for example in its special collection dedicated to COVID-19. History, additionally, is often classified as a social science and is within the scope of JOHD. We have shown a gradual growth in terms of the number of data papers published per year, which has seen a significant increase in 2021 in JOHD’s case. Our analysis (Section 3.1) has also identified the most productive areas in terms of publication (and therefore submissions) of data papers (for example, Linguistics and History) and those that are emerging (for example, Motion Pictures and Social Sciences).
In Section 3.2, we carried out the first systematic analysis of the impact of data papers, associated datasets and research articles for the two HSS multidisciplinary data journals we focussed on. Data papers in JOHD and RDJ tend to be published after their associated datasets had been deposited in an open repository (on average 149 days later). They also tend to be published after their associated research articles (on average 118 days later), but sometimes they are published before. This confirms the intuition that authors may decide to publish their data papers first to enable maximum reuse of the data and gain early credit for their data work, or they may decide to publish their research article first, possibly fearing that early access to their data may diminish the impact of their research.
The analyses presented in Section 3.2 also suggest that data papers have a positive impact on both the metrics of research papers associated with them and on data reuse. This is extremely positive for HSS, which are still lacking an organic open humanities and social sciences discourse and are very often left out from the discussion around the impact of data sharing and, certainly, from the very few studies on the usefulness of data papers (see Section 1.2). Our results may also encourage more researchers in the field to deposit their data in public repositories and to describe them in a data paper, since it is also likely to benefit their own research in the long run.
Finally, our analysis of JOHD’s Twitter activity (Table 10) has shown that the means of the metrics associated with papers whose publication was announced on the journal’s Twitter account (column 1) and papers that were not announced (columns 2) show similar values. It seems that the hashtag #johdpapers does not produce a noticeable increase in any of the metrics observed in the study. On the other hand, the number of downloads of the papers appearing in the #showmeyourdata campaign (column 3) was double the number of downloads of papers that did not appear in the campaign (column 4). A similar result in the #showmeyourdata dataset is observed for the number of views. The way the two hashtags address the community is considerably different. Comparing the results of the analysis on the two datasets can also inform the journal’s future strategy. The #showmeyourdata campaign seems to have produced a positive outcome on the number of downloads and views of the papers on the website for those papers that appeared in the campaign.
In the future, our analysis can be expanded to include STEM data papers. Since linking between data papers and associated research papers turned out to be very informative, in such future study these links would need to be identified by experimenting with automatic or semiautomatic methods. We have also been collecting time-stamped (monthly) metrics, which may eventually allow us to account for the time variable more systematically than simple age-normalisation. Finally, collecting information on other predictors, such as sub-disciplines and author-specific metrics, may allow us to carry out further types of analysis, including regression modelling to compare the role played by data papers with other factors such as discipline or authors’ reputation.

Author Contributions

Conceptualization: B.McG., M.R. and N.P.; methodology: B.McG., N.P., M.R. and P.M.; software: N.P., P.M., E.Z. and M.R.; formal analysis: P.M.; investigation: B.McG., N.P., M.R. and P.M.; data curation, N.P., M.R. and P.M.; writing—original draft preparation: B.McG., N.P., M.R., M.W., P.M. and E.Z.; writing—review and editing: B.McG., N.P., P.M., M.R., E.Z. and M.W.; visualization: N.P., M.R. and E.Z.; supervision: B.McG.; project administration: B.McG.; funding acquisition: M.R. Primary contributions to drafting sections (and relative data analysis): Abstract: M.W.; 1: P.M., B.McG., 1.1: P.M., B.McG., 1.1.1: M.R., 1.1.2: P.M., E.Z., 1.2: P.M., M.W., 1.3: N.P., M.R., 2: N.P., M.R., 2.1: E.Z., 2.2: M.R., 2.2.1: N.P., M.R., 2.2.2: N.P., 2.2.3: N.P., 2.2.4: M.R., N.P., 2.3: P.M., 3.1: E.Z., 3.2.1: N.P., 3.2.2: N.P., 3.2.3: N.P., 3.3: P.M., 4: B.McG., Section Appendix A: E.Z., Appendix B: N.P., References: E.Z. All authors have read and agreed to the published version of the manuscript.

Funding

MR’s research and the APC were funded by The Leverhulme Trust under the fellowship grant ECF-2019-418.

Data Availability Statement

The data supporting this article are openly available from the King’s College London research data repository, KORDS, at https://doi.org/10.18742/19935014 (accessed on 15 July 2022).

Conflicts of Interest

The funders had no role in the design of the study; in the collection, analyses, or interpretation of data; in the writing of the manuscript, or in the decision to publish the results. The authors work for the Journal of Open Humanities Data as volunteers.

Appendix A

When classifying JOHD’s articles by research field, we made a distinction between data papers and research papers. As already mentioned, the majority of data papers and research papers are focused on the field of Linguistics [L01.559.598]. In the case of research papers (Figure A1), Linguistics [L01.559.598] is followed by Information Science [L01], History [K01], and Computing Methodologies [L01.224]. This analysis has revealed that for data papers (Figure A2), after Linguistics [L01.559.598], the most popular labels are the ones of History [K01] and Library Science [L01.583]. Figure A3 shows the subject distribution of papers published in RDJ.
Figure A1. Number of publications by field, research papers (JOHD).
Publications 10 00039 g0a1
Figure A2. Number of publications by field, data papers (JOHD).
Publications 10 00039 g0a2
Figure A3. Numbers of publications by field represented as MeSH hierarchical codes in RDJ papers.
Publications 10 00039 g0a3

Appendix B

The following figures complement those in Section 3.2.2. For each of the metrics, as done in Section 3.2.2. we provide:
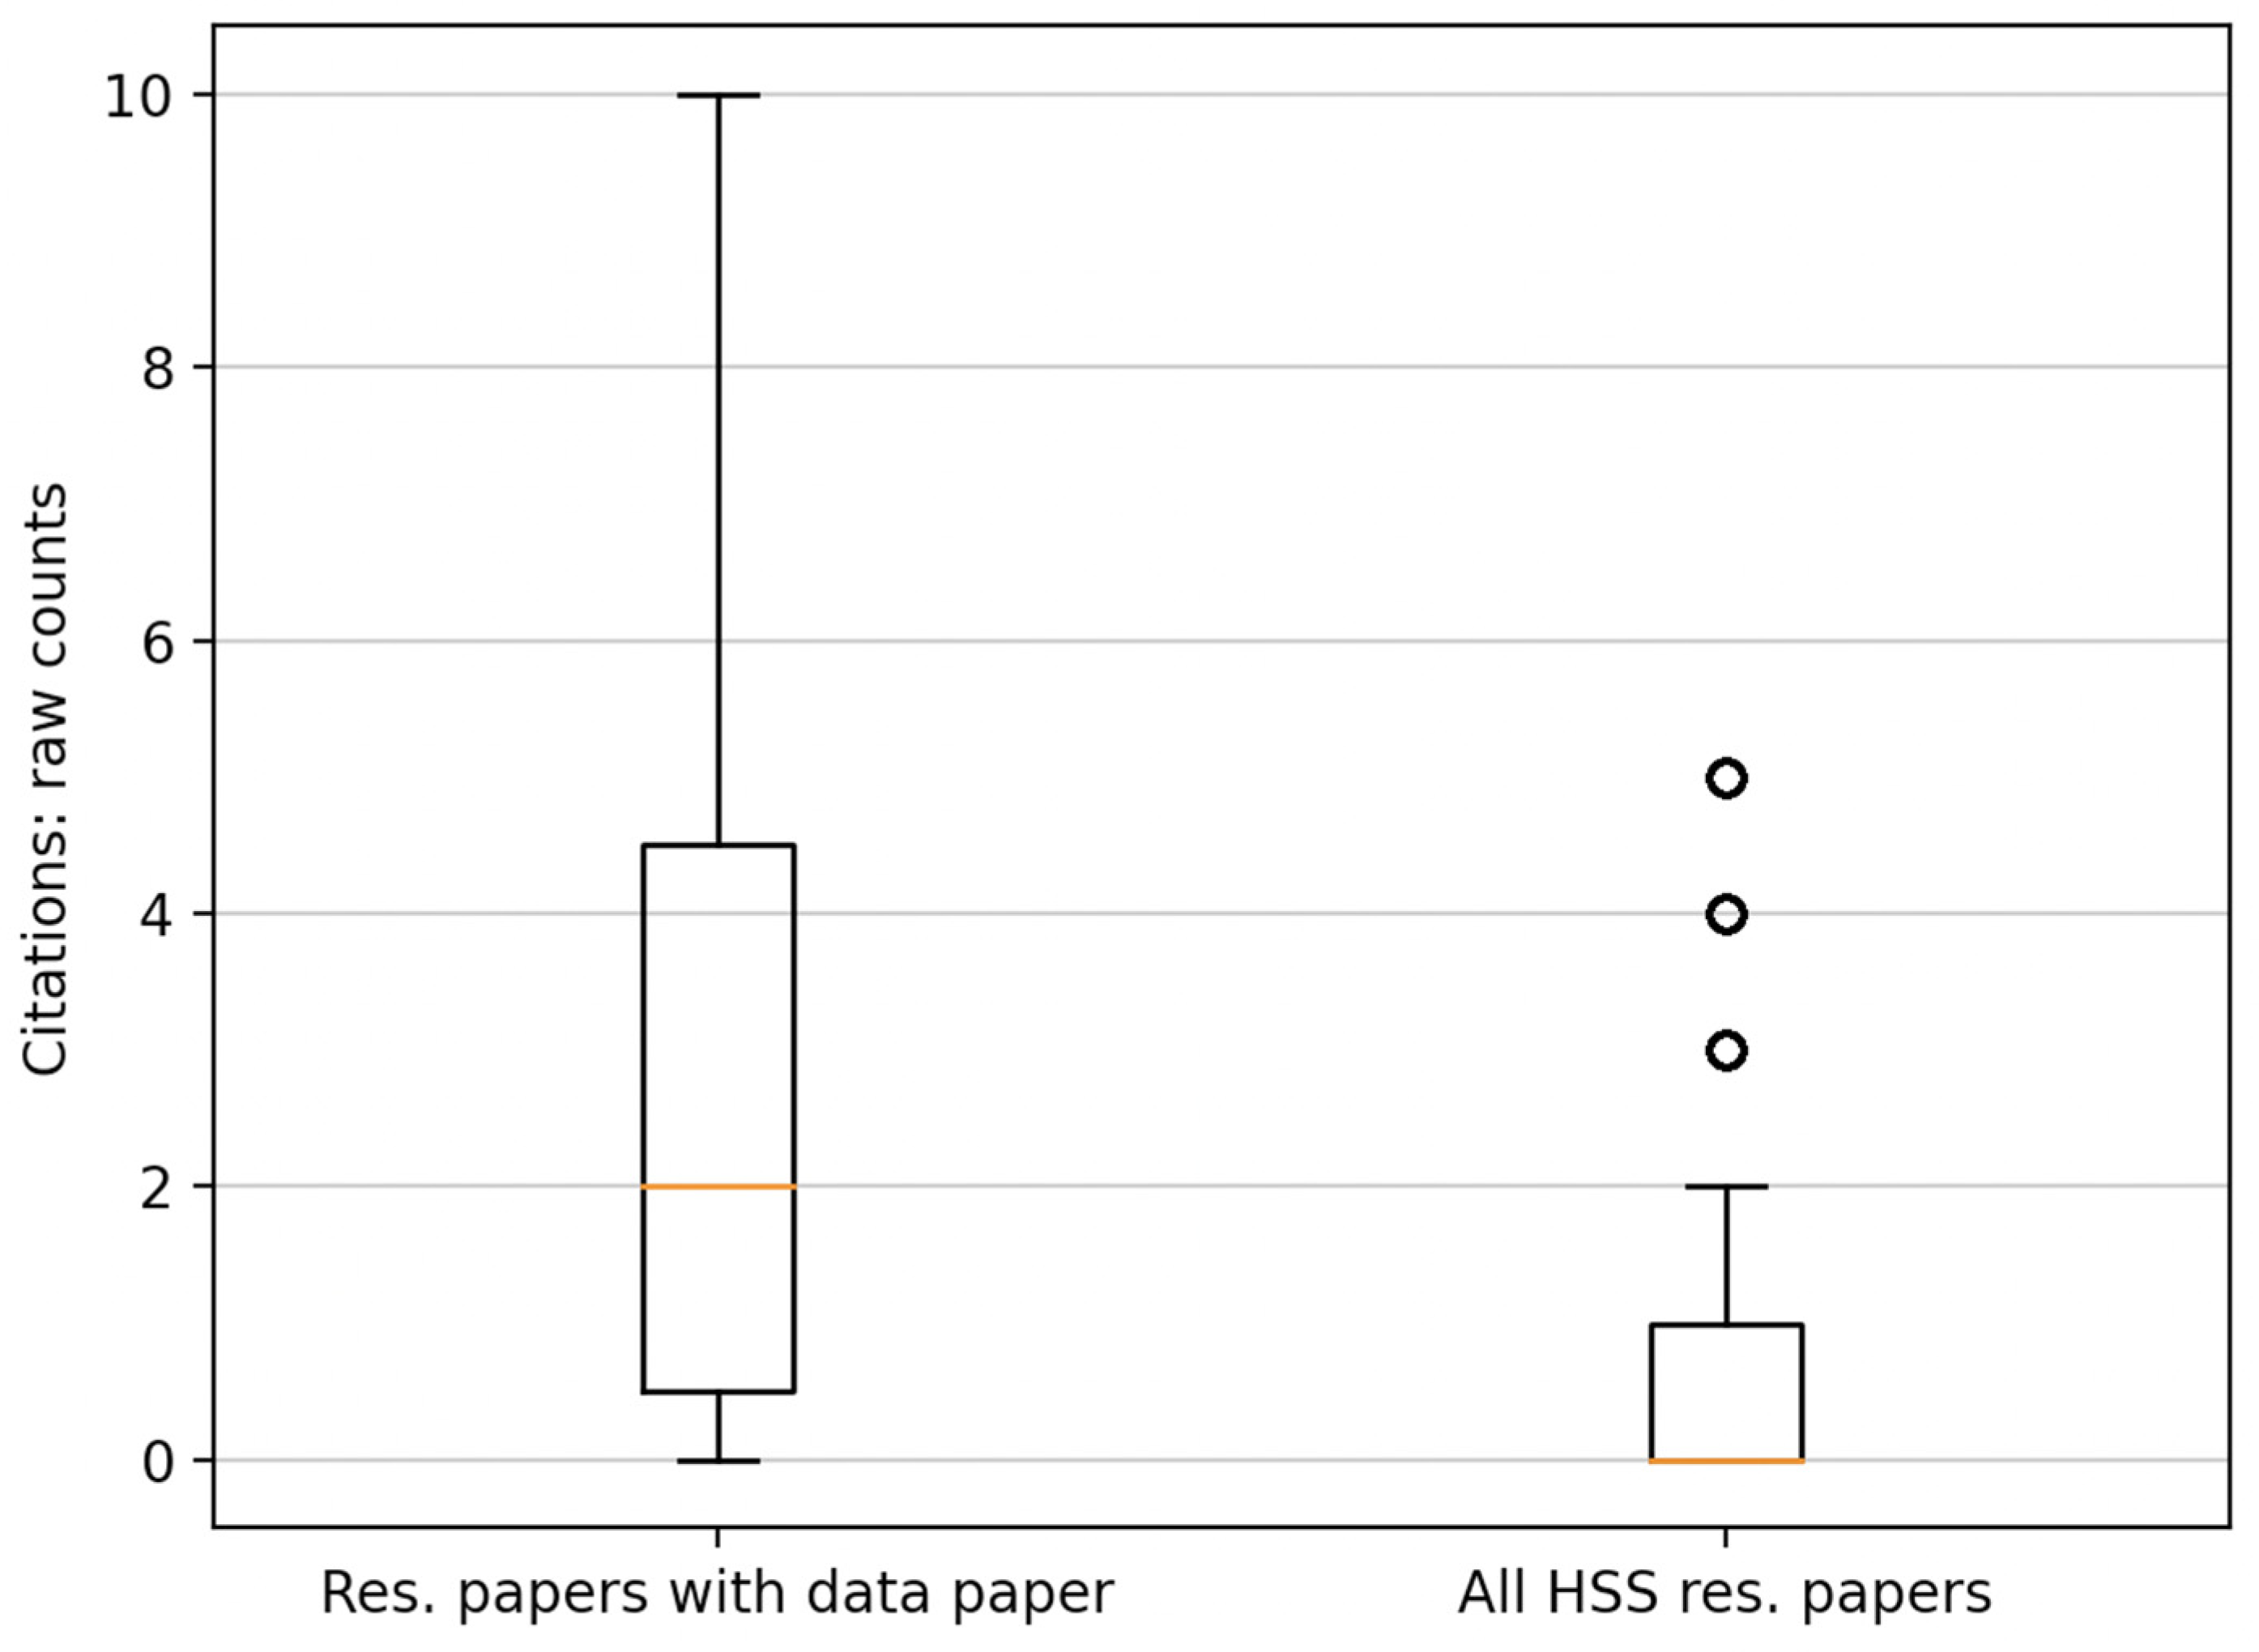
  • a box plot representing raw counts, including details on median and mean, lower and upper quartile, and the minima and maxima;
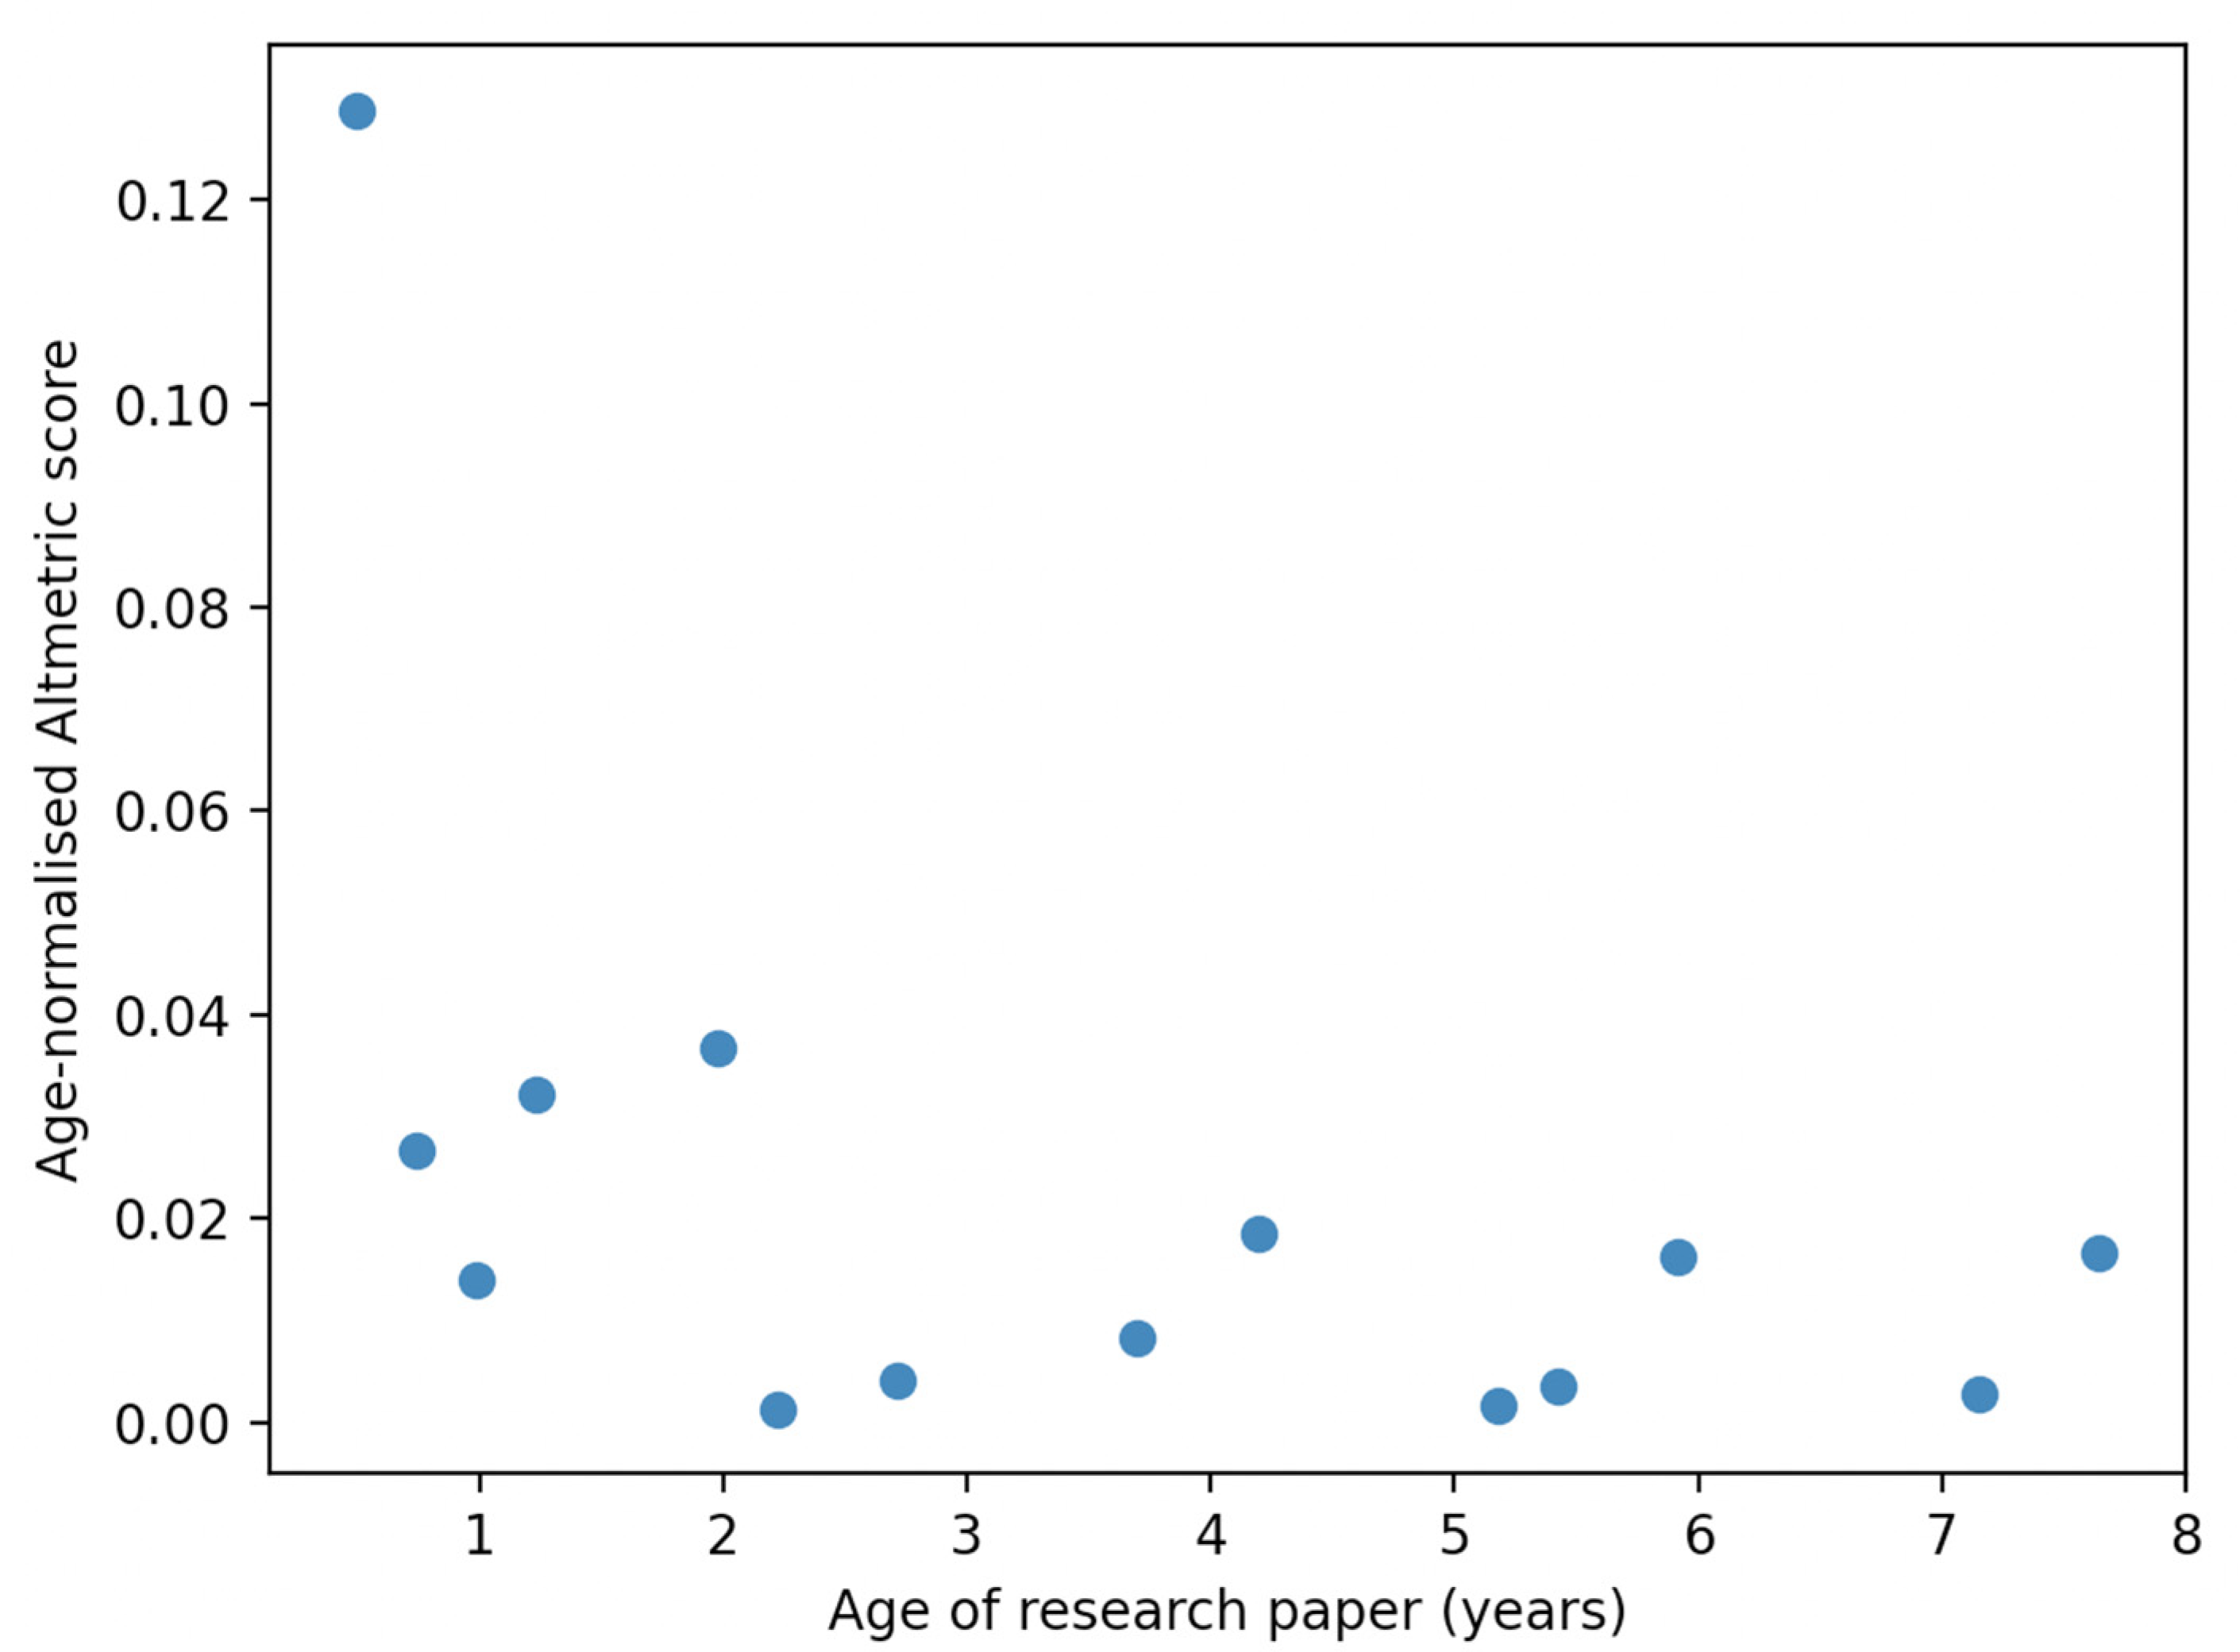
  • a scatter plot showing the relative, age-normalised counts of the relevant metrics in papers or datasets of different ages.
Figure A4. JOHD/RDJ data papers: average downloads and views.
Publications 10 00039 g0a4
Data paper downloads:
  • Median: 60
  • Mean: 344
  • Minimum: 0
  • Maximum: 989
  • Upper Q: 412
  • Lower Q: 16
Data paper views:
  • Median: 345
  • Mean: 553.8
  • Minimum: 0
  • Maximum: 1367
  • Upper Q: 649
  • Lower Q: 146
Figure A5. JOHD/RDJ data papers: average downloads and views over time (3-month ranges).
Publications 10 00039 g0a5
Figure A6. Research papers associated with JOHD/RDJ data papers: average total citation counts.
Publications 10 00039 g0a6
Citations of research papers with an associated data paper
  • Median: 2
  • Mean: 3.4
  • Minimum: 0
  • Maximum: 8
  • Upper Q: 4
  • Lower Q: 1
Figure A7. Research papers associated with JOHD/RDJ data papers: average total citation counts over time (3-month ranges).
Publications 10 00039 g0a7
Figure A8. Research papers associated with JOHD/RDJ data papers: average Altmetric scores.
Publications 10 00039 g0a8
Altmetric score of research papers with an associated data paper
  • Median: 12.5
  • Mean: 22
  • Minimum: 1
  • Maximum: 46
  • Upper Q: 26.2
  • Lower Q: 7
Figure A9. Research papers associated with JOHD/RDJ data papers: average Altmetric scores over time (3-month ranges).
Publications 10 00039 g0a9
Figure A10. Datasets associated with JOHD/RDJ data papers: average total downloads and views.
Publications 10 00039 g0a10
Downloads
  • Median: 94
  • Mean: 469.7
  • Minimum: 2
  • Maximum: 424
  • Upper Q: 244.5
  • Lower Q: 26
Views
  • Median: 341
  • Mean: 933
  • Minimum: 35
  • Maximum: 1184
  • Upper Q: 768.5
  • Lower Q: 173.5
Figure A11. Datasets associated with JOHD/RDJ data papers: average total downloads and views over time (3-month ranges).
Publications 10 00039 g0a11
Figure A12. Humanities and social sciences datasets published in Zenodo (2015–2022): average total downloads and views.
Publications 10 00039 g0a12
Downloads:
  • Median: 5
  • Mean: 9
  • Minimum: 0
  • Maximum: 28
  • Upper Q: 12
  • Lower Q: 1
Views:
  • Median: 13
  • Mean: 18.6
  • Minimum: 0
  • Maximum: 58
  • Lower Q: 6
  • Upper Q: 27
Figure A13. Humanities and social sciences datasets published in Zenodo (2015–2022): average total downloads and views over time (3-month ranges).
Publications 10 00039 g0a13
Figure A14. Humanities and social sciences research papers from Dimensions (2015–2022): average total citations and Altmetric scores.
Publications 10 00039 g0a14
Citations of all HSS research papers from Dimensions:
  • Median: 3
  • Mean: 4.6
  • Minimum: 1
  • Maximum: 13
  • Upper Q: 6
  • Lower Q: 1
Altmetric score of all HSS research papers from Dimensions:
  • Median: 3
  • Mean: 6
  • Minimum: 0
  • Maximum: 18
  • Upper Q: 8
  • Lower Q: 1
Figure A15. Humanities and social sciences research papers from Dimensions (2015–2022): average total citations and Altmetric scores over time (3-month ranges).
Publications 10 00039 g0a15

Notes

1. 
https://opendefinition.org/, accessed on 12 July 2022.
2. 
With regard to types of research output alternative to the academic article, it is worth mentioning the Declaration on Research Assessment (DORA), launched in 2012. Although not specifically focused on open research, it is committed to improving methods for evaluating research outputs in all disciplines, ultimately to decrease inequalities within the academic system.
3. 
https://www.go-fair.org/fair-principles/, accessed on 12 July 2022.
4. 
https://www.coalition-s.org/, accessed on 12 July 2022.
5. 
https://sshopencloud.eu/about-sshoc, accessed on 12 July 2022.
6. 
https://libereurope.eu/, accessed on 12 July 2022.
7. 
8. 
https://openhumanitiesdata.metajnl.com/, accessed on 12 July 2022.
9. 
10. 
The first articles were published in RDJ at a later date, on 25 March 2016.
11. 
https://meshb.nlm.nih.gov/, accessed on 12 July 2022.
12. 
13. 
14. 
15. 
The documentation of the Zenodo REST API includes instructions for using the ‘records’ endpoint at https://developers.zenodo.org/#records, accessed on 25 August 2022.
16. 
17. 
Prior to the introduction of the hashtags system, the publication of some of the first papers published by JOHD was announced on the journal’s Twitter account. The content of these tweets generally overlaps with the format used in #johdpapers, besides the missing hashtag. Therefore, we manually retrieved and added the papers tweeted in the past to the list of #johdpapers.
18. 
19. 

References

  1. McGillivray, B.; Alex, B.; Ames, S.; Armstrong, G.; Beavan, D.; Ciula, A.; Colavizza, G.; Cummings, J.; De Roure, D.; Farquhar, A. The challenges and prospects of the intersection of humanities and data science: A White Paper from The Alan Turing Institute. Figshare 2020. [Google Scholar] [CrossRef]
  2. Hinrichs, E.; Krauwer, S. ‘The CLARIN Research Infrastructure: Resources and Tools for E-Humanities Scholars. In Proceedings of the Ninth International Conference on Language Resources and Evaluation (LREC-2014), Reykjavik, Iceland, 26–31 May 2014. [Google Scholar]
  3. Callaghan, S.; Donegan, S.; Pepler, S.; Thorley, M.; Cunningham, N.; Kirsch, P.; Ault, L.; Bell, P.; Bowie, R.; Leadbetter, A.; et al. Making Data a First Class Scientific Output: Data Citation and Publication by NERC’s Environmental Data Centres. Int. J. Digit. Curation 2012, 7, 107–113. [Google Scholar] [CrossRef]
  4. Schöpfel, J.; Farace, D.; Prost, H.; Zane, A. Data Papers as a New Form of Knowledge Organization in the Field of Research Data. Knowl. Organ. 2019, 46, 622–638. [Google Scholar] [CrossRef] [Green Version]
  5. Bordelon, D.; Grothkopf, U.; Meakins, S.; Sterzik, M. Trends and developments in VLT data papers as seen through telbib. In Proceedings of the Volume 9910, Observatory Operations: Strategies, Processes, and Systems VI, Edinburgh, UK, 15 July 2016. [Google Scholar] [CrossRef]
  6. Pärtel, M. Data availability for macroecology: How to get more out of regular ecological papers. Acta Oecologica 2006, 30, 97–99. [Google Scholar] [CrossRef]
  7. Penev, L.; Chavan, V.; Georgiev, T.; Stoev, P. Data papers as incentives for opening biodiversity data: One year of experience and perspectives for the future. Poster présenté à EU BON: Building the European Biodiversity Observation Network, 2012. Available online: https://pensoft.net/img/upl/file/DataPaperPoster.pdf (accessed on 15 July 2022).
  8. Marongiu, P.; Pedrazzini, N.; Ribary, M.; McGillivray, B. Le Journal of Open Humanities Data: Enjeux et défis dans la publication de data papers pour les sciences humaines. In Publier, Partager, Réutiliser les Données de la Recherche: Les Data Papers et Leurs enjeux; Kosmopoulos, C., Schopfel, J., Eds.; Presses Universitaires du Septentrion: Villeneuve-d’Ascq, France, 2021; (to be published). [Google Scholar]
  9. Ribary, M. pyDigest: A GitLab Repository of Scripts, Files and Documentation. Available online: https://gitlab.eps.surrey.ac.uk/mr0048/pydigest (accessed on 18 June 2022).
  10. Ribary, M. A Relational Database of Roman Law Based on Justinian’s Digest. Available online: https://figshare.com/articles/dataset/A_relational_database_of_Roman_law_based_on_Justinian_s_Digest/12333290 (accessed on 18 June 2022).
  11. Ribary, M. A Relational Database of Roman Law Based on Justinian’s Digest. J. Open Humanit. Data 2020, 6, 5. [Google Scholar] [CrossRef]
  12. Ribary, M.; McGillivray, B. A Corpus Approach to Roman Law Based on Justinian’s Digest. Informatics 2020, 7, 44. [Google Scholar] [CrossRef]
  13. García-García, A.; López-Borrull, A.; Peset, F. Data journals: Eclosión de nuevas revistas especializadas en datos. El Prof. de la Inf. 2015, 24, 845. [Google Scholar] [CrossRef] [Green Version]
  14. Candela, L.; Castelli, D.; Manghi, P.; Tani, A. Data journals: A survey. J. Assoc. Inf. Sci. Technol. 2015, 66, 1747–1762. [Google Scholar] [CrossRef] [Green Version]
  15. Walters, W.H. Data journals: Incentivizing data access and documentation within the scholarly communication system. Insights 2020, 33, 18. [Google Scholar] [CrossRef]
  16. Engelhardt, C.; Biernacka, K.; Coffey, A.; Cornet, R.; Danciu, A.; Demchenko, Y.; Downes, S.; Erdmann, C.; Garbuglia, F.; Germer, K.; et al. D7.4 How to Be FAIR with Your Data. A Teaching and Training Handbook for Higher Education Institutions, version V1.2 DRAFT. Zenodo 2022. [Google Scholar] [CrossRef]
  17. Miguel, E.; Camerer, C.; Casey, K.; Cohen, J.; Esterling, K.M.; Gerber, A.; Glennerster, R.; Green, D.P.; Humphreys, M.; Imbens, G.; et al. Promoting Transparency in Social Science Research. Science 2014, 343, 30–31. [Google Scholar] [CrossRef] [PubMed] [Green Version]
  18. Hrynaszkiewicz, I.; Harney, J.; Cadwallader, L. A Survey of Researchers’ Needs and Priorities for Data Sharing. Data Sci. J. 2021, 20, 31. [Google Scholar] [CrossRef]
  19. Rousi, A.M.; Laakso, M. Journal research data sharing policies: A study of highly-cited journals in neuroscience, physics, and operations research. Scientometrics 2020, 124, 131–152. [Google Scholar] [CrossRef] [Green Version]
  20. Haendel, M.A.; Vasilevsky, N.; Wirz, J. Dealing with Data: A Case Study on Information and Data Management Literacy. PLOS Biol. 2012, 10, e1001339. [Google Scholar] [CrossRef] [PubMed] [Green Version]
  21. Rouder, J.N. The what, why, and how of born-open data. Behav. Res. Methods 2015, 48, 1062–1069. [Google Scholar] [CrossRef]
  22. Armbruster, C. Whose metrics? Citation, usage and access metrics as scholarly information service. Learn. Publ. 2010, 23, 33–38. [Google Scholar] [CrossRef]
  23. Colavizza, G.; Hrynaszkiewicz, I.; Staden, I.; Whitaker, K.; McGillivray, B. The citation advantage of linking publications to research data. PLoS ONE 2020, 15, e0230416. [Google Scholar] [CrossRef] [Green Version]
  24. Christensen, G.; Dafoe, A.; Miguel, E.; Moore, D.A.; Rose, A.K. A study of the impact of data sharing on article citations using journal policies as a natural experiment. PLoS ONE 2019, 14, e0225883. [Google Scholar] [CrossRef] [Green Version]
  25. Piwowar, H.A.; Vision, T.J. Data reuse and the open data citation advantage. PeerJ 2013, 1, e175. [Google Scholar] [CrossRef]
  26. Elmore, S.A. The Altmetric attention score: What does it mean and why should I care? Toxicol. Pathol. 2018, 46, 252–255. [Google Scholar] [CrossRef] [Green Version]
  27. Robinson, D.B.T.; Powell, A.G.M.T.; Waterman, J.; Hopkins, L.; James, O.P.; Egan, R.J.; Lewis, W.G. Predictive value of Altmetric score on citation rates and bibliometric impact. BJS Open 2021, 5, zraa039. [Google Scholar] [CrossRef] [PubMed]
  28. Erdt, M.; Nagarajan, A.; Sin, S.-C.J.; Theng, Y.-L. Altmetrics: An analysis of the state-of-the-art in measuring research impact on social media. Scientometrics 2016, 109, 1117–1166. [Google Scholar] [CrossRef]
  29. Llewellyn, N.M.; Nehl, E.J. Predicting citation impact from altmetric attention in clinical and translational research: Do big splashes lead to ripple effects? CTS 2022, 15, 1387–1392. [Google Scholar] [CrossRef] [PubMed]
  30. Brody, T.; Harnad, S.; Carr, L. Earlier Web usage statistics as predictors of later citation impact. J. Am. Soc. Inf. Sci. Technol. 2006, 57, 1060–1072. [Google Scholar] [CrossRef]
  31. Chang, J.; Desai, N.; Gosain, A. Correlation Between Altmetric Score and Citations in Pediatric Surgery Core Journals. J. Surg. Res. 2019, 243, 52–58. [Google Scholar] [CrossRef] [PubMed]
  32. Collins, C.S.; Singh, N.P.; Ananthasekar, S.; Boyd, C.J.; Brabston, E.; King, T.W. The Correlation Between Altmetric Score and Traditional Bibliometrics in Orthopaedic Literature. J. Surg. Res. 2021, 268, 705–711. [Google Scholar] [CrossRef]
  33. Kolahi, J.; Khazaei, S.; Iranmanesh, P.; Kim, J.; Bang, H.; Khademi, A. Meta-Analysis of Correlations between Altmetric Attention Score and Citations in Health Sciences. BioMed Res. Int. 2021, 2021, 1–11. [Google Scholar] [CrossRef]
  34. Ran, N. Association Between Immediacy of Citations and Altmetrics in COVID-19 Research by Artificial Neural Networks. Disaster Med. Public Health Prep. 2021, 1–6. [Google Scholar] [CrossRef]
  35. Vaghjiani, N.G.; Lal, V.; Vahidi, N.; Ebadi, A.; Carli, M.; Sima, A.; Coelho, D.H. Social Media and Academic Impact: Do Early Tweets Correlate With Future Citations? Ear Nose Throat J. 2021. [Google Scholar] [CrossRef]
  36. Drachen, T.M.; Ellegaard, O.; Larsen, A.V.; Dorch, S.B.F. Sharing Data Increases Citations. Liber Q. 2016, 26, 67–82. [Google Scholar] [CrossRef] [Green Version]
  37. Piwowar, H.A.; Day, R.S.; Fridsma, D.B. Sharing Detailed Research Data Is Associated with Increased Citation Rate. PLoS ONE 2007, 2, e308. [Google Scholar] [CrossRef] [PubMed] [Green Version]
  38. Henneken, E.A.; Accomazzi, A. Linking to data-effect on citation rates in astronomy. arXiv 2011, arXiv:1111.3618. [Google Scholar]
  39. Sears, J.R.L. Data sharing effect on article citation rate in paleoceanography. In Proceedings of the Fall Meeting, AGU, San Francisco, CA, USA, 5–9 December 2011. [Google Scholar]
  40. Leitner, F.; Bielza, C.; Hill, S.L.; Larrañaga, P. Data Publications Correlate with Citation Impact. Front. Neurosci. 2016, 10, 419. [Google Scholar] [CrossRef] [PubMed] [Green Version]
  41. Zhang, L.; Ma, L. Does open data boost journal impact: Evidence from Chinese economics. Scientometrics 2021, 126, 3393–3419. [Google Scholar] [CrossRef] [PubMed]
  42. Vandewalle, P. Code Sharing Is Associated with Research Impact in Image Processing. Comput. Sci. Eng. 2012, 14, 42–47. [Google Scholar] [CrossRef] [Green Version]
  43. Thelwall, M. Data in Brief: Can a mega-journal for data be useful? Scientometrics 2020, 124, 697–709. [Google Scholar] [CrossRef]
  44. Stuart, D. Data bibliometrics: Metrics before norms. Online Inf. Rev. 2017, 41, 428–435. [Google Scholar] [CrossRef]
  45. Ilgisonis, E.V.; Pyatnitskiy, M.A.; Tarbeeva, S.N.; Aldushin, A.A.; Ponomarenko, E.A. How to catch trends using MeSH terms analysis? Scientometrics 2022, 127, 1953–1967. [Google Scholar] [CrossRef]
  46. Leydesdorff, L.; Opthof, T. Citation analysis with medical subject Headings (MeSH) using the Web of Knowledge: A new routine. J. Am. Soc. Inf. Sci. Technol. 2013, 64, 1076–1080. [Google Scholar] [CrossRef] [Green Version]
  47. AlRyalat, S.A.S.; Malkawi, L.W.; Momani, S.M. Comparing Bibliometric Analysis Using PubMed, Scopus, and Web of Science Databases. J. Vis. Exp. 2019, 152, e58494. [Google Scholar] [CrossRef]
  48. Bode, C.; Herzog, C.; Hook, D.; McGrath, R. A Guide to the Dimensions Data Approach. Figshare 2019. [Google Scholar] [CrossRef]
  49. Peters, I.; Kraker, P.; Lex, E.; Gumpenberger, C.; Gorraiz, J. Research data explored: An extended analysis of citations and altmetrics. Scientometrics 2016, 107, 723–744. [Google Scholar] [CrossRef] [PubMed] [Green Version]
  50. Bornmann, L. Do altmetrics point to the broader impact of research? An overview of benefits and disadvantages of altmetrics. J. Inf. 2014, 8, 895–903. [Google Scholar] [CrossRef] [Green Version]
  51. Hwang, L.; Fish, A.; Soito, L.; Smith, M.; Kellogg, L.H. Software and the Scientist: Coding and Citation Practices in Geodynamics. Earth Space Sci. 2017, 4, 670–680. [Google Scholar] [CrossRef]
  52. Park, H.; You, S.; Wolfram, D. Informal data citation for data sharing and reuse is more common than formal data citation in biomedical fields. J. Assoc. Inf. Sci. Technol. 2018, 69, 1346–1354. [Google Scholar] [CrossRef]
  53. Park, H.; Wolfram, D. Research software citation in the Data Citation Index: Current practices and implications for research software sharing and reuse. J. Inf. 2019, 13, 574–582. [Google Scholar] [CrossRef]
  54. Yoon, J.; Chung, E.; Lee, J.Y.; Kim, J. How research data is cited in scholarly literature: A case study of HINTS. Learn. Publ. 2019, 32, 199–206. [Google Scholar] [CrossRef]
  55. Martone, M. (Ed.) Data Citation Synthesis Group: Joint Declaration of Data Citation Principles; FORCE11: San Diego, CA, USA, 2014. [Google Scholar] [CrossRef]
  56. Burton, A.; Aryani, A.; Koers, H.; Manghi, P.; La Bruzzo, S.; Stocker, M.; Diepenbroek, M.; Schindler, U.; Fenner, M. The Scholix Framework for Interoperability in Data-Literature Information Exchange. D-Lib Mag. 2017, 23, 1/2. [Google Scholar] [CrossRef]
  57. Cousijn, H.; Feeney, P.; Lowenberg, D.; Presani, E.; Simons, N. Bringing Citations and Usage Metrics Together to Make Data Count. Data Sci. J. 2019, 18, 1. [Google Scholar] [CrossRef]
  58. Federer, L. Measuring and Mapping Data Reuse: Findings From an Interactive Workshop on Data Citation and Metrics for Data Reuse. Harv. Data Sci. Rev. 2020, 2, 2. [Google Scholar] [CrossRef]
  59. McGillivray, B.; Marongiu, P.; Pedrazzini, N.; Ribary, M.; Zordan, E. JOHD Data Analysis: Scripts and Data. npedrazzini/DataPapersAnalysis, version 1.0.0. Zenodo 2022. [Google Scholar] [CrossRef]
  60. McGillivray, B.; Marongiu, P.; Pedrazzini, N.; Ribary, M.; Zordan, E. Data Journals and Data Papers in the Humanities. Figshare 2022. [Google Scholar] [CrossRef]
  61. Dancey Christine, P.; Reidy, J. Statistics without Maths for Psychology, 7th ed.; Pearson Education: London, UK, 2017. [Google Scholar]
  62. Hall-Lew, L.; Cowie, C.; McNulty, S.J.; Markl, N.; Liu, S.-J.S.; Lai, C.; Llewellyn, C.; Alex, B.; Fang, N.; Elliott, Z.; et al. The Lothian Diary Project: Investigating the Impact of the COVID-19 Pandemic on Edinburgh and Lothian Residents. J. Open Humanit. Data 2021, 7, 4. [Google Scholar] [CrossRef]
  63. Allés-Torrent, S.; Riande, G.D.R.; Bonnell, J.; Song, D.; Hernández, N. Digital Narratives of COVID-19: A Twitter Dataset for Text Analysis in Spanish. J. Open Humanit. Data 2021, 7, 5. [Google Scholar] [CrossRef]
  64. Knuutila, A.; Herasimenka, A.; Au, H.; Bright, J.; Howard, P.N. A Dataset of COVID-Related Misinformation Videos and their Spread on Social Media. J. Open Humanit. Data 2021, 7, 1–5. [Google Scholar] [CrossRef]
Figure 1. The pyramid structure of the research and dissemination ecosystem in data-driven projects adapted from [8].
Publications 10 00039 g001
Figure 2. The triangle of “deep impact” in data-driven projects.
Publications 10 00039 g002
Figure 3. JOHD and RDJ publications per year. Note that the data for 2022 are incomplete, because they only cover the period from 1 January to 4 June 2022.
Publications 10 00039 g003
Figure 4. Distribution of the research fields represented as MeSH hierarchical labels in JOHD and RDJ papers.
Publications 10 00039 g004
Figure 5. Number of days elapsed between the publication of a dataset in its public repository and the publication of the associated data paper by JOHD or RDJ. 0 on the x-axis is the date of publication of a dataset, so that one data point at 500 on the x-axis, for instance, indicates that one data paper was published 500 days after the publication of its associated dataset. M = median. MAD = median absolute deviation.
Publications 10 00039 g005
Figure 6. Number of days elapsed between the publication of a research paper and the publication of the associated data paper by JOHD or RDJ. 0 on the x-axis is the date of publication of a dataset, so that one data point at −500 on the x-axis, for instance, indicates that one data paper was published 500 days before the publication of its associated research paper.
Publications 10 00039 g006
Figure 7. JOHD/RDJ data papers: boxplot showing the distribution of total citation counts.
Publications 10 00039 g007
Figure 8. JOHD/RDJ data papers: average citation counts over time. The number of years of age of the papers indicated on the x-axis has been divided into 3-month intervals.
Publications 10 00039 g008
Figure 9. JOHD/RDJ data papers: Altmetric scores.
Publications 10 00039 g009
Figure 10. JOHD/RDJ data papers: average Altmetric score over time (3-month ranges).
Publications 10 00039 g010
Figure 11. Comparison between research papers with an associated data paper and all HSS research papers (2015–2022): citation counts.
Publications 10 00039 g011
Figure 12. Comparison between research papers with an associated data paper and all HSS research papers (2015–2022): Altmetric scores.
Publications 10 00039 g012
Figure 13. Comparison between datasets with an associated data paper and all HSS datasets (2015–2022): downloads.
Publications 10 00039 g013
Figure 14. Comparison between datasets with an associated data paper and all HSS datasets (2015–2022): views.
Publications 10 00039 g014
Table 1. Overview of data journals whose scope includes humanities and social science disciplines.
Name of JournalYear Since PublicationsFieldPublications so FarPublisherURL
(CODATA) Data Science Journal2002 (relaunch 2014)Science; Technology; Humanities; Arts823Ubiquity Presshttps://datascience.codata.org/ (accessed on 7 July 2022)
Data in Brief2014All including Humanities>6000Elsevierhttps://www.journals.elsevier.com/data-in-brief (accessed on 7 July 2022)
F1000Research2012All including Humanities>5000F1000 Researchhttps://f1000research.com (accessed on 7 July 2022)
Journal of Cognition2017Cognitive psychology222Ubiquity Presshttps://www.journalofcognition.org/ (accessed on 7 July 2022)
Journal of Cultural Analytics2016Cultural analytics109Department of Languages, Literatures, and Cultures at McGill Universityhttps://culturalanalytics.org/section/1579-data-sets (accessed on 7 July 2022)
Journal of Open Archaeology Data2012Archaeology57Ubiquity Presshttps://openarchaeologydata.metajnl.com/ (accessed on 7 July 2022)
Journal of Open Humanities Data2015Humanities67Ubiquity Presshttps://openhumanitiesdata.metajnl.com/ (accessed on 7 July 2022)
Journal of Open Psychology Data2013Psychology48Ubiquity Presshttps://openpsychologydata.metajnl.com/ (accessed on 7 July 2022)
Research Data Journal for the Humanities and Social Sciences2016Humanities; Social Sciences46Brillhttps://brill.com/view/journals/rdj/rdj-overview.xml (accessed on 7 July 2022)
Table 2. Breakdown of the type of usage statistics available for each of the datasets associated with JOHD and RDJ data papers.
Total Number of Data Papers with an Associated DatasetDataset Download and View Count Available for Associated DatasetOnly Download Count Available for Associated DatasetOnly View Count Available for Associated DatasetNo Total Usage Statistics Available for Associated Dataset
1074214249
Table 3. Overview of the type of usage statistics provided by each of the repositories represented in our dataset.
ZenodoFigshareDataverseDatashareKaggleOSF
Total viewsYesYesSometimesYesYesNo
Total downloadsYesYesYesNoYesNo
Table 4. Summary of the types of publications and respective impact metrics used in the analysis.
Type of PublicationImpact Metrics Availablen of Entries
a. Data papersCitation counts
Total views
Total downloads
Altmetric score
107
b. Research associated with a data paperCitation counts
Total views
Total downloads
Altmetric score
35
c. Datasets associated with a data paperTotal views
Total downloads
58
d. Humanities and social sciences datasets in Zenodo (2015–2022)Total views
Total downloads
39,290
e. Humanities and social sciences research papers in Dimensions (2015–2022)Citation counts
Altmetric score
358,770
Table 5. Result of correlation analysis between the metrics of data papers and associated research papers and datasets.
Variable 1Variable 2rhop-ValueStrength of CorrelationSignificant
(Alpha = 0.05)?
tot_cit_datapapersaltmetric_research0.68<0.01ModerateY
downloads_datapapersaltmetric_research0.590.015ModerateY
altmetric_datapaperstot_cit_research0.390.063WeakBorderline
views_datapapersaltmetric_research0.470.064ModerateBorderline
views_datasettot_cit_datapapers0.510.014ModerateY
Table 6. Welch’s t-test and Mann–Whitney U-test results: mean citations of research papers with an associated data paper and all HSS research papers between 2015 and 2022, at each random sampling of the latter.
All HSS Res.
Papers (Mean
Citations)
Res. Papers
with Associated
Data Paper
(Mean Citations)
Welch’s StatsWelch’s p-ValueMann–Whitney
Stats
Mann–Whitney
p-Value
0.00050.00173.5911<0.0187,958<0.01
0.00050.00173.5417<0.0187,593<0.01
0.00050.00173.5756<0.0187,779<0.01
0.00050.00173.5491<0.0187,595<0.01
0.00050.00173.5666<0.0187,704.5<0.01
0.00050.00173.5052<0.0187,319.5<0.01
0.00050.00173.5174<0.0187,434.5<0.01
0.00050.00173.5788<0.0187,909.5<0.01
0.00050.00173.5552<0.0187,690.5<0.01
0.00050.00173.5329<0.0187,569.5<0.01
Table 7. Welch’s t-test and Mann–Whitney U-test results: mean Altmetric score of research papers with an associated data paper and all HSS research papers between 2015 and 2022, at each random sampling of the latter.
All HSS Res.
Papers (Mean
Altmetric
Score)
Res. Papers
with Associated
Data Paper
(Mean Altmetric
Score)
Welch’s
Stats
Welch’s p-ValueMann–Whitney
Stats
Mann–Whitney
p-Value
0.00540.01422.70960.016955,227.5<0.01
0.00550.01422.68090.017854,885<0.01
0.00540.01422.70600.017055,167<0.01
0.00540.01422.70280.017154,985.5<0.01
0.00530.01422.72070.016555,342.5<0.01
0.00540.01422.71230.016855,262.5<0.01
0.00540.01422.69670.017355,065<0.01
0.00540.01422.70270.017155,138<0.01
0.00520.01422.75660.015455,542<0.01
0.00530.01422.72200.016555,247.5<0.01
Table 8. Welch’s t-test and Mann–Whitney U-test results: mean downloads of datasets with an associated data paper and all HSS datasets between 2015 and 2022, at each random sampling of the latter.
All HSS
Datasets (Mean
Downloads)
Datasets
with Associated
Data Paper
(Mean Downloads)
Welch’s
Stats
Welch’s p-ValueMann–Whitney
Stats
Mann–Whitney
p-Value
0.03710.18073.6907<0.001150,735.5<0.001
0.03330.18073.7979<0.001150,662.5<0.001
0.03250.18073.8184<0.001150,606.5<0.001
0.03630.18073.6818<0.001150,534.5<0.001
0.03580.18073.7203<0.001149,763.5<0.001
0.03240.18073.8213<0.001150,502<0.001
0.04150.18073.5410<0.001150,328.5<0.001
0.03930.18073.6093<0.001150,285<0.001
0.03600.18073.6890<0.001150,863.5<0.001
0.03290.18073.8062<0.001150,091<0.001
Table 9. Welch’s t-test and Mann–Whitney U-test results: mean views of datasets with an associated data paper and all HSS datasets between 2015 and 2022, at each random sampling of the latter.
All HSS
Datasets (Mean
Views)
Datasets
with Associated
Data Paper
(Mean Views)
Welch’s
Stats
Welch’s p-ValueMann–Whitney
Stats
Mann–Whitney
p-Value
0.08660.58996.6730<0.001166,320.5<0.001
0.10450.58996.3782<0.001166,043.5<0.001
0.09150.58996.5895<0.001166,474<0.001
0.07800.58996.7957<0.001166,256<0.001
0.08850.58996.6488<0.001165,853<0.001
0.09540.58996.5406<0.001166,109<0.001
0.08680.58996.6652<0.001166,378.5<0.001
0.09030.58996.6159<0.001166,123.5<0.001
0.08110.58996.7502<0.001166,266<0.001
0.08130.58996.7475<0.001166,329.5<0.001
Table 10. Means of the number of downloads, views and citations for the papers which had an associated tweet with the hashtag #johdpapers (first column) and without the hashtag #johdpapers (second column), and for the papers with an associated tweet with (third column) and without (fourth column) the hashtag #showmeyourdata.
#johdpapers#showmeyourdata
With HashtagWithout HashtagWith HashtagWithout Hashtag
(1)(2)(3)(4)
Mean downloads0.08220.08930.10480.0576
Mean views0.63270.76430.84710.4543
Mean citations0.00160.00250.00200.0018
Table 11. Results of the Welch’s test on the metrics associated with papers included in the #showmeyourdata campaign and papers not included in the campaign.
With Hashtag Without HashtagDifference in Meanst-Statisticp-Value
downloadsdownloads0.04722.0208<0.05
viewsviews0.39272.2143<0.05
citationscitations0.00020.20120.8412
Table 12. Results of the Welch’s test on the metrics associated with papers tweeted as #johdpapers and papers that were not tweeted.
With HashtagWithout HashtagDifference in Meanst-Statisticp-Value
downloadsdownloads−0.0071−0.22890.8204
viewsviews−0.1316−0.54230.5916
citationscitations−0.0009−0.66200.5131
Publisher’s Note: MDPI stays neutral with regard to jurisdictional claims in published maps and institutional affiliations.

