Article

Publishing Patterns in BRIC Countries: A Network Analysis

by
Miguel R. Guevara
1,2,* and
Marcelo Mendoza
2
1
Department of Informatics, Universidad de Playa Ancha, Valparaíso 2340000, Chile
2
Department of Informatics, Universidad Técnica Federico Santa María, Santiago 8940000, Chile
*
Author to whom correspondence should be addressed.
Publications 2016, 4(3), 20; https://doi.org/10.3390/publications4030020
Submission received: 25 April 2016 / Accepted: 12 July 2016 / Published: 15 July 2016

Abstract

:
How similar are the publishing patterns of among Brazil, Russia, India and China (BRIC countries) in comparison with other countries? This is a question that we addressed by using networks as a tool to analyze the structure of similarities and disparities between countries. We analyzed the number of publications from 2006 to 2015 that are reported by SCImago Journal and Country Rank. With this information, we created a network in order to find the closest countries to BRIC ones, and also to find communities of similar countries favoring data analysis. We found that Brazil, China and Russia are not that close to the core cluster of countries that are more diversified. In opposition, India is closer to a community of countries that are more diverse in terms of publishing patterns. Furthermore, we found that, for different network topologies, Brazil acts as a bridge to connect developing countries and that Russia practices patterns that tend to isolate it from most of the countries.

1. Introduction

Brazil, Russia, India and China, the BRIC countries, represent growing economies in different regions of the planet [1]. These countries tend to lead their regions because of their characteristics of high levels of population density and growing-emerging economies. BRIC countries have improved their higher educational systems (see for example [2]) and are improving national policies to compete in the research arena.
It is possible to analyze how good countries are in creating new knowledge by analyzing their research output [3,4,5,6]. Usually these studies cover the impact of countries in terms of numbers and indicators of publications and citations. Our approach was quite different. We placed at the center of our analysis the patterns of publishing and used them to create a network of similarities between countries.
We also made the distinction between production (number of papers published) and performance or success (i.e., number of citations acquired). Although, both aspects are related to research activity, they are expressions of different capacities and can be analyzed separately. In this article, we are interested in patterns of production and not in patterns of performance, mainly because production shows how capable countries are (including the institutions and the people working there) to create new knowledge in different areas of science. On the other hand, success or performance is aimed at studying how that knowledge is used in the scientific community (see for example [6]).
In this article, we characterize the publishing patterns of countries to create a network of similarities that allows us to visualize and understand how similar/dissimilar the countries are. In particular, we analyze where the BRIC countries are located in this landscape, and we also find the closest countries to each BRIC country.
Network visualizations have been demonstrated as powerful tools to analyze complex phenomena [7], and their application to the analysis of research in general has been increasing during the last decade even though it has been used for almost half a century (see for example a pioneer co-citation network analysis by Henry Small [8]). Related to the development of research activity, networks have been applied to analyze: citation patterns [9,10,11], co-authorship/collaboration [12,13], and research policy [14]. Within these types of network-based analyses, those oriented toward understanding countries have focused on the analysis of patterns of collaboration, mainly as projection of co-authorship networks, as for example [15,16,17].
Regarding the specific analysis of research production in BRIC countries, a few studies have been proposed. Kumar and Asheulova analyzed the research output of BRIC countries by applying statistical methods to the data in Scopus [18]. Yang et al. [19] analyzed the structure of disciplines in BRIC countries, comparing them to the ones included in the G7. The latter study used information from the database of the Science Citation Index of Web of Science (WoS). The authors assigned each paper to the country of the correspondence author; in other words, one paper to one country. The disciplines were the ones defined by the Journal Citation Reports (JCR) from Thomson Reuters. The authors concluded that BRIC countries are mainly focused on physics, chemistry, mathematics and some areas of engineering. Our study differentiates from the previous one, first in the data (we used SCImago), and also in the classification and the method used to find similarities between countries.
The rest of this article is organized as follows: in Section 2, we detail the data and methods used; in Section 3, we present our core results; finally, in Section 4 we discuss and conclude our findings.

2. Data and Methods

To analyze the publishing patterns of countries, we gathered information from SCImago [20]. This site is based on the Scopus database and presents information of the number of citable documents per country in each category. Categories are defined according to the Scopus classification of science. This classification includes 27 main areas divided into 308 subcategories. We chose SCImago for three main reasons: first, it includes all the spectrum of research (Sciences, Social Sciences and Arts-Humanities) in contrast with other dedicated databases such as PubMed or DBLP; second, SCImago is public, that is to say, users do not need to pay for a subscription to access the site—and the data, which is a particularly interesting situation for institutions and people (certainly in BRIC countries) that would like to replicate, validate, or contrast our results; finally, SCImago includes a wide number of journals, in contrast with Web of Science®, which is limited in quantity of journals but also biased in language, since most of the journals indexed are written in English (see for example [21] for a discussion on this bias). We claim that a better signal of the production in science of BRIC countries (most of them non-Anglophone) is represented by the information published on SCImago rather than, for instance, Web of Science®.
In SCImago, each journal may be assigned to one or more categories of science. In addition, each paper is assigned—completely—to the countries that correspond to the affiliations of the authors. This assignation increases the number of authorships for each country. We will refer to this number as value of authorships. We queried information for all available countries from 2006 to 2015. Accordingly, our resulting dataset comprises 224 countries, 10 years, and 308 categories. Even though SCImago incudes information since 1996, we chose this time interval because China, one of the BRIC countries, experienced a surge in research activity starting 2006 [22,23]. Furthermore, as we wanted the freshest information available, we carried out research up until the year 2015. The information was analyzed during the first week of June 2016.
To handle the data, we created a matrix A of countries and categories. We aggregated the data in the whole interval using the average over the ten years. Then, each entry Aij of the matrix A contains the average of values of authorships of a given country i in the category of science j in the interval 2006–2015.
Figure 1a presents a visualization of this matrix and Figure 1b shows the share or relative production of each category inside the country. For visualization purposes, matrices in Figure 1a,b are transposed and they show only the top 30 countries ranked (from left to right) by the values of authorships and the top 50 categories. It must be noted that both China and India are ranked in the top 10 countries, while Brazil and Russia are ranked in the top 15; this fact shows that all the BRIC countries are important contributors in the global scene of science.
In order to identify the publishing patterns of countries, we needed to find the relative importance (abundance) of each category of science within each country. We characterized the pattern of a country as a vector V in which its features correspond to the “share” of each category in that country. These values are comprised in a “share” matrix denoted by S (see Figure 1b) where each entry Sij of S is computed using the following Equation:
S i j = A i j j A i j
Each vector V i ´ that characterizes the publishing patterns of country i, corresponds to a row in S. Then, we used these vectors to find similarities among countries and centrality measures for each BRIC country. Figure 1b presents a visualization of these vectors for the top 30 countries and for the top 50 categories. We can also note the differences between matrices in Figure 1a,b, where the latter shows fewer differences among countries, and the former shows publishing patterns (behavior in publishing) for each country.
We computed the similarity using the cosine similarity function. Cosine similarity c c between countries c and c’ is calculated as follows:
c c = V c · V c | V c | | V c |
where the numerator computes the dot product or scalar product between vectors of countries and the denominator computes the product of norms. The resulting similarity matrix is symmetric.
To visualize the similarities between countries, we also created a network (see Figure 2) that allows us to have the “big picture” about the landscape of countries if clustered by similarities in publishing patterns. To detect communities we applied the algorithm Infomap [24], which is an algorithm that uses random walks to generate sequences of jumps from one node to another, and then it applies Huffman codes to detect patterns of jumps that are repeated most frequently, which are finally defined as communities. The algorithm of Huffman, also known as Huffman Coding, optimizes the number of digits needed to code (name) each node by assigning more digits to less frequent nodes. Even though other algorithms that can detect communities in a network were available, we preferred the Infomap algorithm because it is considered one of the most powerful methods, and it is not limited to particular networks as in the case of the Generalized Louvine method [25], another widely used algorithm, but oriented toward large networks.
For visualization purposes, we filtered links of the network below a threshold (0.895) to maintain only the strongest links. It must be noted that the community structure (and the visualization) are highly dependent on this parameter. A low value (more links) will produce a tiny structure of communities (1 or 2), while a high value (fewer links) will produce more clear communities but a lot of connected components and isolated nodes. As a consequence, we looked for this threshold with the criteria of searching a value—with three decimal digits—small enough to get each BRIC country in a different community, since we want to highlight the similarities and differences among these four countries.

3. Results

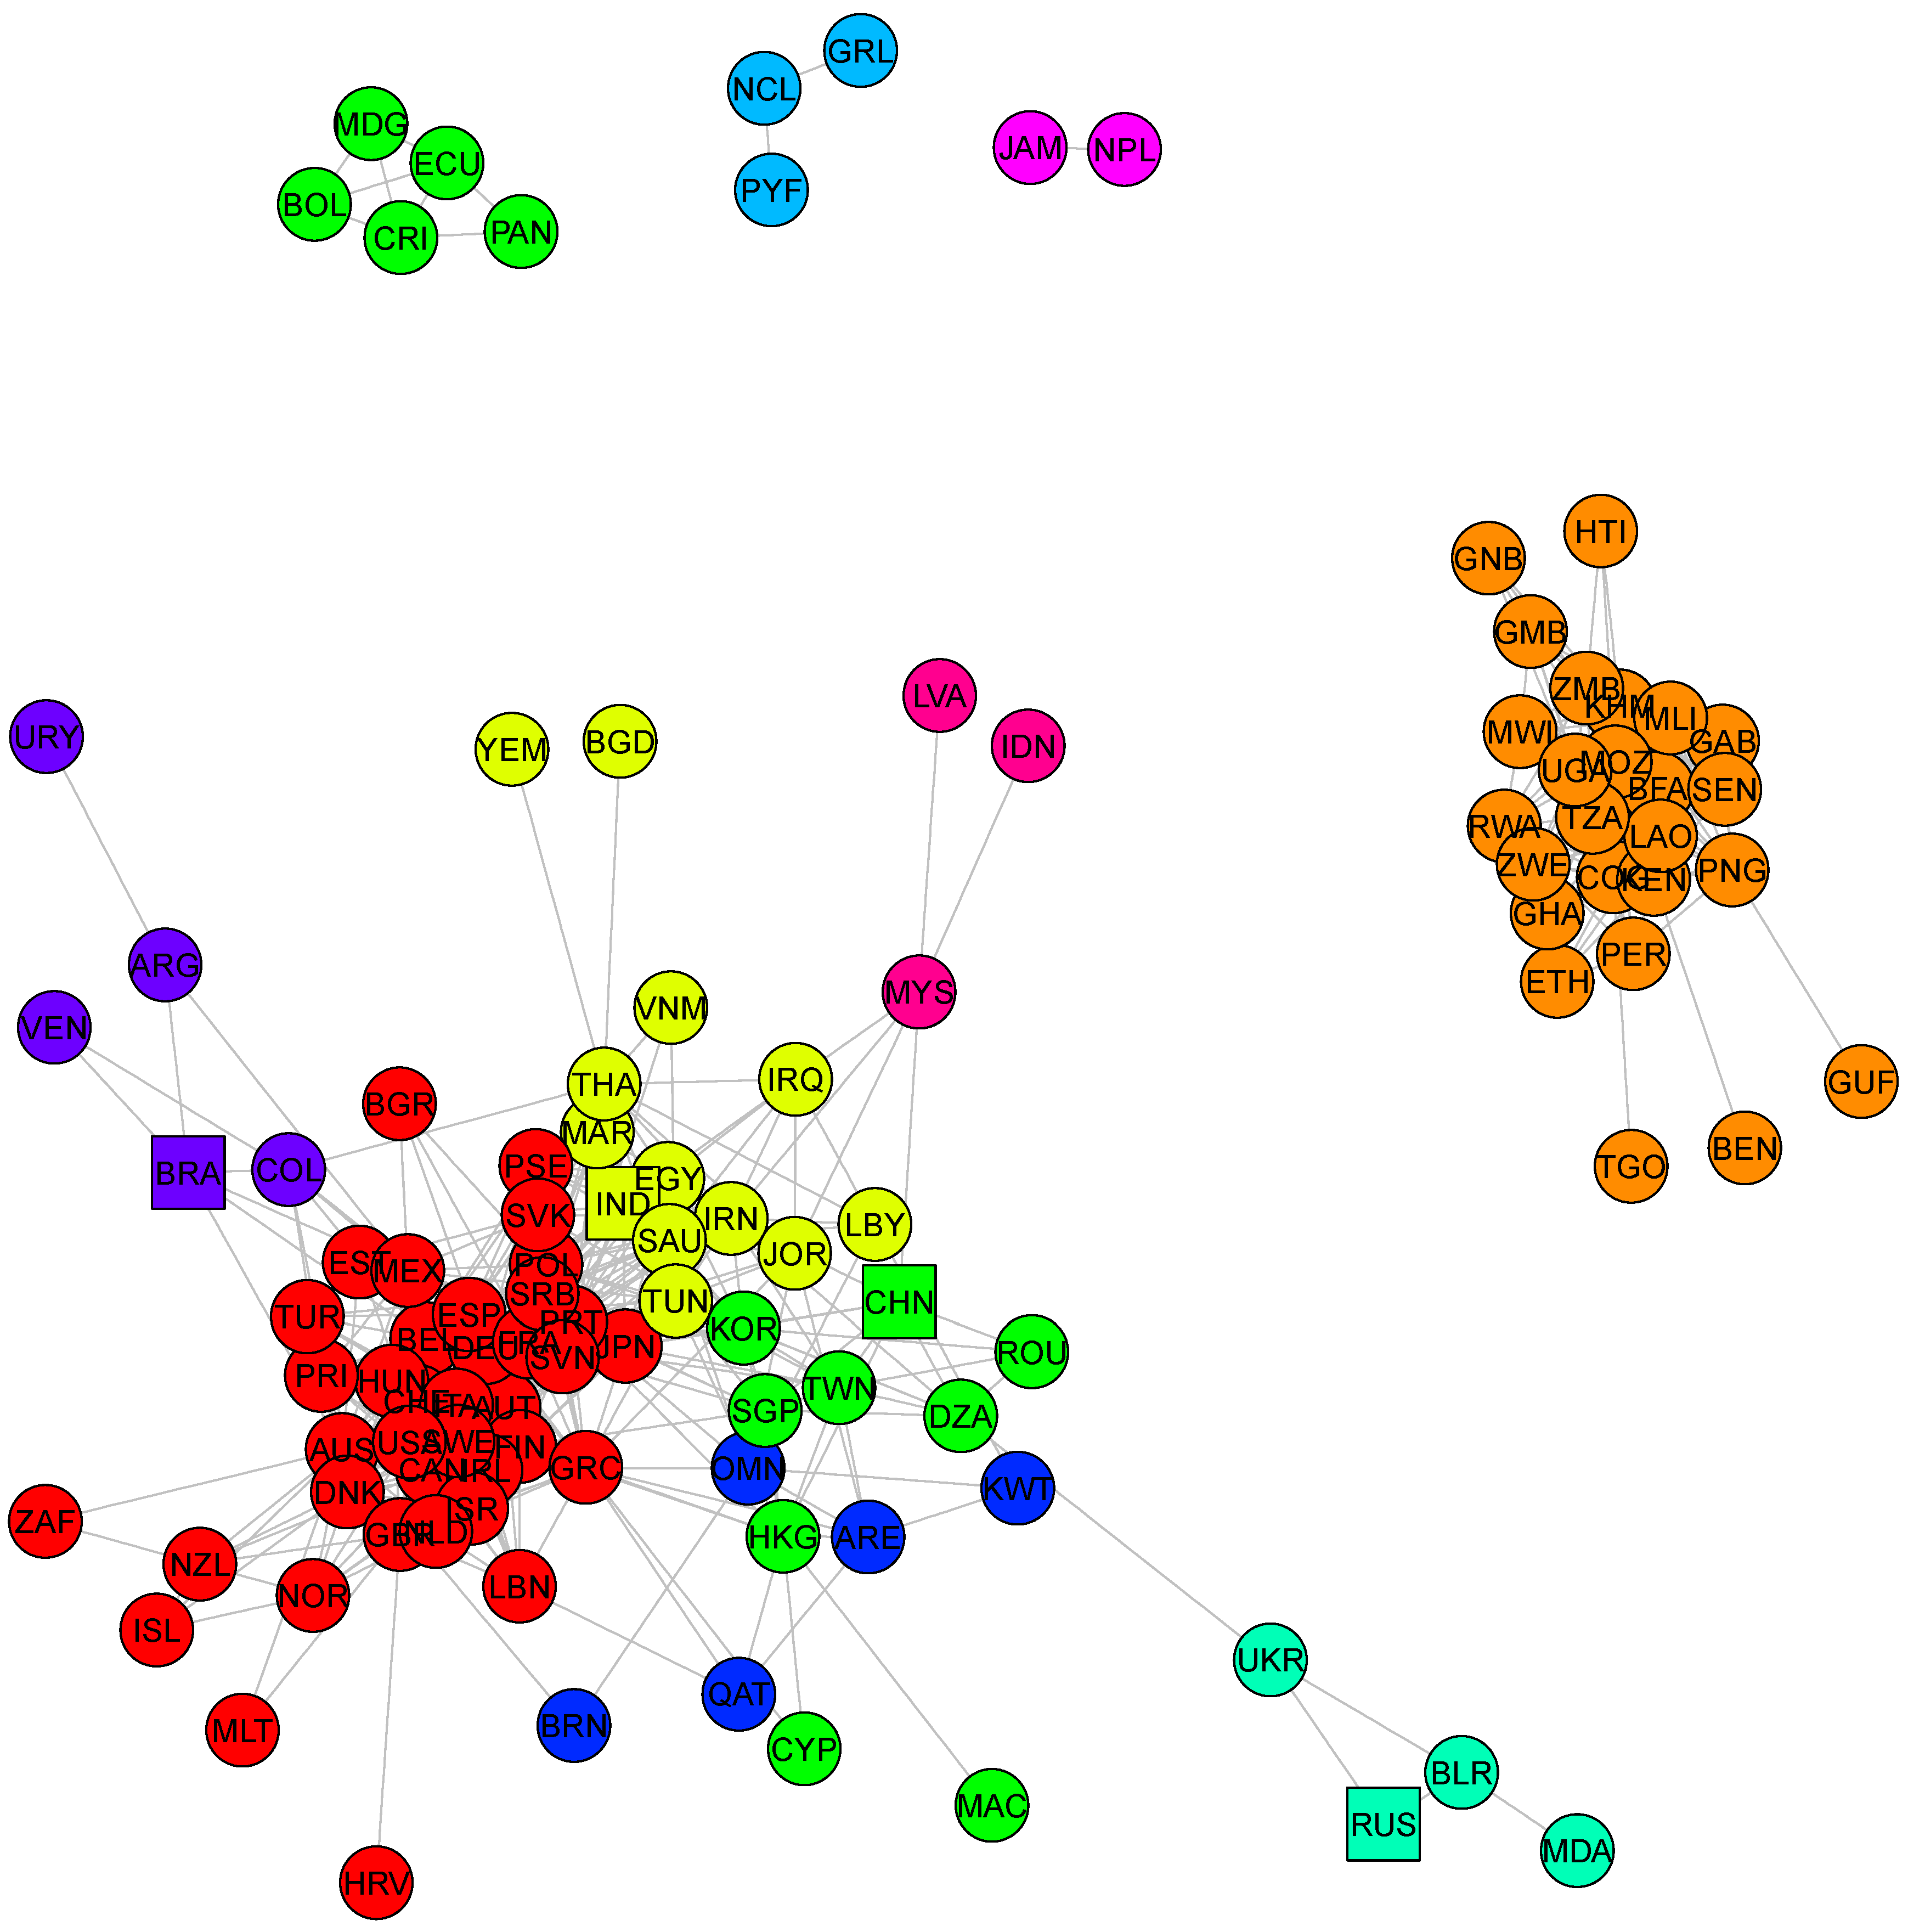
3.1. Communities in the Network of Countries are Close to Represent Regions

By analyzing Figure 2 and the table in Appendix A, we observe that communities detected by the algorithm Infomap [24] correlate with regions and/or level of development. For example, the central and highly connected cluster (red community) is composed mainly of developed countries such as United States, Germany, France, or Japan. On the contrary, we find isolated clusters of developing countries like the African countries (orange community) or some Latin American countries such as Ecuador and Bolivia (light green community).
The biggest connected component of the network includes six additional communities beside the red one. We note that in the biggest connected component the red community plays a central role, while, for instance, communities colored aqua, violet, and tomato are in the periphery. BRIC countries—all of them—belong to different communities (as anticipated) and they are part of the biggest connected component.

3.2. India Is the Most Connected Country of BRIC Countries

While India belongs to a community with a high level of connection to the central community, Brazil and China, on the other hand, are located in communities with few strong links with other communities. Furthermore, Russia is not well linked in a community, having poor levels of connection and being far from the central community.
We can argue these statements by looking at the centrality measures (Table 1) for each BRIC country in the network. Here, India (rank 36) is the most connected country if measured by the weighted degree as proxy of connectivity. Also in this rank, China, Brazil, and Russia are in positions 59, 73, and 90 respectively. Countries of the red community (the most connected) are in the top of this list.

3.3. Brazil Connects Communities

If we analyze the network of the strongest similarities in Figure 2, we can find that Brazil connects its community to other communities. Brazil connects its community (violet) mainly with the red community. The case of China and India is quite different, since the countries of the latter (yellow community, which is composed mainly of Middle Eastern countries such as Saudi Arabia or Iran) do not depend on India to connect with other communities. This is verified by the ranking and values of betweenness centrality in Table 1. While Brazil has a high value (rank 19), China and India occupy positions 36 and 67, respectively. Finally, in this topology, Russia is not needed for any country to connect with others.
It must be noted that the previous analysis was performed on the visualization and network topology presented in Figure 2. Observations can be different if the threshold to delete weak links changes. For this reason, in further sections we also present a quantitative analysis on the fully connected matrix and other threshold values, and we will show how these measures can be different (see Section 3.5 and Section 3.6).

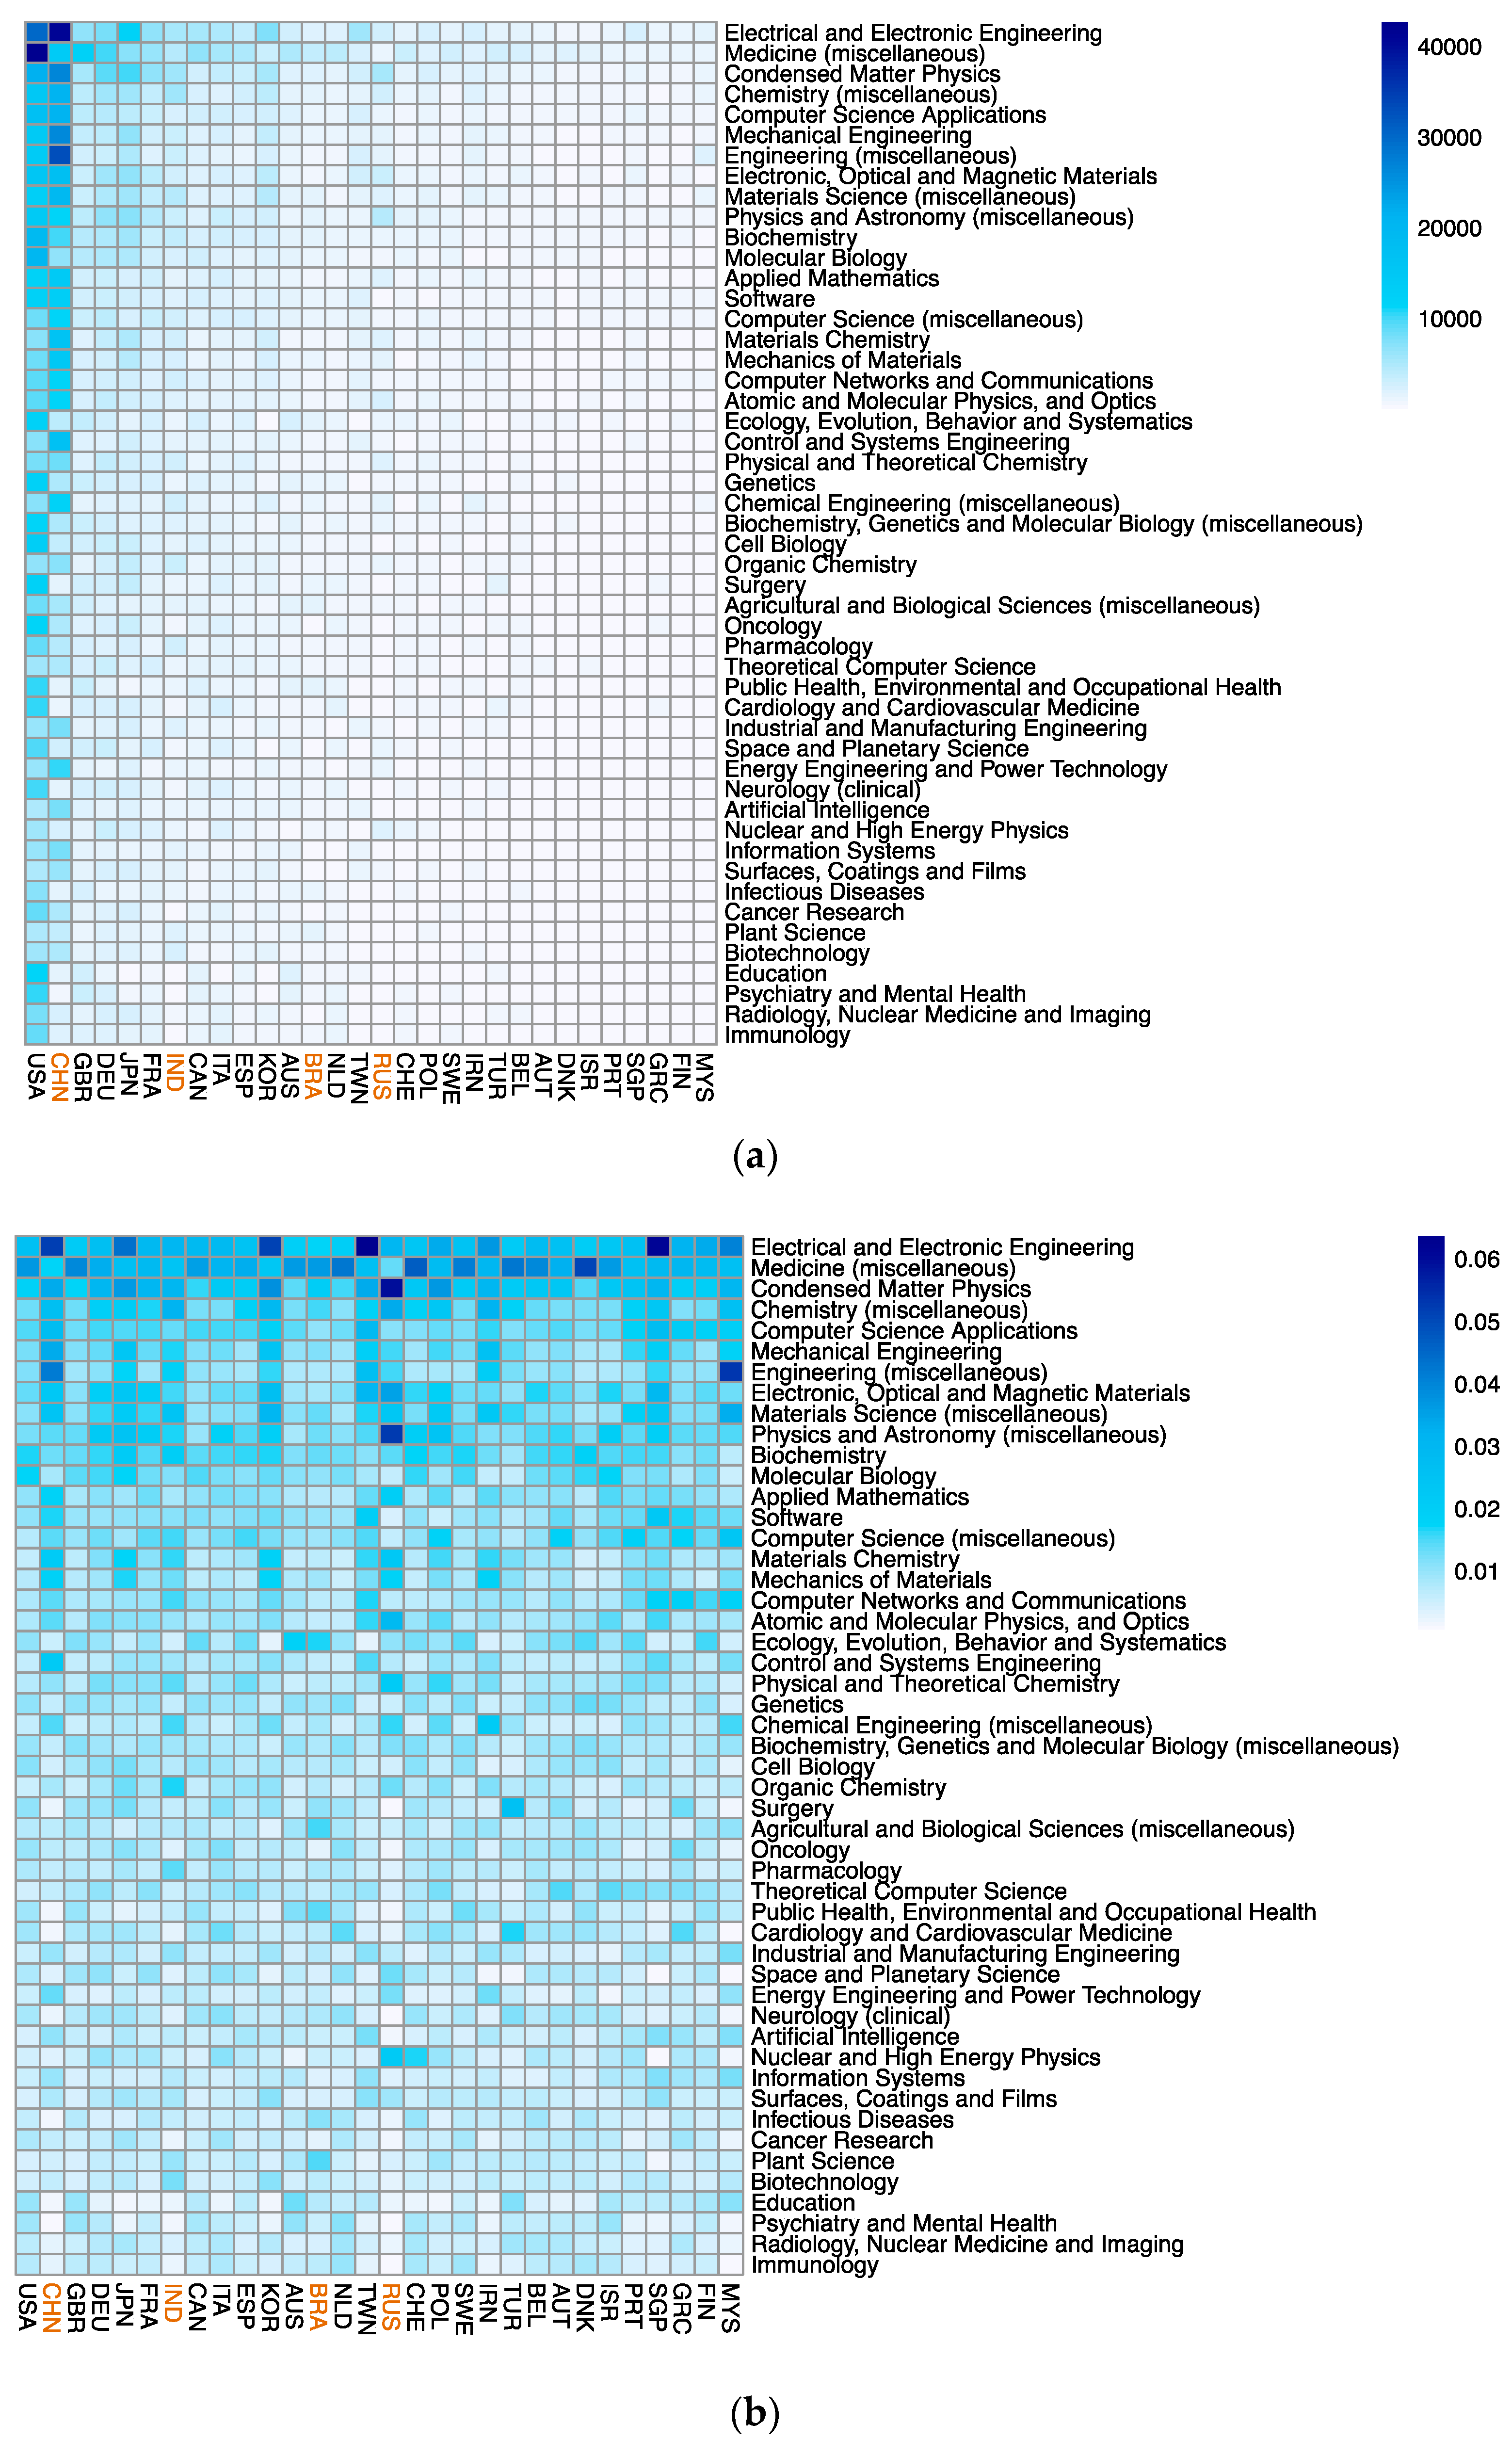
3.4. Dominant Areas Per Community

We also analyzed the other way around, that is, what the production is like in particular fields of science inside each community. We do this by averaging the countries’ production in each field, for all the countries inside each community. Table 2 resumes the dominant scientific fields for the communities that host a BRIC country. By doing this, we can analyze which are the areas that generate these (dis)similarities. A detailed version of this table is available in Appendix B, which includes the mean values and all the results for each community.
We can observe how India and China’s communities are more oriented toward technological areas, such as electronic and mechanical engineering, while Russia’s community is mainly focused on physics-oriented fields. On the other hand, in Brazil’s community, countries participate mainly (at least five of ten categories) in agricultural or animal sciences.
By looking deeply, we can also observe that the resulting patterns are not only due to the areas in which countries publish, but also to the number of papers produced in each field. This can be noted by analyzing the detailed information included in Appendix B, where we might see, for instance, that the community of leading countries has values above 1200 papers on average in each top-ranked area while developing communities publish below 100 papers on average in top-ranked areas.

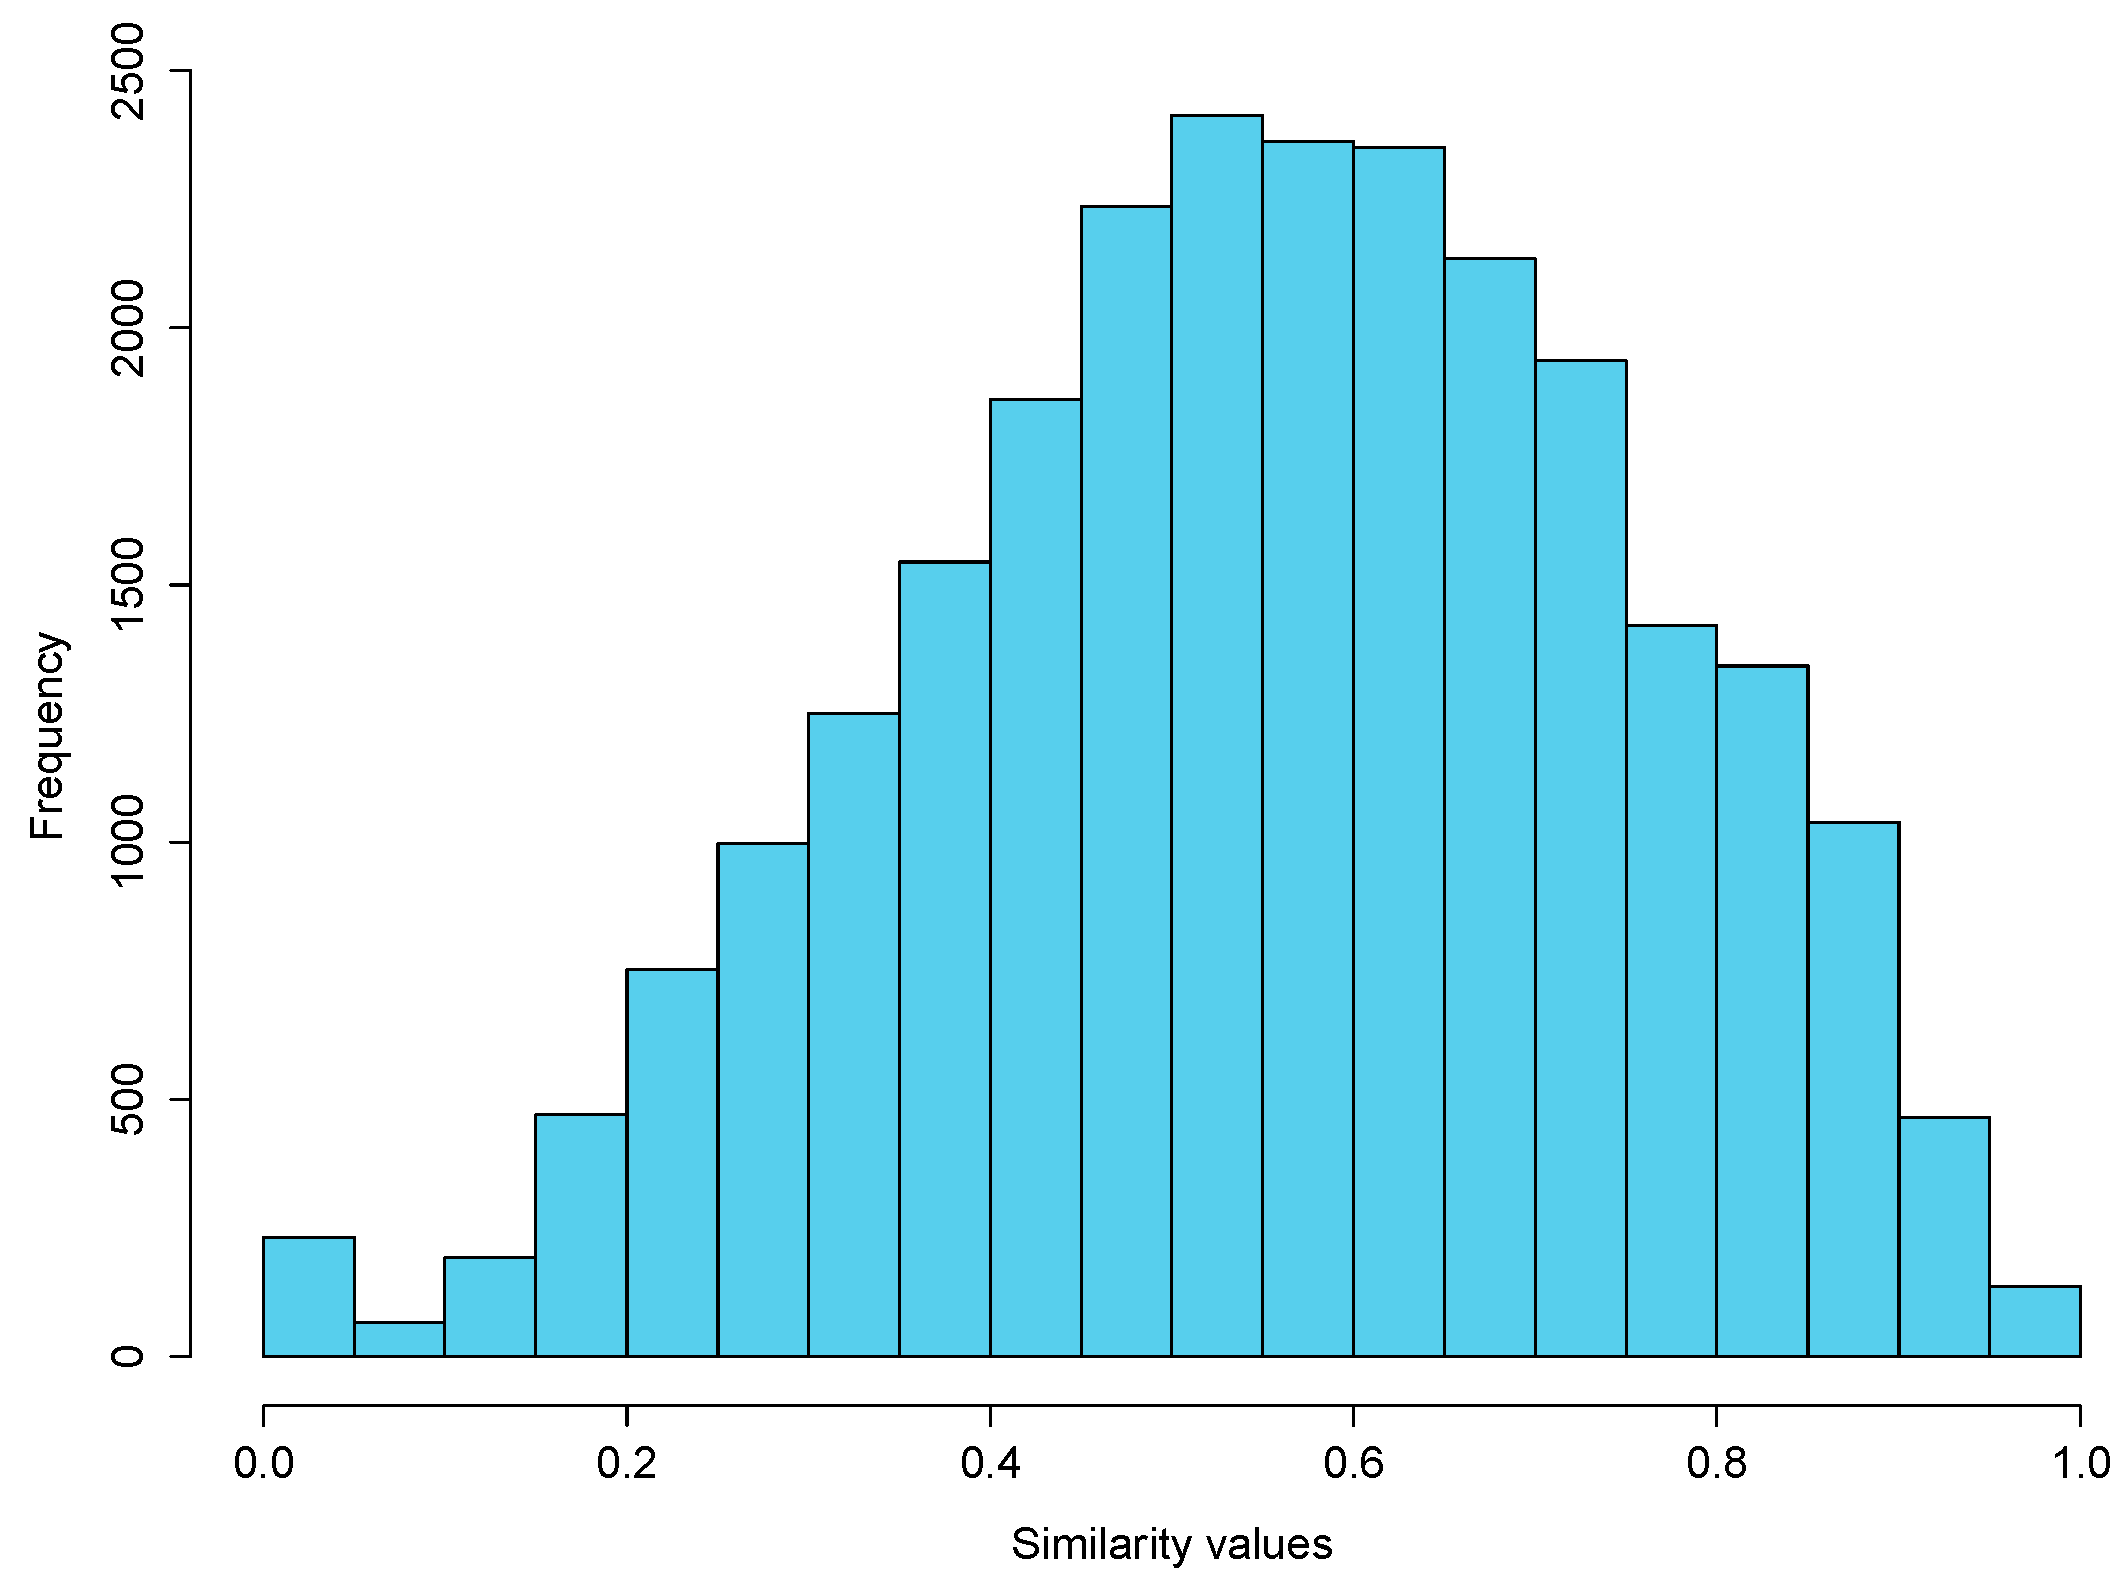
3.5. Analysis of Similar Countries to BRIC Countries

By looking at the (fully connected) similarity matrix , we can find which countries are more similar to BRIC countries. In Table 3 we show the top 10 similar countries for each BRIC country. If we only analyze links greater than 0.9, we might note that China maintains strong similarities mainly with Asian countries. In the case of Russia, it only has strong similarities with two former countries of the Soviet Union. The case of Brazil is quite similar to the case of Russia, since Brazil only has strong similarities with four Latin American countries.
On the other hand, India is quite different. India has strong similarities with the countries in the top 10 ranking. Those countries are mainly European and three of them are part of the G7. When we extend this analysis to the full top 10 list, we note that again China has similarities mainly with Asian countries like South Korea, Singapore, or Japan. Something similar occurs in the case of Brazil, where we may note that 5 of the 10 most similar countries are Latin American countries. In the case of Russia, 9 of the 10 countries are from Europe and at least three of them are former Soviet Union countries. Russia is a special case in which the similarities with other countries tend to be low. Finally, we can also observe that among BRIC countries, only India is in the top 10 list of China and there are no other strong similarities between BRIC countries.

3.6. Centrality Measures for BRIC Countries

As we mentioned previously, the selection of a threshold to delete weak links produces different results in the topology of the network. In our previous analysis we chose this value with the intention of producing a meaningful community structure to analyze BRIC countries based on strong links. However, it is necessary to provide more information about the variations of the network for different threshold values. In the current section, the threshold will not be oriented toward the community structure but toward the distribution of similarities. We also wanted to analyze how the characteristics of BRIC countries (as nodes of the network) change with these variations.
In order to define different values for the threshold, we looked at the distribution of similarities of the fully connected network (see Figure 3) and then we computed the deciles of the distribution. We used these 9 values (excluding the minimum and the maximum) to create 9 different networks and to analyze the values of: degree centrality (weighted degree), betweenness centrality, and closeness centrality for each node, in particular for each BRIC country.
Table 4 resumes the rank occupied for each BRIC country (see a detailed table in Appendix C) for 10 different variations in the threshold, 9 values from the deciles of the distribution of similarities, and 1 additional value corresponding to the filter used to create the community structure in Figure 2.
Regarding centrality proxied by degree, the low level of centrality (position in ranking, see first block in Table 4) is constant for Russia, which occupies the last position of the four BRIC countries along the 10 variations of the threshold. The case of Brazil is interesting, as it is a central country until the eighth value (D8) after which its ranking starts decreasing. This can be explained in the sense that strong connectivity of Brazil is certainly produced with countries that have weak connections, and these countries tend to disappear from the network once the threshold is high as in the ninth and tenth values. In these two final networks, India and China increase their position.
Subsequently, we analyzed intermediation by looking at betweenness centrality (see second block in Table 4); that is, the number of shortest paths—between all countries—that pass for a chosen country. In the case of Brazil, it is clear that its role as an intermediate country is greater than other BRIC countries, since it leads the ranking starting at the fourth threshold. Furthermore, starting at the seventh value, Brazil occupies high positions in the global ranking, such as 31, 25, 19, or 5. We cannot extend this observation to other BRIC countries since their values of betweenness centrality are highly sensitive to the variations of the filter.
Finally, if we measure how close each BRIC country is from all the other countries in the network (closeness centrality. See third block in Table 4), we find in the case of Russia that except for 2 of the 10 filters, it is always in last position of the ranking of BRIC countries. Furthermore, Russia is far from the global network of countries since it usually (except for 1 filter) occupies positions below the 110th position.

4. Discussion

In a first observation, we have found that Brazil, Russia, and China tend to be similar to those countries that share the same language or belong to the same region. This is not the case with India, which is a country with closer similarities to countries that are more diverse in their publishing patterns; most of these countries are developed countries.
We claim that our findings can be explained by international collaboration and/or particular interests/capacities of each country. In the first case, international collaboration is usually a consequence (a measure) of co-authorship between authors from different countries, for example in the SCImago database. For instance, it is more likely that Brazilian scientists collaborate with Argentinian or Mexican scholars, and they certainly share similar research interests and, consequentially, publishing patterns. On the other hand, if co-authorship (collaboration) is not the cause that produces similarities between countries, those similarities could be due to interests or capacities of countries in publishing in the same areas of science with similar levels of production, as we presented in Section 3.4. This analysis (the causes of similarities between countries), however, would demand further discussion—outside the scope of this study—which should include the control of the effect of co-authorship on the analysis of the interests or publishing capacities of countries.
Our results also show that even when China and Russia are top-ranked contributors of scientific literature, those countries (and their communities) are still not able to maintain high similarities with countries in the central cluster. Conversely, India is well connected to this central cluster just like other countries of the same community from the Eastern world. This could be explained by the diversification across science of countries in the central cluster. These countries tend to diversify to most of the areas of science, while China and especially Russia seem to be more specialized in categories related to physics and astronomy (see Figure 1 and Appendix B). See [26] for an analysis of how countries diversify over a network of categories of science.
In the same line, we have shown that Russia is the most isolated country of the four BRIC countries, this claim is persistent not only for the network that we created with the aim of detecting communities, but for different topologies of the network (see degree and closeness centrality in Table 4).
Finally, we have also shown that Brazil is an important bridge between the world and countries in Brazil’s community, which are mainly developing countries. This condition is also stable for different topologies of the network. However, this is not the case for China, which is an important bridge but only when high values of the threshold are selected to create the network of similarities.

Supplementary Materials

The following resources are available online at https://www.mdpi.com/2304-6775/4/3/20/s1, Figure S1: Network of Countries in High Resolution.

Acknowledgments

Scientific initiation fellowship (PIIC) from Universidad Técnica Federico Santa Maria. Project ING01-1516 from Universidad de Playa Ancha.

Author Contributions

M.G. and M.M. conceived and designed the experiments; performed the experiments; analyzed the data and wrote the paper.

Conflicts of Interest

The authors declare no conflict of interest.

Appendix A. Assignment of Countries to Communities

Community 1: Red
Austria, Australia, Belgium, Bulgaria, Canada, Switzerland, Germany, Denmark, Estonia, Spain, Finland, France, United Kingdom, Greece, Croatia, Hungary, Ireland, Israel, Iceland, Italy, Japan, Lebanon, Malta, Mexico, Netherlands, Norway, New Zealand, Poland, Puerto Rico, State of Palestine, Portugal, Serbia, Sweden, Slovenia, Slovakia, Turkey, USA, South Africa
Community 2: Orange
Burkina Faso, Benin, Congo, Fmr Ethiopia|Ethiopia, Gabon, French Guiana, Ghana, Gambia, Guinea-Bissau, Haiti, Kenya, Cambodia, Lao People's Dem. Rep. Mali, Malawi, Mozambique, Peru, Papua New Guinea, Rwanda, Senegal, Togo, United Rep. of Tanzania, Uganda, Zambia, Zimbabwe
Community 3: Yellow
Bangladesh, Egypt, India, Iraq, Iran, Jordan, Libya, Morocco, Saudi Arabia, Thailand, Tunisia, Viet Nam, Yemen
Community 4: Green light
China, Cyprus, Algeria, China, Hong Kong SAR, Rep. of Korea, China, Macao SAR, Romania, Singapore, Taiwan
Community 5: Green
Bolivia, Costa Rica, Ecuador, Madagascar, Panama
Community 6: Aqua
Belarus, Rep. of Moldova, Russia, Ukraine
Community 7: Sky blue
Greenland, New Caledonia, French Polynesia
Community 8: Blue
United Arab Emirates, Brunei Darussalam, Kuwait, Oman, Qatar
Community 9: Violet
Argentina, Brazil, Colombia, Uruguay, Venezuela
Community 10: Fuchsia
Jamaica, Nepal
Community 11: Tomato
Indonesia, Latvia, Malaysia

Appendix B. Top 10 Scientific Areas per Community (Average Over Countries)

Publications 04 00020 i001

Appendix C. Centrality Values for Variations in the Threshold Applied

Nine different values (D1,…D9) were used as thresholds to filter links in the similarity network before computing centrality measures. These thresholds were selected according to the values of deciles of the distribution of similarities. A final threshold (0.895) is also presented, which corresponds to the one used in Figure 2 and Table 1. R = Ranking, C = Country.
Publications 04 00020 i002

References

  1. Leonova, T.; Eigel, M.; Nataliya, M. Bric countries: Chalanges of decade. In Proceedings of the 2007 International Conference on Management Science and Engineering, Harbin, China, 20–22 August 2007; pp. 1197–1200.
  2. Carnoy, M.; Loyalka, P.; Dobryakova, M.; Dossani, R.; Froumin, I.; Kuhns, K.; Tilak, J.; Wang, R. University Expansion in a Changing Global Economy: Triumph of the BRICs? Stanford University Press: Stanford, CA, USA, 2013. [Google Scholar]
  3. Abramo, G.; D’Angelo, C.A. Assessing national strengths and weaknesses in research fields. J. Informetr. 2014, 8, 766–775. [Google Scholar] [CrossRef]
  4. Harzing, A.-W.; Giroud, A. The competitive advantage of nations: An application to academia. J. Informetr. 2014, 8, 29–42. [Google Scholar] [CrossRef]
  5. King, D.A. The scientific impact of nations. Nature 2004, 430, 311–316. [Google Scholar] [CrossRef] [PubMed]
  6. Smith, M.J.; Weinberger, C.; Bruna, E.M.; Allesina, S. The scientific impact of nations: Journal placement and citation performance. PLoS ONE 2014, 9, e109195. [Google Scholar] [CrossRef] [PubMed]
  7. Barabási, A.-L. Network Science; Cambridge University Press: Cambridge, UK, 2016. [Google Scholar]
  8. Small, H. Co-citation in the scientific literature: A new measure of the relationship between two documents. J. Am. Soc. Inf. Sci. 1973, 24, 265–269. [Google Scholar] [CrossRef]
  9. Börner, K.; Klavans, R.; Patek, M.; Zoss, A.M.; Biberstine, J.R.; Light, R.P.; Larivière, V.; Boyack, K.W. Design and Update of a Classification System: The UCSD Map of Science. PLoS ONE 2012, 7, e39464. [Google Scholar] [CrossRef] [PubMed]
  10. Šubelj, L.; Fiala, D.; Bajec, M. Network-based statistical comparison of citation topology of bibliographic databases. Sci. Rep. 2014, 4, 6496. [Google Scholar] [CrossRef] [PubMed]
  11. Van Eck, N.J.; Waltman, L. CitNetExplorer: A new software tool for analyzing and visualizing citation networks. J. Informetr. 2014, 8, 802–823. [Google Scholar] [CrossRef]
  12. Adams, J. Collaborations: The rise of research networks. Nature 2012, 490, 335–336. [Google Scholar] [CrossRef] [PubMed]
  13. Newman, M.E.J. Who is the best connected scientist? A study of scientific coauthorship networks. In Complex Networks; Ben-Naim, E., Frauenfelder, H., Toroczkai, Z., Eds.; Springer Berlin Heidelberg: Berlin, Germany, 2004; pp. 337–370. [Google Scholar]
  14. Rafols, I.; Porter, A.L.; Leydesdorff, L. Science overlay maps: A new tool for research policy and library management. J. Am. Soc. Inf. Sci. Technol. 2012, 61, 1871–1887. [Google Scholar] [CrossRef]
  15. Networks and Nations: Global Scientific Collaboration in the 21st Century; The Royal Society: London, UK, 2011.
  16. Luukkonen, T.; Persson, O.; Sivertsen, G. Understanding patterns of international scientific collaboration. Sci. Technol. Hum. Values 1992, 17, 101–126. [Google Scholar] [CrossRef]
  17. Frame, J.D.; Carpenter, M.P. International research collaboration. Soc. Stud. Sci. 1979, 9, 481–497. [Google Scholar] [CrossRef]
  18. Kumar, N.; Asheulova, N. Comparative analysis of scientific output of BRIC countries. Ann. Libr. Inf. Stud. 2011, 58, 228–236. [Google Scholar]
  19. Yang, L.Y.; Yue, T.; Ding, J.L.; Han, T. A comparison of disciplinary structure in science between the G7 and the BRIC countries by bibliometric methods. Scientometrics 2012, 93, 497–516. [Google Scholar] [CrossRef]
  20. Imago, S.C. Scimago Journal & Country Rank, 2007. Available online: http://www.scimagojr.com/ (accessed on 5 July 2013).
  21. EC3Metrics. A Las Puertas De Scielo (Web of Science). EC3Metrics. 6 May 2014. Available online: https://ec3metrics.com/las-puertas-de-scielo-web-science/ (accessed on 13 July 2016).
  22. Zhou, P. China Ranks Second in Scientific Publications Since 2006. 2008. Available online: https://lirias.kuleuven.be/handle/123456789/203653 (accessed on 10 July 2013).
  23. Zhou, P.; Glänzel, W. In-depth analysis on China’s international cooperation in science. Scientometrics 2010, 82, 597–612. [Google Scholar] [CrossRef]
  24. Rosvall, M.; Bergstrom, C.T. Maps of random walks on complex networks reveal community structure. Proc. Natl. Acad. Sci. USA 2008, 105, 1118–1123. [Google Scholar] [CrossRef] [PubMed]
  25. Meo, P.D.; Ferrara, E.; Fiumara, G.; Provetti, A. Generalized Louvain method for community detection in large networks. In Proceedings of the 2011 11th International Conference on Intelligent Systems Design and Applications (ISDA), Cordoba, Spain, 22–24 November 2011; pp. 88–93.
  26. Guevara, M.R.; Hartmann, D.; Aristarán, M.; Mendoza, M.; Hidalgo, C.A. The Research Space: Using the career paths of scholars to predict the evolution of the research output of individuals, institutions, and nations. 2016; arXiv:1602.08409. [Google Scholar]
Figure 1. Matrix heat map visualization for top 30 countries (from left to right). Countries are ranked—from left to right—by the average values of authorships in the time interval between 2006 and 2015. Rows represent categories of science and columns represent countries. (a) Matrix where each entry represents the average values of authorships; (b) Matrix where each entry represents the “share” of each category in each country.
Publications 04 00020 g001
Figure 2. Network visualization of similarities between 111 countries according to publishing patterns. Similarity was computed using cosine similarity function. Links below 0.895 were eliminated just like isolated countries. Colors were assigned according to communities automatically detected by the algorithm Infomap [24]. Nodes corresponding to BRIC countries are highlighted with squares. Country codes are defined according to the standard ISO 3166-1 alpha-3 codes. A list of communities and their corresponding countries has been included in Appendix A.
Publications 04 00020 g002
Figure 3. Histogram of values of similarities for the fully connected network.
Publications 04 00020 g003
Table 1. Ranking of centrality values for countries. Measures of centrality: Weighted degree (Deg.), betweenness centrality (Bet) and closeness centrality. After position 46 some countries are omitted in order to present all the values for BRIC countries. Total countries in the database: 111.
RCnt.Deg.Cnt.Bet.Cnt.ClosenessRCnt.Deg.Cnt.Bet.Cnt.Closeness
1FRA35.3831TUN309PRT0.00024773228TZA17.8817OMN42IND0.00024582
2PRT34.0925DZA289FRA0.00024760129ISR17.8782CAN39ISR0.000245793
3ESP32.7788AUS284ESP0.00024734430MOZ17.794EGY34NLD0.000245752
4BEL29.2233GRC255GRC0.00024703731UGA17.7334COL33TWN0.000245707
5DEU29.1146THA244DEU0.00024700732COG17.7022KOR31EGY0.000245692
6FIN27.9019MEX233SVN0.00024694233KEN17.6852KEN27JOR0.000245677
7AUS27.7945PRT221TUN0.00024689534KHM16.8457PNG27SVK0.000245662
8GRC26.687UKR219FIN0.00024688135KOR16.652COG25DNK0.000245624
9SVN25.6122FRA196BEL0.00024684336IND15.6788CHN25SGP0.000245547
10AUT25.4961IRN183AUT0.00024663537ZMB14.9879SAU22HKG0.000245535
11CAN25.4855MYS151POL0.00024662338THA14.5088UGA22PRI0.000245517
12SWE25.4594GBR136AUS0.0002465939BFA14.0277POL19PSE0.000245457
13USA24.514SVN128JPN0.00024655940LAO13.773SVK18MAR0.000245145
14ITA24.4791JOR112MEX0.00024655141PRI13.6925KHM17EST0.00024514
15GBR24.4533JPN107IRN0.0002465342MLI12.9829PRI17COL0.000245035
16POL24.0606HKG104CAN0.00024641843EGY12.8684DEU16OMN0.000244908
17MEX23.8172FIN95SRB0.00024638644PNG11.9105USA16LBN0.000244744
18JPN22.0594SRB86SWE0.0002463745SVK11.8762AUT15ARE0.000244704
19IRL21.6832BRA84USA0.00024631446SEN11.1559LBY15CHN0.000244541
20CHE21.6348ARG75ITA0.000246303
21HUN21.2888BLR75GBR0.00024616650LBN10.9595NLD9BRA0.000244176
22TUN20.9383TWN64SAU0.00024613959CHN8.3141SWE6NZL0.000243198
23IRN20.2583ARE62CHE0.0002461367COL7.2478IND3YEM0.000241946
24DNK19.6071DNK60IRL0.00024609273BRA5.4234MWI2LVA0.000239513
25NLD18.8552SGP57KOR0.00024602676CRI3.6705NCL1RUS0.000236782
26SAU18.4491ESP54HUN0.00024597890RUS1.858HRV0SEN0.00010228
27SRB18.1784BEL53THA0.000245965105BEN0.9042RUS0MDG8.34 × 10−5
Table 2. Ranking of top 10 ranked areas for each community. We considered the average value of production inside the community for each area. Details of values and data on the other communities are presented in Appendix B.
RCommunity 3: Yellow (Including India)Community 4: Light Green (Including China)
1Electrical and Electronic EngineeringElectrical and Electronic Engineering
2Chemistry (miscellaneous)Engineering (miscellaneous)
3Condensed Matter PhysicsCondensed Matter Physics
4Medicine (miscellaneous)Mechanical Engineering
5Materials Science (miscellaneous)Chemistry (miscellaneous)
6Engineering (miscellaneous)Computer Science Applications
7Mechanical EngineeringMaterials Science (miscellaneous)
8BiochemistryElectronic, Optical and Magnetic Materials
9Chemical Engineering (miscellaneous)Materials Chemistry
10Materials ChemistryMedicine (miscellaneous)
RCommunity 6: Aqua (Including Russia)Community 9: Violet (Including Brazil)
1Condensed Matter PhysicsMedicine (miscellaneous)
2Physics and Astronomy (miscellaneous)Animal Science and Zoology
3Electronic, Optical and Magnetic MaterialsCondensed Matter Physics
4Electrical and Electronic EngineeringEcology, Evolution, Behavior and Systematics
5Chemistry (miscellaneous)Agronomy and Crop Science
6Atomic and Molecular Physics, and OpticsElectrical and Electronic Engineering
7Materials Science (miscellaneous)Chemistry (miscellaneous)
8Materials ChemistryPlant Science
9Nuclear and High Energy PhysicsAgricultural and Biological Sciences (miscellaneous)
10Mechanics of MaterialsBiochemistry
Table 3. Top 10 similar countries for each BRIC country. Regions (Reg): North America (NA), Latin America (LA), Africa (AF), Asia (AS), Oceania (OC) and Europe (EU).
BrazilRussiaIndiaChina
RCountrySimRegCountrySimRegCountrySimRegCountrySimReg
1Colombia0.912LAUkraine0.933EUEgypt0.966AFTaiwan0.946AS
2Venezuela0.909LABelarus0.925EUIran0.953ASAlgeria0.936AF
3Mexico0.906LABulgaria0.891EUSaudi Arabia0.951ASIran0.935AS
4Argentina0.904LAPoland0.878EUSouth Korea0.931ASRep. of Korea0.935AS
5Australia0.897OCMoldova0.866EUPalestine0.930ASSingapore0.924AS
6Belgium0.896EUFrance0.854EUPoland0.926EUHong Kong0.915AS
7Spain0.895EURomania0.853EUPortugal0.923EUMalaysia0.911AS
8Puerto Rico0.891LAJapan0.849ASJapan0.923ASJapan0.910AS
9Denmark0.890EUGermany0.845EUIraq0.920ASRomania0.903EU
10Hungary0.890EUSlovakia0.844EUSlovenia0.919EUIndia0.893AS
Table 4. Ranking of BRIC countries for centrality measures for ten different thresholds used to filter weak links. Nine filters correspond to deciles of the distribution of similarities. The last column (Fi) includes the filter used to create the network in Figure 2. See Appendix C for detailed values.
D1 = 0.292D2 = 0.386D3 = 0.454D4 = 0.511D5 = 0.562D6 = 0.616D7 = 0.672D8 = 0.732D9 = 0.817Fi = 0.895
Weighted Degree or Degree Centrality
9BR7BR7BR6BR4BR7BR5BR19BR30IN36IN
104IN111IN113IN110IN103IN82IN59IN42IN34BR59CH
170CH172CH166CH161CH139CH129CH96CH72CH60CH73BR
189RU184RU178RU172RU161RU144RU135RU111RU103RU90RU
Betweenness Centrality
33RU122CH118IN145BR66BR78BR25BR31BR5BR19BR
56CH143IN155BR185CH140CH147CH128CH79RU9RU36CH
140IN163RU199RU188IN189RU159RU139RU86IN40CH67IN
173BR202BR208CH197RU200IN191IN147IN117CH106IN105RU
Closeness Centrality
85IN171IN126BR61BR20BR18BR5BR9BR2BR28IN
114CH197BR181IN166IN142IN126IN76IN66IN50IN46CH
129RU209CH200CH193RU170CH162RU137CH122CH72CH50BR
209BR210RU201RU203CH177RU165CH153RU142RU112RU76RU

