1. Introduction
Recently, programs for increasing the global competitiveness of universities funded by national and local governments have been launched almost all over the world. In Russia, the project called 5-100 [
1] was launched in 2013. At present, 21 leading Russian universities are participating in the project; Peoples’ Friendship University of Russia (PFUR, “RUDN” in Russian) is among them. The main goal of the Project is to have five Russian universities enter the TOP-100 of global university rankings. QS World University Rankings (QS) [
2] and Times Higher Education World University Rankings (THE) [
3] are among the most popular ranking systems. Both rankings use a normalized citation indicator for the calculation. Without going deeper into the calculation methodology, suffice it to say that they differ significantly. The issues regarding normalizing citations for subject areas are discussed in the article by Waltman and van Eck [
4] and Waltman [
5]. For this study, it was necessary to select the metrics to be used for analysis within the framework of university research management. Accordingly, the author limited the metrics to those available in widely distributed analytical packages that did not require large additional computations. Thus, the choice fell on Field-Weighted Citation Impact (FWCI) and Source Normalized Impact per Paper (SNIP), which are available in SciVal from Elsevier.
Source Normalized Impact per Paper (SNIP) was introduced by Professor Henk Moed [
6] at the Centre for Science and Technology Studies (CTWS), University of Leiden. After receiving a dose of criticism, Professor Moed revised the indicator [
7]. It measured the impact of scientific publications through contextual citation weighting based on the total number of citations in the subject field using Scopus data. In other words, as stated by the CTWS, “SNIP corrects for differences in citation practices between scientific fields, thereby allowing for more accurate between-field comparisons of citation impact” [
8]. SNIP is calculated by dividing the number of citations per paper in the journal by the citation potential in the subject field. The study [
9] confirmed that from various journal metrics, SNIP has the greatest correlation with expert ratings (for example, Excellence in Research for Australia (ERA) [
10]), possibly due to its normalized nature.
Field-Weighted Citation Impact (FWCI) is the ratio between the actual number of citations received by a publication set and the average number of citations received by all other similar publications. The latter is referred to as the expected number of citations. Similar publications refer to the same discipline of the same type and the same age. FWCI is a Snowball Metric [
11]. FWCI is measured by dividing the number of citations received by the publication by the average number of citations to publications in the database published in the same year of the same type and within the same subject category. When several publications are considered, the ratio between the actual and average citations for each publication is first calculated. FWCI is calculated then as a mean value. Publications can also be assigned to more than one subject category.
The use of quantitative indicators overcomes the subjectivity of peer review, although it is incorrect to rely solely on numbers [
12]. Ideally, FWCI should be equal to SNIP. In reality, of course, such a situation is unlikely, but the perfect positive correlation between these two indicators takes place as a direction for improvement of the university’s publication strategy. The author decided to focus on the problem area for RUDN (and for Russian universities in general) in the social sciences and arts and humanities. It is no secret that Russian universities are most often associated with the natural sciences. Moreover, given the low citation potential in these areas, only a few citations can affect the value of the normalized indicator rather significantly. The research question was how to use the SNIP and FWCI indicators together for the purposes of research management and advancement in international rankings in terms of social sciences and humanities. The author also tried to illustrate the application of this study’s results in practice.
2. Materials and Methods
The calculation method of normalized citation indicators enables comparative analysis not only with universities but also with university groups because the value is taken not as a sum, but as a mean. Therefore, three objects were compared: Project 5-100 in general, the Chinese “League of nine” or C9 [
13] and Universities of Excellence (Germany) [
14]. The analysis was conducted on six subject fields and areas (Arts and Humanities; Business, Management, and Accounting; Decision Sciences; Economics, Econometrics, and Finance; Psychology; Social Sciences). Only documents of the “article” type were selected for analysis due to the following:
It is most often in journal articles that the approved original results of scientific research are published;
It is very difficult to estimate the level of “non-journal” sources because of the lack of data.
First, the Pearson correlation coefficient was calculated for these subject fields and areas. The correlation coefficient, like the covariance analysis, characterizes the degree to which the two variables “change together”. Unlike the covariance analysis, the correlation coefficient is scaled in such a way that its value does not depend on the units in which the variables of the two measurements are expressed. Any value of the correlation coefficient should be in the range from −1 to +1 inclusive. Correlation analysis elucidates whether data sets are associated in magnitude, namely, higher values of one data set are associated with larger values of the other set (positive correlation) or, on the contrary, low values of one set are associated with larger values of the other (negative correlation), or data of two ranges are not related in any way (zero correlation).
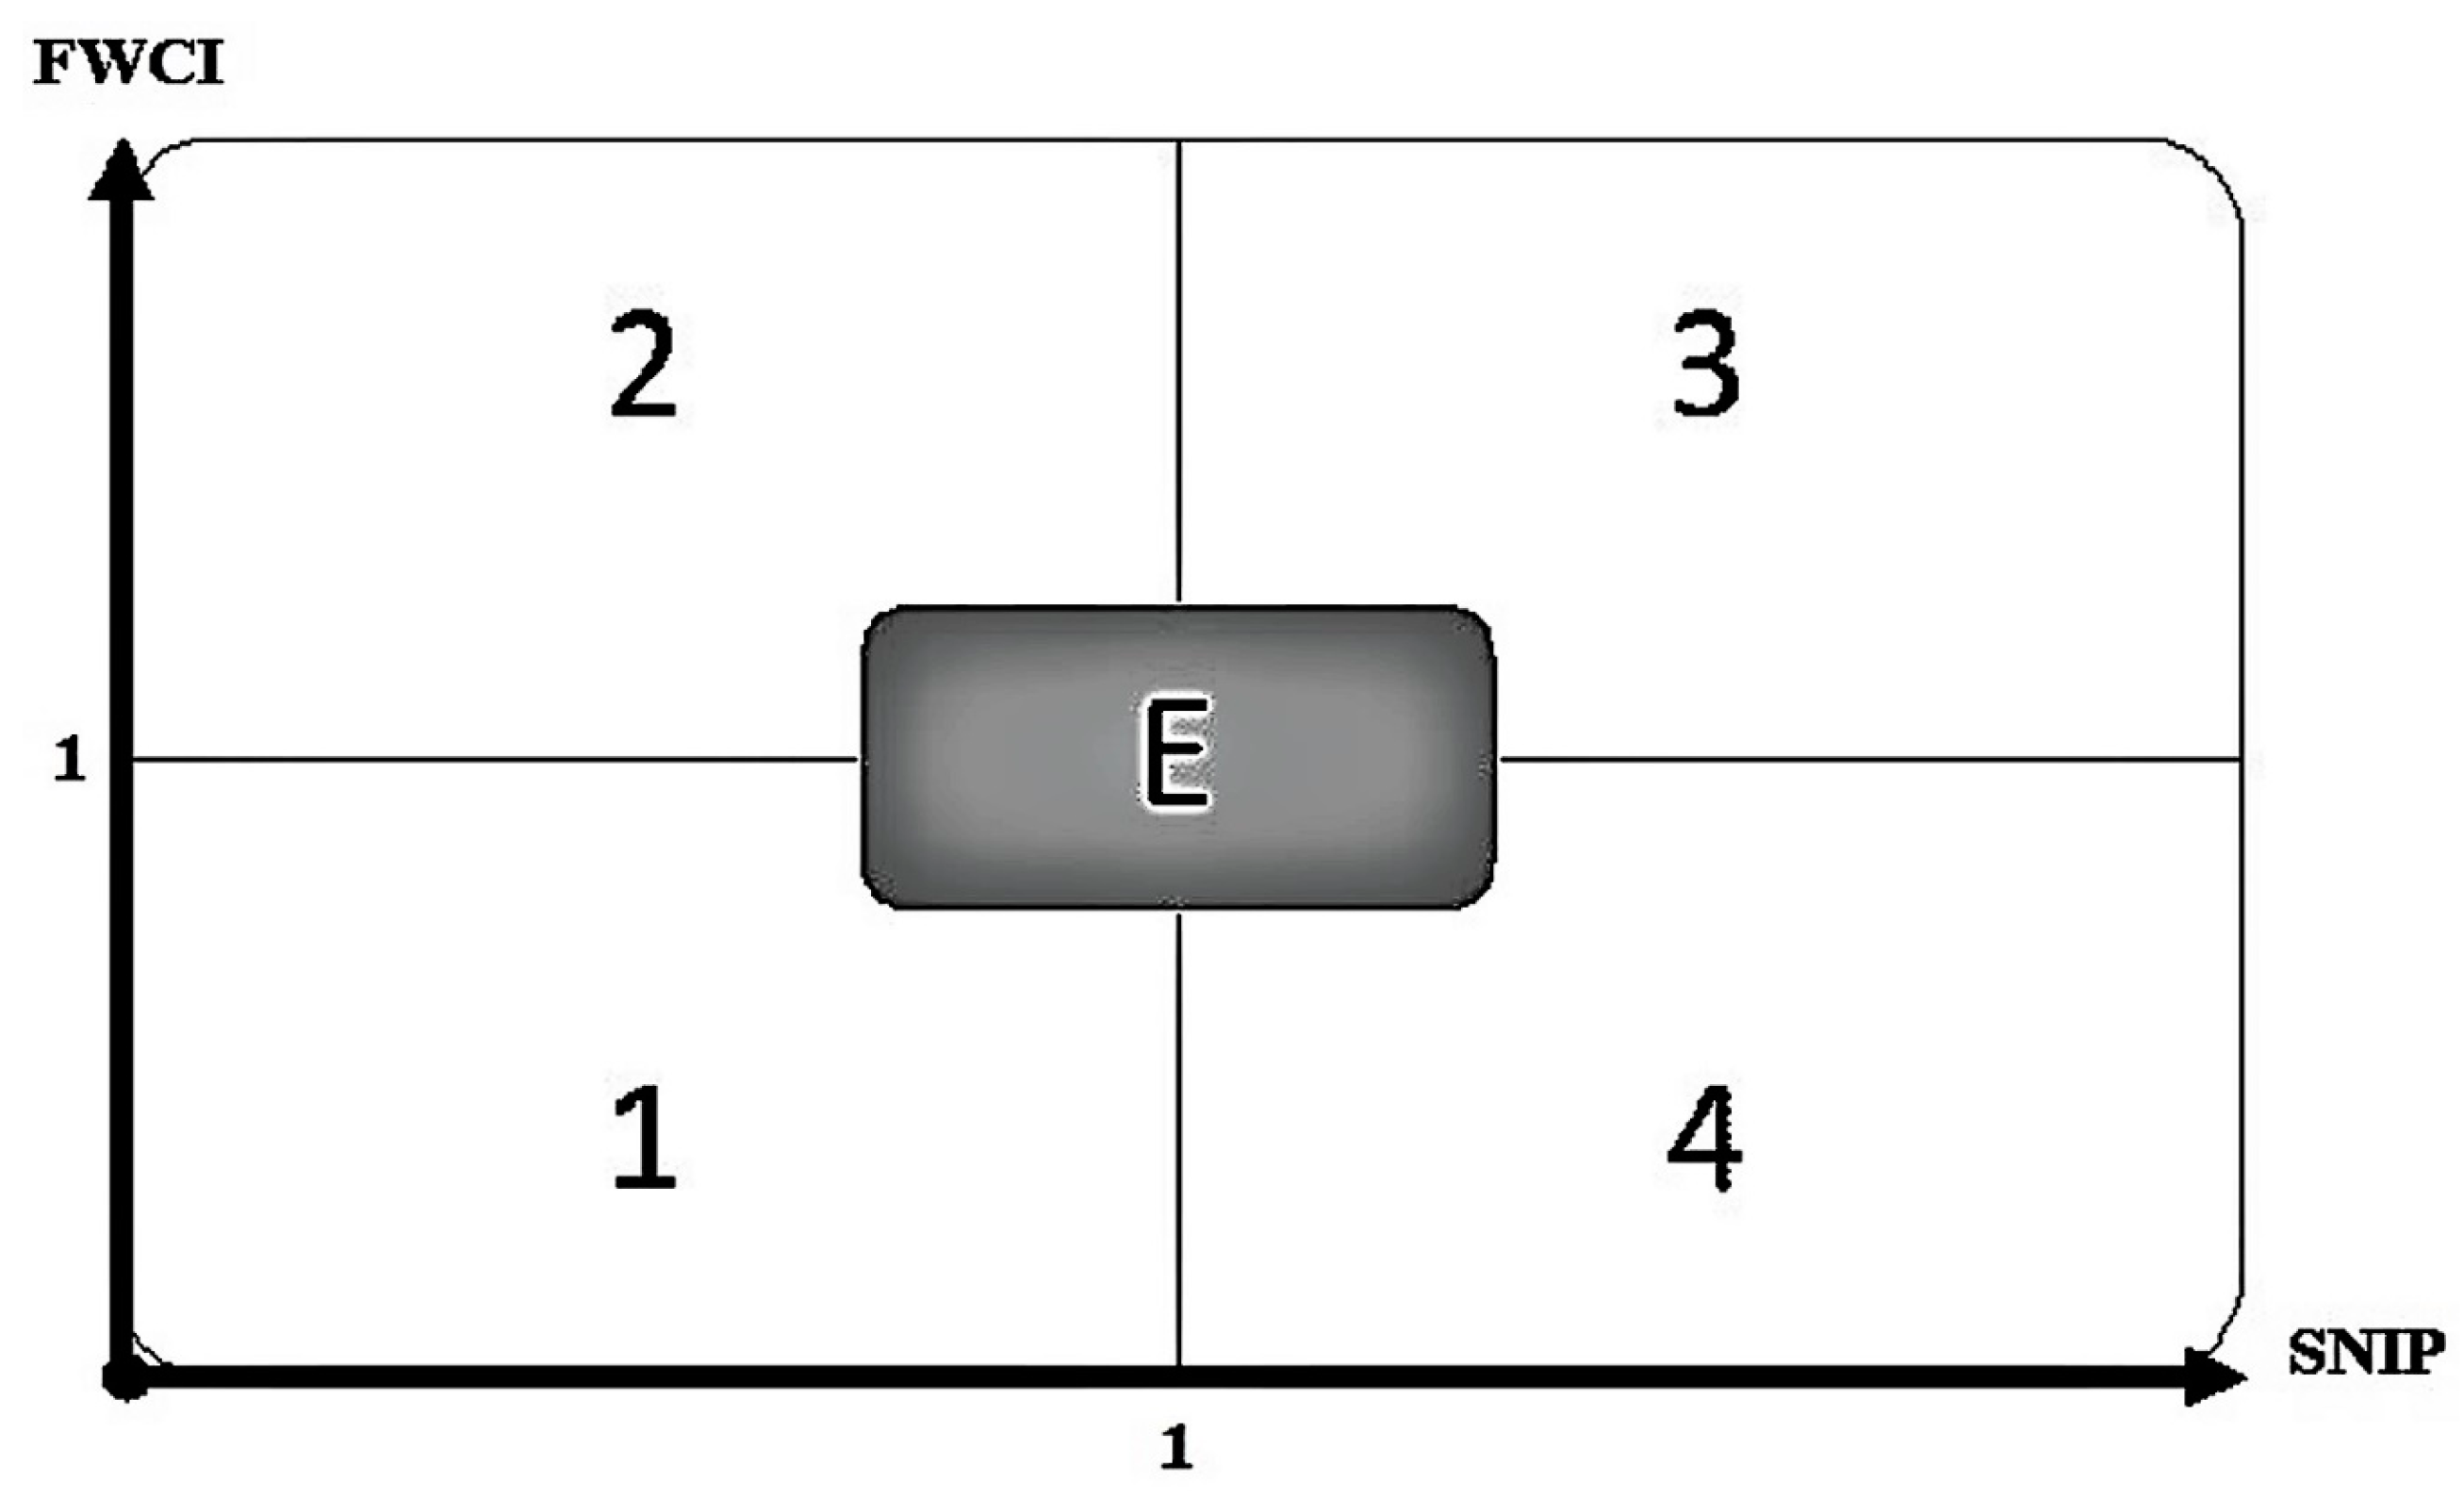
Next, a dot diagram was constructed for publications in each of the subject areas based on FWCI and SNIP indicators. Lines were then drawn through points 1 (global average citation potential) on the abscissa and y-axis. Thus, a two-factor matrix was obtained, which produced four quadrants (see
Figure 1).
Quadrant 1 “Everything is bad”. The results of the university research are published in low-impact journals and receive low citation rates. The problem lies in the field of either relevance or importance of the research agenda as such, or in the fact that research in this field is still in its infancy (at the university).
Quadrant 2 “Rising Stars”. The quality of publications in this field exceeds the level of the sources in which they are published. It is time for the university to make a shift towards the next level. Such a situation is often related to an underestimation by scientists of their own capabilities.
Quadrant 3 “Everything is fine”. High-quality research results are published in high-quality sources. Authorities must strive to ensure that most publications of the university are in this quadrant.
Quadrant 4 “Overestimation”. University scientists overestimate the quality of their publications, which does not correspond to the level of sources in which they are published. Despite the review procedure, sometimes such situations arise because of the poor work of the reviewer or editor, or under the influence of the status of the researcher or the university itself. Most likely, the university should revise its research agenda, at least in part.
The point E represents the balance: the citation level of the document and the source coincide and at the same time correspond to the citation potential in the given subject field/area in a given period.
3. Results
Table 1 shows the results of the correlation analysis.
It became obvious from the table that Peoples’ Friendship University of Russia falls behind the correlation coefficient obtained for the compared groups of universities (including Project 5-100) in almost all areas of social sciences and humanities. An especially critical situation is in Arts and Humanities, Economics, and Social Sciences in general. High rates for Decision Sciences and Psychology do not seem valid due to the extremely small sample size. In turn, the universities of Project 5-100 fall behind Chinese and German colleagues. German Universities of Excellence are the leaders in virtually all subject areas. An analysis of the situation in each subject area is presented below in more detail.
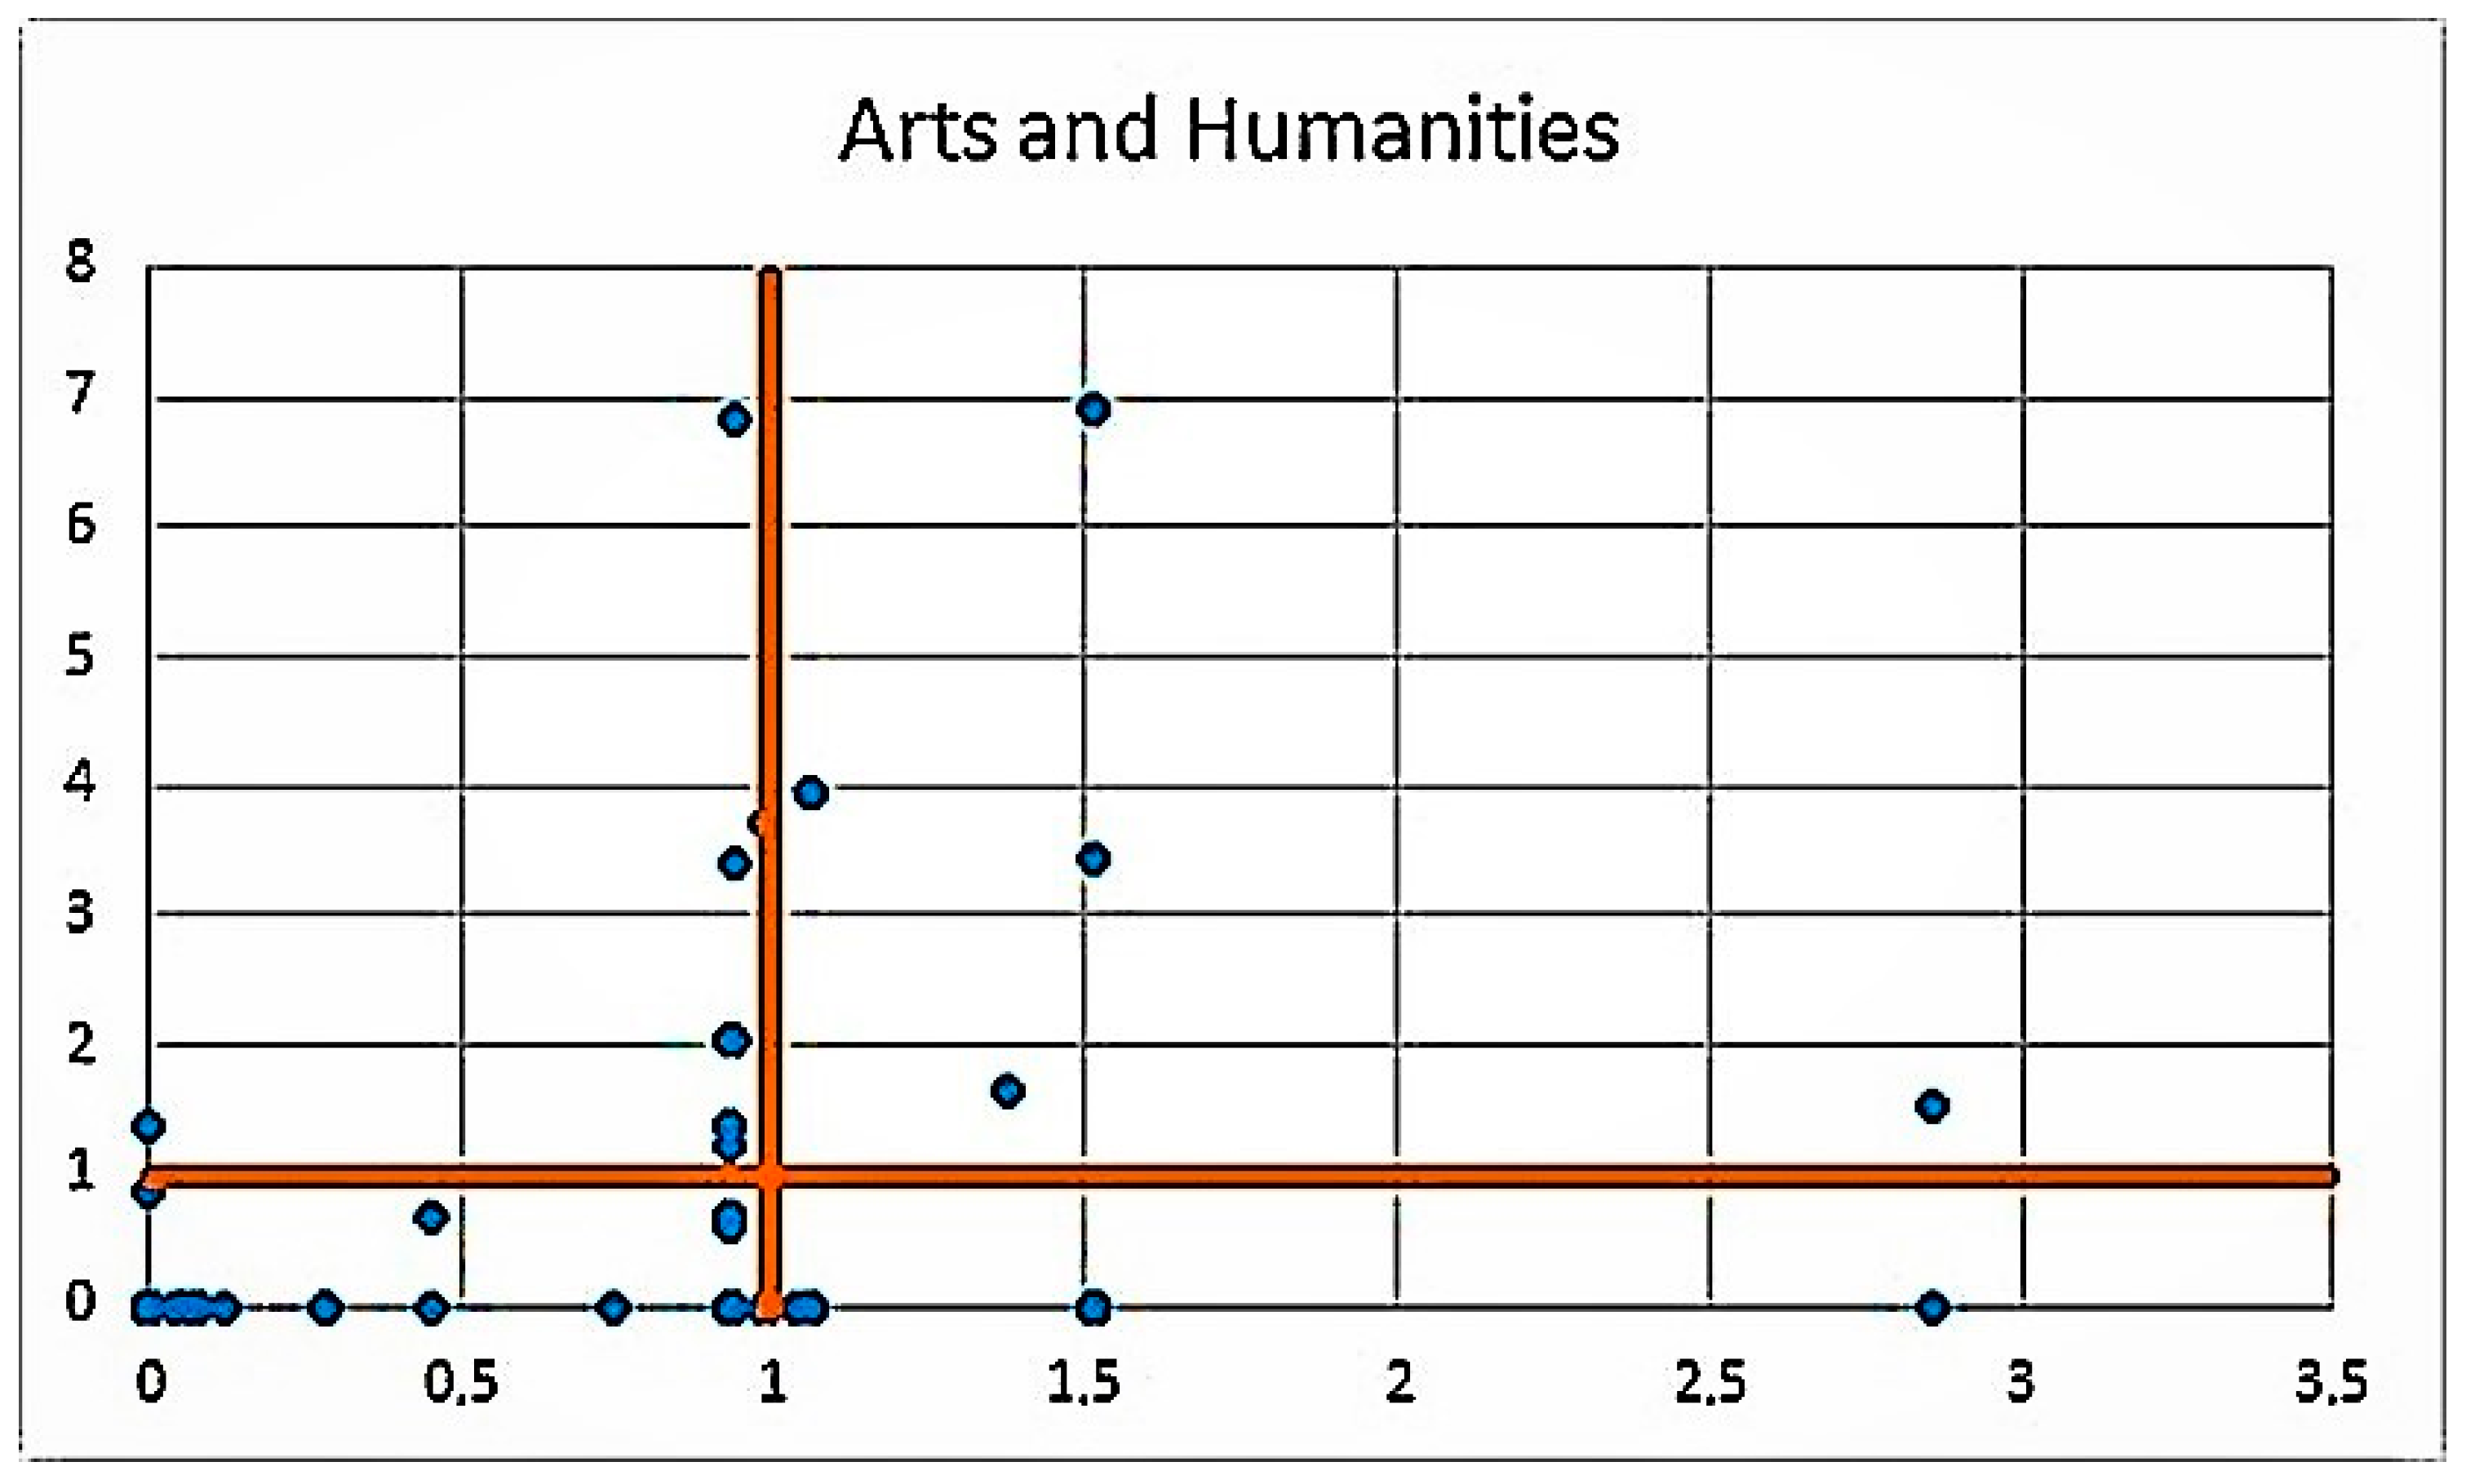
3.1. Arts and Humanities
The first attempt to build a point chart in the Arts and Humanities field was unsuccessful because of several “runouts” (e.g., one article obtained FWCI 44.39, see
Figure 2).
Therefore, it was decided to remove four extreme FWCI values, eventually obtaining a picture of the publication distribution (see
Figure 3).
Most publications are in the first and second quadrants. Taking into account the observations with the FWCI extreme value which were removed, the main problem was the discrepancy between the selection of sources and the quality of published scientific results. Two out of the four removed publications were published in the journal Man in India, and another two in the Pertanika Journal of Social Sciences and Humanities. The coverage of Man in India in Scopus was discontinued in 2017.
3.2. Business, Management, and Accounting
In this subject area, the same problem occurred as in the previous case: one of the publications obtained FWCI 19.94 (incidentally, it was also published in the
Pertanika Journal of Social Sciences and Humanities). In
Figure 4, as in the case of Arts and Humanities, most of the publications are in the first and second quadrants, with a big bias visible in the first.
Therefore, in this case, the problems concern relevance and significance of the research itself.
3.3. Decision Sciences
As mentioned above, there are very few publications in this area, and almost all of them are in the first quadrant (see
Figure 5).
Based on the analysis results, the development of research in this direction does not seem very promising.
3.4. Economics, Econometrics, and Finance
In this category, there were two extreme values of FWCI, the first one being the same article as the one in the category Business, Management, and Accounting (and the second one appearing in the
Asian Journal of Social Science, whose coverage in Scopus was discontinued in 2016). The distribution situation here is similar to the one observed for Arts and Humanities, that is, the publications are concentrated mainly in quadrants 1 and 2, whereas many qualitative publications are published in low-impact journals (see
Figure 6).
3.5. Psychology
There are even fewer publications in this category than in Decision Sciences. In addition, most of the documents are in the first quadrant (see
Figure 7).
3.6. Social Sciences
Finally, in Social Sciences, five publications with extreme FWCI values were deleted (among them, the publications at the junction of the areas of Education and Mathematics looked very interesting and promising). Among the remaining publications (the number of publications in this subject field was the largest, 264), the first quadrant again prevails. A correlation between the level of the journal and the article’s citation is missing (see
Figure 8).
4. Discussion and Conclusions
Based on the analysis, the following conclusions can be drawn:
A comparative analysis showed that, in four subject areas, the FWCI of publications including self-citations is higher than one (i.е., this corresponds to the global citation potential in a given field at a given period). An unfavorable situation was observed only in the categories of Decision Sciences and Psychology. However, when the self-citations were removed, a relatively large gap was revealed with the C9 and Universities of Excellence. The same problems were observed in other universities participating in the Project 5-100: the value of the normalized citation indicators for RUDN was even higher than the average for the Project 5-100 (excluding the two above-mentioned areas).
At the same time, it cannot be said that the articles from Peoples’ Friendship University of Russia or other Russian universities receive fewer views than foreign comparators. If the normalized Field-Weighted Views Impact (FWVI) is examined, one can see that the articles of the RUDN and 5-100 universities are viewed much more often than foreign comparators with higher citation rates (see
Table 3).
Thus, the main problem is seen in the contents of the publications and the research activities of the university.
One could assume that the researchers are only aiming high, preferring to publish in high-impact multidisciplinary journals like Nature or Science instead of a field journal. This assumption could be verified by analyzing publications in the top journal percentiles established by SCImago Journal Rank (SJR), for example, the top 5% in the subject category Multidisciplinary (data source: SciVal by Elsevier). However, there were no such publications for RUDN University in 2017 and only 34 articles for the Russian excellence initiative 5-100 (21 universities). Therefore, at the present time, this hypothesis has not been supported by data.
- 3.
There are very few publications in the subject areas of Decision Sciences and Psychology, and almost all of them are in the first quadrant. Accordingly, the development of these areas seems not very promising.
- 4.
In the subject fields/areas of Arts and Humanities, Economics, Econometrics, and Finance, and Social Sciences, much research falls into the second quadrant (i.e., high-quality research results are published in low-impact journals).
- 5.
In almost all subject fields/areas, there are articles in the fourth quadrant. Low citation rates can be attributed both to the discrepancy between the quality of the publication and the level of the journal and to the quality of academic English and metadata.


