Article

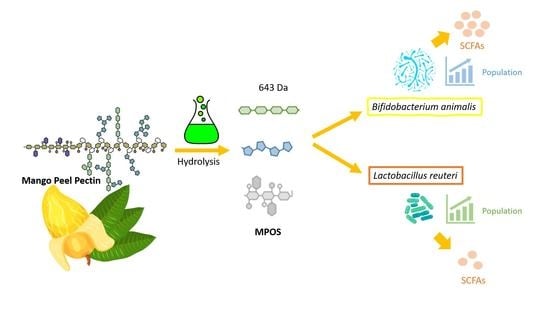
Crude Pectic Oligosaccharide Recovery from Thai Chok Anan Mango Peel Using Pectinolytic Enzyme Hydrolysis

by
Malaiporn Wongkaew
1,2,3,
Bow Tinpovong
2,
Korawan Sringarm
4,5,
Noppol Leksawasdi
5,6,
Kittisak Jantanasakulwong
5,6,
Pornchai Rachtanapun
5,6,
Prasert Hanmoungjai
6 and
Sarana Rose Sommano
3,5,*
1
Interdisciplinary Program in Biotechnology, Graduate School, Chiang Mai University, Chiang Mai 50200, Thailand
2
Program of Food Production and Innovation, Faculty of Integrated Science and Technology, Rajamangala University of Technology Lanna, Chiang Mai 50300, Thailand
3
Plant Bioactive Compound Laboratory, Faculty of Agriculture, Chiang Mai University, Chiang Mai 50200, Thailand
4
Department of Animal and Aquatic Science, Faculty of Agriculture, Chiang Mai University, Chiang Mai 50200, Thailand
5
Cluster of Agro Bio-Circular-Green Industry (Agro BCG), Chiang Mai University, Chiang Mai 50200, Thailand
6
School of Agro-Industry, Faculty of Agro-Industry, Chiang Mai University, Chiang Mai 50200, Thailand
*
Author to whom correspondence should be addressed.
Foods 2021, 10(3), 627; https://doi.org/10.3390/foods10030627
Submission received: 9 February 2021 / Revised: 9 March 2021 / Accepted: 12 March 2021 / Published: 16 March 2021
(This article belongs to the Special Issue Sustainable Utilisation and Management of Food Waste)

Abstract

:
Pectin recovered from mango peel biomass can be used as a potential source for pectic oligosaccharide hydrolysate with excellent probiotic growth-enhancing performance and prebiotic potentials. Consequently, the objectives of the current study were to optimise the enzyme hydrolysis treatment of mango peel pectin (MPP) and to evaluate the pectic oligosaccharide effects of Lactobacillus reuteri DSM 17938 and Bifidobacterium animalis TISTR 2195. Mango of “chok anan” variety was chosen due to its excessive volume of biomass in processing and high pectin content. The optimal treatment for mango peel pectic oligosaccharide (MPOS) valorisation was 24 h of fermentation with 0.3% (v/v) pectinase. This condition provided small oligosaccharides with the molecular weight of 643 Da that demonstrated the highest score of prebiotic activity for both of B. animalis TISTR 2195 (7.76) and L. reuteri DSM 17938 (6.87). The major sugar compositions of the oligosaccharide were fructose (24.41% (w/w)) and glucose (19.52% (w/w)). For the simulation of prebiotic fermentation, B. animalis TISTR 2195 showed higher proliferation in 4% (w/v) of MPOS supplemented (8.92 log CFU/mL) than that of L. reuteri (8.53 CFU/mL) at 72 h of the fermentation time. The main short chain fatty acids (SCFAs) derived from MPOS were acetic acid and propionic acid. The highest value of total SCFA was achieved from the 4% (w/v) MPOS supplementation for both of B. animalis (68.57 mM) and L. reuteri (69.15 mM). The result of this study therefore conclusively advises that MPOS is a novel pectic oligosaccharide resource providing the opportunity for the sustainable development approach through utilising by-products from the fruit industry.

Graphical Abstract

1. Introduction

Pectin is mostly required in the food industry owing to its additive ability to form food hydrogels or emulsions, which alter texture and firmness of food products [1]. The soluble properties with structural complexity warrant its importance as a functional ingredient with various health benefits claimed [2,3]. Structurally, pectin is a complex hetero-polysaccharide mainly comprised of α-1,4-D galacturonic acids (≈70%) known as homogalacturonan [4,5,6,7,8]. Their structures are also comprised of various monosaccharides, particularly those of glucose, mannose, galactose and arabinose [4,5,9]. As a consequence, pectin is also known as a source of oligomers with the prebiotic potential that is currently in high demand in food and pharmaceutical industries [10]. However, prior to application, pectin must be hydrolysed to short chain oligosaccharides for better enhancement of probiotic growth performance and formation of fermented by-products [11].
Prebiotics are identified as non-digestible food constituents that benefit hosts by selectively enhancing the growth of probiotic bacteria (mainly the genus of Bifidobacterium and Lactobacillus) and reducing pathogenic effects of harmful bacteria by producing short chain fatty acids (SCFAs; mainly acetic, propionic and butyric acids) [12,13]. B. animalis and L. reuteri are especially well-studied probiotic strains that can be found in different parts of the human body and are able to withstand a low pH in the stomach and contact with bile in the small intestine [14,15]. Consequently, microbiota balance can promote human health by stimulating the immune system, synthesising vitamins and improving digestion and absorption of essential nutrients [16,17,18,19]. Pectic-oligosaccharide (POS) is a prebiotic that has recently gained attention as a novel functional food ingredient [20,21,22,23,24,25,26]. POS is generally obtained from partial depolymerisation of pectin-rich agro-residues through enzymatic hydrolysis [9,10,27,28,29]. The enzymes digest pectin to monosaccharides or oligosaccharides through regio- and stereoselectivity [30,31]. By this technique, the obtained oligosaccharides are mostly composed of carbon sources for probiotics depending on the types of raw materials [6].
Several studies have investigated POS recovery from different fruit biomass using enzymatic hydrolysis, such as from citrus peel [9], lemon peel [32], sugar beet pulp [32] hawthorn [33] and orange peel [28]. Citrus peel is an important source of intermediate pectin for POS recovery. Gomez et al. [34] revealed that recovering POS with commercial pectinase from the hydrolysate of lemon peel waste illustrated high content of arabinose and galactose and other oligosaccharides. The POS of this type could complement prebiotic growths, and are thereby candidates that exert a number of health-promoting effects. Ho et al. [9] and Zhang et al. [10] found that POS derived from citrus pectin could enhance growth, fermented products and acid tolerance of probiotics. Thailand is one of the major fruit producing and processing countries where biomass is generated enormously and attempts have been made to value add these by-products through valorisation as to comply with the government policies on zero-waste production [35,36,37]. However, none of those attempts have investigated pectic oligosaccharide components from these resources.
Approximately 300,000 tons of ripe mangoes (Mangifera indica L.) are used in Thailand for processing, mainly in the puree, frozen fresh cut, drying and canning industries with the preferred cultivars being “kaew”, “chok anan”, “mahachanok” and “nam dok mai” [38]. As a result, fairly high amounts of mango by-products (peel, pulp and kernel) are generated which largely have adverse impacts on the environment [39]. These by-products account for 35–60% of the total fruit weight [40] and the cost of elimination of such biological mass is not only costly but also generates a large carbon footprint. Therefore, they are mainly fed to animals or disposed of in the environment [41]. Biomass mango peel accounts for 20% of the total fruit weight, therefore is a potential source of dietary fibre with high recovery of pectin (5–10%) depending on the extraction methods and fruit varieties [42,43,44,45,46]. A previous study revealed that peel from the Thai mango variety “chok anan” provided a substantially high amount of pectins (13%), mainly of low methoxyl level with elevated gelation properties at low sugar content, and thus it has been widely used as an additive in dietary food and beverages [47]. Nonetheless, as mentioned, POS recovery and its characteristics from Thai mango peel have not been thoroughly explored. With this rationale, the objectives of this research were first to optimise the hydrolysis condition of mango peel pectin and then to evaluate the advantages of POS on the fermentation by L. reuteri and B. animalis. The outcome of this study not only provides an alternative way to add value to by-products from Thai fruit industry but also affords a feasible industrial model towards sustainable development.

2. Materials and Methods

2.1. Chemicals

Standard free fatty acids (acetic acid, propionic acid, isobutyric acid, butyric acid, isovaleric acid, valeric acid) were purchased from Restex Corporation (Bellefonte, PA, USA). Monosaccharide standards, namely D-glucose, D-fructose, D-xylose, D-galactose and L-arabinose were supplied by Loba (Loba Chemie Pvt Ltd., Mumbai, India), Sigma-Aldrich (St. Louis, MO, USA) and Ajax Finechem (Ajax Finechem Pty Ltd., Sydney, Australia). L(+)-Lactic acid standard was purchased from Sigma-Aldrich (St. Louis, MO, USA). Chemicals for pectin extraction and analysis of indigestible polysaccharide were supplied by Sigma-Aldrich (St. Louis, MO, USA), RCI Labscan Limited (Bangkok, Thailand) and AppliChem GmbH-An ITW Companies (Darmstadt, Germany). Dextran was used as an oligosaccharide standard (Sigma-Aldrich, St. Louis, MO, USA). Bacterial supplemented media, including de Man-Rogosa-Sharp broth (MRS) and Luria-Bertani [48] broth, were ordered from Becton, Dickinson and Company (Spark, MD, USA).

2.2. Microorganisms

Two probiotic bacterial strains were used in this experiment. L. reuteri DSM 17938 (Protectis®) was a commercial probiotic (BioGAia® Drops, made in Sweden). B. animalis 2195 was obtained from Thailand Institute of Scientific and Technological Research (TISTR, Bangkok, Thailand). The inoculate of lactobacilli was cultured in the MRS broth [49]. Bifidobacterium was also cultivated in MRS broth supplemented with bacto soytone (5.0 g/L) [50]. Escherichia coli 117 was used as enteric bacteria which was acquired from the TISTR and sub-cultured in an appropriate medium of Luria-Bertani broth [48,51]. All microorganisms were cultivated under anaerobic conditions in a CO2 incubator (Thermo Fisher Scientific Inc., Waltham, MA, USA).

2.3. Optimisation Condition of Pectic Oligosaccharide Preparation from Mango Peel

Mango peel was removed from fully ripe “chok anan” mangoes (L = 69.98 ± 2.72, a* = 5.55 ± 0.73, b* = 43.09 ± 6.68; peel thickness = 1.69 ± 0.14 mm; percentage of peel to fruit weight = 14.39 ± 0.57%; ρ = 1.247 ± 0.07 g/cm3). Pectin was extracted from the dried peel powder using a microwave oven (ME711K-XST, Samsung, Bangkok, Thailand) at 700 watt-power for 3 min using acidic solution (pH 1.5) that yielded ca.15% (w/w) [45,52]. The chemical characteristics of pectin extracted from “chok anan” peel are illustrated in Table S1. The filtrate was centrifuged at 5000× g for 20 min and then pectin was precipitated from the supernatant using the same volumes of ethanol (95%). The separation was achieved by vacuum filtration. The obtained mango peel pectin (MPP) was dried in a hot air-oven at 40 °C until constant weight [53].
In addition, the previous extracted MPP was treated with a commercial pectinase enzyme (Pectinex® ultra tropical, Novozymes Malaysia Sdn Bhd, Kuala Lumpur, Malaysia) at 6, 12 and 24 h of hydrolysis intervals and at the concentrations of 0.1, 0.2 and 0.3% (v/v) [54]. Prior to the experiment, the activity of Pectinex was checked (20 Unit/mL). The MPP was prepared to 2% pectin solution in 0.02 M acetate buffer (pH 4.5). After hydrolysis, all samples were heated in a boiling water for 10 min to deactivate pectinase activity. After cooling down to room temperature, it was then centrifuged at 5000× g, 15 min. The supernatant was collected and dehydrated using a vacuum dryer at 50 °C until the moisture content was 7% [9]. Each sample was examined for quality assessments as following.

2.4. MPOS (Mango Peel Pectic Oligosaccharide) Quality Assessments

2.4.1. Determination of Molecular Weight

The molecular weights (Mw) of MPOS (mango peel pectic oligosaccharide) were determined by high-performance size-exclusion chromatography method (gel permeation) according to a modified technique of Yang et al. [55] and Ho et al. [9]. A sample solution (20 μL) was injected into a Ultrahydrogel Linear 1 Column (Waters 600E, Milford, MA, USA) using the mobile phase comprising of 0.8 M sodium chloride at the flow rate of 0.6 mL/min and column temperature was 30 °C. The Mw of MPOS was determined by comparing the sample retention time with the standard curve of dextran standard series (4.0–401.0 kDa).

2.4.2. Determination of Monosaccharide Compositions

Qualitative and quantitative analyses of the monosaccharides in MPOS samples were performed using high performance liquid chromatography (HPLC) according to the modified methods of Tieking et al. [56] and Schwab and Ganzle [57]. The sample solutions were diluted three times, then filtered through a 0.22 nylon filter and 10 µL diluted samples were determined for types and contents of monosaccharides. The HPLC used was Shimadzu RID-20A Chromatopac, Japan, with column Agilent Zorbax LC-NH2, 4.6 mm × 250 mm, 5 µm. The mobile phase was acetonitrile:water at 75:25, 1.0 mL/min flow rate at ambient temperature and refractive index (RI) detector. Five monosaccharides (arabinose, xylose, glucose, galactose and fructose) were chosen as the standards. All analyses were done in triplicates.

2.4.3. Selection of MPOS Condition Using Prebiotic Activity

Prebiotic activity analysis was determined using a bacteria count technique according to Zhang et al. [10]. Briefly, 1% (v/v) of a twice-activated culture of L. reuteri DSM 17938 and B. animalis TISTR 2195 was added to both of the MRS media containing 2% (w/v) glucose and 2% (w/v) MPOS samples. The cultures were incubated at 37 °C for 48 h under anaerobic system in the CO2 incubator. At 0 and 48 h of the fermentation process, inoculated samples were numbered in triplicates using the serial dilution method on MRS agar and the results were calculated as CFU/mL of culture [10]. The quantitative score of prebiotic activity reported by Huebner et al. [58] can be calculated according to the following equation (Equation (1)):
Prebiotic   activity   score   =   [ ( probioticlogCFU / mL   on   the   prebiotic   at   48   h     probioticlogCFU / mL   on   the   prebiotic   at   0   h ( probioticlogCFU / mL   on   glucose   at   48   h     probioticlogCFU / mL   on   glucose   at   0   h ]   [ ( enteric   logCFU / mL   on   the   prebiotic   at   48   h   entericlogCFU / mL   on   the   prebiotic   at   0   h ( entericlogCFU / mL   on   glucose   at   48   h     entericlogCFU / mL   on   glucose   at   0   h ]
A higher score demonstrates a higher prebiotic activity [10]. The MPOS treatment representing the highest score of prebiotic activity was then selected for the simulation of the probiotic fermentation.

2.5. Fermentation of MPOS on Probiotic Growth and Products

Glucose-free MRS and Bifidobacterium broths were used as the base media for L. reuteri DSM 17938 and B. animalis TISTR 2195, respectively. Both media were supplemented with 1%, 2% and 4% (w/v) of MPOS obtained from the selected treatment. Each medium was then inoculated with 104 CFU/mL of the probiotic cultures. The glucose-free broth (negative control) with the supplementation of 2% glucose was applied as the positive control. After incubation at 37 °C in a 20 mL test tube for 0, 24, 48 and 72 h under anaerobic condition in the CO2 incubator, the media were determined for indigestible oligosaccharide, probiotic population, acidity alteration and short chain fatty acid production.

2.5.1. Indigestible Oligosaccharide

The content of oligosaccharide in the fermented samples was evaluated using the modified method of indigestible polysaccharides (oligosaccharides) after Wichienchot et al. [59]. All MPOS samples were analysed for reducing sugar contents using the modified dinitrosalicylic acid method [60] and total sugar contents with the modified phenol sulfuric method [61]. MPP was used as a control. The indigestible oligosaccharide content (mg/g dry MPOS) in the samples was calculated from (Equation (2)):
Indigestible oligosaccharide (mg/g) = Total sugar after digestions (mg/g) − Reducing sugar before the digestions (mg/g)

2.5.2. Simulation of the Fermentation

Probiotics Population

The population of probiotic bacteria in the cultivation media was evaluated by the optical density of all samples using C30M portable spectrophotometer (PG Instruments Limited, UK) at 600 nm (OD600). The cell number corresponding to the OD600 reading was calculated from a calibration curve of L. reuteri DSM 17938 and B. animalis TISTR 2195 and on average 1.0 OD600 unit corresponded to 4.0 × 10⁸ and 7.0 × 10⁹ CFU/mL, respectively. The calibration curves of both cultures were generated by cultivating the bacteria until their OD600 reached 1.0. Cultures were then diluted to four or five different concentrations and enumerated on MRS agar at 37 °C for 24–48 h under anaerobic conditions. The calibration curves were generated by plotting the bacterial concentrations (CFU/mL) versus OD600 [62].

pH Value

The level of pH was analysed as fermentation indicators. The pH value was measured directly in the media samples by the pH meter (Mettler-Toledo, Greifensee, Switzerland).

2.5.3. By-Products of Probiotics

Lactic Acid

Lactic acid content (LA) was determined by HPLC techniques using Shimadzu LC-20AD (Shimadzu Corporation, Kyoto, Japan) equipped with a low pressure quaternary gradient pump along with the dual wavelength UV-Visible detector, column oven and auto sampler after the modified method of Kishore et al. [63]. The column oven temperature was maintained at 25 °C and the chromatographic separation was attained using Ultra Aqueous C18 column (250 mm × 4.6 mm ID, 5 µm) (Restex Corporation, Bellefonte, PA, USA). The isocratic elution was achieved with 50 mM potassium phosphate (pH 2.5) as mobile phase. The flow rate was maintained at 1.0 mL/min and the injection volume was 10 µL. The effluent was observed at a wavelength of 210 nm. The LA calibration standards were prepared by serial dilutions (0.3–1.2 mg/mL) in 50 mM potassium phosphate (pH 2.5).

Short Chain Fatty Acid Production

The supernatants from the anaerobic culture inoculated with probiotic cultures were analysed for short chain fatty acid (SCFA), including acetic acid, propionic acid, isobutyric acid, butyric acid, isovaleric acid and valeric acid using gas chromatography, Nexis GC-2030, Shimadzu according to the modified method of Filipek and Dvorak [64]. A Rtx®-1 capillary column (nonpolar phase) Crossbond dimethyl polysiloxane was used, 15 m × 0.53 mm ID × 5 μm (Restek, Bellefonte, PA, USA). Carrier gas (helium) at flow rate 3.0 mL/min, detector-FID, temperature program used: 60–200 °C (20 °C/min, 10 min), injector: 250 °C, detector: 300 °C. The injector was equipped with a glass liner of glass wool to separate particles of dirt from the sample. The samples were dosed by an AOC-20i Plus (Shimadzu corporation, Kyoto, Japan) automatic dosing device at an injection size of 1.0 μL using the split method and a 30:1 splitting ratio. The calibration standards were prepared by serial dilutions to obtain concentrations of 25–1000 μg/mL.

2.6. Statistical Analysis

All experiments were done in at least triplicates for each test. For the experimental design, the 3 × 3 factorial completely randomised design (CRD) was used and the data were analysed using two-way analysis of variance (ANOVA) with Duncan’s multiple range test. Difference in values was considered significantly different when the p value was < 0.05. All statistical analysis was performed using IBM SPSS program v. 23.0 (Armonk, New York, NY, USA) (Supplementary Materials Tables S3–S8). The relationships between the monosugar compositions and prebiotic activity as well as MPOS concentrations and probiotic growth were analysed using principal component analysis (PCA) by the XLSTAT v. 2020 (Addinsoft, New York, NY, USA).

3. Results and Discussion

3.1. Optimisation Condition of MPOS on Probiotic Growth

3.1.1. Monosaccharide Contents and Molecular Weight of MPOS s

Molecular weights (Mw) of MPOS obtained from MPP hydrolysed with various treatments are shown in Table 1. The Mw of all MPOS was less than 1000 Da. We noticed that the longer the hydrolysis time and pectinase concentrations, the lower the Mw obtained as described as Mz values. This finding was in line with other studies [65,66]. The smaller Mw oligosaccharides produced during the hydrolysis depend upon the greater proportion of monosaccharides [9]. Monosaccharide compositions of MPOS s are illustrated in Table 1. Among the analysed sugars, fructose and glucose were the most abundant monosaccharides in all MPOS samples, followed by galactose and arabinose and the levels increased significantly with any hydrolysis time (p < 0.05). We also found that the higher the amounts of enzyme, the better yields of each monosaccharides obtained. At 24 h of hydrolysis time, the maximum yield of glucose (19.0%), fructose (24.0%), galactose (3.3%) and arabinose (3.0%) were achieved. Alteration of sugar types and their concentration compositions may vary upon the source of raw materials, hydrolysis time and pectinase concentration [9,24,34]. Ivanova et al. [65] and Grahame et al. [66] added that the increased amounts of sugars followed zero-order reaction between substrate and enzyme. The highest monosaccharide concentration was with the treatment of 0.3% pectinase after 24 h hydrolysis and the lowest was with 0.1% pectinase after hydrolysed for 6 h in all sugar types. Furthermore, Cano et al. [67] and Dasaesamoh et al. [68] described that the pectinase practically cleaves ester and glycosidic bonds, thereby releasing the oligosaccharides and monosaccharides.

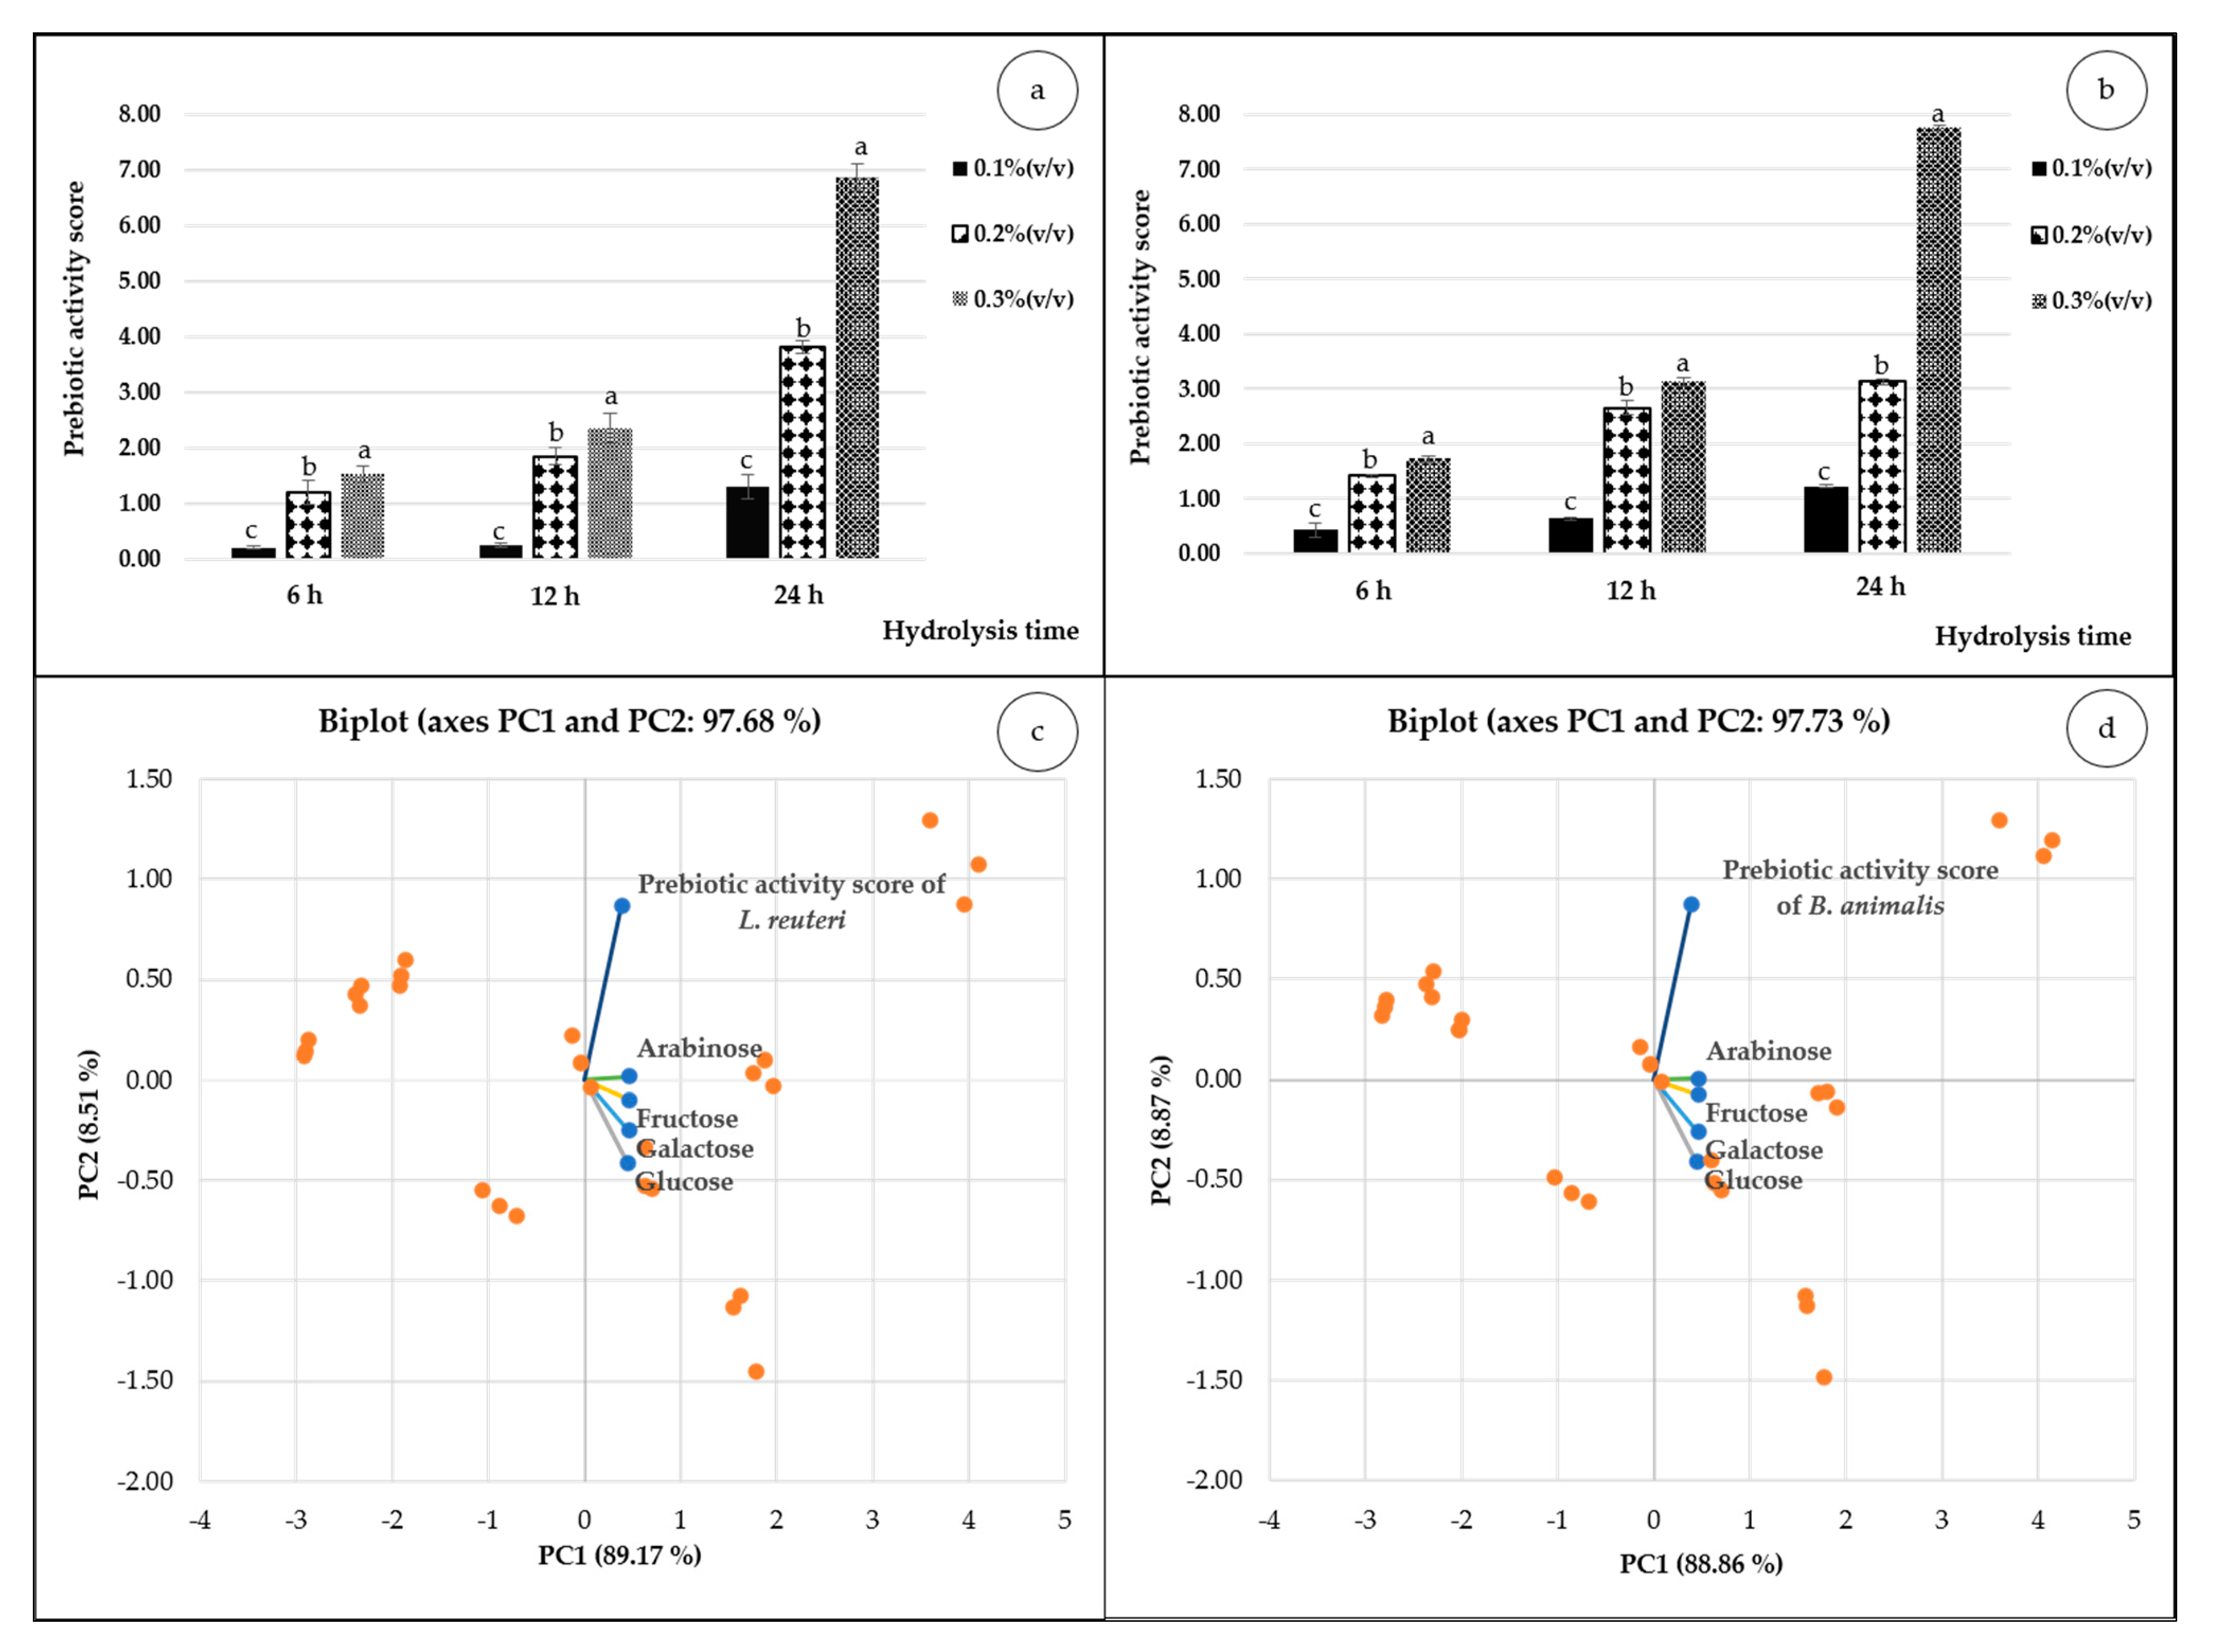
3.1.2. Prebiotic Assessment

Prebiotic activity scores of MPOS for L. reuteri and B. animalis are illustrated in Figure 1. The maximum scores for L. reuteri (6.87) and B. animalis (7.76) were obtained from the same hydrolysis condition of 0.3% (v/v) pectinase at 24 h interval time. On the contrary, the lowest scores of both probiotics were from 0.1% (v/v) enzyme concentration at 6 h. The higher prebiotic score indicates the greater growth performance of probiotics according to Huebner et al. [58]. Results in Figure 1 also showed the positive correspondence of pectinase concentrations and incubation time. Similar results were also reported by Thitiratsakul and Anprung [69] as well as Fasawang and Anprung [70]. Ho et al. [9] also revealed that POS preparation from citrus pectin using greater content of pectinase and longer hydrolysis time provided lower average molecular weights (monosaccharides and small oligosaccharides). Presumably, great amount of pectinase and longer time of degradation cleaved pectin to be molecules influencing the better prebiotic effectiveness [6]. In addition, the hydrolysis of pectin also enhances the release of bound bioactive compounds, and these affect higher growth of the probiotic bacterial strains (L. acidophilus La5) as well as greater score of prebiotic [69]. As a result of this study we also found that the higher the content of pectinase and longer hydrolysis time, the lower the molecular weights of MPOS obtained (Table 1).
By comparison, the scores of both probiotics showed that B. animalis gave remarkably higher scores than L. reuteri in all hydrolysis conditions. Likewise, the same probiotic genus of B. bifidum also provided significantly higher scores than those of L. paracasei when using POS from citrus peel pectin [10]. This is also in agreement with results reported by Gopal et al. [71]. Therefore, Bifidobacterium could hydrolyse the oligosaccharide source due to its specific enzyme (β-galactosidase), which was responsible for their growth using galactan as a substrate vastly available in plant-based prebiotics [72,73]. To have a look at the influence of monosaccharide compositions on prebiotic activity scores of both probiotics, we used PCA. The results showed that the score plots depicted > 97% of PC1 and PC2 in both cases (Figure 1c,d). The biplot analysis indicated that the arabinose had the most influence in growth of probiotics followed by fructose, galactose and glucose. This finding is in line with POS extracted from citrus peel where arabinose was the most usable monosaccharide by L. paracasei and B. bifidum [10].

3.2. Fermentation of MPOS on Probiotic Growth and Products

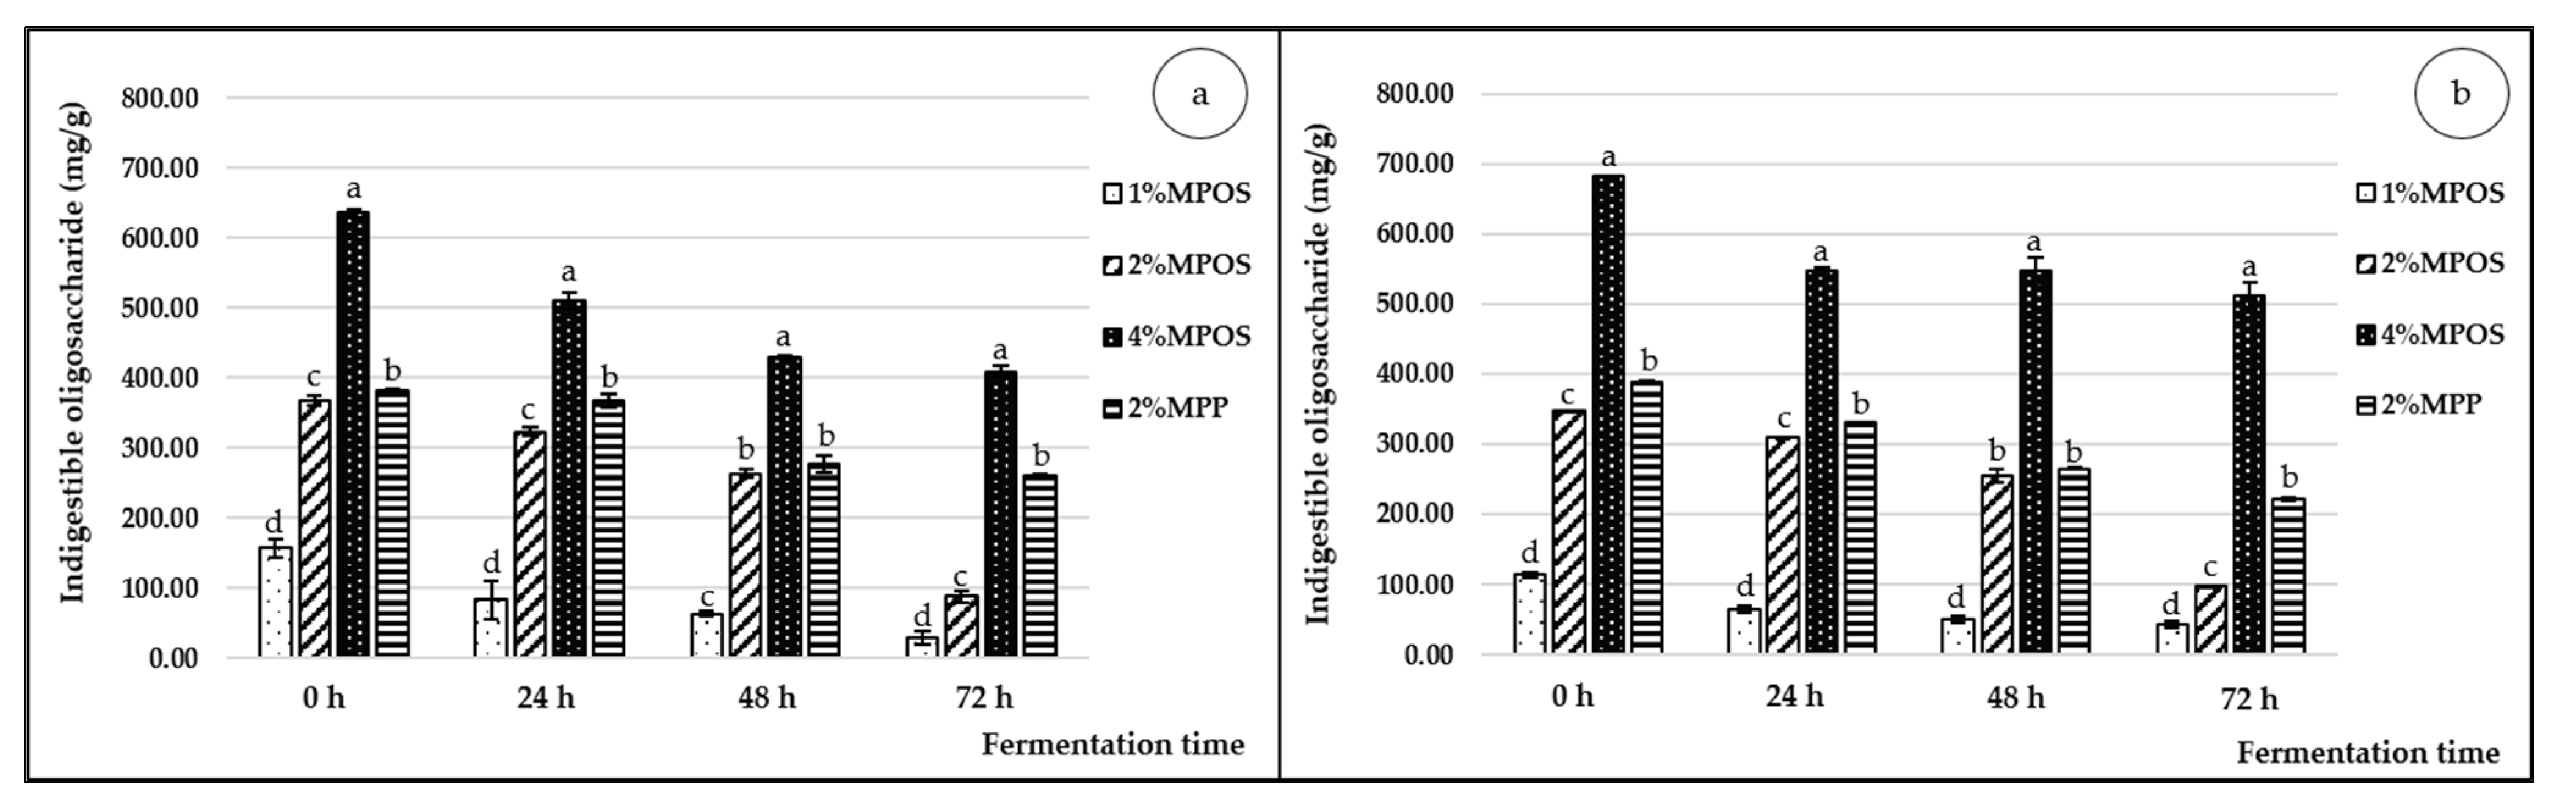
3.2.1. Indigestible Oligosaccharide

The amounts of oligosaccharides after fermentation of MPOS using various concentrations are shown in Figure 2. Initially (T0), the oligosaccharide contents in the media of L. reuteri (Figure 2a) and B. animalis (Figure 2b) were in the range of 156.97–635.23 mg/g and 113.68–682.92 mg/g, respectively, which varied depending on the concentrations of added MPOS (1–4% (w/v)). Subsequently, oligosaccharide contents in all treatments decreased continuously throughout the fermentation period and the lowest value was at 72 h. The controlled prebiotic treatment (MPP) remained quite stable during the fermentation period. Consequently, the greater the fermentation time, the more the degradation of oligosaccharide occurred because the partial oligosaccharides were digested by the probiotic bacteria and used as a carbon source for their growth and product formation (lactic acid and short chain fatty acids) [9]. Figueroa-Gonzalez et al. [74] found high reduction in galactooligosaccharide or GOS content by Lactobacillus strains after fermentation period for 24 h. In addition, Cheng et al. [75] also reported that long maintenance of GOS in mice colon (3 weeks) affected the increased abundance of Bifidobacterium because its β-galactosidases could efficiently degrade GOS to a much more utilisable form that enhanced its growth and performance. For the control treatment (MPP), the substrate content decreased lower than all MPOS in both bacterial strains. This incidence may correspond to the degree of esterification of the long chain polysaccharides, giving slower degradation than that of the low-esterified substrate [20,76]. The results of this present study showed that L. reuteri and B. animalis were capable of utilising the MPOS as a substrate, however the ability varied among the species and substrate contents [74]. Moreover, both strains could use the MPOS better than the MPP, which indicated that the MPOS had more efficiency thereby promoting higher growth of the probiotics than that of MPP.

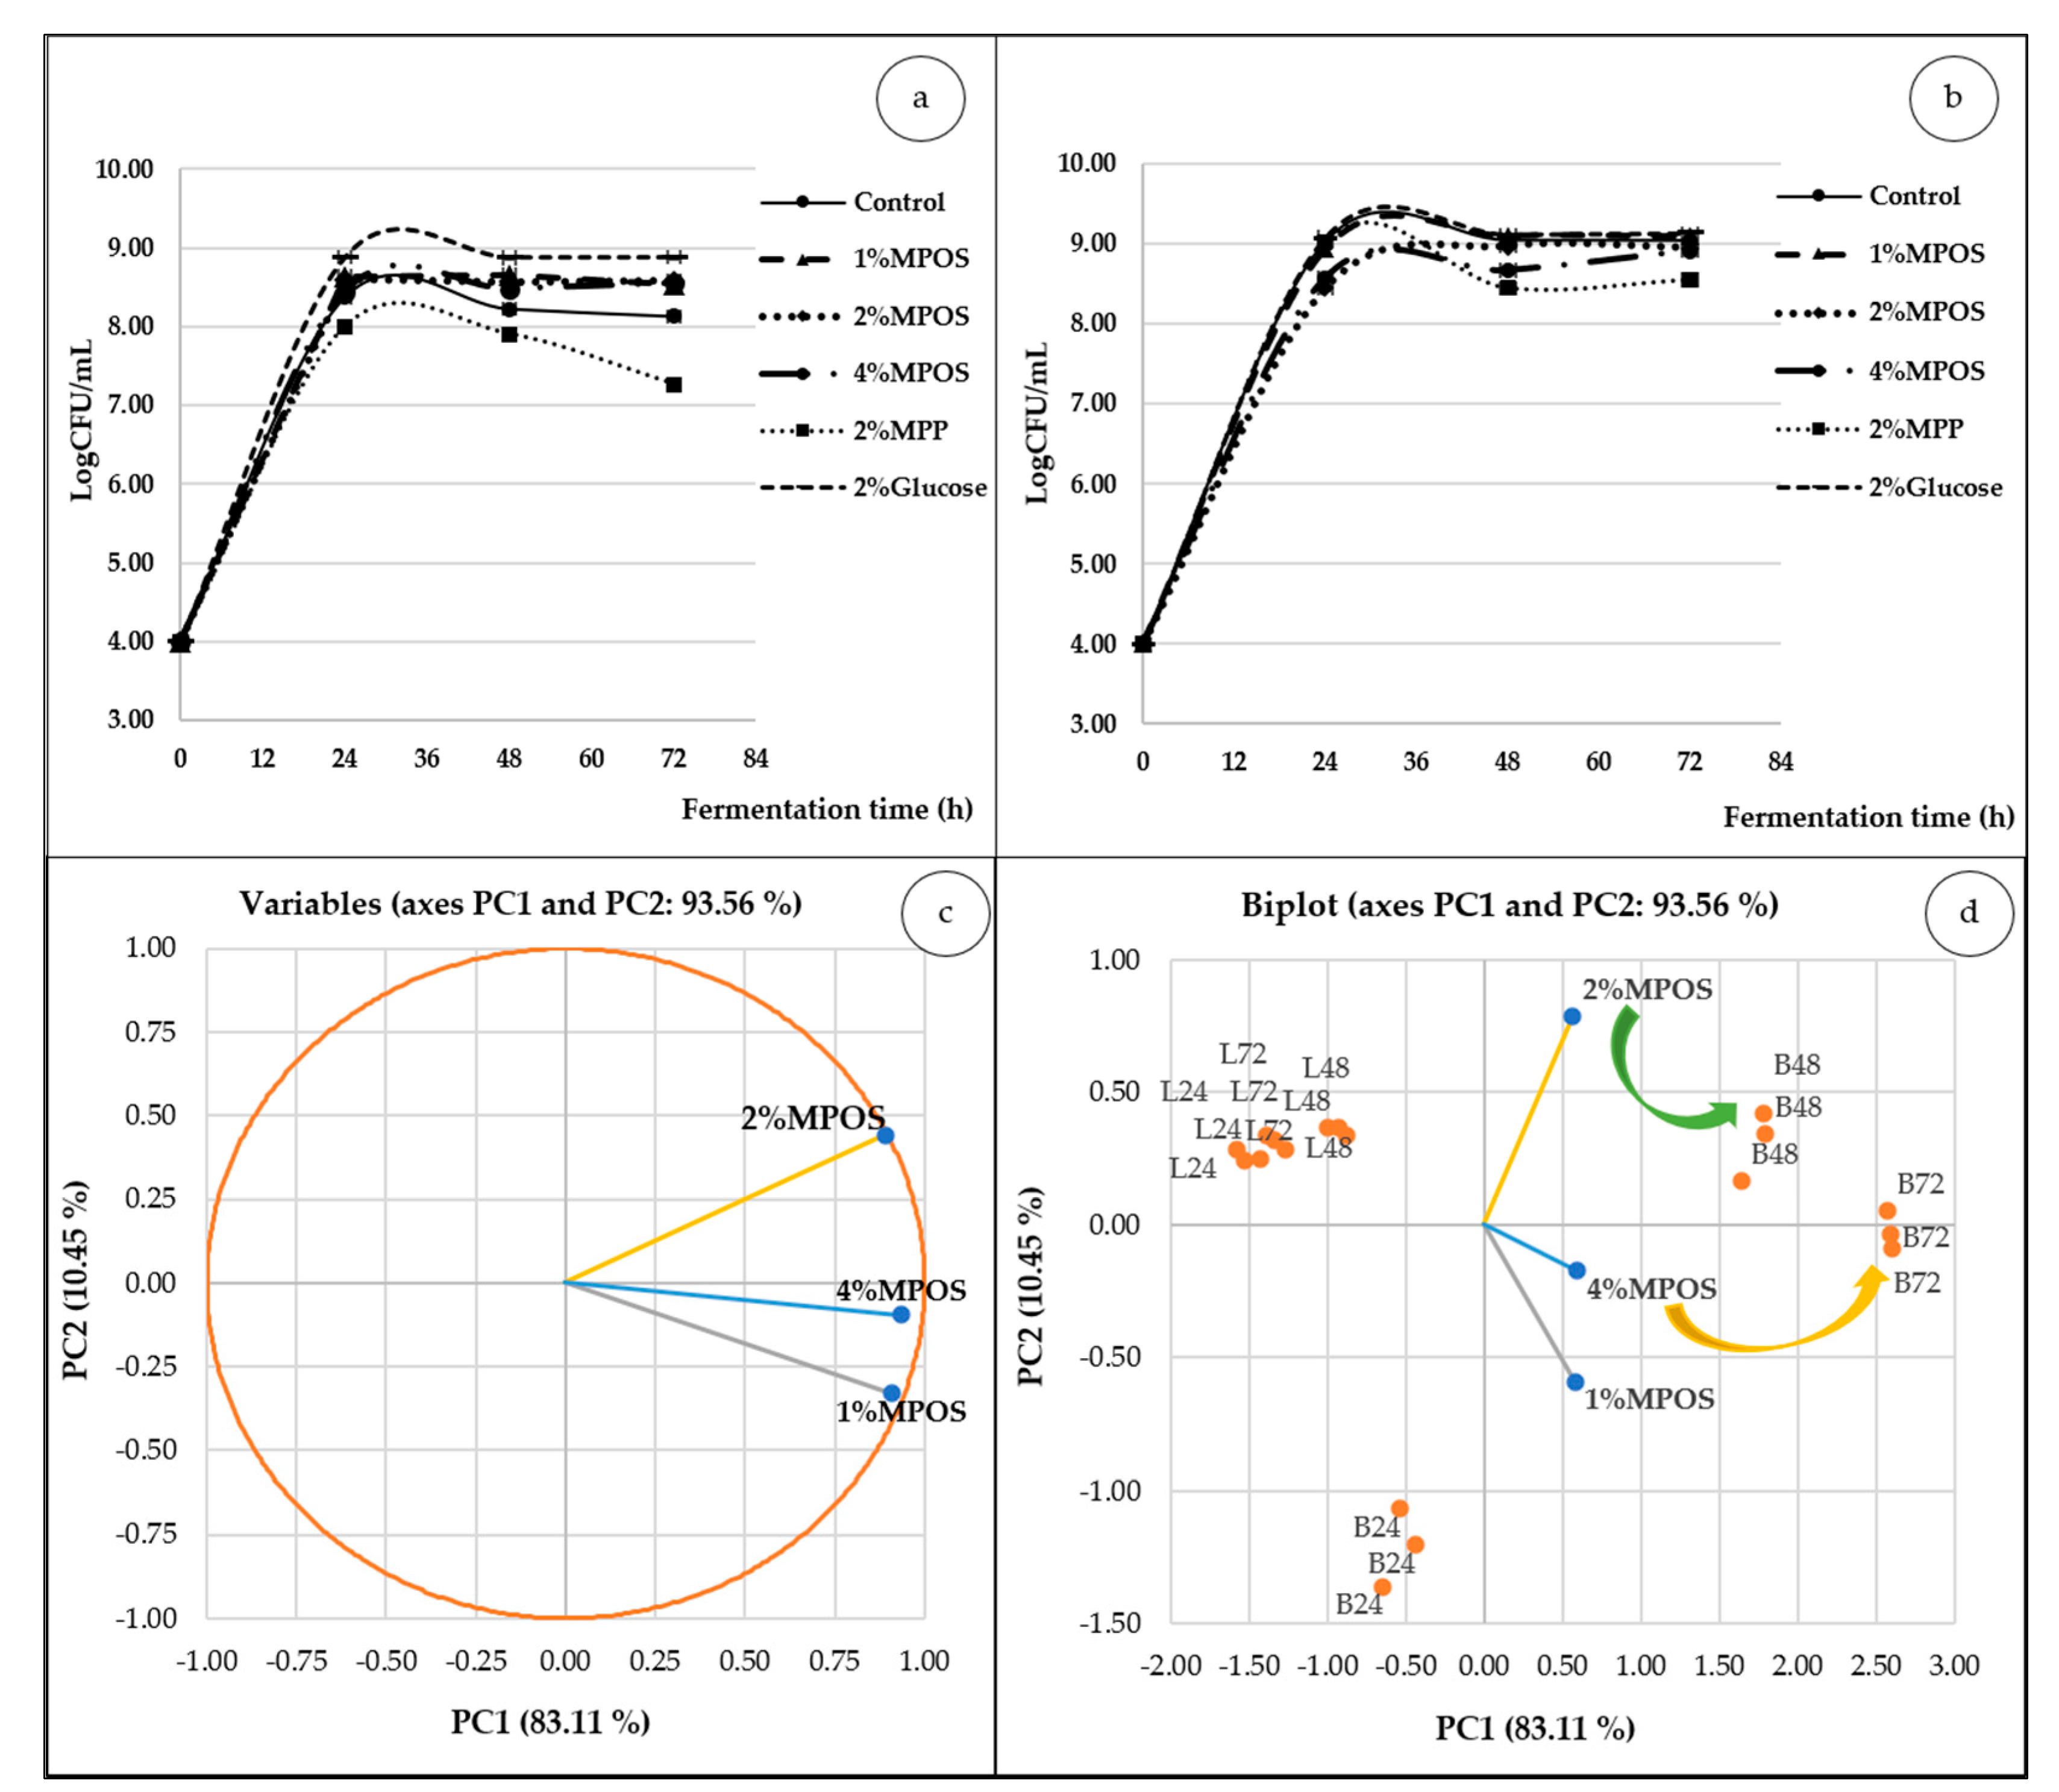
3.2.2. Probiotics Population

Growths of L. reuteri and B. animalis over 72 h in various carbon sources at different fermentation times illustrated the same patterns as shown in Figure 3. The number of cells rapidly increased within 24 h, then gradually rose, declined and were maintained until 72 h. Similarly, Kneifel [77] also mentioned the growth characteristics of Bifidobacterium strain in several prebiotic sources that continuously increased and statically assessed after 24 h of incubation time. In accordance with a general phase of bacterial growth, the log or exponential phase of microorganisms is within 24 h because the bacteria operate rapid reproduction and cell doubling which occurs every few minutes. Subsequently, the declining and stationary phase appear after 24 h of fermentation time due to the depletion of available nutrients and the accumulation of waste products [78]. Compared to the negative controls, viz. carbon source and MPP, they presented significantly lower growth of both L. reuteri and B. animalis than those of MPOS. Likewise, crude pectin extracted from sugar beet pulp showed lower response in growth of Lactobacillus and Bifidobacterium [36]. These results could be explained in that the longer the chain of pectin, the higher the degree of esterification with greatly methylated carbon sources that were more difficult to hydrolyse [20]. In the case of the positive control (glucose), it was found that the increase of cell density of both bacterial strains was significantly higher than that of MPOS at all incubation times. The result was in accordance with Soto [79] and Goderska et al. [80] who reported the higher growth trend of Lactobacillus in the MRS supplemented with glucose.
To have a closer look at the relationship of prebiotic concentration and probiotic growth of two probiotic types (L. reuteri and B. animalis), we then utilised the chemometric PCA. The first two dimensions of the PCA accounted for a total of 93.56% across the PCA score plot (PC1; 83.11% and PC2; 10.45% of the variance) (Figure 3c). It was also apparent that the MPOS-supplemented medium was active only with B. animalis (Figure 3d). This may be a result of the intracellular enzymes of Bifidobacterium which could hydrolyse the oligosaccharides into monosaccharides (glucose and fructose phosphates) and utilise them as a nutrient source [9,10]. In addition, Olano-Martin et al. [20] found that the oligosaccharide (apple pectin) delivered less growth performance with Lactobacillus.
It is worthwhile to note in the same figure that 2% MPOS corresponded well with B. animalis at 48 h of incubation time, while the higher concentration (4% MPOS) gave a good response with 72 h of fermentation time. We then assumed that higher viability of B. animalis required higher concentration of pectic oligosaccharide. In line with this, Ho et al. [9] reported that Bifidobacterium had the highest growth in the media containing 4% POS from citrus pectin, followed by 2% and 1% (w/v). They suggested that the higher the oligosaccharide concentration, the more carbon sources for bacterial survivors obtained.

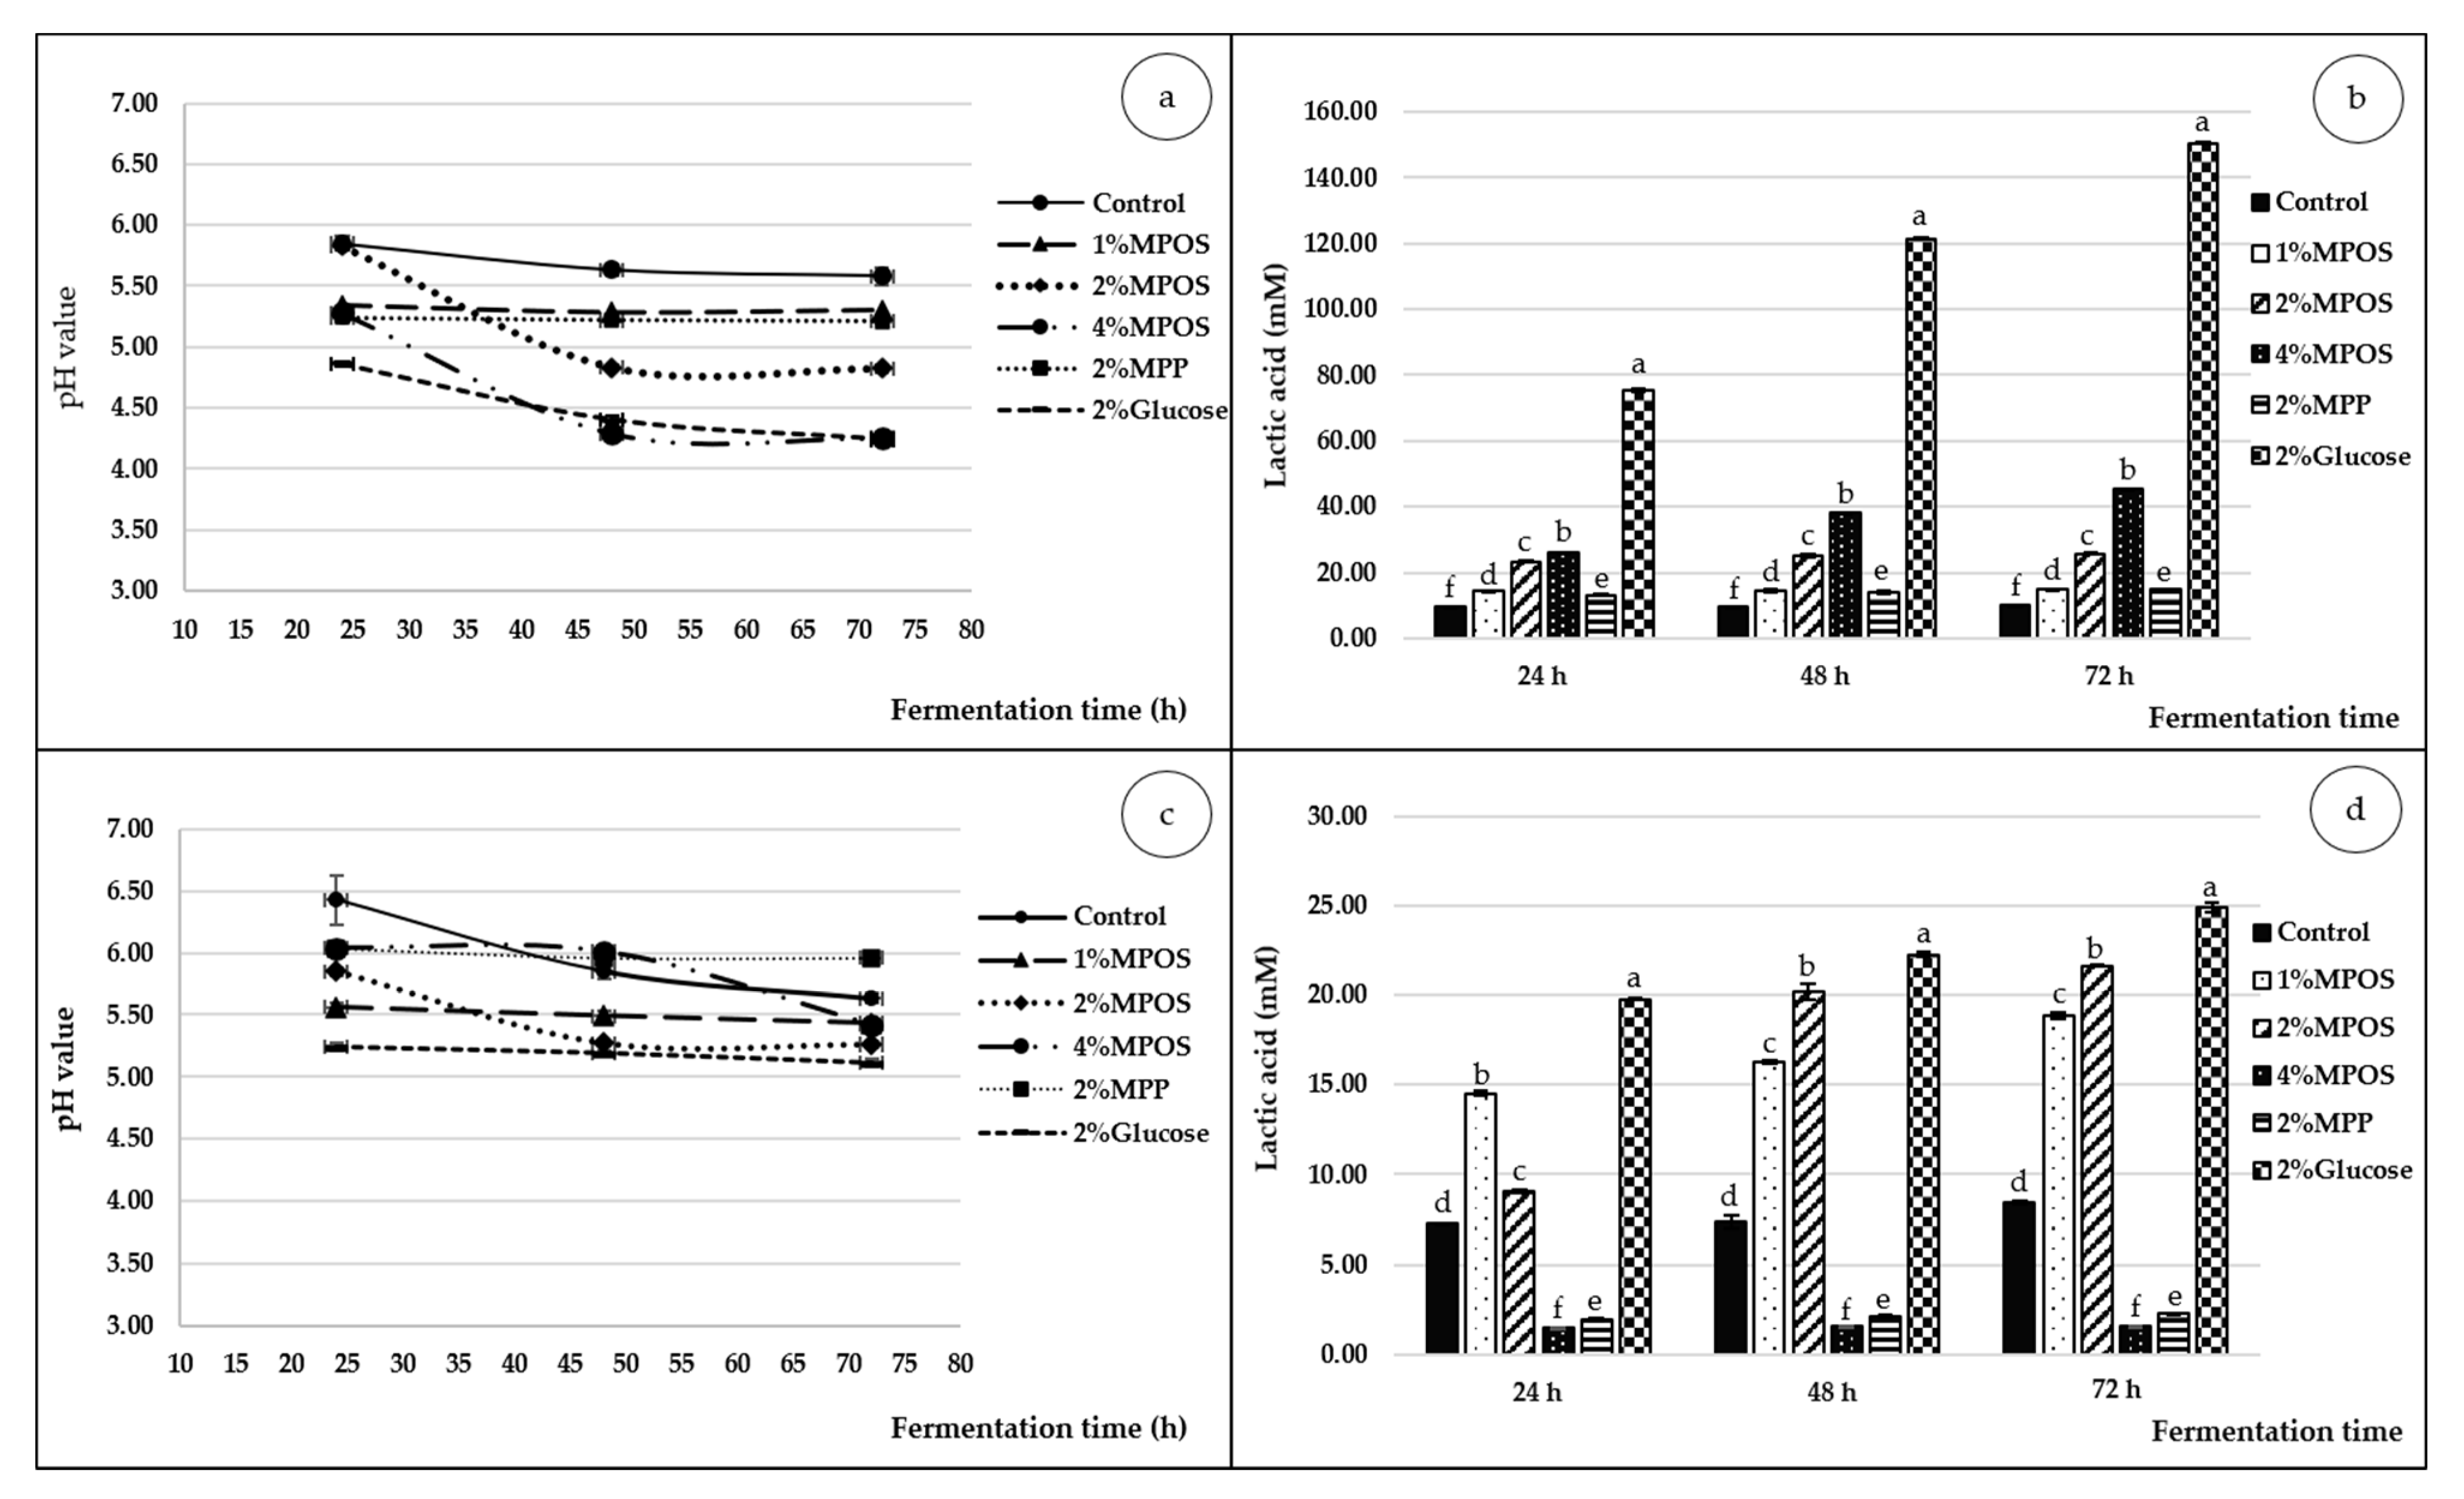
3.2.3. pH and Lactic Acid

The acidity alteration described as pH and lactic acid concentrations of media supplemented with various carbon sources is illustrated in Figure 4. Lactic acid is known as a by-product of bacterial anaerobic fermentation and is responsible for the reduction of pH in the media [9,81,82,83,84]. As shown in the figure, low pH and high lactic acid content (LA) were attained in both bacterial strains at longer fermentation time due to the oligosaccharide structure of MPOS substrate that was gradually degraded to small molecules of sugars which were later converted to LA via an anaerobic glycolysis pathway by the probiotic bacteria [85].
Different carbon sources obviously affected types of acidic products. The negative controls illustrated a higher pH and lower LA, while the positive control (glucose) largely provided the contrary results. It could be stated that glucose was metabolised rapidly by the probiotics as a non-prebiotic simple carbon source [86], thus a greater amount of LA and lower value of pH was achieved. This is in agreement with Usta-Gorgun and Yilmaz-Ersan [86] who also reported that glucose gave the lowest pH value, when correlated with media containing the prebiotics from orchid root. For prebiotic pectin, the higher the concentration of MPOS, the lower the pH value and the higher the lactic acid production obtained. This could be also explained by the zero order in substrate concentration and product formation [87]. Moreover, each bacterial strain can alter its fermentation ability to generate the distinctive acidic products when cultivated on different concentrations of oligosaccharides [65].
In comparison with the two tested bacterial strains, L. reuteri provided higher acidity and LA production in the media than that of B. animalis. These results were the same as reported in previous studies [9,80]. The higher LA content of L. reuteri was involved with the ability of enzymatic production (L-lactate dehydrogenase) for converting monosaccharides obtained from oligosaccharide degradation to lactic acid [48].

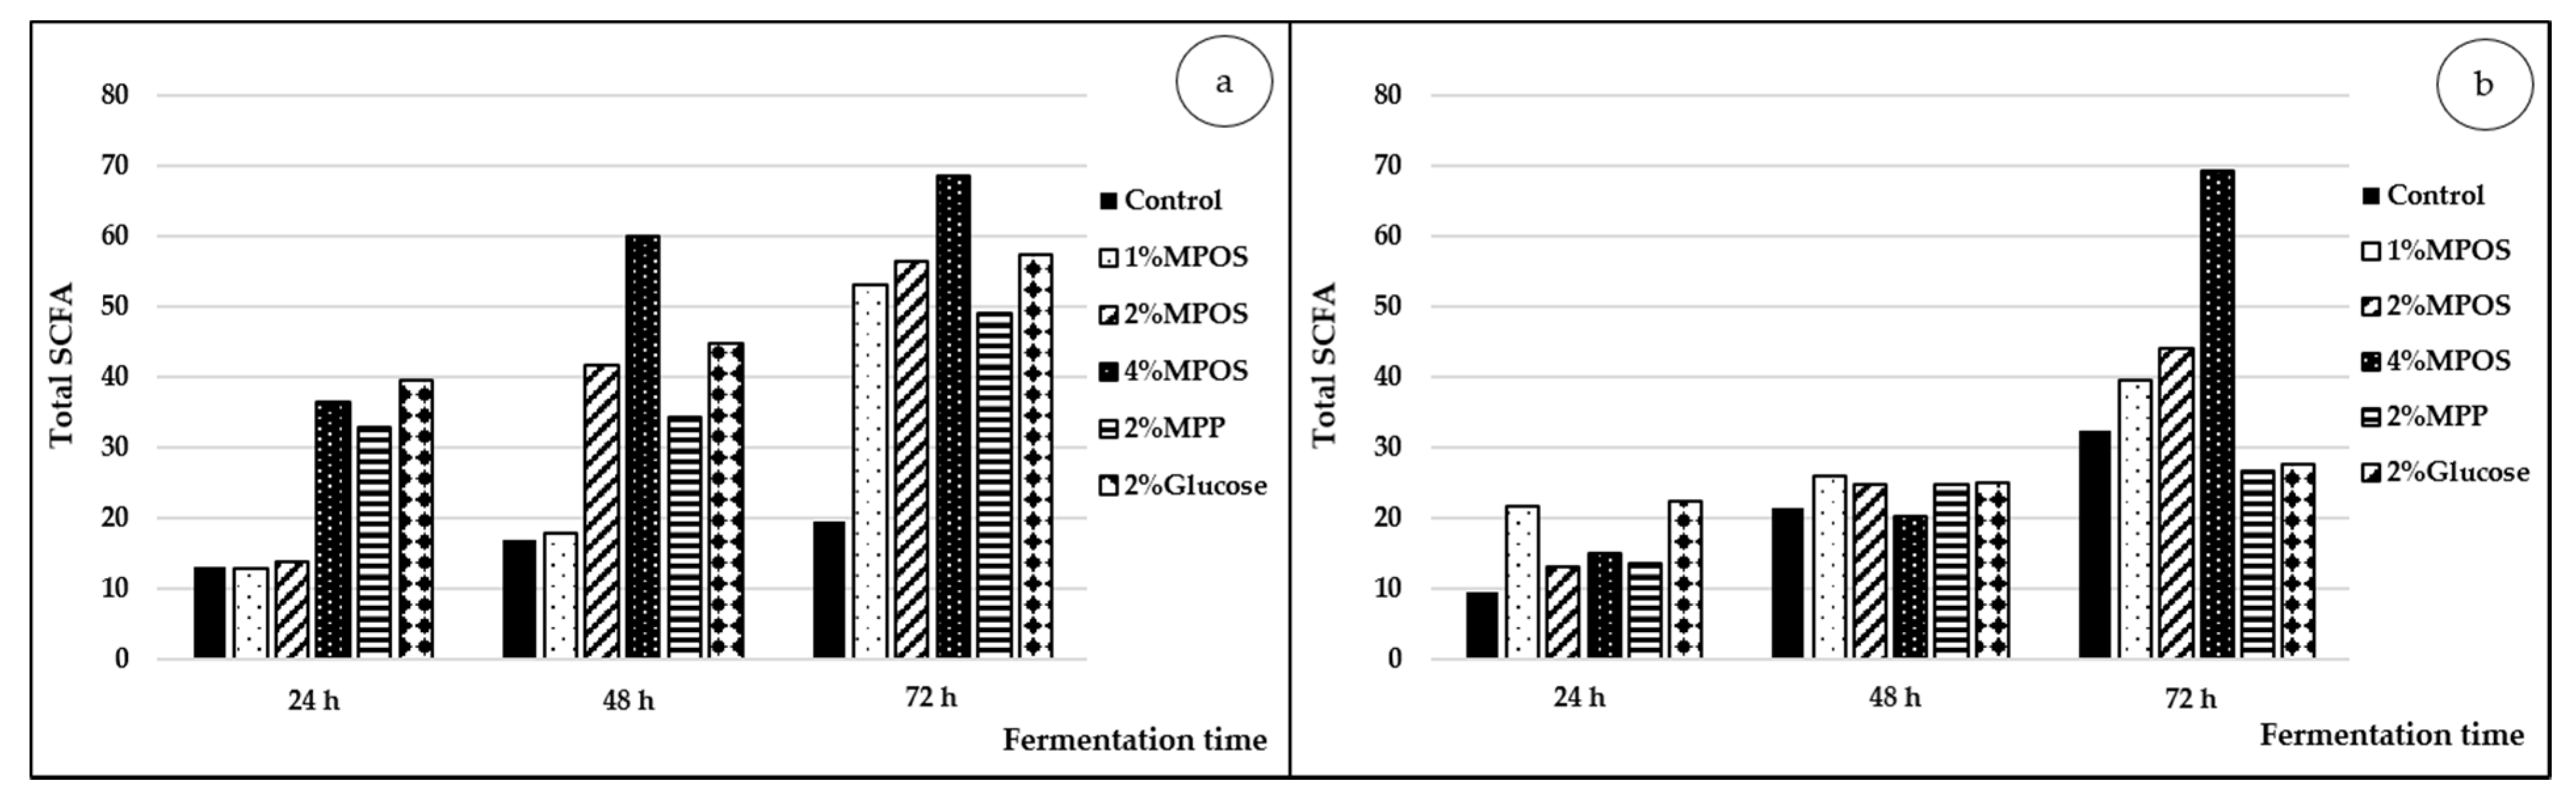
3.2.4. Short Chain Fatty Acid Production (SCFA)

SCFAs are generally produced through hexose and pentose pathways from the digestion of fibre and non-digestible carbohydrates of plant natural resources by probiotic bacteria [88,89]. Polysaccharide derived from fruits is known as the main source of SCFAs that promote human health benefits, including the reduction of harmful bacteria such as Clostridium and the enhancement of beneficial bacteria, as well as the stimulation of the intestinal immune system [90,91]. Montoya et al. [92] reported that kiwifruit fibre was a good source of SCFAs in both in vivo and in vitro fermentation systems. Changes in total SCFA contents after 24, 48 and 72 h of fermentation supplemented with different carbon sources are shown in Figure 5 (with the amounts of individual compounds shown in Supplementary Materials Tables S1 and S2). SCFAs were detected primarily at 24 h and increased consequently thereafter in all treatments for both of L. reuteri (Figure 5a) and B. animalis (Figure 5b). The initial total values were between 12.77–39.31 mM for L. reuteri and 9.48–22.19 mM for B. animalis. Similarly, fermentation time dependency with amount of SCFAs has been seen in other studies [33,34,35,93,94]. It is advised that bacteria usually digest dietary fibres to monosaccharides using glycoside hydrolases and then to SCFAs as the fermented products through carbon metabolic pathways during anaerobic fermentation. Thus, higher contents of end-products can be found much later in the fermentation process [95].
Among samples added with MPOS, the highest total SCFA value was obtained from the 4% supplementation, followed by that of 2% and 1%, whereas the negative CTRLs showed much lower concentrations. It appeared that a higher availability of substrates affected high production of SCFAs. Another factor that influenced SCFA production was the structure of the substrates. For example, oligosaccharide soluble fibres (i.e., fructooligosaccharides) gave a higher amount of SCFAs than the soluble fibres (i.e., longer-chain pectin), which may be due to the complex structure of pectin that limits the accessibility of bacteria and hydrolytic enzymes [96,97]. Gulfi et al. [98] added that the fermentation rate of partially hydrolysed pectins depended largely on their complexed structures.
The main SCFAs produced by both L. reuteri and B. animalis were acetic acid and propionic acid (as shown in the Supplementary Materials Tables S1 and S2). Both acids are known as the main SCFAs derived from pectic oligosaccharide fermentation [76]. Gómez et al. [36] also found that acetic acid was the most abundant SCFA, followed by propionic acid and butyric acid in pectic oligosaccharide obtained from lemon peel waste and sugar beet pulp. This is related to the dynamics of microbial population; these resources promote the growth of Bifidobacteria and Lactobacilli as acetate producers.
To further describe the qualitative and quantitative assessments of each carbon sources, we then presented the production ratio between LA and the total SCFAs as in Table 2. When compared only with the MPOS-supplemented samples, the highest ratios of ΔLA/ΔTotalSCFA for L. reuteri and B. animalis were 4% and 2%, respectively, which was clearly associated with the lactic acid content (Figure 2). It could be elucidated that the microbiota mostly generates LA as a common short chain hydroxy-fatty acid in intestinal lumen, in which it can be diverted to other SCFAs by lactate-fermenting bacterial species [99,100]. Similar findings also revealed that the supplementation of 2% orchid root fibre in the cultivation media of B. bifidum showed the highest ratio of ΔLA/ΔTotalSCFA [86]. In the case of the positive control, the maximum ratio of ΔLA/ΔTotalSCFA was simply recognised because the small molecule was easily transformed to a substantial amount of LA and SCFAs by both bacterial strains, whereas the negative controls had relatively low ratio values, which were also related to the production ability of LA and total SCFA.

4. Conclusions

In order to hydrolyse mango peel pectin to a pectic oligosaccharide form (MPOS), longer incubation and higher pectinase concentration were suggested. The monosaccharide compositions of MPOS were mainly fructose and glucose while arabinose had prominent influence on prebiotic potentials. In the fermentation study, B. animalis TISTR 2195 was the preferred type based on its intracellular enzyme that could utilise the MPOS as a nutrition source. A higher amount of MPOS could generate greater fermented by-products. This is the first study to report sustainable use of the functional components derived from by-products of Thai mango processing in the form of pectic oligosaccharide resources that positively enhanced the growth of probiotics.

Supplementary Materials

The following are available online at https://www.mdpi.com/2304-8158/10/3/627/s1, Table S1: Short chain fatty acid and lactic acid production of probiotic bacteria cultivated in medium added with various carbon sources at 24 to 72 h of fermentation time by L. reuteri DSM 17938, Table S2. Short chain fatty acid and lactic acid production of probiotic bacteria cultivated in medium added with vari-ous carbon sources at 24 to 72 h of fermentation time by B. animalis TISTR 2195, Table S3. Statistical analysis data using two-way ANOVA with Duncan’s multiple range test (p < 0.05) of optimisation condition of MPOS on glucose content in MPEP, Table S4. Statistical analysis data using two-way ANOVA with Duncan’s multiple range test (p < 0.05) of optimisation condition of MPOS on fructose content in MPEP, Table S5. Statistical analysis data using two-way ANOVA with Duncan’s multiple range test (p < 0.05) of optimisation condition of MPOS on galactose content in MPEP, Table S6. Statistical analysis data using two-way ANOVA with Duncan’s multiple range test (p < 0.05) of optimisation condition of MPOS on arabinose content in MPEP, Table S7. Statistical analysis data using two-way ANOVA with Duncan’s multiple range test (p < 0.05) of MPOS on prebiotic ac-tivity scores of L. reuteri, Table S8. Statistical analysis data using two-way ANOVA with Duncan’s multiple range test (p < 0.05) of MPOS on prebiotic ac-tivity scores of B. animalis.

Author Contributions

Conceptualization, S.R.S.; methodology, M.W. and S.R.S.; formal analysis, M.W.; investigation, M.W. and S.R.S.; writing—original draft preparation, M.W. and B.T.; writing—review and editing, S.R.S., M.W. and B.T.; supervision, S.R.S., P.H. and K.S.; project administration, M.W.; funding acquisition, N.L., K.J. and P.R. All authors have read and agreed to the published version of the manuscript.

Funding

This research project was supported by TSRI and was partially supported by Chiang Mai University.

Institutional Review Board Statement

Not applicable.

Informed Consent Statement

Not applicable.

Data Availability Statement

Not applicable.

Conflicts of Interest

The authors declare no conflict of interest. The funders had no role in the design of the study; in the collection, analyses, or interpretation of data; in the writing of the manuscript, or in the decision to publish the results.

References

  1. De Cindio, B.; Gabriele, D.; Lupi, F.R. Pectin: Properties Determination and Uses. In Encyclopedia of Food and Health; Caballero, B., Finglas, P.M., Toldrá, F., Eds.; Academic Press: Oxford, UK, 2016; pp. 294–300. [Google Scholar]
  2. Moslemi, M. Reviewing the recent advances in application of pectin for technical and health promotion purposes: From laboratory to market. Carbohydr. Polym. 2021, 254, 117324. [Google Scholar] [CrossRef]
  3. Wicker, L.; Kim, Y. Pectin and Health. In Encyclopedia of Food and Health; Caballero, B., Finglas, P.M., Toldrá, F., Eds.; Academic Press: Oxford, UK, 2016; pp. 289–293. [Google Scholar]
  4. Fissore, E.N.; Rojas, A.M.; Gerschenson, L.N. Rheological performance of pectin-enriched products isolated from red beet (Beta vulgaris L. var. conditiva) through alkaline and enzymatic treatments. Food Hydrocoll. 2012, 26, 249–260. [Google Scholar] [CrossRef]
  5. Vincken, J.P.; Schols, H.A.; Oomen, R.J.F.J.; McCann, M.C.; Ulvskov, P.; Voragen, A.G.J.; Visser, R.G.F. If homogalac-turonan were a side chain of rhamnogalacturonan I. implications for cell wall architecture. Plant Physiol. 2003, 132, 1781–1789. [Google Scholar] [CrossRef] [PubMed] [Green Version]
  6. Gullón, B.; Gómez, B.; Martínez-Sabajanes, M.; Yáñez, R.; Parajó, J.; Alonso, J. Pectic oligosaccharides: Manufacture and functional properties. Trends Food Sci. Technol. 2013, 30, 153–161. [Google Scholar] [CrossRef]
  7. Mohnen, D. Pectin structure and biosynthesis. Curr. Opin. Plant Biol. 2008, 11, 266–277. [Google Scholar] [CrossRef]
  8. Voragen, A.G.J.; Coenen, G.-J.; Verhoef, R.P.; Schols, H.A. Pectin, a versatile polysaccharide present in plant cell walls. Structural Chem. 2009, 20, 263–275. [Google Scholar] [CrossRef] [Green Version]
  9. Ho, Y.-Y.; Lin, C.-M.; Wu, M.-C. Evaluation of the prebiotic effects of citrus pectin hydrolysate. J. Food Drug Anal. 2017, 25, 550–558. [Google Scholar] [CrossRef] [PubMed]
  10. Babbar, N.; Dejonghe, W.; Gatti, M.; Sforza, S.; Elst, K. Pectic oligosaccharides from agricultural by-products: Production, characterization and health benefits. Crit. Rev. Biotechnol. 2015, 36, 594–606. [Google Scholar] [CrossRef] [PubMed]
  11. Zhang, S.; Hu, H.; Wang, L.; Liu, F.; Pan, S. Preparation and prebiotic potential of pectin oligosaccharides obtained from citrus peel pectin. Food Chem. 2018, 244, 232–237. [Google Scholar] [CrossRef] [PubMed]
  12. Gibson, G.R.; Probert, H.M.; Van Loo, J.; Rastall, R.A.; Roberfroid, M.B. Dietary modulation of the human colonic microbiota: Updating the concept of prebiotics. Nutr. Res. Rev. 2004, 17, 259–275. [Google Scholar] [CrossRef] [Green Version]
  13. Gibson, G.R.; Hutkins, R.; Sanders, M.E.; Prescott, S.L.; Reimer, R.A.; Salminen, S.J.; Scott, K.; Stanton, C.; Swanson, K.S.; Cani, P.D.; et al. Expert consensus document: The International Scientific Association for Probiotics and Prebiotics (ISAPP) consensus statement on the definition and scope of prebiotics. Nat. Rev. Gastroenterol. Hepatol. 2017, 14, 491–502. [Google Scholar] [CrossRef] [Green Version]
  14. Mu, Q.; Tavella, V.J.; Luo, X.M. Role of Lactobacillus reuteri in human health and diseases. Front. Microbiol. 2018, 9, 757. [Google Scholar] [CrossRef]
  15. Jungersen, M.; Anette, W.; Eric Johansen, E.; Jeffrey, E.; Christensen, J.E.; Stuer-Lauridsen, B.; Eskesen, D. The science behind the probiotic strain Bifidobacterium animalis subsp. lactis BB-12®. Microorganisms 2014, 2, 92–110. [Google Scholar] [CrossRef] [PubMed]
  16. Lang, J.M.; Eisen, J.A.; Zivkovic, A.M. The microbes we eat: Abundance and taxonomy of microbes consumed in a day’s worth of meals for three diet types. PeerJ 2014, 2, e659. [Google Scholar] [CrossRef] [PubMed]
  17. Gibson, G.R.; Roberfroid, M.B. Dietary modulation of the human colonic microbiota: Introducing the concept of prebiotics. J. Nutr. 1995, 125, 1401–1412. [Google Scholar] [CrossRef] [PubMed]
  18. Aziz, Q.; Doré, J.; Emmanuel, A.; Guarner, F.; Quigley, E.M.M. Gut microbiota and gastrointestinal health: Current concepts and future directions. Neurogastroenterol. Motil. 2013, 25, 4–15. [Google Scholar] [CrossRef]
  19. Binns, N. Probiotics, Prebiotics and the Gut Microbiota; ILSI Europe International Life Sciences Institute: Washington, DC, USA, 2013; p. 33. [Google Scholar]
  20. Olano-Martin, E.; Gibson, G.R.; Rastell, R.A. Comparison of the in vitro bifidogenic properties of pectins and pectic oligosaccharides. J. Appl. Microbiol. 2002, 93, 505–511. [Google Scholar] [CrossRef] [Green Version]
  21. Manderson, K.; Pinart, M.; Tuohy, K.M.; Grace, W.E.; Hotchkiss, A.T.; Widmer, W.; Yadhav, M.P.; Gibson, G.R.; Rastall, R.A. In vitro determination of prebiotic properties of oligosaccharides derived from an orange juice manufacturing by-product stream. Appl. Environ. Microbiol. 2005, 71, 8383–8389. [Google Scholar] [CrossRef] [Green Version]
  22. Mandalari, G.; Palop, C.N.; Tuohy, K.; Gibson, G.R.; Bennett, R.N.; Waldron, K.W.; Bisignano, G.; Narbad, A.; Faulds, C.B. In vitro evaluation of the prebiotic activity of a pectic oligosaccharide-rich extract enzymatically derived from bergamot peel. Appl. Microbiol. Biotechnol. 2006, 73, 1173–1179. [Google Scholar] [CrossRef]
  23. Kang, H.J.; Jo, C.; Kwon, J.H.; Son, J.H.; An, B.J.; Byun, M.W. Antioxidant and cancer cell proliferation inhibition effect of citrus pectin-oligosaccharide prepared by irradiation. J. Med. Food 2006, 9, 313–320. [Google Scholar] [CrossRef]
  24. Li, P.-J.; Xia, J.-L.; Nie, Z.-Y.; Shan, Y. Pectic oligosaccharides hydrolyzed from orange peel by fungal multi-enzyme complexes and their prebiotic and antibacterial potentials. LWT-Food Sci. Technol. 2016, 69, 203–210. [Google Scholar] [CrossRef]
  25. Li, T.; Li, S.; Dong, Y.; Zhu, R.; Liu, Y. Antioxidant activity of penta-oligogalacturonide, isolated from haw pectin, suppresses triglyceride synthesis in mice fed with a high-fat diet. Food Chem. 2014, 145, 335–341. [Google Scholar] [CrossRef] [PubMed]
  26. Olano-Martin, E.; Williams, M.; Gibson, G.; Rastall, R. Pectins and pectic-oligosaccharides inhibit Escherichia coli O157:H7 Shiga toxin as directed towards the human colonic cell line HT29. FEMS Microbiol. Lett. 2003, 218, 101–105. [Google Scholar] [CrossRef] [PubMed]
  27. Concha, O.J.; Zúñiga, H.M.E. Enzymatic depolymerization of sugar beet pulp: Production and characterization of pectin and pectic-oligosaccharides as a potential source for functional carbohydrates. Chem. Eng. J. 2012, 192, 29–36. [Google Scholar] [CrossRef]
  28. Sabajanes, M.M.; Yáñez, R.; Alonso, J.L.; Parajó, J.C. Pectic oligosaccharides production from orange peel waste by enzymatic hydrolysis. Int. J. Food Sci. Technol. 2012, 47, 747–754. [Google Scholar] [CrossRef]
  29. Huang, P.-H.; Fu, L.-C.; Huang, C.-S.; Wang, Y.-T.; Wu, M.-C. The uptake of oligogalacturonide and its effect on growth inhibition, lactate dehydrogenase activity and galactin-3 release of human cancer cells. Food Chem. 2012, 132, 1987–1995. [Google Scholar] [CrossRef]
  30. Babbar, N.; Dejonghe, W.; Sforza, S.; Elst, K. Enzymatic pectic oligosaccharides (POS) production from sugar beet pulp using response surface methodology. J. Food Sci. Technol. 2017, 54, 3707–3715. [Google Scholar] [CrossRef]
  31. Moura, F.; Macagnan, F.; Silva, L. Oligosaccharide production by hydrolysis of polysaccharides: A review. Int. J. Food Sci. Technol. 2014, 50, 275–281. [Google Scholar] [CrossRef]
  32. Gómez, B.; Gullón, B.; Yáñez, R.; Parajó, J.C.; Alonso, J.L. Pectic oligosacharides from lemon peel wastes: Production, purification, and chemical characterization. J. Agric. Food Chem. 2013, 61, 10043–10053. [Google Scholar] [CrossRef]
  33. Zhu, R.; Mengling, H.; Chunyun, Z.; Lijiao, Z.; Congya, W.; Liu, J.; Zhenhua, D.; Shang, F.; Hu, F.; Tiejing, L.; et al. Pectin oligosaccharides from hawthorn (Crataegus pinnatifida Bunge. var. major) inhibit the formation of advanced glycation end products in infant formula milk powder. Food Funct. 2019, 10, 8081–8093. [Google Scholar] [CrossRef]
  34. Gómez, B.; Gullón, B.; Yáñez, R.A.; Schols, H.; Alonso, J.L. Prebiotic potential of pectins and pectic oligosaccharides derived from lemon peel wastes and sugar beet pulp: A comparative evaluation. J. Funct. Foods 2016, 20, 108–121. [Google Scholar] [CrossRef]
  35. Foo, K.Y.; Hameed, B.H. Transformation of durian biomass into a highly valuable end commodity: Trends and opportunities. Biomass Bioenergy 2011, 35, 2470–2478. [Google Scholar] [CrossRef]
  36. Casabar, J.T.; Ramaraj, R.; Tipnee, S.; Unpaprom, Y. Enhancement of hydrolysis with Trichoderma harzianum for bioethanol production of sonicated pineapple fruit peel. Fuel 2020, 279, 118437. [Google Scholar] [CrossRef]
  37. Wilaipon, P. The effects of briquetting pressure on banana-peel briquette and the banana waste in Northern Thailand. American. J. Appl. Sci. 2009, 6, 167–171. [Google Scholar]
  38. Maneenpun, S.; Yunchalad, M. Developing processed mango products for international markets. ACTA Hortic. 2004, 645, 93–105. [Google Scholar] [CrossRef]
  39. Vieira, W.A.S.; Michereff, S.J.; de Morais, M.A.; Hyde, K.D.; Câmara, M.P.S. Endophytic species of Colletotrichum associated with mango in northeastern Brazil. Fungal Divers. 2014, 67, 181–202. [Google Scholar] [CrossRef]
  40. Larrauri, J.A.; Rupérez, P.; Borroto, B.; Saura-Calixto, F. Mango peels as a new tropical fibre: Preparation and characterization. LWT-Food Sci. Technol 1996, 29, 729–733. [Google Scholar] [CrossRef]
  41. Topuz, O.K.; Yerlikaya, P.; Uçak, İ.; Gümüş, B.; Büyükbenli, H.A.; Gökoğlu, N. Influence of pomegranate peel (Punica granatum) extract on lipid oxidation in anchovy fish oil under heat accelerated conditions. J. Food Sci. Technol. 2015, 52, 625–632. [Google Scholar] [CrossRef]
  42. Geerkens, C.; Nagel, A.; Just, K.; Miller-Rostek, P.; Kammerer, D.; Schweiggert, R.; Carle, R. Mango pectin quality as influenced by cultivar, ripeness, peel particle size, blanching, drying, and irradiation. Food Hydrocoll. 2015, 51, 241–251. [Google Scholar] [CrossRef]
  43. Sayago-Ayerdi, S.G.; Zamora-Gasga, V.M.; Venema, K. Prebiotic effect of predigested mango peel on gut microbiota assessed in a dynamic in vitro model of the human colon (TIM-2). Food Res. Int. 2019, 118, 89–95. [Google Scholar] [CrossRef]
  44. Ajila, C.M.; Prasada, R.U.J.S. Mango peel dietary fibre: Composition and associated bound phenolics. J. Funct. Foods 2013, 5, 444–450. [Google Scholar] [CrossRef]
  45. Sommano, S.; Ounamornmas, P.; Nisoa, M.; Sriwattana, S.; Page, P.; Colelli, G. Characterisation and physiochemical properties of mango peel pectin extracted by conventional and phase control microwave-assisted extractions. Int. Food Res. J. 2018, 25, 2657–2665. [Google Scholar]
  46. Garcia-Magaña, L.; Garcia, H.; Bello-Pérez, L.; Sayago-Ayerdi, S.; Oca, M. Functional properties and dietary fiber characterization of mango processing by-products (Mangifera indica L., cv Ataulfo and Tommy Atkins). Plant Foods Hum. Nutr. 2013, 68, 254–258. [Google Scholar] [CrossRef] [PubMed]
  47. Sommano, S.; Ounamornmas, P.; Nisoa, M.; Sriwattana, S. Bioactive functionality of pectin from peels of seven Thai mango cultivars. ACTA Hortic. 2018, 423–428. [Google Scholar] [CrossRef]
  48. Holbrook, J.J. Protein fluorescence of lactate dehydrogenase. Biochem. J. 1972, 128, 921–931. [Google Scholar] [CrossRef] [PubMed] [Green Version]
  49. De Man, J.C.; Rogosa, M.; Sharpe, M.E. A medium for the cultivation of lactobacilli. J. Appl. Bacteriol. 1960, 23, 130–135. [Google Scholar] [CrossRef]
  50. Nebra, Y.; Blanch, A.R. A New Selective Medium for Bifidobacterium spp. Appl. Environ. Microbiol. 1999, 65, 5173–5176. [Google Scholar] [CrossRef] [Green Version]
  51. Sezonov, G.; Joseleau-Petit, D.; D’Ari, R. Escherichia coli physiology in Luria-Bertani broth. J. Bacteriol. 2007, 189, 8746–8749. [Google Scholar] [CrossRef] [Green Version]
  52. Wongkaew, M.; Sommano, S.; Tangpao, T.; Rachtanapun, P.; Jantanasakulwong, K. Mango peel pectin by micro-wave-assisted extraction and its use as fat replacement in dried Chinese sausage. Foods 2020, 9, 450. [Google Scholar] [CrossRef] [Green Version]
  53. Guandalini, B.B.V.; Rodrigues, N.P.; Marczak, L.D.F. Sequential extraction of phenolics and pectin from mango peel assisted by ultrasound. Food Res. Int. 2019, 119, 455–461. [Google Scholar] [CrossRef]
  54. Huang, P.-H.; Lu, H.-T.; Wang, Y.-T.; Wu, M.-C. Antioxidant activity and emulsion-stabilizing effect of pectic enzyme treated pectin in soy protein isolate-stabilized oil/water emulsion. J. Agric. Food Chem. 2011, 59, 9623–9628. [Google Scholar] [CrossRef]
  55. Yang, K.; Zhang, Y.; Cai, M.; Guan, R.; Neng, J.; Pi, X.; Sun, P. In vitro prebiotic activities of oligosaccharides from the by-products in Ganoderma lucidum spore polysaccharide extraction. RSC Adv. 2020, 10, 14794–14802. [Google Scholar] [CrossRef] [Green Version]
  56. Tieking, M.; Kühnl, W. Evidence for formation of heterooligosaccharides by Lactobacillus sanfranciscensis during growth in wheat sourdough. J. Agric. Food Chem. 2005, 53, 2456–2461. [Google Scholar] [CrossRef]
  57. Schwab, C.; Gänzle, M.G. Effect of membrane lateral pressure on the expression of fructosyltransferases in Lactobacillus reuteri. Syst. Appl. Microbiol. 2006, 29, 89–99. [Google Scholar] [CrossRef]
  58. Huebner, J.; Wehling, R.; Hutkins, R. Functional activity of commercial prebiotics. Int. Dairy J. 2007, 17, 770–775. [Google Scholar] [CrossRef]
  59. Wichienchot, S.P.T.; Jongjareonrak, A.; Chansuwan, W.; Preeya Hmadhlu, P.; Itharat, A.; Ooraikul, B. Extraction and analysis of prebiotics from selected plants from southern Thailand, Songklanakarin. J. Sci. Technol. 2011, 33, 517–523. [Google Scholar]
  60. DuBois, M.A.E.; Hamilton, J.K.; Rebers, P.; Smith, F. Calorimetric dubois method for determination of sugar and related substances. Anal. Chem. 2002, 28, 350–356. [Google Scholar] [CrossRef]
  61. Robertson, J.A.; Ryden, P.; Louise., B.R.; Reading., S.; Gibson., G.; Ring., S.G. Structural properties of diet-derived polysaccharides and their influence on butyrate production during fermentation. LWT-Food Sci. Technol. 2001, 34, 567–573. [Google Scholar] [CrossRef]
  62. Campbell, J. High-Throughput assessment of bacterial growth inhibition by optical density measurements. Curr. Protoc. Chem. Biol. 2010, 2, 195–208. [Google Scholar] [CrossRef] [PubMed] [Green Version]
  63. Ginjupalli, K.; Karthik, A.; Shavi, G.; Averineni, R.K.; Bhat, M.; Udupa, N. Development of RP-HPLC method for simultaneous estimation of lactic acid and glycolic acid. Der Pharma. Chem. 2013, 5, 335–340. [Google Scholar]
  64. Filípek, J.; Dvořák, R. Determination of the volatile fatty acid content in the rumen liquid: Comparison of gas chromatography and capillary isotachophoresis. ACTA Vet. Brno 2009, 78, 627–633. [Google Scholar] [CrossRef]
  65. Ivanova, T.; Iliev, I.; Kirilov, N.; Vasileva, T.; Dalgalarrondo, M.; Haertlé, T.; Chobert, J.-M.; Ivanova, I. Effect of oligosaccharides on the growth of Lactobacillus delbrueckii subsp bulgaricus strains isolated from dairy products. J. Agric. Food Chem. 2009, 57, 9496–9502. [Google Scholar]
  66. Grahame, D.; Bryksa, B.; Yada, R. Factors affecting enzyme activity. In Improving and Tailoring Enzymes for Food Quality and Functionality; Elsevier BV, Woodhead Publishing: Cambridgeshire, UK, 2015; pp. 11–55. [Google Scholar]
  67. Cano, M.E.; García-Martín, A.; Morales, P.; Wojtusik, M.; Santos, V.; Kovensky, J.; Ladero, M. Production of oligosaccharides from agrofood wastes. Fermentation 2020, 6, 31. [Google Scholar] [CrossRef] [Green Version]
  68. Dasaesamoh, R.; Youravong, W.; Wichienchot, S. Optimization on pectinase extraction and purification by yeast fermentation of oligosaccharides from dragon fruit (Hyloceus undatus). Int. Food Res. J. 2016, 23, 2601–2607. [Google Scholar]
  69. Thitiratsakul, B.; Anprung, P. Prebiotic activity score and bioactive compounds in longan (Dimocarpus longan Lour.): Influence of pectinase in enzyme-assisted extraction. J. Food Sci. Technol. 2014, 51, 1947–1955. [Google Scholar] [CrossRef] [Green Version]
  70. Fasawang, N.; Anprung, P. Antioxidant and prebiotic activity of enzymatically hydrolyzed lychee fruit pulp. Food Technol. Biotechnol. 2014, 52, 300–306. [Google Scholar]
  71. Gopal, P.K.A.; Sullivan, P.; Smart, J.B. Utilisation of galactooligosaccharides as selective substrates for growth by lactic acid bacteria including Bifidobacterium lactis DR10 and Lactobacillus rhamnosus DR20. Int. Dairy J. 2001, 11, 19–25. [Google Scholar] [CrossRef]
  72. Mueller, M.; Čavarkapa, A.; Unger, F.M.; Viernstein, H.; Praznik, W. Prebiotic potential of neutral oligo- and polysaccharides from seed mucilage of Hyptis suaveolens. Food Chem. 2017, 221, 508–514. [Google Scholar] [CrossRef]
  73. Møller, P.L.; Jørgensen, F.; Hansen, O.C.; Madsen, S.M.; Stougaard, P. Intra- and extracellular beta-galactosidases from Bifidobacterium bifidum and B. infantis: Molecular cloning, heterologous expression, and comparative characterization. Appl. Environ. Microbiol. 2001, 67, 2276–2283. [Google Scholar] [CrossRef] [Green Version]
  74. Figueroa-González, I.; Rodríguez-Serrano, G.; Gómez-Ruiz, L.; García-Garibay, M.; Cruz-Guerrero, A. Prebiotic effect of commercial saccharides on probiotic bacteria isolated from commercial products. Food Sci. Technol. 2019, 39, 747–753. [Google Scholar] [CrossRef] [Green Version]
  75. Chengming, S.; Lu, J.; Li, B.; Lin, W.; Zhang, Z.; Weiwei, C.; Sun, C.; Chi, M.; Bingjun, Y.; Yang, B.; et al. Effect of Functional Oligosaccharides and Ordinary Dietary Fiber on Intestinal Microbiota Diversity. Front. Microbiol. 2017, 8, 1750. [Google Scholar] [CrossRef] [PubMed] [Green Version]
  76. Dongowski, G.; Lorenz, A. Unsaturated oligogalacturonic acids are generated by in vitro treatment of pectin with human faecal flora. Carbohydr. Res. 1998, 314, 237–244. [Google Scholar] [CrossRef]
  77. Kneifel, W.; Rajal, A.; Kulbe, K.D. In vitro growth behaviour of probiotic bacteria in culture media with carbohydrates of prebiotic importance. Microb. Ecol. Health Dis. 2000, 12, 27–34. [Google Scholar] [CrossRef]
  78. Paulton, R.J.L. The bacterial growth curve. J. Biol. Educ. 1991, 25, 92–94. [Google Scholar] [CrossRef]
  79. Soto, C. Effect of isomaltooligosaccharide and gentiooligosaccharide on the growth and fatty acid profile of Lactobacillus plantarum. Electron. J. Biotechnol. 2013, 16, 1–10. [Google Scholar] [CrossRef]
  80. Goderska, K.; Nowak, J.; Czarnecki, Z. Comparison of the growth of Lactobacillus acidophilus and Bifidobacterium bifidum species in media supplemented with selected saccharides including prebiotics. ACTA Sci. Pol. Technol. Aliment. 2008, 7, 5–20. [Google Scholar]
  81. Mora-Villalobos, J.A.; Montero-Zamora, J.; Barboza, N.; Rojas-Garbanzo, C.; Usaga, J.; Redondo-Solano, M.; Schroedter, L.; Olszewska-Widdrat, A.; López-Gómez, J.P. Multi-product lactic acid bacteria fermentations: A Review. Fermentation 2020, 6, 23. [Google Scholar] [CrossRef] [Green Version]
  82. Li, W.; Zhang, Y.; Li, H.; Zhang, C.; Zhang, J.; Uddin, J.; Liu, X. Effect of soybean oligopeptide on the growth and metabolism of Lactobacillus acidophilus JCM 1132. RSC Adv. 2020, 10, 16737–16748. [Google Scholar] [CrossRef]
  83. Narendranath, N.V.; Power, R. Relationship between pH and medium dissolved solids in terms of growth and metabolism of Lactobacilli and Saccharomyces cerevisiae during ethanol production. Appl. Environ. Microbiol. 2005, 71, 2239–2243. [Google Scholar] [CrossRef] [Green Version]
  84. Śliżewska, K.; Chlebicz-Wójcik, A. Growth kinetics of probiotic Lactobacillus strains in the alternative, cost-efficient semi-solid fermentation medium. Biology 2020, 9, 423. [Google Scholar] [CrossRef]
  85. Naifeh, J.; Dimri, M.; Varacallo, M. Biochemistry, Aerobic Glycolysis; StatPearls Publishing: Treasure Island, FL, USA, 2020; p. 37. [Google Scholar]
  86. Usta-Gorgun, B.; Yilmaz-Ersan, L. Short-chain fatty acids production by Bifidobacterium species in the presence of salep. Electron. J. Biotechnol. 2020, 47, 29–35. [Google Scholar] [CrossRef]
  87. Okpokwasili, G.; Nweke, C.O. Microbial growth and substrate utilization kinetics. Afr. J. Biotechnol. 2006, 5, 305–317. [Google Scholar]
  88. Chaia, A.P.A.; Oliver, G.J. Intestinal microflora and metabolic activity gut flora. Nutr. Immun. Health 2008, 77–98. [Google Scholar] [CrossRef]
  89. Markowiak-Kopeć, P.; Śliżewska, K. The effect of probiotics on the production of short-chain fatty acids by human intestinal microbiome. Nutrients 2020, 12, 1107. [Google Scholar] [CrossRef] [PubMed]
  90. Jun, H.-I.; Lee, C.-H.; Song, G.-S.; Kim, Y.-S. Characterization of the pectic polysaccharides from pumpkin peel. LWT 2006, 39, 554–561. [Google Scholar] [CrossRef]
  91. Topping, D.L.; Clifton, P.M. Short-chain fatty acids and human colonic function: Roles of resistant starch and nonstarch polysaccharides. Physiol. Rev. 2001, 81, 1031–1064. [Google Scholar] [CrossRef]
  92. Montoya, C.A.; Rutherfurd, S.M.; Moughan, P.J. Kiwifruit fibre level influences the predicted production and absorption of SCFA in the hindgut of growing pigs using a combined in vivo–in vitro digestion methodology. Br. J. Nutr. 2016, 115, 1317–1324. [Google Scholar] [CrossRef] [PubMed] [Green Version]
  93. Wilkowska, A.; Nowak, A.; Antczak-Chrobot, A.; Motyl, I.; Czyżowska, A.; Paliwoda, A. Structurally different pectic oligosaccharides produced from apple pomace and their biological activity in vitro. Foods 2019, 8, 365. [Google Scholar] [CrossRef] [PubMed] [Green Version]
  94. Chen, J.; Liang, R.-H.; Liu, W.; Li, T.; Liu, C.-M.; Wu, S.-S.; Wang, Z.-J. Pectic-oligosaccharides prepared by dynamic high-pressure microfluidization and their in vitro fermentation properties. Carbohydr. Polym. 2013, 91, 175–182. [Google Scholar] [CrossRef]
  95. Wang, M.; Wichienchot, S.; He, X.; Fu, X.; Huang, Q.; Zhang, B. In vitro colonic fermentation of dietary fibers: Fermentation rate, short-chain fatty acid production and changes in microbiota. Trends Food Sci. Technol. 2019, 88, 1–9. [Google Scholar] [CrossRef]
  96. Slavin, J. Fiber and prebiotics: Mechanisms and health benefits. Nutrients 2013, 5, 1417. [Google Scholar] [CrossRef] [PubMed] [Green Version]
  97. Lebet, V.; Arrigoni, E.; Amadò, R. Measurement of fermentation products and substrate disappearance during incubation of dietary fibre sources with human faecal flora. LWT 1998, 31, 473–479. [Google Scholar] [CrossRef]
  98. Gulfi, M.; Arrigoni, E.; Amado, R. Influence of structure on in vitro fermentability of commercial pectins and partially hydrolysed pectin preparations. Carbohydr. Polym. 2005, 59, 247–255. [Google Scholar] [CrossRef]
  99. Hijova, E.; Chmelarova, A. Short chain fatty acids and colonic health. Bratisl Lek List. 2007, 108, 354–358. [Google Scholar]
  100. Hoque, R.; Farooq, A.; Ghani, A.; Gorelick, F.; Mehal, W.Z. Lactate reduces liver and pancreatic injury in toll-like receptor– and inflammasome-mediated inflammation via GPR81-mediated suppression of innate immunity. Gastroenterology 2014, 146, 1763–1774. [Google Scholar] [CrossRef] [PubMed] [Green Version]
Figure 1. Prebiotic activity scores of MPOS obtained from MPP hydrolysed using various concentrations of pectinase (0.1, 0.2, 0.3% (v/v)) at different hydrolysis times (6, 12, 24 h) of L. reuteri DSM 17938 (a) and B. animalis TISTR 2195 (b). Different letters on the bars in the same hydrolysis times indicate statistically significant differences (p < 0.05). The chemometric PCA of monosaccharide compositions and prebiotic activity scores of L. reuteri DSM 17938 (c) and B. animalis TISTR 2195 (d).
Foods 10 00627 g001
Figure 2. Indigestible oligosaccharide of L. reuteri DSM 17938 (a) and B. animalis TISTR 2195 (b) in the media supplemented with different contents of MPOS and 2% MPP (control) cultivated for 72 h of fermentation time. Different letters on the bars in the same fermentation time indicate statistically significant differences (p < 0.05).
Foods 10 00627 g002
Figure 3. The populations (log CFU/mL) of L. reuteri DSM 17938 (a) and B. animalis TISTR 2195 (b) inoculated at 4 log CFU/mL in the medium supplemented with different carbon sources. The chemometric PCA ((c) = score plot and (d) = biplot) illustrates the relationship between prebiotic concentration and probiotic growth (L = L. reuteri and B = B. animalis) at each fermentation time (24, 48 and 72 h). Error bars represent standard deviation (p < 0.05).
Foods 10 00627 g003
Figure 4. pH and lactic acid of L. reuteri DSM 17938 (a,b) and B. animalis TISTR 2195 (c,d) cultivated in media supplemented with different carbon sources for 72 h of fermentation time. Different letters on the bars in the same fermentation time indicate statistically significant differences (p < 0.05).
Foods 10 00627 g004
Figure 5. Total short chain fatty acid production of L. reuteri DSM 17938 (a) and B. animalis TISTR 2195 (b) cultivated in media supplemented with different carbon sources for 72 h of fermentation time.
Foods 10 00627 g005
Table 1. Chemical characteristics of mango peel pectin extracted from “chok anan” variety before hydrolysis and molecular weight and sugar content of MPOS.
Chemical Characteristic of “Chok Anan” Mango Peel Pectin (Initial MPP)Pectin Yield (%)Degree of Esterification (%)Equivalent Weight (mg/mol)Methoxyl Content (%)
15.06 ± 0.2956.88 ± 0.781037.30 ± 4.96 4.00 ± 0.03
Hydrolysis Time (h)Enzyme Concentration (%v/v)Molecular Weight (Da)Monosaccharide Content (%w/w)
GlucoseFructoseGalactoseArabinoseXylose
Initial MPP--6.28 ± 0.035.43 ± 0.080.75 ± 0.030.25 ± 0.02Tr
60.1<1000 (790)14.08 ± 0.23 e18.79 ± 0.15 e2.07 ± 0.00 i1.07 ± 0.04 iTr
0.2<1000 (759)14.35 ± 0.18 e18.72 ± 0.14 e2.18 ± 0.00 h1.33 ± 0.04 hTr
0.3<1000 (737)14.37 ± 0.17 e18.99 ± 0.13 e2.34 ± 0.02 g1.47 ± 0.00 gTr
120.1<1000 (697)15.61 ± 0.30 d20.47 ± 0.23 d2.76 ± 0.00 f1.68 ± 0.07 fTr
0.2<1000 (693)16.52 ± 0.00 c20.56 ± 0.40 d2.81 ± 0.03 e1.91 ± 0.00 eTr
0.3<1000 (681)17.93 ± 0.30 b21.43 ± 0.19 c2.88 ± 0.02 d2.13 ± 0.03 dTr
240.1<1000 (666)19.01 ± 0.19 a22.49 ± 0.16 b3.05 ± 0.02 c2.31 ± 0.02 cTr
0.2<1000 (660)19.21 ± 0.48 a22.70 ± 0.23 b3.10 ± 0.01 b2.40 ± 0.01 bTr
0.3<1000 (643)19.52 ± 0.55 a24.41 ± 1.02 a3.35 ± 0.01 a3.02 ± 0.03 aTr
Time (T)-****n/a
Enzyme concentration (E)-****n/a
T*E-****n/a
The result of the molecular weight detected <1000 Da in all samples using ultrahydrogel linear 1 column. Numbers in the brackets are the Mz values reported from the built-in software. Average ± standard deviation with different subscription letters in each row (treatment) is significantly different (p < 0.05). Subscription (*) indicates significantly difference (p < 0.05) using two-way ANOVA with Duncan’s multiple range test. Monosaccharide concentrations were expressed as g/100 g dry weight. Tr = trace amount (<0.01% w/w). n/a = not available.
Table 2. ΔLA/ΔSCFA of each probiotic bacterial strain in the media supplemented with different carbon sources cultivated for 72 h of fermentation time.
Carbon SourcesL. reuteri DSM 17938B. animalis TISTR 2195
Control0.08 ± 0.00 Da0.05 ± 0.00 Da
1% MPOS0.01 ± 0.00 Fb0.24 ± 0.02 Ca
2% MPOS 0.06 ± 0.00 Eb0.41 ± 0.00 Ba
4% MPOS0.62 ± 0.00 Ba0.002 ± 0.00 Eb
2%MPP0.13 ± 0.01 Ca0.03 ± 0.01 DEb
2%Glucose4.18 ± 0.04 Aa0.96 ± 0.05 Ab
Average ± standard deviation with different capital letters in each column of each probiotic strain is significantly different (p < 0.05) and average ± standard deviation with different lowercase letters in each row is statistically significantly different (p < 0.05) between bacterial strains.
Publisher’s Note: MDPI stays neutral with regard to jurisdictional claims in published maps and institutional affiliations.

