
Oat-Based Foods: Chemical Constituents, Glycemic Index, and the Effect of Processing

Abstract
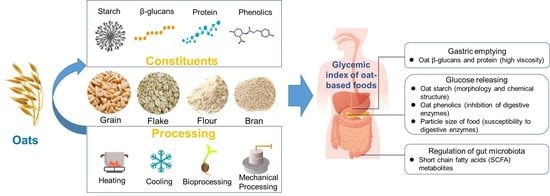
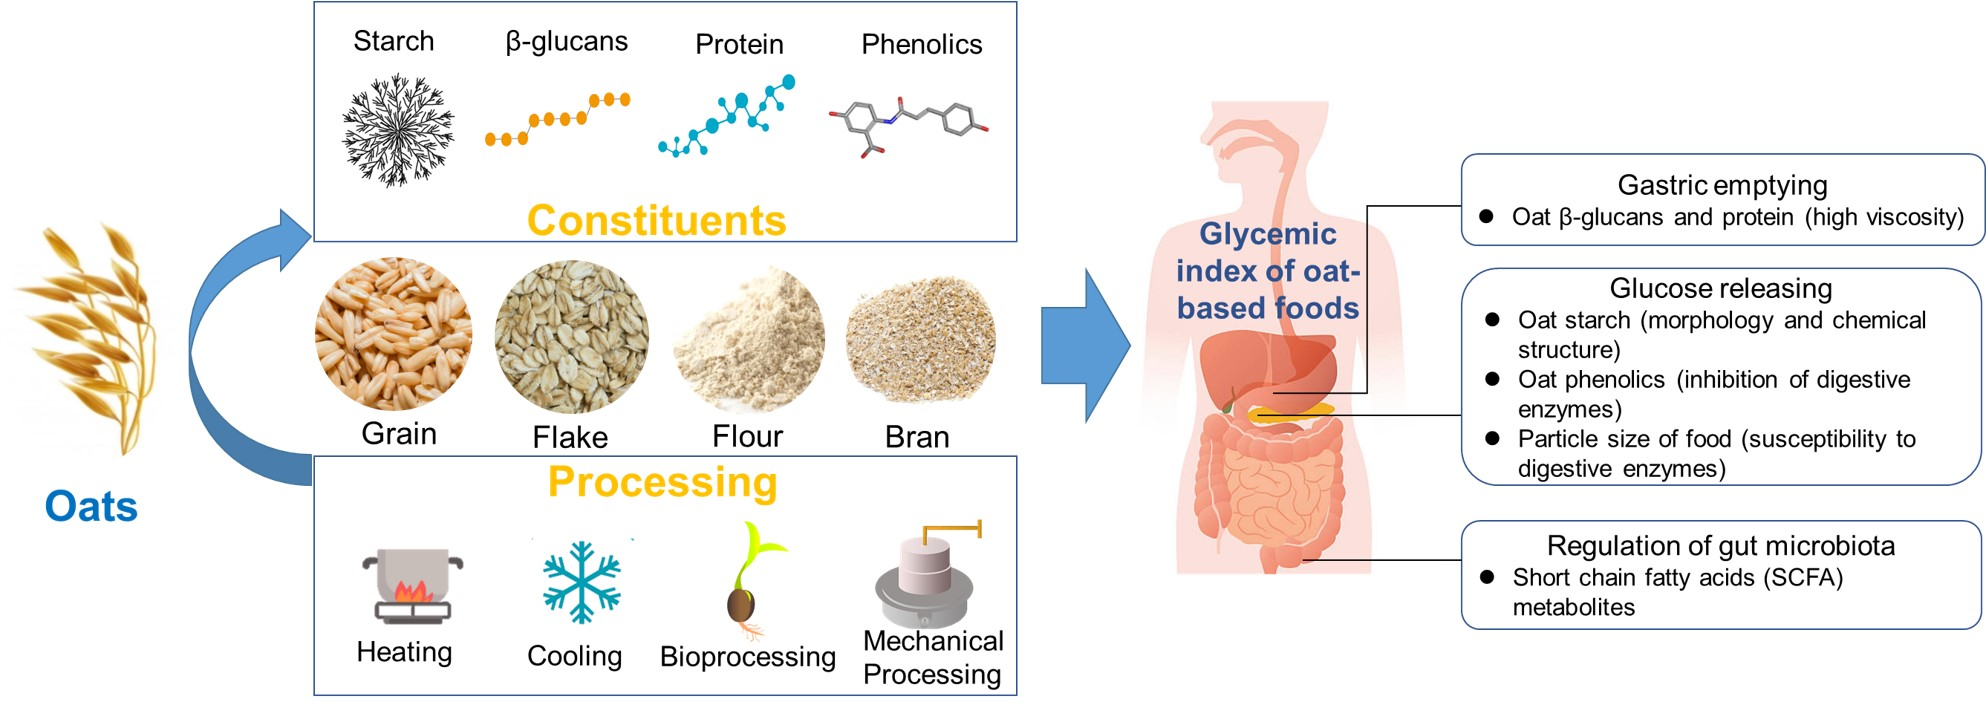
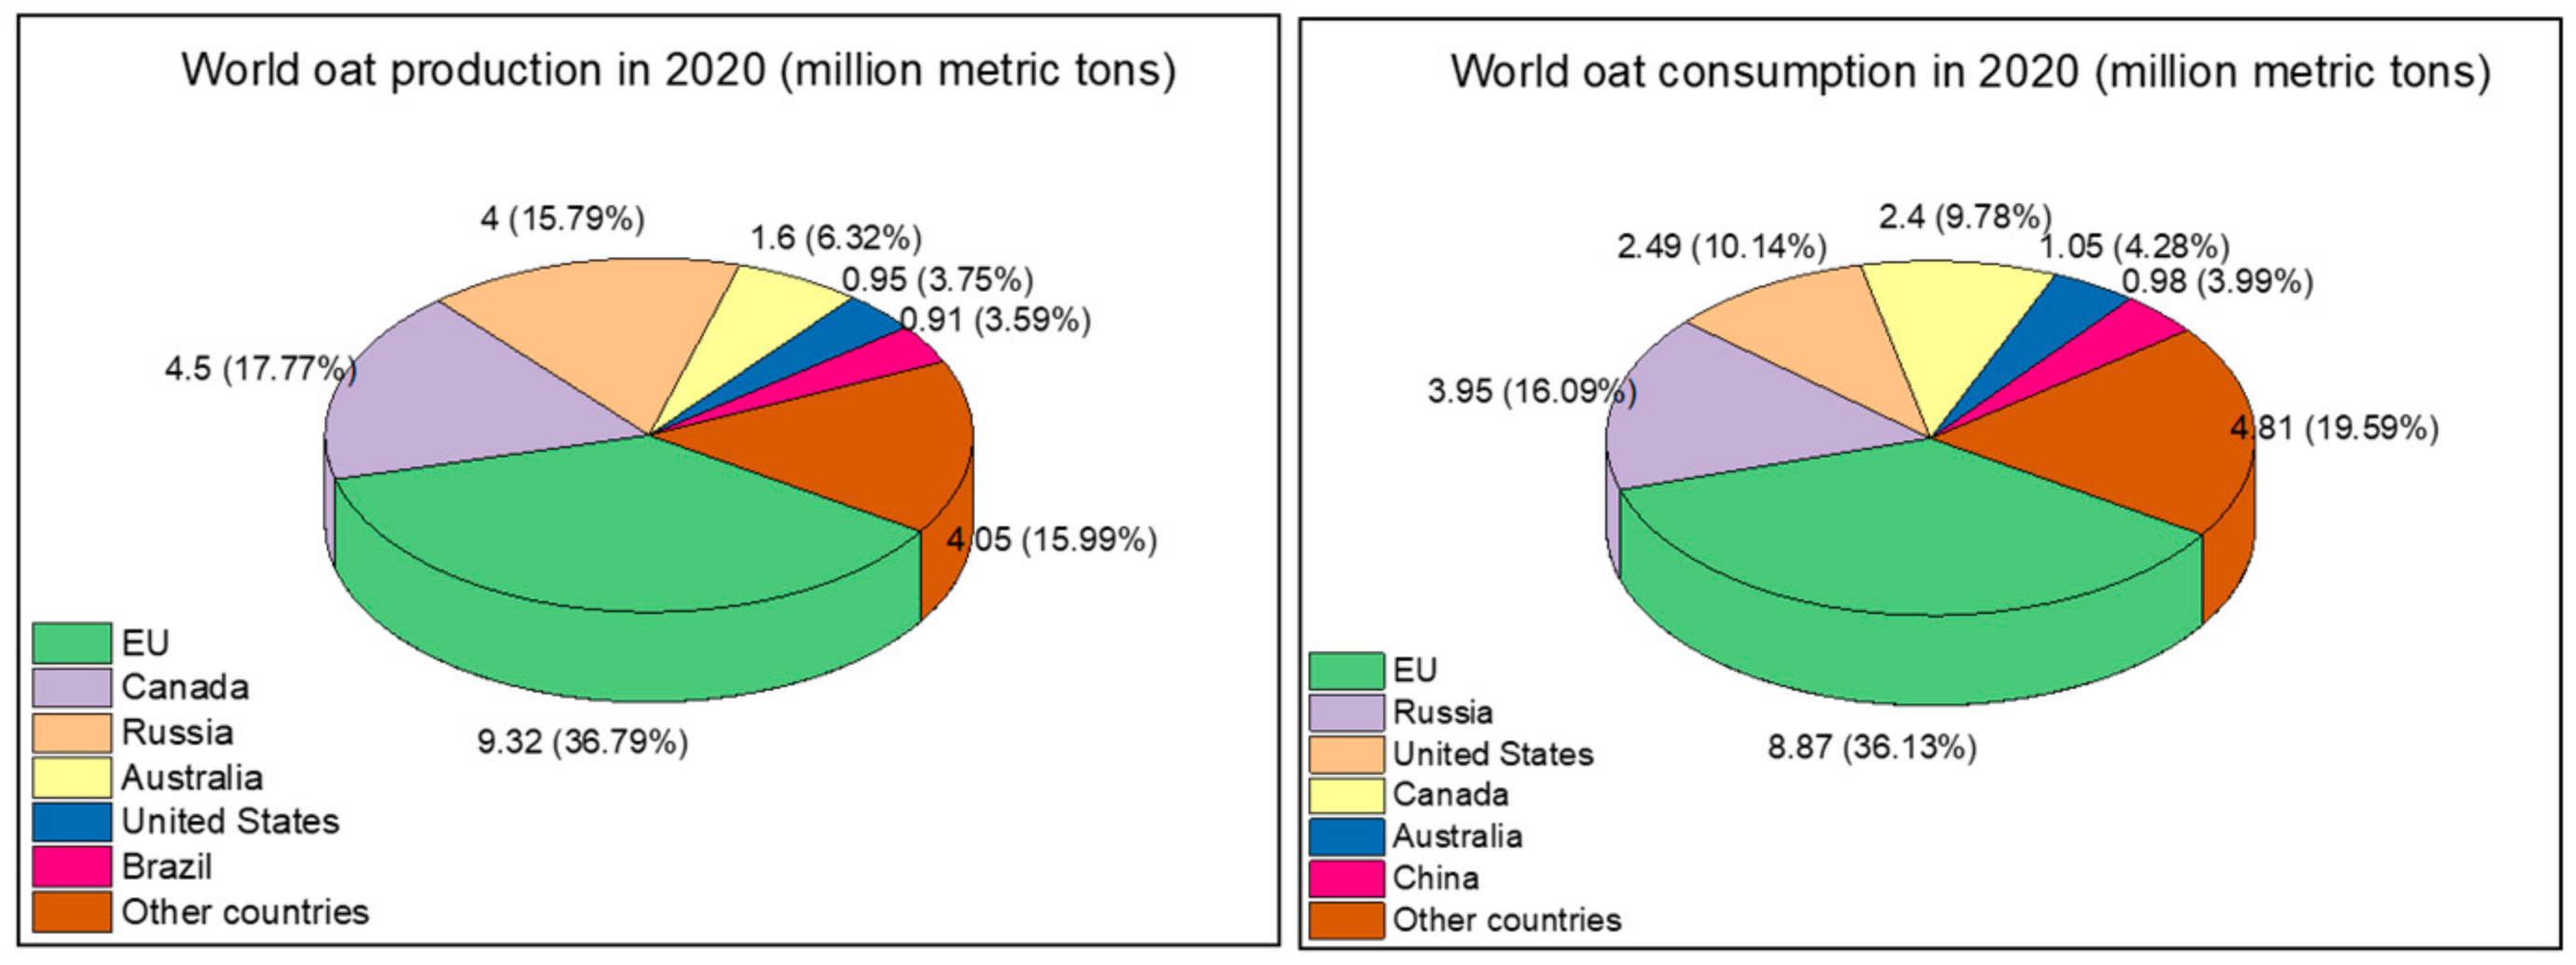
1. Introduction
2. Chemical Constituents of Oats and Their Effects on GI
2.1. Oat Starch
2.2. Oat β-Glucans
2.3. Proteins
2.4. Phenolics
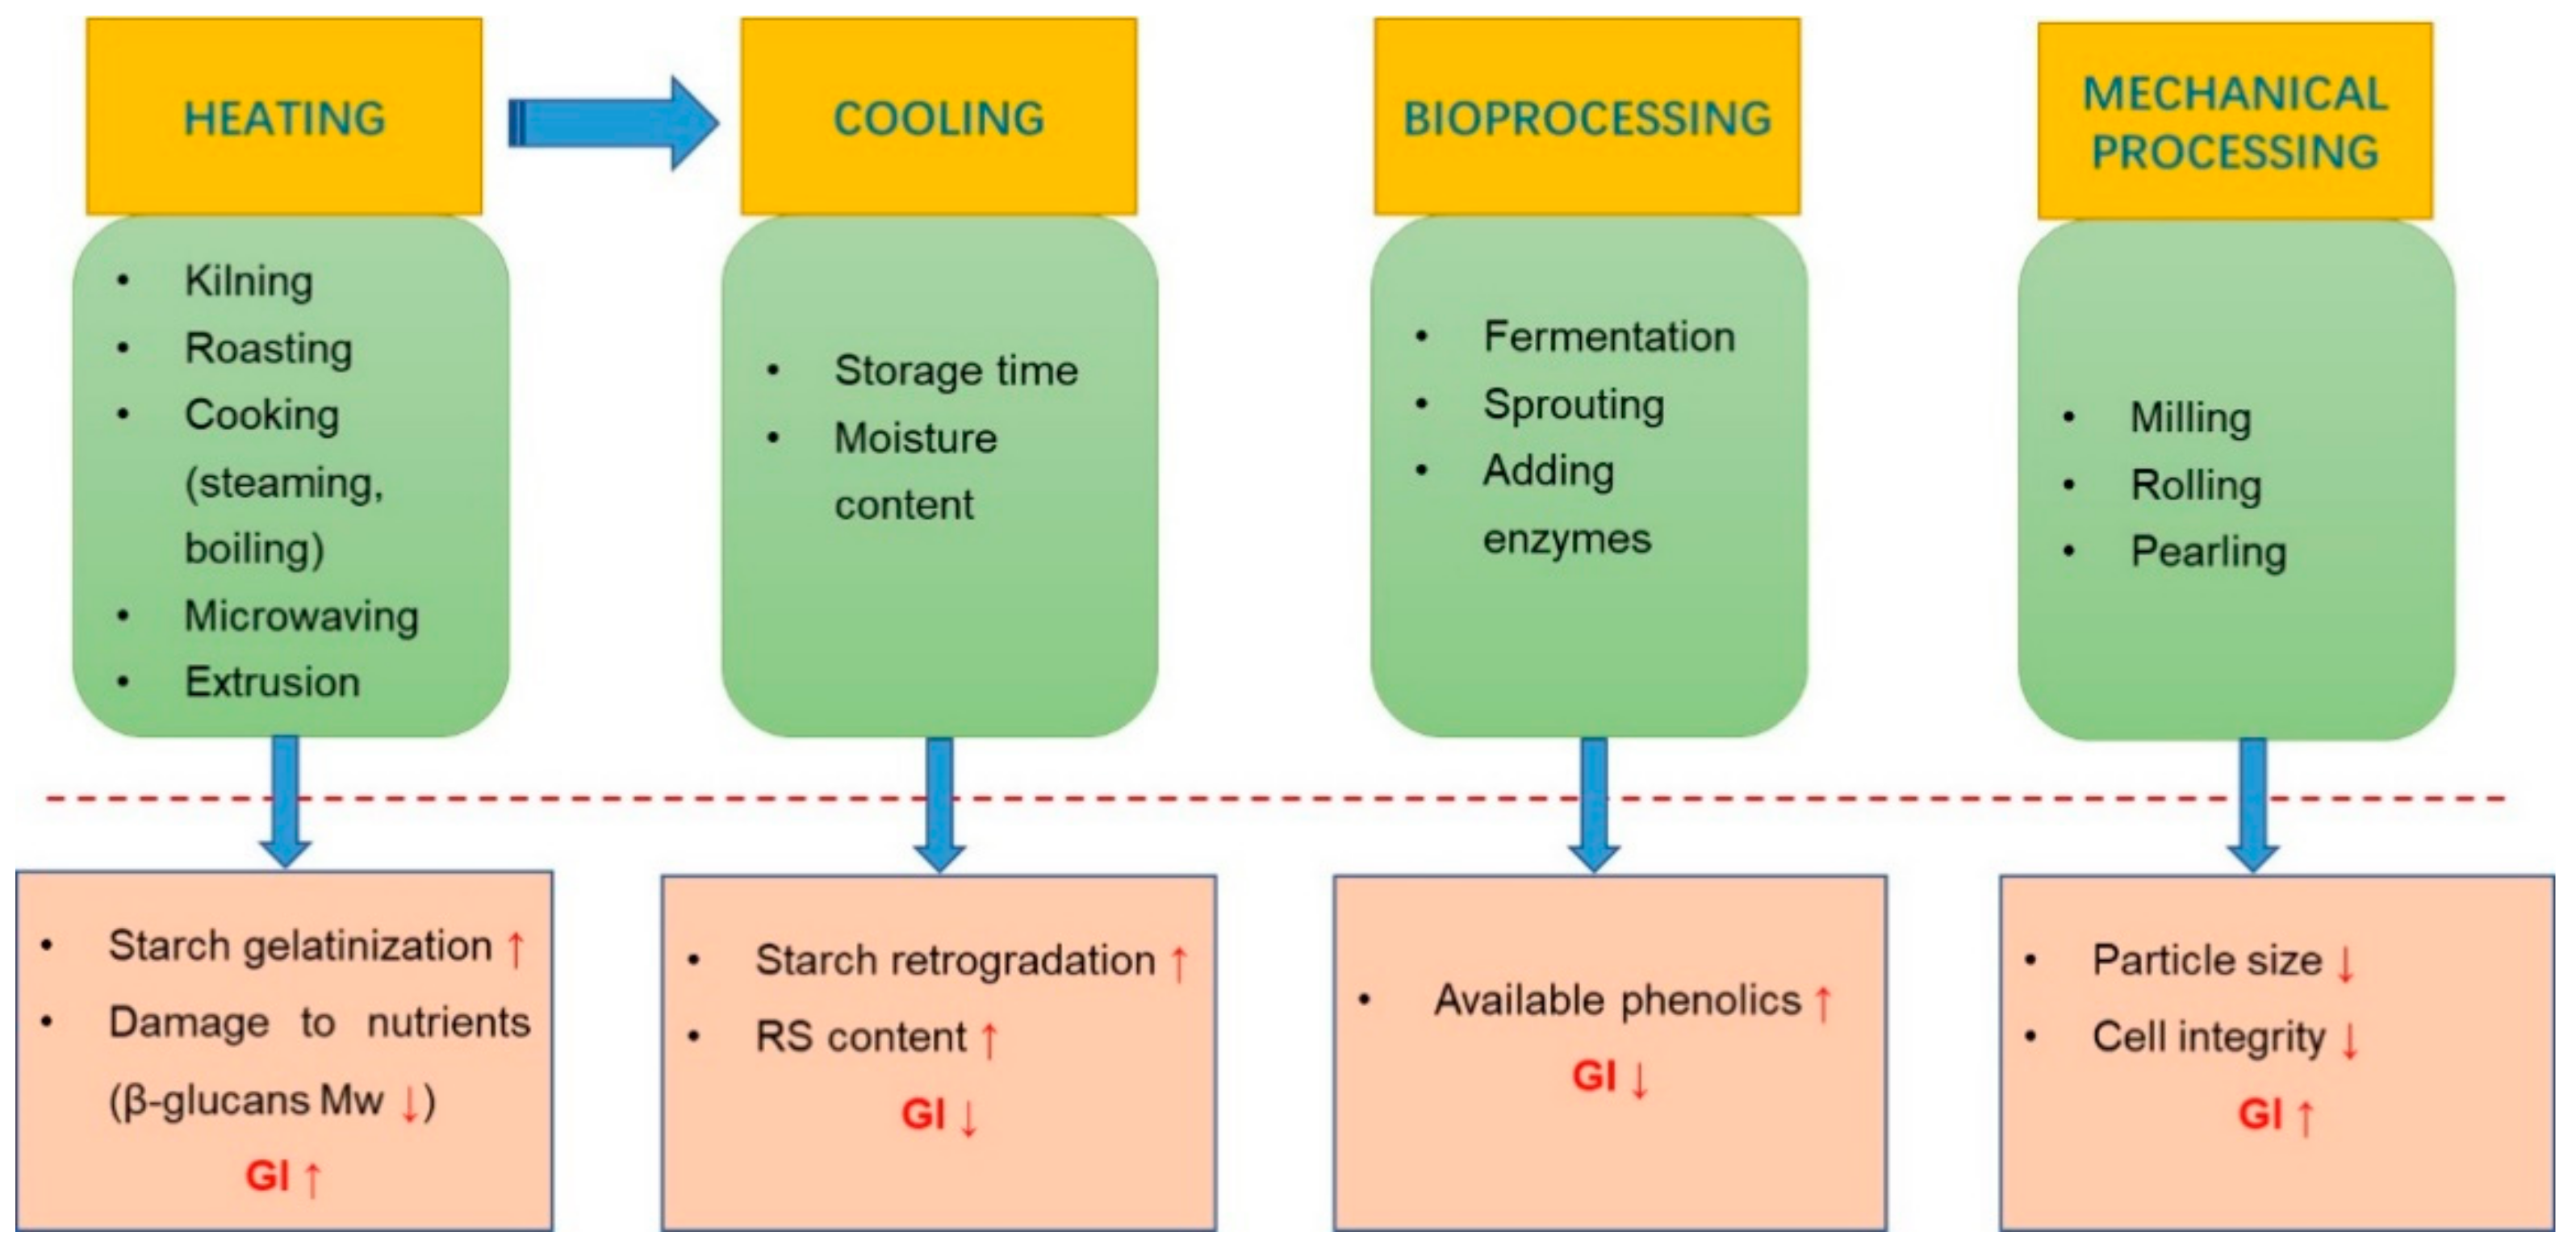
3. Processing of Oats and Effects on GI
3.1. Heating
3.2. Cooling
3.3. Bioprocesssing
4. GI Values of Different Oat-Based Foods
4.1. Oat Grains
- (1)
- The grain structure is compact and intact, and the food can only be chewed and ground through the mouth. This minimal process ensures an intact cell wall and maintains a barrier to starch, thus reducing the accessibility to digestive enzymes and producing a lower GI value [64],
- (2)
- The outer aleurone layer of oat grains acts as a barrier to water absorption and starch gelatinization, thus retarding the starch hydrolysis and the release of glucose, and
- (3)
- The β-glucans and polyphenols-rich bran layer can delay gastric emptying and inhibit the activity of digestive enzymes [93].
4.2. Oat Flakes
4.3. Oat Flours
4.4. Oat Bran

| Format | Food Matrices | Key Cooking Conditions | Available Carbohydrate/g | Subjects/In Vitro Model 1 | GI/eGI | Ref. |
|---|---|---|---|---|---|---|
| Grain | Whole grain oats | Steaming for 50 min | 50 | 10 N | 51 | Zhu et al. [91] |
| Whole grain oats | Steaming under 70 kPa of pressure for 20 min | 50 | 10 N | 52 | ||
| Pearled oats | Steaming for 50 min | 50 | 10 N | 51 | ||
| Pearled oats | Steaming under 70 kPa of pressure for 20 min | 50 | 10 N | 58 | ||
| Whole grain oats | Roasting at 160 °C for 15 min | In vitro dynamic rat stomach–duodenum model | 43.4 | Feng et al. [92] | ||
| Pearled oats | Cooking for 30 min | In vitro dynamic rat stomach–duodenum model | 64.6 | |||
| Pearled oats | 50 | 10 N | 51.5 | Zhang et al. [105] | ||
| Flake | Porridge, made from steel-cut oats | 33 | 9 N | 52 | University of Sydney [106] | |
| Steel-cut oats | 23 | 30 N | 53 | Wolever et al. [107] | ||
| Old-fashioned oats | 23 | 30 N | 56 | |||
| Instant oats | 23 | 30 N | 67 | |||
| Porridge made from rolled oats | Cooking for 20 min | 23 | 6 N | 49 | Jenkins et al. [5] | |
| Oatmeal batch bread | 25 | 10 N | 62 | Henry et al. [108] | ||
| Oatmeal (0.5 mm) | Steaming for 30 min and baking at 140 °C | In vitro dynamic rat stomach–duodenum model | 44.7 | Feng et al. [92] | ||
| Oatmeal (unpackaged) | 50 | 9 N | 55 | Yang et al. [109] | ||
| Oatmeal | 50 | 8 N | 83 | |||
| Rolled oats | 19 | 10 U | 59 | University of Sydney [106] | ||
| Oat flakes | Convection heating for 7 min | 25 | 12 N | 75.7 | Harasym and Olędzki [72] | |
| Oat flakes | Microwave for 3 min | 25 | 12 N | 62.2 | ||
| Oat flakes | Microwave for 5 min | 25 | 12 N | 75.1 | ||
| Oatmeal porridge (0.5–0.6 mm) | 50 | 12 N | 74 | Hätönen et al. [110] | ||
| Oat flakes (0.5 mm) | Roasting and steaming | 50 | 10 N | 114 | Granfeldt et al. [94] | |
| Oat flakes (0.5 mm) | Soaking and roasting | 50 | 10 N | 99 | ||
| Oat flakes (1 mm) | Soaking | 50 | 10 N | 78 | ||
| Oat flakes (1 mm) | Soaking and roasting | 50 | 10 N | 72 | ||
| Oat flakes (1 mm) | Steaming | 50 | 10 N | 76 | ||
| Extruded oat flakes | Heating at 83 °C followed by extrusion | 25 | In vitro adult fasted dynamic gastric model | 105 | Ballance et al. [95] | |
| Flour | Oat wowo | Roasting at 160 °C for 15 min and steaming for 10 min | In vitro dynamic rat stomach–duodenum model | 54.4 | Feng et al. [92] | |
| Oat paste | Extrusion at 160 °C | In vitro dynamic rat stomach–duodenum model | 61.8 | |||
| Oat bread | Baking for 45 min at 190 °C | In vitro starch digestibility | 71 | Wolter et al. [80] | ||
| Oat muesli | 50 | 19 N | 55 | Tan et al. [111] | ||
| Muffin | Baking for 20 min at 180 °C | 50 | 12 N | 53.6 | Soong et al. [112] | |
| Oat flour | Heating at 83 °C | 25 | In vitro adult fasted dynamic gastric model | 92 | Ballance et al. [95] | |
| Wholemeal oat flour porridge | Boiling for 2.5 min | 30 | 8 N | 74 | Liljeberg et al. [98] | |
| Other types | Oat bran | Convection heating for 7 min | 25 | 12 N | 61.9 | Harasym and Olędzki [72] |
| Oat bran | Microwave for 3 min | 25 | 12 N | 49.1 | ||
| Oat bran | Microwave for 5 min | 25 | 12 N | 66.3 | ||
| Oat bran + milk | Extrusion (temperature = 181 °C, water = 18.7%, mechanical energy = 135 Wh/kg; molecular weight of β-glucans = 2180 kDa) | 31 | 12 N | 34 | Brummer et al. [74] | |
| Oat bran + milk | Extrusion (temperature = 220 °C, water = 14.5%, mechanical energy = 125 Wh/kg; molecular weight of β-glucans = 921 kDa) | 31 | 12 N | 43 | ||
| Oat bran + milk | Extrusion (temperature = 228 °C, water = 10%, mechanical energy = 145 Wh/kg; molecular weight of β-glucans = 627 kDa) | 31 | 12 N | 45 | ||
| Oat bran + milk | Extrusion (temperature = 237 °C, water = 7%, mechanical energy = 148 Wh/kg; molecular weight of β-glucans = 326 kDa) | 31 | 12 N | 44 |
5. Conclusions and Future Research Need
Author Contributions
Funding
Conflicts of Interest
References
- Webster, F.H.; Wood, P.J. Oats: Chemistry and Technology, 2nd ed.; AACC International Press: Saint Paul, MN, USA, 2011. [Google Scholar]
- Food and Agriculture Organization (FAO). FAO Statistical Programme of Work 2020–2021; FAO: Rome, Italy, 2020. [Google Scholar]
- Doehlert, D.C.; Simsek, S.; Thavarajah, D.; Thavarajah, P.; Ohm, J.B. Detailed composition analyses of diverse oat genotype kernels grown in different environments in North Dakota. Cereal Chem. 2013, 90, 572–578. [Google Scholar] [CrossRef]
- Roglic, G. WHO Global report on diabetes: A summary. Int. J. Non-Commun. Dis. 2016, 1, 3–8. [Google Scholar] [CrossRef]
- Jenkins, D.; Wolever, T.; Taylor, R.H.; Barker, H.; Fielden, H.; Baldwin, J.M.; Bowling, A.C.; Newman, H.C.; Jenkins, A.L.; Goff, D.V. Glycemic index of foods: A physiological basis for carbohydrate exchange. Am. J. Clin. Nutr. 1981, 34, 362–366. [Google Scholar] [CrossRef] [PubMed]
- Zeevi, D.; Korem, T.; Zmora, N.; Israeli, D.; Rothschild, D.; Weinberger, A.; Ben-Yacov, O.; Lador, D.; Avnit-Sagi, T.; Lotan-Pompan, M.; et al. Personalized nutrition by prediction of glycemic responses. Cell 2015, 163, 1079–1094. [Google Scholar] [CrossRef] [PubMed]
- Vlachos, D.; Malisova, S.; Lindberg, F.A.; Karaniki, G. Glycemic index (GI) or glycemic load (GL) and dietary interventions for optimizing postprandial hyperglycemia in patients with T2 diabetes: A review. Nutrients 2020, 12, 1561. [Google Scholar] [CrossRef]
- Ojo, O.; Ojo, O.O.; Adebowale, F.; Wang, X.H. The effect of dietary glycaemic index on glycaemia in patients with type 2 diabetes: A systematic review and meta-analysis of randomized controlled trials. Nutrients 2018, 10, 373. [Google Scholar] [CrossRef]
- Barclay, A.W.; Petocz, P.; McMillan-Price, J.; Flood, V.M.; Prvan, T.; Mitchell, P.; Brand-Miller, J.C. Glycemic index, glycemic load, and chronic disease risk–a meta-analysis of observational studies. Am. J. Clin. Nutr. 2008, 87, 627–637. [Google Scholar] [CrossRef]
- Romão, B.; Falcomer, A.L.; Palos, G.; Cavalcante, S.; Botelho, R.B.A.; Nakano, E.Y.; Raposo, A.; Shakeel, F.; Alshehri, S.; Mahdi, W.A.; et al. Glycemic index of gluten-free bread and their main ingredients: A systematic review and meta-analysis. Foods 2021, 10, 506. [Google Scholar] [CrossRef]
- Lal, M.K.; Singh, B.; Sharma, S.; Singh, M.P.; Kumar, A. Glycemic index of starchy crops and factors affecting its digestibility: A review. Trends Food Sci. Technol. 2021, 111, 741–755. [Google Scholar] [CrossRef]
- Tosh, S.M.; Chu, Y. Systematic review of the effect of processing of whole-grain oat cereals on glycaemic response. Br. J. Nutr. 2015, 114, 1256–1262. [Google Scholar] [CrossRef]
- Afandi, F.A.; Wijaya, C.H.; Faridah, D.N.; Suyatma, N.E.; Jayanegara, A. Evaluation of various starchy foods: A systematic review and meta-analysis on chemical properties affecting the glycemic index values based on in vitro and in vivo experiments. Foods 2021, 10, 364. [Google Scholar] [CrossRef] [PubMed]
- Sajadimajd, S.; Bahrami, G.; Daglia, M.; Nabavi, S.M.; Naseri, R.; Farzaei, M.H. Plant-derived supplementary carbohydrates, polysaccharides and oligosaccharides in management of diabetes mellitus: A comprehensive review. Food Rev. Int. 2019, 35, 563–586. [Google Scholar] [CrossRef]
- Hu, X.Z.; Zheng, J.M.; Li, X.p.; Xu, C.; Zhao, Q. Chemical composition and sensory characteristics of oat flakes: A comparative study of naked oat flakes from China and hulled oat flakes from western countries. J. Cereal Sci. 2014, 60, 297–301. [Google Scholar] [CrossRef]
- Hossain, M.M.; Tovar, J.; Cloetens, L.; Florido, M.T.S.; Petersson, K.; Prothon, F.; Nilsson, A. Oat polar lipids improve cardiometabolic-related markers after breakfast and a subsequent standardized lunch: A randomized crossover study in healthy young adults. Nutrients 2021, 13, 988. [Google Scholar] [CrossRef] [PubMed]
- Englyst, H.N.; Kingman, S.M.; Cummings, J. Classification and measurement of nutritionally important starch fractions. Eur. J. Clin. Nutr. 1992, 46, S33–S50. [Google Scholar]
- Kaur, H.; Gill, B.S.; Karwasra, B.L. In vitro digestibility, pasting, and structural properties of starches from different cereals. Int. J. Food Prop. 2018, 21, 70–85. [Google Scholar] [CrossRef]
- Bertoft, E.; Piyachomkwan, K.; Chatakanonda, P.; Sriroth, K. Internal unit chain composition in amylopectins. Carbohydr. Polym. 2008, 74, 527–543. [Google Scholar] [CrossRef]
- Binqiang, T.; Chao, W.; Lan, W.; Bijun, X. Granule size and distribution of raw and germinated oat starch in solid state and ethanol solution. Int. J. Food Prop. 2016, 19, 709–719. [Google Scholar] [CrossRef]
- Wang, L.; White, P. Structure and physicochemical properties of starches from oats with different lipid contents. Cereal Chem. 1994, 71, 443–450. [Google Scholar]
- Gudmundsson, M.; Eliasson, A.-C. Some physico-chemical properties of oat starches extracted from varieties with different oil content. Acta Agric. Scand. 1989, 39, 101–111. [Google Scholar] [CrossRef]
- Benmoussa, M.; Moldenhauer, K.A.; Hamaker, B.R. Rice amylopectin fine structure variability affects starch digestion properties. J. Agric. Food Chem. 2007, 55, 1475–1479. [Google Scholar] [CrossRef]
- Xu, J.; Kuang, Q.; Wang, K.; Zhou, S.; Wang, S.; Liu, X.; Wang, S. Insights into molecular structure and digestion rate of oat starch. Food Chem. 2017, 220, 25–30. [Google Scholar] [CrossRef]
- Ren, N.; Ma, Z.; Xu, J.; Hu, X. Insights into the supramolecular structure and techno-functional properties of starch isolated from oat rice kernels subjected to different processing treatments. Food Chem. 2020, 317, 126464. [Google Scholar] [CrossRef]
- Birt, D.F.; Boylston, T.; Hendrich, S.; Jane, J.-L.; Hollis, J.; Li, L.; McClelland, J.; Moore, S.; Phillips, G.J.; Rowling, M.; et al. Resistant starch: Promise for improving human health. Adv. Nutr. 2013, 4, 587–601. [Google Scholar] [CrossRef]
- Hughes, R.L.; Horn, W.H.; Finnegan, P.; Newman, J.W.; Marco, M.L.; Keim, N.L.; Kable, M.E. Resistant Starch Type 2 from Wheat Reduces Postprandial Glycemic Response with Concurrent Alterations in Gut Microbiota Composition. Nutrients 2021, 13, 645. [Google Scholar] [CrossRef]
- Zhang, L.; Ouyang, Y.; Li, H.; Shen, L.; Ni, Y.; Fang, Q.; Wu, G.; Qian, L.; Xiao, Y.; Zhang, J.; et al. Metabolic phenotypes and the gut microbiota in response to dietary resistant starch type 2 in normal-weight subjects: A randomized crossover trial. Sci. Rep. 2019, 9, 1–11. [Google Scholar] [CrossRef]
- Tian, S.; Sun, Y. Influencing factor of resistant starch formation and application in cereal products: A review. Int. J. Biol. Macromol. 2020, 149, 424–431. [Google Scholar] [CrossRef]
- Izydorczyk, M.; Biliaderis, C. Structural and functional aspects of cereal arabinoxylans and β-glucans. In Developments in Food Science; Elsevier: Amsterdam, The Netherlands, 2000; Volume 41, pp. 361–384. [Google Scholar]
- Lazaridou, A.; Biliaderis, C. Molecular aspects of cereal β-glucan functionality: Physical properties, technological applications and physiological effects. J. Cereal Sci. 2007, 46, 101–118. [Google Scholar] [CrossRef]
- Hu, X.; Zhao, J.; Zhao, Q.; Zheng, J. Structure and characteristic of β-glucan in cereal: A review. J. Food Process. Preserv. 2015, 39, 3145–3153. [Google Scholar] [CrossRef]
- Mejía, S.M.V.; de Francisco, A.; Bohrer, B. A comprehensive review on cereal β-glucan: Extraction, characterization, causes of degradation, and food application. Crit. Rev. Food Sci. Nutr. 2020, 60, 3693–3704. [Google Scholar] [CrossRef]
- Bashir, K.M.I.; Choi, J.S. Clinical and physiological perspectives of β-glucans: The past, present, and future. Int. J. Mol. Sci. 2017, 18, 1906. [Google Scholar] [CrossRef]
- Andrade, E.F.; Lobato, R.V.; de Araújo, T.V.; Zangerônimo, M.G.; de Sousa, R.V.; Pereira, L.J. Effect of beta-glucans in the control of blood glucose levels of diabetic patients: A systematic review. Nutr. Hosp. 2015, 31, 170–177. [Google Scholar]
- Song, Y.J.; Sawamura, M.; Ikeda, K.; Igawa, S.; Yamori, Y. Soluble dietary fibre improves insulin sensitivity by increasing muscle GLUT-4 content in stroke-prone spontaneously hypertensive rats. Clin. Exp. Pharmacol. Physiol. 2000, 27, 41–45. [Google Scholar] [CrossRef]
- Bozbulut, R.; Sanlier, N. Promising effects of β-glucans on glyceamic control in diabetes. Trends Food Sci. Technol. 2019, 83, 159–166. [Google Scholar] [CrossRef]
- Food and Drug Administration (FDA). Human and human services: Food labeling: Health claims; oats and coronary heart disease: Proposed rule. Fed. Regist. 1996, 61, 296–313. [Google Scholar]
- EFSA Panel on Dietetic Products, Nutrition and Allergies (NDA). Scientific Opinion on the substantiation of health claims related to beta-glucans from oats and barley and maintenance of normal blood LDL-cholesterol concentrations (ID 1236, 1299), increase in satiety leading to a reduction in energy intake (ID 851, 852), reduction of post-prandial glycaemic responses (ID 821, 824), and “digestive function”(ID 850) pursuant to Article 13 (1) of Regulation (EC) No 1924/2006. EFSA J. 2011, 9, 2207. [Google Scholar]
- Kim, H.J.; White, P.J. Impact of the molecular weight, viscosity, and solubility of β-glucan on in vitro oat starch digestibility. J. Agric. Food Chem. 2013, 61, 3270–3277. [Google Scholar] [CrossRef]
- Wolever, T.M.; Jenkins, A.L.; Prudence, K.; Johnson, J.; Duss, R.; Chu, Y.; Steinert, R.E. Effect of adding oat bran to instant oatmeal on glycaemic response in humans–a study to establish the minimum effective dose of oat β-glucan. Food Funct. 2018, 9, 1692–1700. [Google Scholar] [CrossRef]
- Zurbau, A.; Noronha, J.; Khan, T.; Sievenpiper, J.; Wolever, T.M. Oat beta-glucan and postprandial blood glucose regulation: A systematic review and meta-analysis of acute, single-meal feeding, controlled trials. Curr. Dev. Nutr. 2020, 4, 677. [Google Scholar] [CrossRef]
- Ekström, L.M.; Bok, E.A.H.; Sjöö, M.E.; Östman, E.M. Oat β-glucan containing bread increases the glycaemic profile. J. Funct. Foods 2017, 32, 106–111. [Google Scholar] [CrossRef]
- Jenkins, A.; Jenkins, D.; Zdravkovic, U.; Würsch, P.; Vuksan, V. Depression of the glycemic index by high levels of β-glucan fiber in two functional foods tested in type 2 diabetes. Eur. J. Clin. Nutr. 2002, 56, 622–628. [Google Scholar] [CrossRef]
- Kim, H.J.; White, P.J. In vitro digestion rate and estimated glycemic index of oat flours from typical and high β-glucan oat lines. J. Agric. Food Chem. 2012, 60, 5237–5242. [Google Scholar] [CrossRef]
- Mäkeläinen, H.; Anttila, H.; Sihvonen, J.; Hietanen, R.; Tahvonen, R.; Salminen, E.; Mikola, M.; Sontag-Strohm, T. The effect of β-glucan on the glycemic and insulin index. Eur. J. Clin. Nutr. 2007, 61, 779–785. [Google Scholar] [CrossRef]
- Panahi, S.; Ezatagha, A.; Jovanovski, E.; Jenkins, A.; Temelli, F.; Vasanthan, T.; Vuksan, V. Glycemic effect of oat and barley beta-glucan when incorporated into a snack bar: A dose escalation study. J. Am. Coll. Nutr. 2014, 33, 442–449. [Google Scholar] [CrossRef]
- Sun, L.; Tan, K.W.J.; Han, C.M.S.; Leow, M.K.-S.; Henry, C.J. Impact of preloading either dairy or soy milk on postprandial glycemia, insulinemia and gastric emptying in healthy adults. Eur. J. Nutr. 2017, 56, 77–87. [Google Scholar] [CrossRef]
- Karhunen, L.; Juvonen, K.; Huotari, A.; Purhonen, A.; Herzig, K. Effect of protein, fat, carbohydrate and fibre on gastrointestinal peptide release in humans. Regul. Pept. 2008, 149, 70–78. [Google Scholar] [CrossRef] [PubMed]
- American Diabetes Association (United States). 4. Lifestyle management. Diabetes Care 2017, 40, S33–S43. [Google Scholar] [CrossRef]
- Ma, J.; Stevens, J.E.; Cukier, K.; Maddox, A.F.; Wishart, J.M.; Jones, K.L.; Clifton, P.M.; Horowitz, M.; Rayner, C.K. Effects of a protein preload on gastric emptying, glycemia, and gut hormones after a carbohydrate meal in diet-controlled type 2 diabetes. Diabetes Care 2009, 32, 1600–1602. [Google Scholar] [CrossRef]
- Dhillon, J.; Craig, B.A.; Leidy, H.J.; Amankwaah, A.F.; Anguah, K.O.-B.; Jacobs, A.; Jones, B.L.; Jones, J.B.; Keeler, C.L.; Keller, C.E.; et al. The effects of increased protein intake on fullness: A meta-analysis and its limitations. J. Acad. Nutr. Diet. 2016, 116, 968–983. [Google Scholar] [CrossRef] [PubMed]
- Beta, T.; Camire, M.E. Cereal Grain-Based Functional Foods: Carbohydrate and Phytochemical Components; RSC: London, UK, 2019; pp. 218–224. [Google Scholar]
- Mäkinen, O.E.; Sozer, N.; Ercili-Cura, D.; Poutanen, K. Protein from oat: Structure, processes, functionality, and nutrition. In Sustainable Protein Sources; Academic Press: Cambridge, MA, USA, 2017; pp. 105–119. [Google Scholar]
- Basinskiene, L.; Cizeikiene, D. Cereal-based nonalcoholic beverages. In Trends in Non-Alcoholic Beverages; Academic Press: Cambridge, MA, USA, 2020; pp. 63–99. [Google Scholar]
- Tan, S.Y.; Siow, P.C.; Peh, E.; Henry, C.J. Influence of rice, pea and oat proteins in attenuating glycemic response of sugar-sweetened beverages. Eur. J. Nutr. 2018, 57, 2795–2803. [Google Scholar] [CrossRef] [PubMed]
- Li, X.P.; Li, M.Y.; Ling, A.J.; Hu, X.Z.; Ma, Z.; Liu, L.; Li, Y.X. Effects of genotype and environment on avenanthramides and antioxidant activity of oats grown in northwestern China. J. Cereal Sci. 2017, 73, 130–137. [Google Scholar] [CrossRef]
- Hajiaghaalipour, F.; Khalilpourfarshbafi, M.; Arya, A. Modulation of glucose transporter protein by dietary flavonoids in type 2 diabetes mellitus. Int. J. Biol. Sci. 2015, 11, 508–524. [Google Scholar] [CrossRef]
- Amoako, D.; Awika, J.M. Polyphenol interaction with food carbohydrates and consequences on availability of dietary glucose. Curr. Opin. Food Sci. 2016, 8, 14–18. [Google Scholar] [CrossRef]
- Welsch, C.A.; Lachance, P.A.; Wasserman, B.P. Dietary phenolic compounds: Inhibition of Na+-dependent D-glucose uptake in rat intestinal brush border membrane vesicles. J. Nutr. 1989, 119, 1698–1704. [Google Scholar] [CrossRef]
- Ward, J.L.; Poutanen, K.; Gebruers, K.; Piironen, V.; Lampi, A.-M.; Nyström, L.; Andersson, A.A.; Boros, D.; Rakszegi, M.; Bedő, Z.; et al. The HEALTHGRAIN cereal diversity screen: Concept, results, and prospects. J. Agric. Food Chem. 2008, 56, 9699–9709. [Google Scholar] [CrossRef]
- Li, M.; Koecher, K.; Hansen, L.; Ferruzzi, M.G. Phenolics from whole grain oat products as modifiers of starch digestion and intestinal glucose transport. J. Agric. Food Chem. 2017, 65, 6831–6839. [Google Scholar] [CrossRef] [PubMed]
- Liu, K.; Wise, M.L. Distributions of nutrients and avenanthramides within oat grain and effects on pearled kernel composition. Food Chem. 2021, 336, 127668. [Google Scholar] [CrossRef]
- Yang, Z.; Qin, C.; Weng, P.; Zhang, X.; Xia, Q.; Wu, Z.; Liu, L.; Xiao, J. In vitro evaluation of digestive enzyme inhibition and antioxidant effects of naked oat phenolic acid compound (OPC). Int. J. Food Sci. Technol. 2020, 55, 2531–2540. [Google Scholar] [CrossRef]
- Sivakamasundari, S.; Priyanga, S.; Moses, J.; Anandharamakrishnan, C. Impact of processing techniques on the glycemic index of rice. Crit. Rev. Food Sci. Nutr. 2021, 1–22. [Google Scholar] [CrossRef]
- Sopade, P.A. Cereal processing and glycaemic response. Int. J. Food Sci. Technol. 2016, 52, 22–37. [Google Scholar] [CrossRef]
- Wu, W.; Qiu, J.; Wang, A.; Li, Z. Impact of whole cereals and processing on type 2 diabetes mellitus: A review. Crit. Rev. Food Sci. Nutr. 2020, 60, 1447–1474. [Google Scholar] [CrossRef] [PubMed]
- He, T.; Wang, J.; Hu, X. Effect of heat treatment on the structure and digestion properties of oat globulin. Cereal Chem. 2021, 98, 740–748. [Google Scholar] [CrossRef]
- Chang, Y.; Li, X.P.; Liu, L.; Ma, Z.; Hu, X.Z.; Zhao, W.Q.; Gao, G.T. Effect of processing in superheated steam on surface microbes and enzyme activity of naked oats. J. Food Process. 2015, 39, 2753–2761. [Google Scholar] [CrossRef]
- Ovando-Martínez, M.; Whitney, K.; Reuhs, B.L.; Doehlert, D.C.; Simsek, S. Effect of hydrothermal treatment on physicochemical and digestibility properties of oat starch. Food Res. Int. 2013, 52, 17–25. [Google Scholar] [CrossRef]
- Nguyen, T.L.; Mitra, S.; Gilbert, R.G.; Gidley, M.J.; Fox, G.P. Influence of heat treatment on starch structure and physicochemical properties of oats. J. Cereal Sci. 2019, 89, 102805. [Google Scholar] [CrossRef]
- Harasym, J.; Olędzki, R. Comparison of conventional and microwave assisted heating on carbohydrate content, antioxidant capacity and postprandial glycemic response in oat meals. Nutrients 2018, 10, 207. [Google Scholar] [CrossRef]
- Wang, J.; Xia, S.; Wang, B.; Ali, F.; Li, X. Effect of twin-screw extrusion on gelatinization characteristics of oat powder. J. Food Process Eng. 2019, 42, e13014. [Google Scholar] [CrossRef]
- Brummer, Y.; Duss, R.; Wolever, T.M.; Tosh, S.M. Glycemic response to extruded oat bran cereals processed to vary in molecular weight. Cereal Chem. 2012, 89, 255–261. [Google Scholar] [CrossRef]
- Wang, S.; Li, C.; Copeland, L.; Niu, Q.; Wang, S. Starch retrogradation: A comprehensive review. Compr. Rev. Food Sci. Food Saf. 2015, 14, 568–585. [Google Scholar] [CrossRef]
- Chu, Y.F. Oats Nutrition and Technology; Wiley Blackwell: Chichester, Oxford, UK, 2014; pp. 95–122. [Google Scholar]
- Berski, W.; Ziobro, R.; Witczak, M.; Gambuś, H. The retrogradation kinetics of starches of different botanical origin in the presence of glucose syrup. Int. J. Biol. Macromol. 2018, 114, 1288–1294. [Google Scholar] [CrossRef]
- Zhang, C.; Dong, L.; Wu, J.; Qiao, S.; Xu, W.; Ma, S.; Zhao, B.; Wang, X. Intervention of resistant starch 3 on type 2 diabetes mellitus and its mechanism based on urine metabonomics by liquid chromatography-tandem mass spectrometry. Biomed. Pharmacother. 2020, 128, 110350. [Google Scholar] [CrossRef]
- Mikulíková, D.; Benková, M.; Kraic, J. The potential of common cereals to form retrograded resistant starch. Czech J. Genet. Plant Breed. 2006, 42, 95–102. [Google Scholar] [CrossRef]
- Wolter, A.; Hager, A.-S.; Zannini, E.; Arendt, E.K. In vitro starch digestibility and predicted glycaemic indexes of buckwheat, oat, quinoa, sorghum, teff and commercial gluten-free bread. J. Cereal Sci. 2013, 58, 431–436. [Google Scholar] [CrossRef]
- Singh, A.k.; Rehal, J.; Kaur, A.; Jyot, G. Enhancement of attributes of cereals by germination and fermentation: A review. Crit. Rev. Food Sci. Nutr. 2015, 55, 1575–1589. [Google Scholar] [CrossRef] [PubMed]
- Luana, N.; Rossana, C.; Curiel, J.A.; Kaisa, P.; Marco, G.; Rizzello, C.G. Manufacture and characterization of a yogurt-like beverage made with oat flakes fermented by selected lactic acid bacteria. Int. J. Food Microbiol. 2014, 185, 17–26. [Google Scholar] [CrossRef]
- Schaffer-Lequart, C.; Lehmann, U.; Ross, A.B.; Roger, O.; Eldridge, A.L.; Ananta, E.; Bietry, M.-F.; King, L.R.; Moroni, A.V.; Srichuwong, S.; et al. Whole grain in manufactured foods: Current use, challenges and the way forward. Crit. Rev. Food Sci. Nutr. 2017, 57, 1562–1568. [Google Scholar] [CrossRef]
- Xu, J.G.; Tian, C.R.; Hu, Q.P.; Luo, J.Y.; Wang, X.D.; Tian, X.D. Dynamic changes in phenolic compounds and antioxidant activity in oats (Avena nuda L.) during steeping and germination. J. Agric. Food Chem. 2009, 57, 10392–10398. [Google Scholar] [CrossRef]
- Pradeep, P.; Sreerama, Y.N. Impact of processing on the phenolic profiles of small millets: Evaluation of their antioxidant and enzyme inhibitory properties associated with hyperglycemia. Food Chem. 2015, 169, 455–463. [Google Scholar] [CrossRef]
- Chen, D.; Shi, J.; Hu, X.; Du, S. Alpha-amylase treatment increases extractable phenolics and antioxidant capacity of oat (Avena nuda L.) flour. J. Cereal Sci. 2015, 65, 60–66. [Google Scholar] [CrossRef]
- Bei, Q.; Chen, G.; Lu, F.; Wu, S.; Wu, Z. Enzymatic action mechanism of phenolic mobilization in oats (Avena sativa L.) during solid-state fermentation with Monascus anka. Food Chem. 2018, 245, 297–304. [Google Scholar] [CrossRef]
- Ganssmann, W.; Vorwerck, K. Oat milling, processing and storage. In The Oat Crop; Welch, R.W., Ed.; Springer: Dordrecht, The Netherlands, 1995; pp. 369–408. [Google Scholar]
- Hu, X.; Yan, J.; Xing, X. The effects of steaming and roasting treatments on lipase activity and nutritional components of “oat rice” (OR): The peeled naked oat (Avena nuda) kernels. Agric. Sci. 2011, 2, 56. [Google Scholar] [CrossRef]
- Hu, X.; Wei, Y.; Ren, C.; Zhao, J. Relationship between kernel size and shape and lipase activity of naked oat before and after pearling treatment. J. Sci. Food Agric. 2009, 89, 1424–1427. [Google Scholar] [CrossRef]
- Zhu, R.; Fan, Z.; Li, G.; Wu, Y.; Zhao, W.; Ye, T.; Wang, L. A comparison between whole grain and pearled oats: Acute postprandial glycaemic responses and in vitro carbohydrate digestion in healthy subjects. Eur. J. Nutr. 2020, 59, 2345–2355. [Google Scholar] [CrossRef]
- Feng, Y.; Wang, X.; Ma, Z.; Ren, T.; Li, X.; Hu, X. Effect of processing on the in vitro digestion characteristics of oat products by using a dynamic rat stomach-duodenum model. J. Funct. Foods 2019, 61, 103277. [Google Scholar] [CrossRef]
- Wee, M.S.; Henry, C.J. Reducing the glycemic impact of carbohydrates on foods and meals: Strategies for the food industry and consumers with special focus on Asia. Compr. Rev. Food Sci. Food Saf. 2020, 19, 670–702. [Google Scholar] [CrossRef]
- Granfeldt, Y.; Eliasson, A.-C.; Björck, I. An examination of the possibility of lowering the glycemic index of oat and barley flakes by minimal processing. J. Nutr. 2000, 130, 2207–2214. [Google Scholar] [CrossRef] [PubMed]
- Ballance, S.; Sahlstrøm, S.; Lea, P.; Nagy, N.E.; Andersen, P.V.; Dessev, T.; Hull, S.; Vardakou, M.; Faulks, R. Evaluation of gastric processing and duodenal digestion of starch in six cereal meals on the associated glycaemic response using an adult fasted dynamic gastric model. Eur. J. Nutr. 2013, 52, 799–812. [Google Scholar] [CrossRef]
- Ren, C.Z.; Hu, X.Z. China’s Oats and Buckwheat Industry “Twelfth Five-Year” Development Report (2011–2015); Shaanxi Science and Technology Press: Xi’an, China, 2016; pp. 12–14. (In Chinese) [Google Scholar]
- Zhang, Y.; Hu, X.Z.; Shi, J.L.; Ren, C.Z. Effects of three ripe crafts on processing quality of oat. J. Chin. Cereals Oils Assoc. 2013, 28, 86–91. (In Chinese) [Google Scholar]
- Liljeberg, H.G.; Granfeldt, Y.E.; Björck, I.M. Products based on a high fiber barley genotype, but not on common barley or oats, lower postprandial glucose and insulin responses in healthy humans. J. Nutr. 1996, 126, 458–466. [Google Scholar] [CrossRef]
- Mandalari, G.; Merali, Z.; Ryden, P.; Chessa, S.; Bisignano, C.; Barreca, D.; Bellocco, E.; Laganà, G.; Faulks, R.M.; Waldron, K.W. Durum wheat particle size affects starch and protein digestion in vitro. Eur. J. Nutr. 2018, 57, 319–325. [Google Scholar] [CrossRef] [PubMed]
- Al-Rabadi, G.; Torley, P.; Williams, B.; Bryden, W.; Gidley, M. Particle size heterogeneity in milled barley and sorghum grains: Effects on physico-chemical properties and starch digestibility. J. Cereal Sci. 2012, 56, 396–403. [Google Scholar] [CrossRef]
- Donnelly, B. NAS definitions relating to food fiber only add confusion. Cereal Foods World 2003, 48, 132–133. [Google Scholar]
- Steinert, R.E.; Raederstorff, D.; Wolever, T. Effect of consuming oat bran mixed in water before a meal on glycemic responses in healthy humans-A pilot study. Nutrients 2016, 8, 524. [Google Scholar] [CrossRef]
- Onipe, O.O.; Beswa, D.; Jideani, A.I. In vitro starch digestibility and glycaemic index of fried dough and batter enriched with wheat and oat bran. Foods 2020, 9, 1374. [Google Scholar] [CrossRef] [PubMed]
- Hui, X.; Wu, G.; Han, D.; Stipkovits, L.; Wu, X.; Tang, S.; Brennan, M.A.; Brennan, C.S. The effects of bioactive compounds from blueberry and blackcurrant powders on the inhibitory activities of oat bran pastes against α-amylase and α-glucosidase linked to type 2 diabetes. Food Res. Int. 2020, 138, 109756. [Google Scholar] [CrossRef] [PubMed]
- Zhang, W.Q.; Shaan, F.; Li, H.M.; Liu, J.; An, Y.; Guo, L.N. Measurement of glycemic index and glycemic load for oats and buckwheat processed foods. J. Nutr. 2015, 37, 506–508. (In Chinese) [Google Scholar]
- University of Sydney. Glycemic Index. Available online: http://www.glycemicindex.com (accessed on 20 February 2021).
- Wolever, T.M.; Johnson, J.; Jenkins, A.L.; Campbell, J.C.; Ezatagha, A.; Chu, Y. Impact of oat processing on glycaemic and insulinaemic responses in healthy humans: A randomised clinical trial. Br. J. Nutr. 2019, 121, 1264–1270. [Google Scholar] [CrossRef]
- Henry, C.J.K.; Lightowler, H.J.; Strik, C.M.; Renton, H.; Hails, S. Glycaemic index and glycaemic load values of commercially available products in the UK. Br. J. Nutr. 2005, 94, 922–930. [Google Scholar] [CrossRef]
- Yang, Y.X.; Wang, H.W.; Cui, H.M.; Wang, Y.; Yu, L.D.; Xiang, S.X.; Zhou, S.Y. Glycemic index of cereals and tubers produced in China. World J. Gastroenterol. 2006, 12, 3430–3433. [Google Scholar] [CrossRef]
- Hätönen, K.A.; Similä, M.E.; Virtamo, J.R.; Eriksson, J.G.; Hannila, M.-L.; Sinkko, H.K.; Sundvall, J.E.; Mykkänen, H.M.; Valsta, L.M. Methodologic considerations in the measurement of glycemic index: Glycemic response to rye bread, oatmeal porridge, and mashed potato. Am. J. Clin. Nutr. 2006, 84, 1055–1061. [Google Scholar] [CrossRef]
- Tan, W.S.K.; Tan, W.J.K.; Shalini, D.; Ponnalagu, O.; Koecher, K.; Menon, R.; Tan, S.-Y.; Henry, C.J. The glycaemic index and insulinaemic index of commercially available breakfast and snack foods in an Asian population. Br. J. Nutr. 2018, 119, 1151–1156. [Google Scholar] [CrossRef] [PubMed]
- Soong, Y.Y.; Quek, R.Y.C.; Henry, C.J. Glycemic potency of muffins made with wheat, rice, corn, oat and barley flours: A comparative study between in vivo and in vitro. Eur. J. Nutr. 2015, 54, 1281–1285. [Google Scholar] [CrossRef] [PubMed]


| Food Matrix | Content per Available Carbohydrate/% | Molecular Weight/kDa | GI/eGI | Subjects/In Vitro Model 1 | Key Findings | Ref. |
|---|---|---|---|---|---|---|
| Yeast leavened bread | 2.5 | 282 | 64 | 13 N | The addition of oat β-glucans decreased GI by 32–37% compared to white bread. | Ekström et al. [43] |
| 3.5 | 68 | |||||
| 4.5 | 63 | |||||
| β-glucan-enriched breakfast cereal and bar | 7.3 | 52 | 16 D | The GI of the test foods used in this study decreased by 4.0 ± 0.2 units per gram of β-glucans, compared with commercial oat bran breakfast cereal. | Jenkins et al. [44] | |
| 6.2 | 43 | |||||
| Oat flour | 4 | 890 | 85.7 | In vitro starch digestibility | β-glucans slowed the rate of starch digestion. | Kim and White [45] |
| 5.3 | 980 | 82.7 | ||||
| 7.4 | 1150 | 77.2 | ||||
| 7.7 | 770 | 78.3 | ||||
| Oat bran products | 1 | 83.7 | 10 N | The glycemic responses to oat products with increasing amounts of β-glucans had lower peak values than the reference glucose load. | Mäkeläinen et al. [46] | |
| 2 | 58.3 | |||||
| 3 | 63.6 | |||||
| Snack bar | 0 | 75 | 12 N | Incorporation of 1.5 to 6 g of β-glucans into snack bars had no additional glucose-lowering benefits irrespective of dose and source compared to the control bars (0 g β-glucans). | Panahi [47] | |
| 0.75 | 77 | |||||
| 1.5 | 80 | |||||
| 3 | 71 | |||||
| Oat starch | 20 | 113 | 85.6 | In vitro starch digestibility | Viscosity attributed to the β-glucans Mw reduced starch hydrolysis during in vitro digestion. | Kim and White [40] |
| 698 | 82.8 | |||||
| 904 | 68.4 |
Publisher’s Note: MDPI stays neutral with regard to jurisdictional claims in published maps and institutional affiliations. |
© 2021 by the authors. Licensee MDPI, Basel, Switzerland. This article is an open access article distributed under the terms and conditions of the Creative Commons Attribution (CC BY) license (https://creativecommons.org/licenses/by/4.0/).
Share and Cite
Zhang, K.; Dong, R.; Hu, X.; Ren, C.; Li, Y. Oat-Based Foods: Chemical Constituents, Glycemic Index, and the Effect of Processing. Foods 2021, 10, 1304. https://doi.org/10.3390/foods10061304
Zhang K, Dong R, Hu X, Ren C, Li Y. Oat-Based Foods: Chemical Constituents, Glycemic Index, and the Effect of Processing. Foods. 2021; 10(6):1304. https://doi.org/10.3390/foods10061304
Chicago/Turabian StyleZhang, Kailong, Rui Dong, Xinzhong Hu, Changzhong Ren, and Yuwei Li. 2021. "Oat-Based Foods: Chemical Constituents, Glycemic Index, and the Effect of Processing" Foods 10, no. 6: 1304. https://doi.org/10.3390/foods10061304
APA StyleZhang, K., Dong, R., Hu, X., Ren, C., & Li, Y. (2021). Oat-Based Foods: Chemical Constituents, Glycemic Index, and the Effect of Processing. Foods, 10(6), 1304. https://doi.org/10.3390/foods10061304