Article

Analysis of Fungal Microbiomes in Edible Medicinal Morindae Officinalis Radix and Alpiniae Oxyphyllae Fructus Using DNA Metabarcoding

1
Institute of Medicinal Plant Development, Chinese Academy of Medical Sciences & Peking Union Medical College, Beijing 100193, China
2
Hainan Provincial Key Laboratory of Resources Conservation and Development of Southern Medicine, Hainan Branch of the Institute of Medicinal Plant Development, Chinese Academy of Medical Sciences & Peking Union Medical College, Haikou 570311, China
*
Author to whom correspondence should be addressed.
These authors contributed equally to this work.
Foods 2022, 11(12), 1748; https://doi.org/10.3390/foods11121748
Submission received: 14 May 2022 / Revised: 8 June 2022 / Accepted: 10 June 2022 / Published: 14 June 2022
(This article belongs to the Special Issue Food Contaminant Components: Source, Detection, Toxicity and Removal)

Abstract

:
Morindae Officinalis Radix (MOR) and Alpiniae Oxyphyllae Fructus (AOF) have been widely used as dietary supplements and traditional herbal medicines for centuries. Fungal and mycotoxin contamination in MOR and AOF has been reported recently. In this study, fungi in MOR and AOF are first investigated using DNA metabarcoding, and the differences in fungal microbiome between moldy and non−moldy samples are analyzed. The results show that Ascomycota is the most prevailing fungus at the phylum level in MOR and AOF with relative abundances of 49.53–94.32% and 14.81–81.85%, respectively. Penicillium (1.86–76.14%), Cladosporium (1.82–56.65%), and Trichoderma (0.12–19.71%) are the dominant genera in MOR. Penicillium (0.27–56.06%), Papiliotrema (0.04–51.71%), and Cladosporium (3.08–44.41%) are the dominant genera in AOF. Two potential toxigenic fungi were detected, namely, Trichoderma atroviride and Fusarium equiseti. Moreover, the differences in fungal communities between moldy and non−moldy samples were monitored. In conclusion, DNA metabarcoding can be used to assess the fungal microbiome in edible medicinal herbs, thereby providing a basis for ensuring food safety and drug efficacy.

1. Introduction

Chinese herbal medicines (CHMs), which are widely used for clinical treatment and daily healthcare, have undoubtedly played a significant role in medical and healthcare industries. About 70–80% of the global population depends on herbal medicinal products in their primary healthcare [1]. The global market of medicinal plants is growing and expected to reach USD 5 trillion by 2050 [2]. The popularity of herbal products is increasing as they are considered natural or harmless [2]. Unfortunately, fungal contamination in CHMs is a concern. Since the sources of CHMs are diversified and the planting and processing are decentralized, CHMs may be contaminated by fungi at any link of the complex traditional Chinese medicine industry chain if good manufacturing procedures are not followed, and even mycotoxins may be produced by potential toxigenic fungi under suitable conditions. Cases of fungal and mycotoxin contamination associated with CHMs have been constantly reported worldwide and have attracted considerable global attention. A study on microbial contamination in 132 herbal medicines and 18 water samples used in the preparation of herbal medicines from northern Brazil showed that 31% of tested samples exceeded the safety limits for fungal growth [3]. Keter et al. assessed the risk of fungi in 100 herbal products from the Kenyan market, and the results revealed that 69% of the samples did not meet the requirements about microbial limits shown in Pharmacopoeia. Among these, Aspergillus and Penicillium were dominant [4]. In Latvia, Reinholds et al. investigated the contamination profile of multi−mycotoxin and fungi in 140 Camellia sinensis and 26 herbal teas; 87% of the tea samples were positive for fungi and 42% had 1 to 16 mycotoxins, for instance, ochratoxin A (OTA), deoxynivalenol, and aflatoxins (AFs) [5]. A Poland investigation on the occurrence of OTA and fumonisins in 79 herbs and spices showed that 31% of the samples were positive for fumonisins and 49% for OTA [6]. Another investigation on the fungal and multi−mycotoxin contamination in 48 root herbs marketed in China determined that all samples were affected by fungal contamination; 37.5% were positive for AFs and 16.67% for OTA [7]. Moldy CHMs affect drug efficacy, pose threats to consumer health, affect the export trade, and cause economic losses.
Morindae Officinalis Radix (MOR, Bajitian in Chinese), namely, the dried root of Morinda officinalis How. (Rubiaceae), has long been used as a tonic herbal medicine for tonifying the kidney, strengthening sinew and bone, and dispelling wind−dampness [8]. MOR is also a popular dietary supplement for daily healthcare (e.g., bone protection and gynecological and andrological healthcare) [9]. The constituents extracted from MOR, e.g., anthraquinones, oligosaccharides, polysaccharides, and iridoid glycosides, have various bioactive activities, including anti-osteoporosis, anti-depressant, pro-fertility, immune-regulatory, anti-inflammation, and antioxidant effects [10,11,12,13,14]. Alpiniae Oxyphyllae Fructus (AOF, Yizhi in Chinese), a famed edible medicinal herb, is from the dried, ripe fruit of Alpinia oxyphylla Miq. AOF has the functions of warming the kidney to secure essence to reduce urination, and warming the spleen to check diarrhea and constrain spittle [8]. Contemporary research shows the presence of sesquiterpenes, polysaccharides, diarylheptanoids, flavonoids, and volatile oils in AOF [15]. AOF and its extracts exhibit neuroprotective, anti-ulcer, anti-inflammatory, and anti-hyperuricemic effects, and have been used for the treatment of dementia, ulceration, and tumors [16,17,18]. The consumption and demand for MOR and AOF are high, owing to their outstanding pharmaceutical properties and edible values. MOR and AOF are mainly produced in Hainan, Guangdong, and Guangxi provinces, as well as in other tropical and subtropical regions of China [19], in which the climate situation contributes to the development of fungi and the production of mycotoxins [20]. MOR and AOF are easily affected by the contamination of fungi without obeying proper harvest, processing, transportation, and storage procedures. Therefore, it is necessary to comprehensively and efficiently investigate the fungal contamination before the use of MOR and AOF. Contamination of fungi is challenging to identify because of their complex morphological and taxonomic characteristics. Thus, a method that simultaneously and effectively analyzes fungal microbiomes in MOR and AOF is urgently desired.
DNA metabarcoding, an emerging culture-independent technique, refers to high-throughput multispecies (or higher-level taxon) identification using the total and typically degraded DNA extracted from an environmental sample (i.e., soil, water, and feces) [21]. It has a wide range of applications in the study of fungal ecology and provides new insights into fungal microbiomes in different environments. The internal transcribed spacer (ITS) region of rDNA was recommended as a universal DNA barcode marker for fungi [22]. Most amplicon sequencing studies of fungal diversity have focused on ITS1 or ITS2 sublocus [23]. In this study, we first use DNA metabarcoding to characterize the fungal microbiomes in MOR and AOF, and compare the differences between moldy and non−moldy samples.

2. Materials and Methods

2.1. Sampling

A total of 18 samples, including MOR and AOF, were collected from herbal markets in Hainan, Guangdong, and Guangxi. The samples were divided into two groups, according to the species (i.e., MOR and AOF), and four groups based on the presence or absence of macroscopic molds (i.e., MM and MA are the moldy MOR and AOF samples, respectively; NM and NA are the non-moldy MOR and AOF samples, respectively). The details of all samples are shown in Table 1.

2.2. DNA Extraction

About 3 g of MOR (the dried root) or AOF (the dried ripe fruit) samples was transferred into a 50 mL sterilized centrifuge tube and mixed with 20 mL of sterilized water, and shaken for 20 min by a vortex mixer. Then, the mixture was filtered by Millipore filter membrane (50 mm diameter, 0.2 μm pore size). Total DNA was extracted by the cetyltrimethyl ammonium bromide method [24].

2.3. Polymerase Chain Reaction (PCR) Amplification and High-Throughput Sequencing (HTS)

The ITS1 region of the fungi was amplified with the primer pairs ITS1F (5′-CTTGGTCATTTAGAGGAAGTAA-3′) [25] and ITS2R (5′-GCTGCGTTCTTCATCG ATGC-3′) [26]. PCR was performed on initial denaturation at 95 °C for 5 min, 34 cycles of denaturation at 95 °C for 45 s, 50 s annealing at 58 °C, 60 s elongation at 72 °C, and 10 min extension at 72 °C. The PCR product was detected by 2% agarose gel electrophoresis and purified using the Universal DNA Purification Kit (DP214) (TIANGEN Biotech Co., Ltd., Beijing, China). Then, the amplicons were sequenced on the IonS5TMXL platform (Thermofisher, Waltham, MA, USA). Raw reads were submitted to the National Center for Biotechnology Information Sequence Read Archive database under the accession numbers SAMN19591296–SAMN19591313.

2.4. Data Analysis

Low-quality regions of the sequences were removed by Cutadapt (version 1.9.1) [27], and then the barcode and primer sequences were cut off to obtain the raw reads. Chimeric sequences were removed using USEARCH (version 8.1.1861) [28], and clean reads were clustered into operational taxonomic units (OTUs) at a 97% similarity level by UPARSE (version 7.1) [29]. OTUs were annotated according to the UNITE database ranging from kingdom to species level [30] and verified via manual search. Five metrics, Shannon, Chao 1, ACE, Simpson, and Good’s coverage, were calculated by QIIME (version 1.9.1) [31] to assess alpha diversity. Statistical differences between MOR and AOF were examined by analysis of similarity (ANOSIM). Principal coordinate analysis (PCoA) on the basis of the Bray–Curtis distance matrix was applied to estimate the difference in the fungal community of samples from different species. The linear discriminant analysis effect size (LEfSe) algorithm (LDA score = 4.0) was performed to distinguish the differentially abundant taxa between two groups [32]. Samples were hierarchically clustered by the unweighted pair group method with arithmetic mean (UPGMA) based on unweighted UniFrac distances. R tools (version 2.15.3) were applied to plot the rarefaction curves, heat map, and Venn diagram.

3. Results

3.1. Diversity Analysis of Fungal Microbiomes in MOR and AOF Samples

A total of 1,413,703 valid ITS1 sequences with an average length of 235 bp were obtained from 18 samples. The sequences were clustered into 579 OTUs (≥97% similarity, Table S1). Venn analysis exhibited that 91 and 76 OTUs were, respectively, unique for AOF and MOR groups, and the remaining 412 OTUs were common in the two groups (Figure 1a). Moreover, 282 OTUs were shared by 4 groups, and 23, 34, 43, and 28 OTUs were, respectively, unique for NM, MM, NA, and MA groups (Figure 1b). With the number of sequences sampled increasing, the rarefaction curves of all samples were parallel to the x-axis, which indicates the reliability of the sequencing depth employed (Figure 1c). The 5 alpha-diversity indices were employed to analyze the richness, diversity, and coverage of fungal microbiomes in 18 samples (Table 2). The Good’s coverage was over 99.8%, which shows that the sampling depth satisfies the analysis requirements. In the MOR group, the ACE and Chao 1 indices of GDM were the highest, and the community richness was the highest. In contrast, GXM had the lowest community richness. The community diversity of GDM samples was the highest with the highest Shannon and Simpson indices. GXM had the lowest community diversity. Similarly, HNA and ACK in the AOF group had the highest community diversity and community richness, respectively. PCoA analysis showed that AOF and MOR groups were distinguishable (Figure 1d).

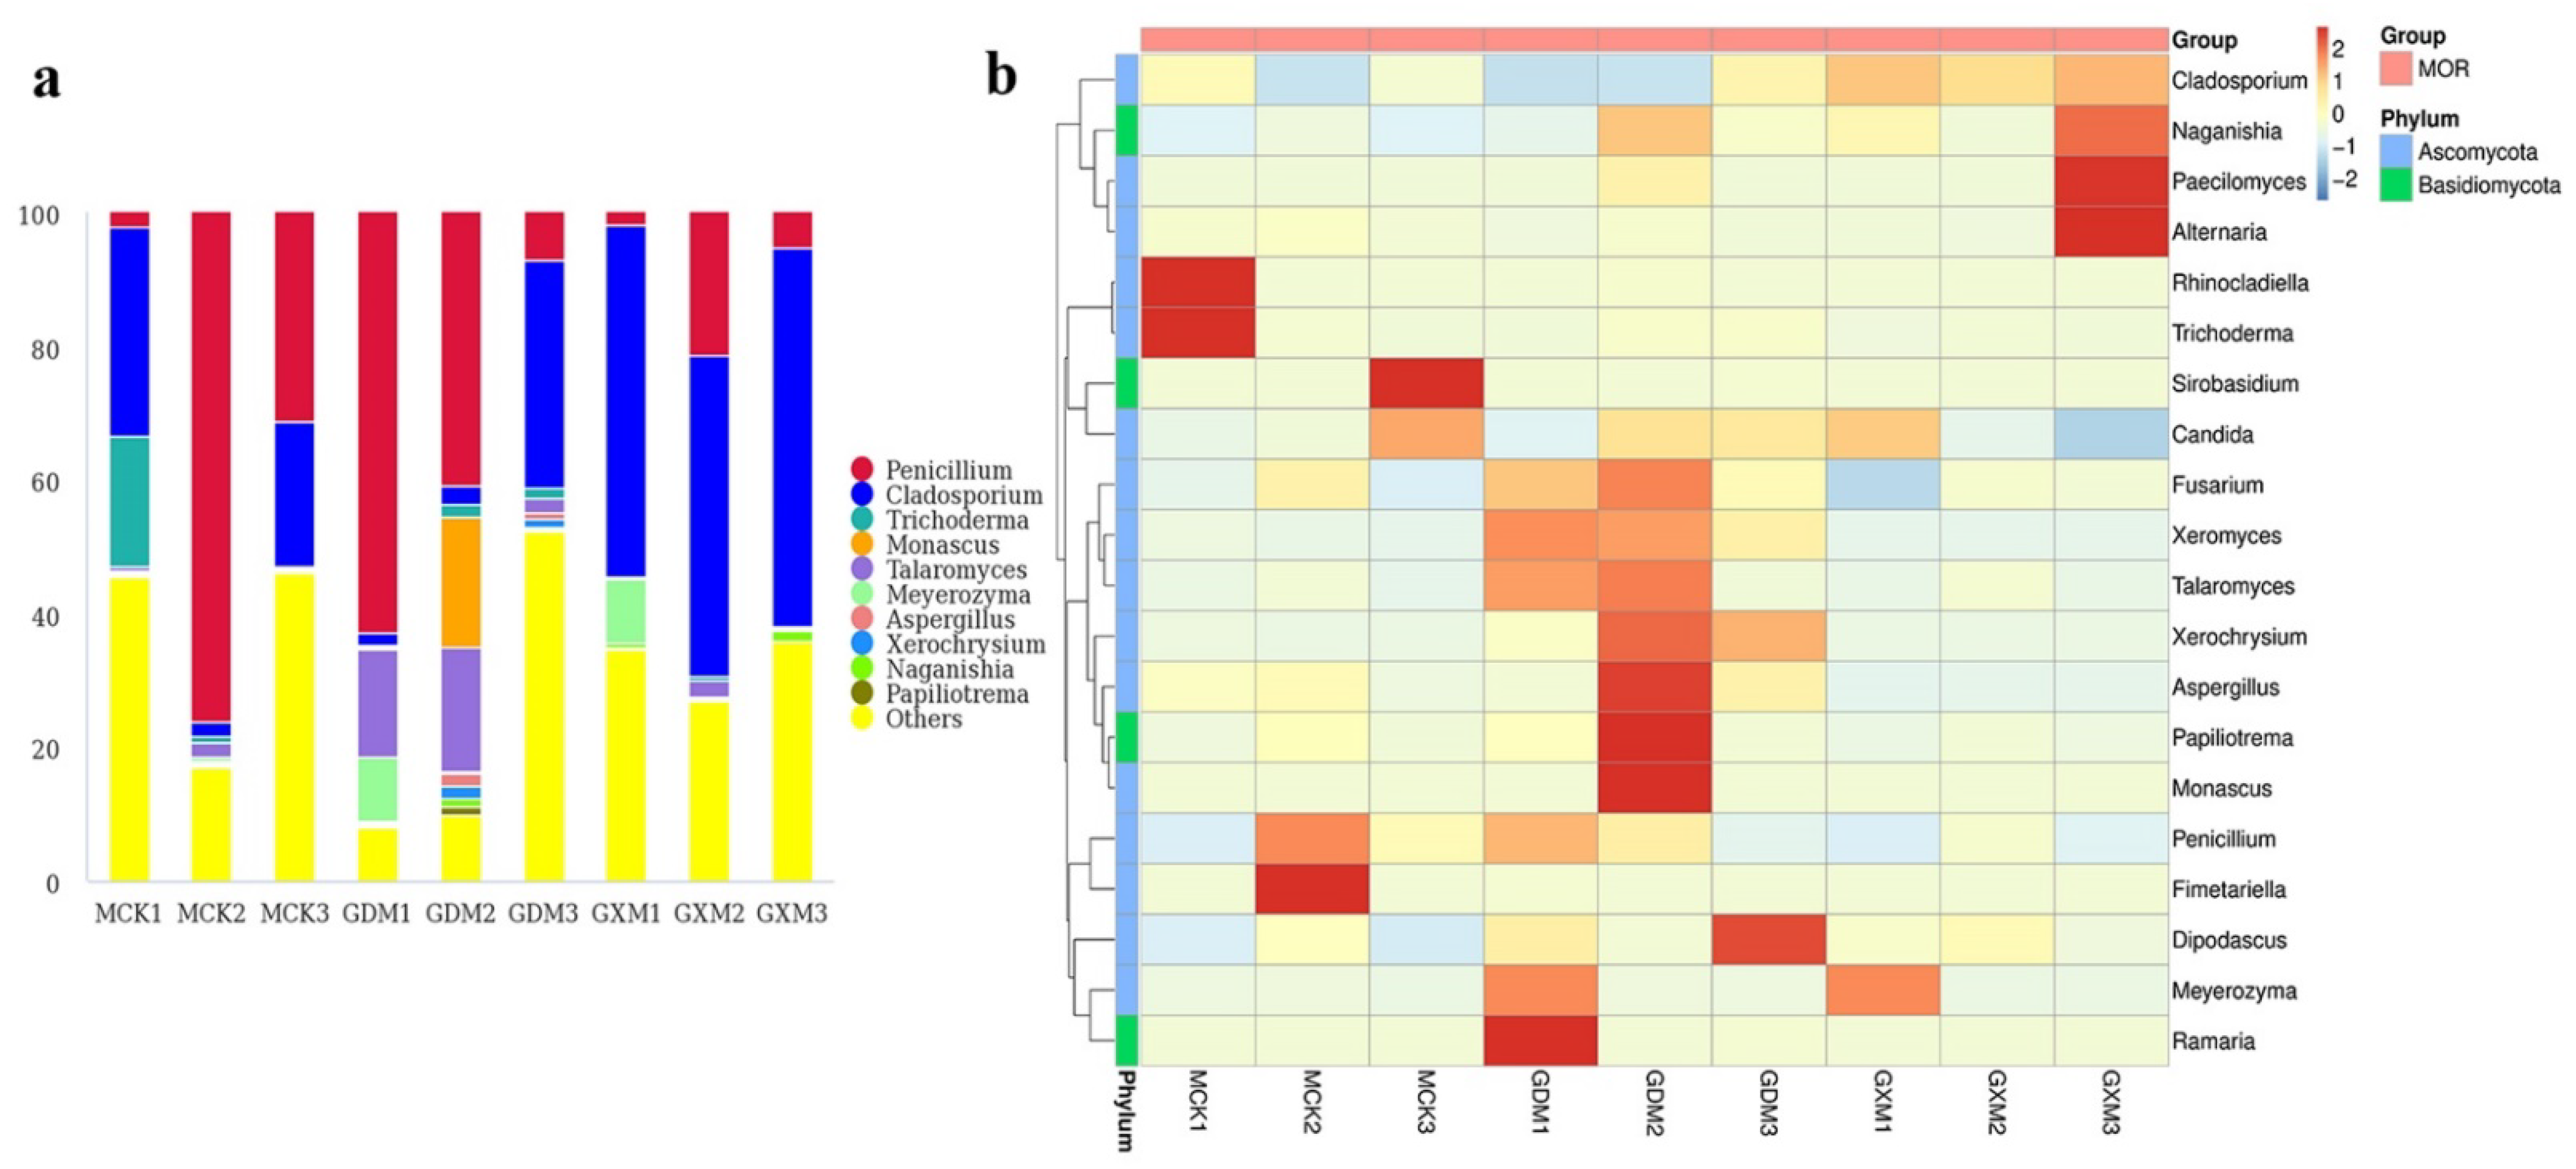
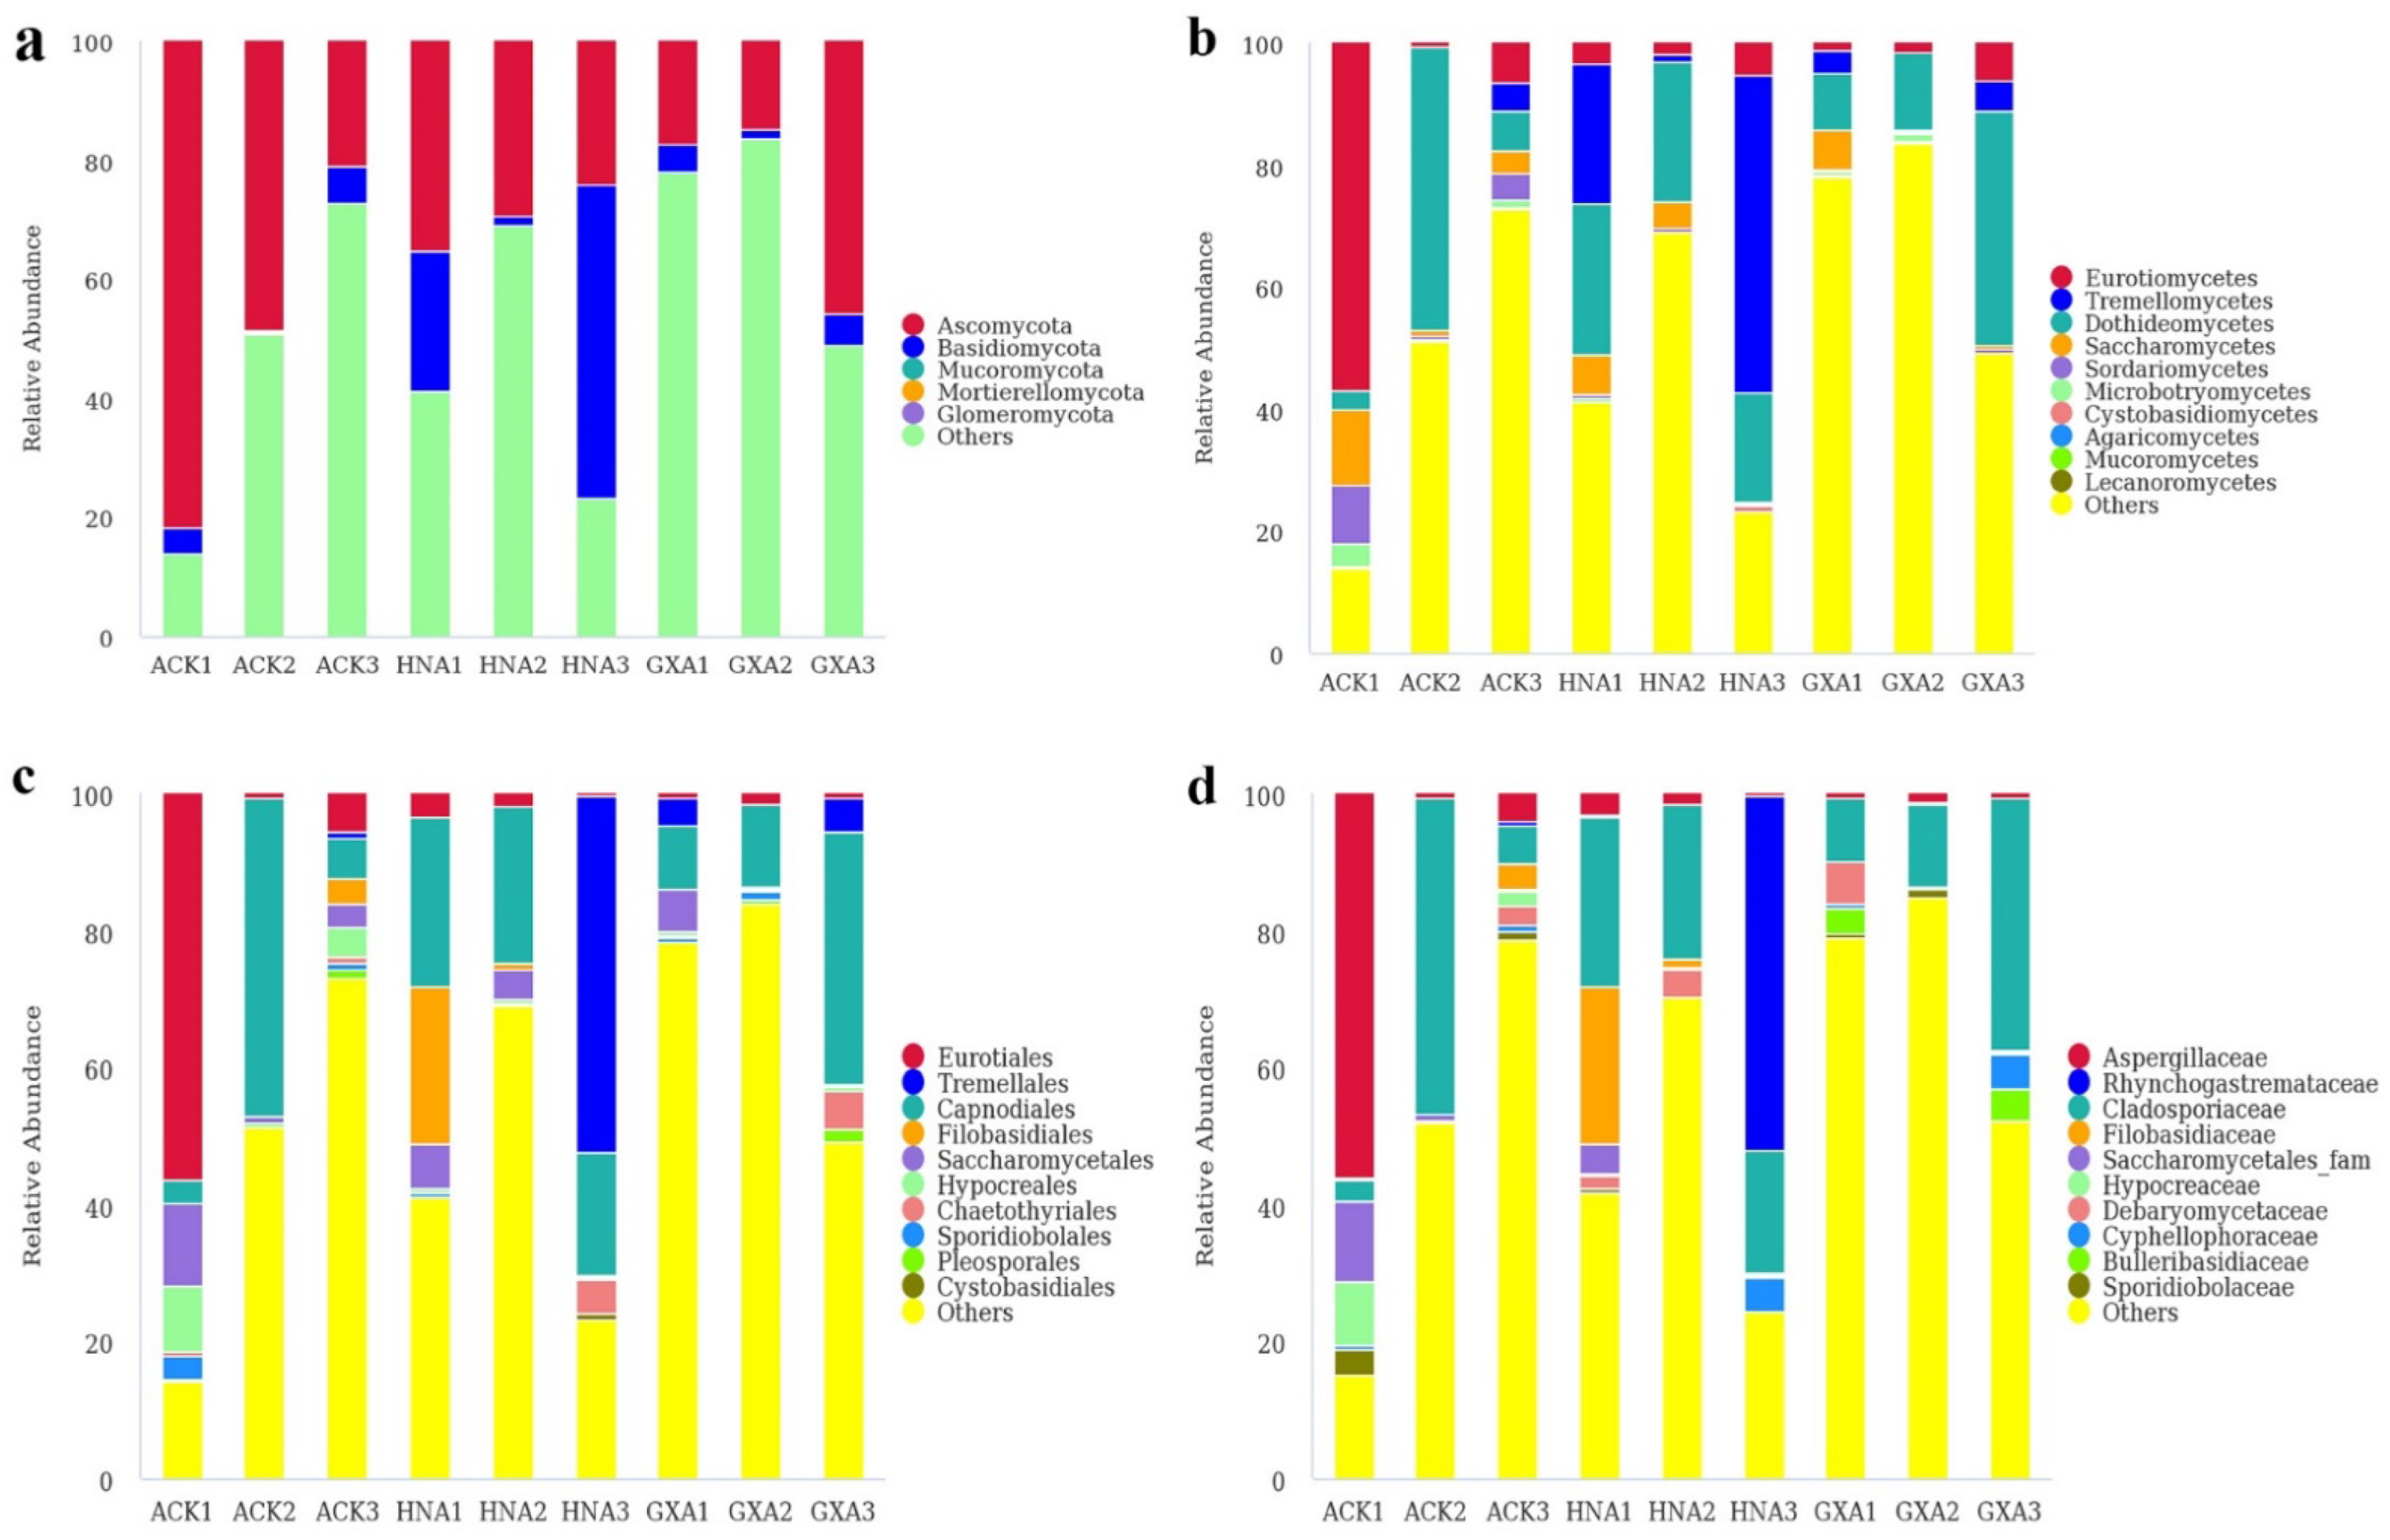
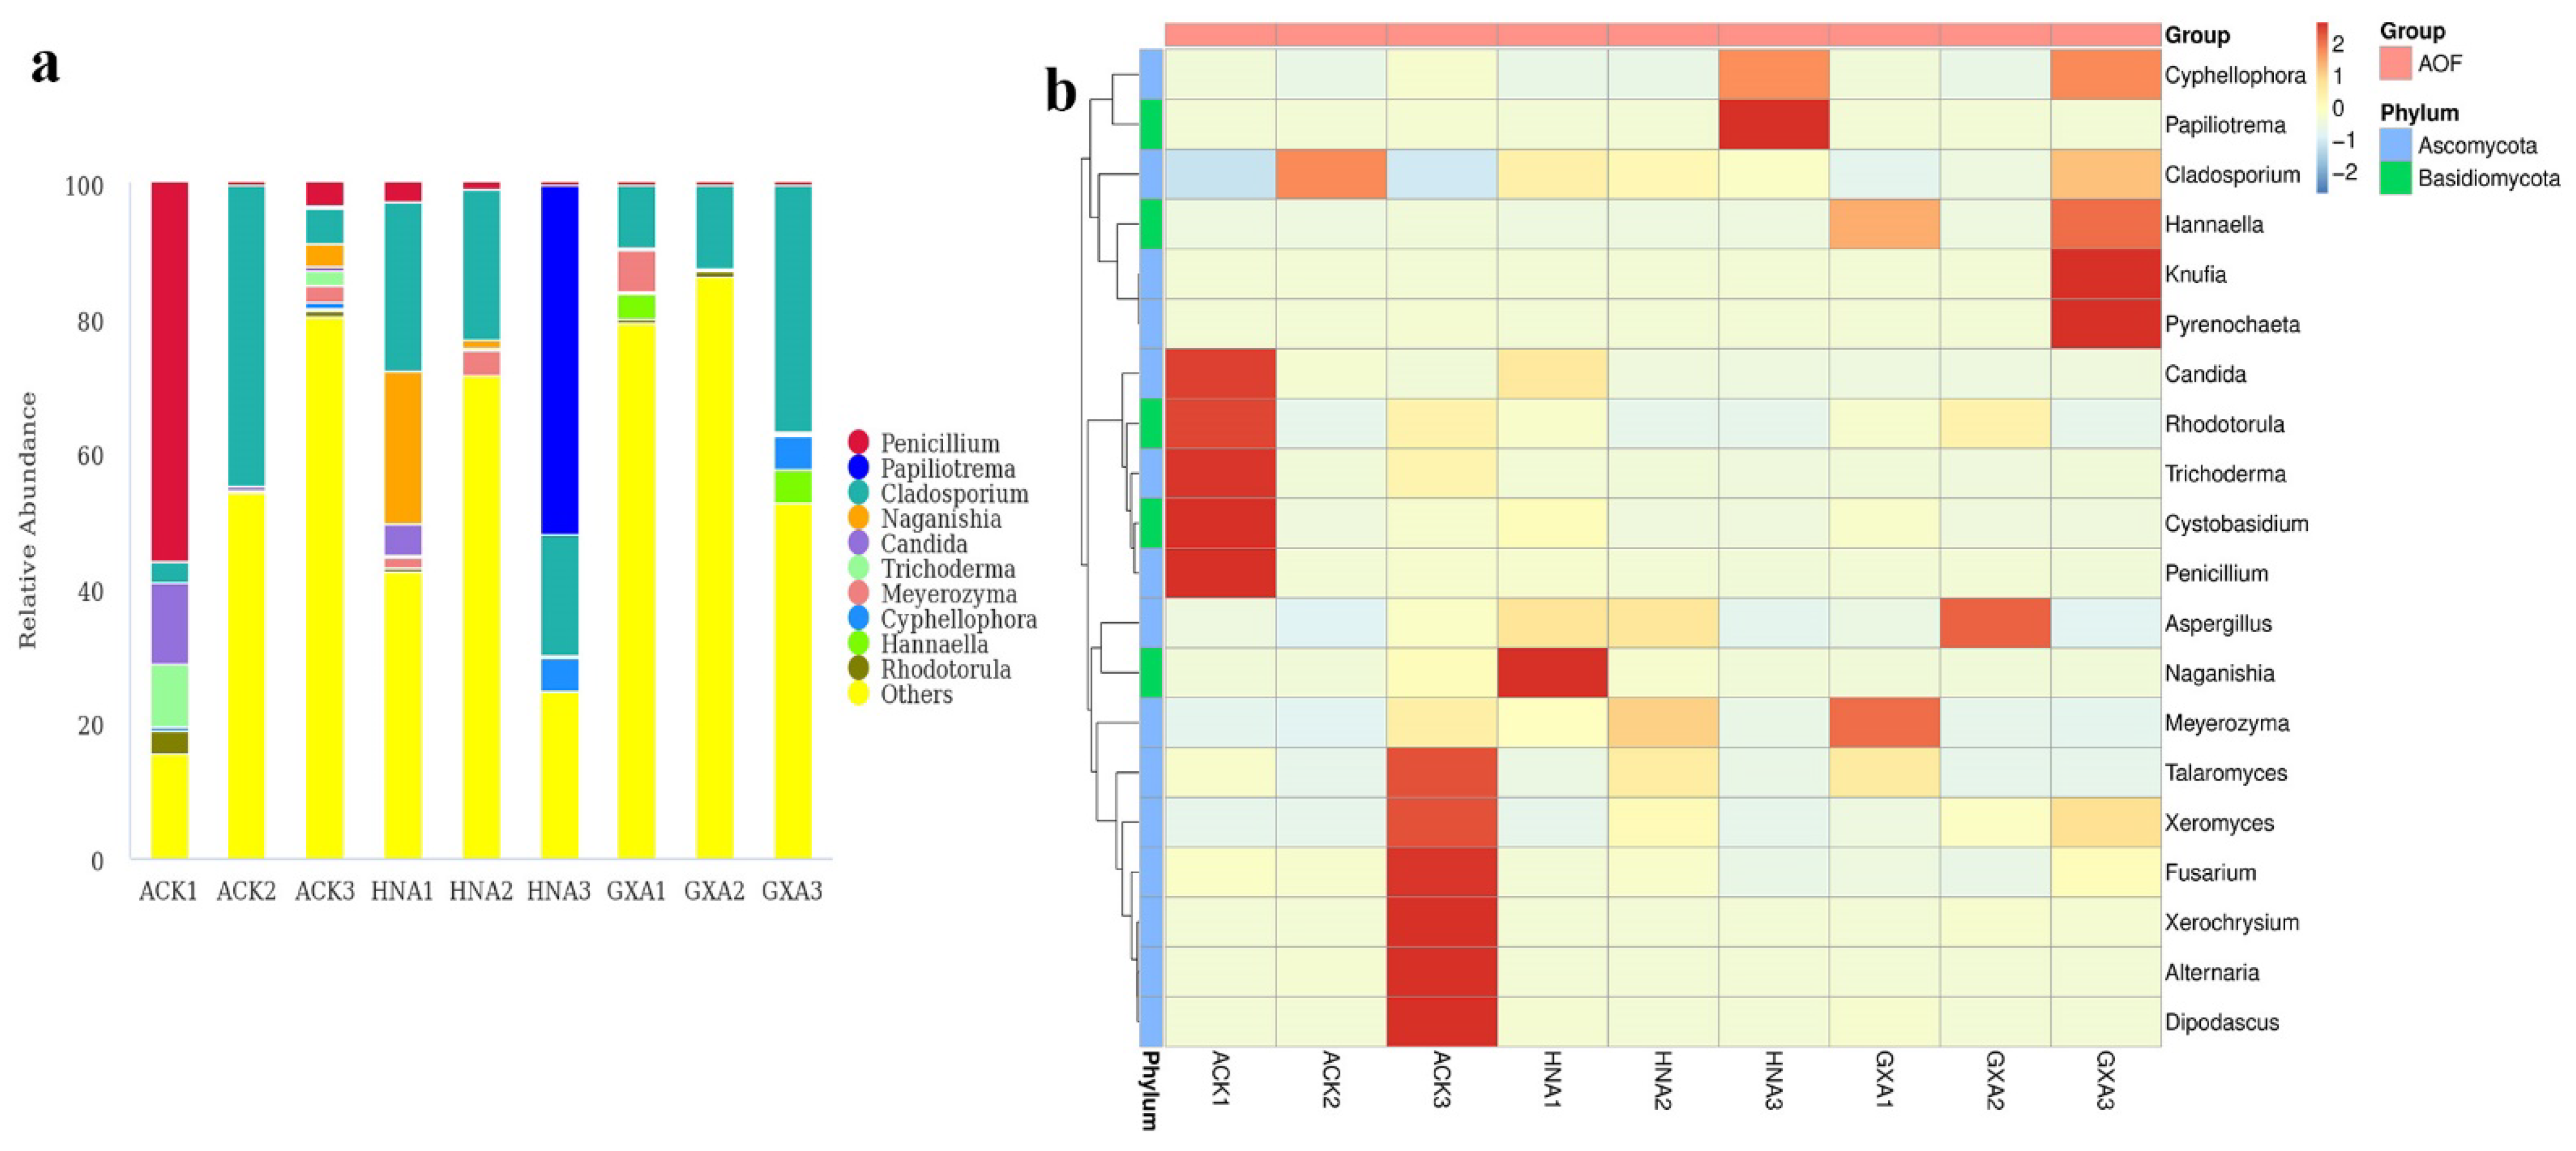
3.2. Composition of Fungal Microbiomes in MOR and AOF Samples

In the MOR group, the dominant phylum was Ascomycota with a relative abundance of 49.53–94.32%, whereas the other phyla were low in abundance (Figure 2a). Eurotiomycetes, Dothideomycetes, and Sordariomycetes were dominant at the class level, accounting for 2.09–78.91%, 1.88–57.02%, and 0.60–20.37% of the fungal reads, respectively (Figure 2b). At the order level, Capnodiales was predominant in MCK1, GDM3, GXM1, GXM2, and GXM3, whereas Eurotiales was predominant in MCK2, MCK3, GDM1, and GDM2 (Figure 2c). Further taxonomical classification demonstrated that Aspergillaceae (1.90–76.73%) was the most dominant at the family level, followed by Cladosporiaceae (1.83–56.78%) and Trichocomaceae (0.12–20.45%, Figure 2d). At the genus level, Penicillium (1.86–76.14%), Cladosporium (1.82–56.65%), Trichoderma (0.12–19.71%), Monascus (0.00–19.35%), and Talaromyces (0.18–19.71%) were the top 5 genera with the highest relative abundance (Figure 3a). The top 20 abundant genera were visualized using a heatmap, which showed the relative abundance of fungal genera in different samples (Figure 3b).
In the AOF group, Ascomycota was the most abundant phylum representing 14.81–81.85%, followed by Basidiomycota (0.36–52.57%, Figure 4a). At the class level, Eurotiomycetes (0.57–56.84%), Tremellomycetes (0.11–51.81%), and Dothideomycetes (3.13–46.37%) were prevalent (Figure 4b). Among the 39 orders detected, Eurotiales, Tremellales, and Capnodiales were dominant with the relative abundances of 0.41–56.29%, 0.09–51.78%, and 3.11–46.30%, respectively (Figure 4c). At the family level, the dominant fungi in samples ACK1 and HNA3 were Aspergillaceae (56.17%) and Rhynchogastremataceae (51.71%), respectively. Cladosporiaceae was dominant in the rest of the samples representing 5.71–46.30% (Figure 4d). Penicillium (0.27–56.06%), Papiliotrema (0.04–51.71%), and Cladosporium (3.08–44.41%) were dominant at the genus level (Figure 5a). Candida was the subdominant genus in the ACK1 with the relative abundance of 11.95%, while it accounted for low levels in other samples (0.00–4.51%). A heatmap of the 20 most abundant genera is presented in Figure 5b.
It is worth noting that a potential toxigenic fungus, namely, Trichoderma atroviride, was detected in all samples. Furthermore, another potential toxigenic fungus (Fusarium equiseti) was detected in four non-moldy samples (MCK1, MCK2, ACK1, and ACK3). The species and relative abundance of harmful fungi in each sample are shown in Supplementary Table S2.

3.3. Comparison of Fungal Microbiomes in MOR and AOF

ANOSIM analysis was applied to test the difference between the two groups; the results show that MOR and AOF express statistical differences in fungal microbiomes (R = 0.2, p = 0.009, Figure 6a). LEfSe analysis was performed to calculate the differences in fungal taxa from the phylum to species level between different groups (LDA score = 4.0). In contrast to AOF samples, MOR samples had more abundant Ascomycota, but had less Basidiomycota. The relative abundance of the Aspergillaceae family was much higher in MOR samples, whereas Amanitaceae was more abundant in AOF samples. Penicillium and Talaromyces were detected more frequently in MOR samples, whereas Amanita was more abundant in AOF samples (Figure 6b).
As for the moldy and non-moldy samples, the result of hierarchical clustering analysis indicates that samples are clustered according to the presence or absence of macroscopic molds (Figure 6c). LEfSe analysis showed that none of the fungal taxa was found to be enriched in the MA group. In the NM group, three orders (Eurotiales, Hypocreales, and Glomerellales), two families (Aspergillaceae and Hypocreaceae), and two genera (Penicillium and Trichoderma) were enriched. In the NA group, one family (Amanitaceae) and three genera (Amanita, Exophiala, and Clavispora) were enriched. Moreover, Talaromyces was enriched in the MM group (Figure 6d).

4. Discussion

4.1. The Necessity of Characterizing Fungal Microbiomes in MOR and AOF Samples

MOR and AOF are derived from the roots and fruits of plants, respectively. They are susceptible to fungal contamination during pre- and post-harvest processes owing to the lack of standard management. In our study, all 18 samples were contaminated with fungi. The relative abundances of fungi were varied in different samples. Ascomycota, Eurotiomycetes, Eurotiales, and Aspergillaceae were generally dominant at the phylum, class, order, and family levels in AOF and MOR samples, respectively. In general, Penicillium and Cladosporium were the dominant genera. In our previous studies, the predominant genus in four seed herbs (Platycladi Semen, Myristicae Semen, and Cassiae Semen) was Aspergillus [33,34,35]. The relationship between dominant fungi and herbs has not been well explained, owing to the complex factors that influence the fungal community. The storage conditions and matrix composition of CHMs may be responsible for the difference in fungal microbiomes between MOR and AOF. Moreover, the fungal microbiomes between moldy and non-moldy samples are different. All samples were clustered based on the presence or absence of visible molds in UPGMA, thus indicating the meaningfulness of grouping. Cladosporium and Penicillium were dominant in moldy and non-moldy samples, respectively.
Notably, all samples were contaminated with a potential toxigenic fungus, namely, Trichoderma atroviride. Additionally, four non-moldy samples were contaminated with another toxigenic fungus (Fusarium equiseti). Trichothecenes and zearalenone, which disturb hormonal balance and cause numerous diseases in the reproductive system, can be produced by F. equiseti [36,37]. The findings of our study are consistent with another study; potential mycotoxin-producing fungi were detected in non-moldy and moldy Ziziphi Spinosae Semen samples [38]. Similarly, Wei et al. detected AFs and OTA in six moldy and nine non-visible moldy Glycyrrhiza uralensis samples collected from China [39]. Therefore, the safety assessment of CHMs should not depend on whether macroscopic molds are present or not. Characterizing fungal microbiomes, especially potential toxigenic fungi, in MOR and AOF samples is essential, which is providing an early warning for mycotoxin contamination.

4.2. DNA Metabarcoding Is a Powerful Tool for the Analysis of Fungal Diversity in CHMs

Mycotoxins, the toxic secondary metabolites, can lead to numerous health problems and even death in just small intakes, and they are mainly produced by Penicillium, Aspergillus, and Fusarium [40]. Mycotoxins cannot degrade during storage and are difficult to remove from CHMs because of their thermostability [41,42]. Moreover, considerable transfer rates of AFs and OTA have been observed from herbal medicines to decoctions and pose a threat to consumer health [43,44]. Comprehensive and efficient fungi identification in CHMs is an important basis for preventing fungal and mycotoxin contamination. Current assessment methods for fungal contamination in CHMs are based on fungal isolation and culture, which may affect the real extent of fungal diversities because of the difficulty to cultivate and isolate certain microorganisms. The application of DNA metabarcoding could overcome this limitation and better reveal the fungal diversity. For example, Xia et al. found that 55 genera in Chinese Cordyceps that were not observed by culture-dependent methods were identified through Illumina Miseq sequencing [45]. Similarly, another study indicated that the number of fungi in Coix Seed detected by HTS was considerably greater than that by potato dextrose agar medium [46]. In addition, DNA metabarcoding also overcomes some of the limitations of a culture-dependent approach (e.g., time-consuming and complicated procedure). It could be used as an effective tool for the simultaneous characterization of numerous microbial species. In previous studies, DNA metabarcoding has been successfully applied in the investigation of fungal contamination in Platycladi Semen [33], Myristicae Semen [34], and Cassiae Semen [35]. In the present study, DNA metabarcoding efficiently analyzed the fungal microbiomes in MOR and AOF. Thus, it can serve as a powerful tool for identifying fungi in CHMs.

5. Conclusions

The fungal microbiomes in MOR and AOF were first investigated by DNA metabarcoding. The results highlight the effectiveness of the technique to analyze fungal diversity in CHMs and the need for the surveillance of marketed herbs to guarantee quality. This study provided an early warning for subsequent potential mycotoxin biosynthesis and can serve as a basis for the safe use of edible medicinal herbs.

Supplementary Materials

The following supporting information can be downloaded at: https://www.mdpi.com/article/10.3390/foods11121748/s1, Table S1: Taxonomical classification of OTUs; Table S2: The species and relative abundance of potential toxigenic fungi in each sample.

Author Contributions

Conceptualization, X.P.; methodology, W.J., M.Y. and X.P.; validation, X.P.; formal analysis, W.J., M.G., J.Y. and X.P.; resources, X.C.; data curation, W.J. and X.C.; writing—original draft, W.J. and X.C.; writing—review and editing, X.P.; funding acquisition, X.P. All authors have read and agreed to the published version of the manuscript.

Funding

This research was funded by the National Key Research and Development Program of China (grant number 2019YFC1604701) and the CAMS Innovation Fund for Medical Sciences (CIFMS) (grant number 2021-I2M-1-071).

Institutional Review Board Statement

Not applicable.

Informed Consent Statement

Not applicable.

Data Availability Statement

All related data and methods are presented in this paper. Additional inquiries should be addressed to the corresponding author.

Conflicts of Interest

The authors declare no conflict of interest.

References

  1. Chan, K. Some aspects of toxic contaminants in herbal medicines. Chemosphere 2003, 52, 1361–1371. [Google Scholar] [CrossRef] [Green Version]
  2. Ghisleni, D.D.M.; Braga, M.D.S.; Kikuchi, I.S.; Braşoveanu, M.; Nemţanu, M.R.; Dua, K.; Pinto, T.D.J.A. The Microbial Quality Aspects and Decontamination Approaches for the Herbal Medicinal Plants and Products: An in-Depth Review. Curr. Pharm. Des. 2016, 22, 4264–4287. [Google Scholar] [CrossRef] [PubMed]
  3. de Sousa Lima, C.M.; Fujishima, M.A.T.; de Paula Lima, B.; Mastroianni, P.C.; de Sousa, F.F.O.; da Silva, J.O. Microbial contamination in herbal medicines: A serious health hazard to elderly consumers. BMC Complement. Med. Ther. 2020, 20, 17. [Google Scholar] [CrossRef] [PubMed]
  4. Keter, L.; Too, R.; Mwikwabe, N.; Mutai, C.; Orwa, J.; Mwamburi, L.; Ndwigah, S.; Bii, C.; Korir, R. Risk of Fungi Associated with Aflatoxin and Fumonisin in Medicinal Herbal Products in the Kenyan Market. Sci. World J. 2017, 2017, 1892972. [Google Scholar] [CrossRef] [PubMed] [Green Version]
  5. Reinholds, I.; Bogdanova, E.; Pugajeva, I.; Alksne, L.; Stalberga, D.; Valcina, O.; Bartkevics, V. Determination of Fungi and Multi-Class Mycotoxins in Camelia sinensis and Herbal Teas and Dietary Exposure Assessment. Toxins 2020, 12, 555. [Google Scholar] [CrossRef] [PubMed]
  6. Waśkiewicz, A.; Beszterda, M.; Bocianowski, J.; Goliński, P. Natural occurrence of fumonisins and ochratoxin A in some herbs and spices commercialized in Poland analyzed by UPLC–MS/MS method. Food Microbiol. 2013, 36, 426–431. [Google Scholar] [CrossRef] [PubMed]
  7. Su, C.; Hu, Y.; Gao, D.; Luo, Y.I.; Chen, A.J.; Jiao, X.; Gao, W. Occurrence of Toxigenic Fungi and Mycotoxins on Root Herbs from Chinese Markets. J. Food Prot. 2018, 81, 754–761. [Google Scholar] [CrossRef]
  8. Chinese Pharmacopeia Commission. Pharmacopoeia of People’s Republic of China (Part 1); China Medical Science Press: Beijing, China, 2020; pp. 83, 303. [Google Scholar]
  9. Yip, K.; Xu, J.; Zhou, S.; Lau, Y.; Chen, Q.; Tang, Y.; Yang, Z.; Yao, Z.; Ding, P.; Chen, H.; et al. Characterization of Chemical Component Variations in Different Growth Years and Tissues of Morindae Officinalis Radix by Integrating Metabolomics and Glycomics. J. Agric. Food Chem. 2019, 67, 7304–7314. [Google Scholar] [CrossRef]
  10. Liang, J.; Liang, J.; Hao, H.; Lin, H.; Wang, P.; Wu, Y.; Jiang, X.; Fu, C.; Li, Q.; Ding, P.; et al. The Extracts of Morinda officinalis and Its Hairy Roots Attenuate Dextran Sodium Sulfate-Induced Chronic Ulcerative Colitis in Mice by Regulating Inflammation and Lymphocyte Apoptosis. Front. Immunol. 2017, 8, 905. [Google Scholar] [CrossRef]
  11. Song, B.; Wang, F.; Wang, W. Effect of Aqueous Extract from Morinda officinalis F. C. How on Microwave-Induced Hypothalamic-Pituitary-Testis Axis Impairment in Male Sprague-Dawley Rats. Evid. Based Complement. Altern. Med. 2015, 2015, 360730. [Google Scholar] [CrossRef] [Green Version]
  12. Chi, L.; Khan, I.; Lin, Z.; Zhang, J.; Lee, M.Y.S.; Leong, W.; Hsiao, W.L.W.; Zheng, Y. Fructo-oligosaccharides from Morinda officinalis remodeled gut microbiota and alleviated depression features in a stress rat model. Phytomedicine 2020, 67, 153157. [Google Scholar] [CrossRef] [PubMed]
  13. Zhang, Z.; Zhang, Q.; Yang, H.; Liu, W.; Zhang, N.; Qin, L.; Xin, H. Monotropein isolated from the roots of Morinda officinalis increases osteoblastic bone formation and prevents bone loss in ovariectomized mice. Fitoterapia 2016, 110, 166–172. [Google Scholar] [CrossRef] [PubMed]
  14. Zhang, J.H.; Xin, H.L.; Xu, Y.M.; Shen, Y.; He, Y.Q.; Hsien-Yeh; Lin, B.; Song, H.T.; Yang, H.Y.; Qin, L.P.; et al. Morinda officinalis How. A comprehensive review of traditional uses, phytochemistry and pharmacology. J. Ethnopharmacol. 2018, 213, 230–255. [Google Scholar] [CrossRef] [PubMed]
  15. Qing, Z.J.; Yong, W.; Hui, L.Y.; Yong, L.W.; Long, L.H.; Ao, D.J.; Xia, P.L. Two new natural products from the fruits of Alpinia oxyphylla with inhibitory effects on nitric oxide production in lipopolysaccharide-activated RAW264.7 macrophage cells. Arch. Pharm. Res. 2012, 35, 2143–2146. [Google Scholar] [CrossRef] [PubMed]
  16. Li, Y.H.; Chen, F.; Wang, J.F.; Wang, Y.; Zhang, J.Q.; Guo, T. Analysis of nine compounds from Alpinia oxyphylla fruit at different harvest time using UFLC-MS/MS and an extraction method optimized by orthogonal design. Chem. Cent. J. 2013, 7, 134. [Google Scholar] [CrossRef] [PubMed] [Green Version]
  17. An, L.J.; Guan, S.; Shi, G.F.; Bao, Y.M.; Duan, Y.L.; Jiang, B. Protocatechuic acid from Alpinia oxyphylla against MPP+-induced neurotoxicity in PC12 cells. Food Chem. Toxicol. 2006, 44, 436–443. [Google Scholar] [CrossRef]
  18. Shi, G.F.; An, L.J.; Jiang, B.; Guan, S.; Bao, Y.M. Alpinia protocatechuic acid protects against oxidative damage in vitro and reduces oxidative stress in vivo. Neurosci. Lett. 2006, 403, 206–210. [Google Scholar] [CrossRef] [PubMed]
  19. Jiang, K.; Huang, D.; Zhang, D.; Wang, X.; Cao, H.; Zhang, Q.; Yan, C. Investigation of inulins from the roots of Morinda officinalis for potential therapeutic application as anti-osteoporosis agent. Int. J. Biol. Macromol. 2018, 120, 170–179. [Google Scholar] [CrossRef]
  20. Zhao, X.; Wei, J.; Zhou, Y.; Kong, W.; Yang, M. Quality evaluation of Alpinia oxyphylla after Aspergillus flavus infection for storage conditions optimization. AMB Express 2017, 7, 151. [Google Scholar] [CrossRef] [Green Version]
  21. Taberlet, P.; Coissac, E.; Pompanon, F.; Christian, B.; Eske, W. Towards next-generation biodiversity assessment using DNA metabarcoding. Mol. Ecol. 2012, 21, 2045–2050. [Google Scholar] [CrossRef]
  22. Schoch, C.L.; Seifert, K.A.; Huhndorf, S.; Robert, V.; Spouge, J.L.; Levesque, C.A.; Chen, W. Nuclear ribosomal internal transcribed spacer (ITS) region as a universal DNA barcode marker for Fungi. Proc. Natl. Acad. Sci. USA 2012, 109, 6241–6246. [Google Scholar] [CrossRef] [PubMed] [Green Version]
  23. Nilsson, R.H.; Anslan, S.; Bahram, M.; Wurzbacher, C.; Baldrian, P.; Tedersoo, L. Mycobiome diversity: High-throughput sequencing and identification of fungi. Nat. Rev. Microbiol. 2019, 17, 95–109. [Google Scholar] [CrossRef] [PubMed]
  24. Huang, X.; Duan, N.; Xu, H.; Xie, T.N.; Xue, Y.R.; Liu, C.H. CTAB-PEG DNA Extraction from Fungi with High Contents of Polysaccharides. Mol. Biol. 2018, 52, 718–726. [Google Scholar] [CrossRef]
  25. Gardes, M.; Bruns, T.D. ITS primers with enhanced specificity for basidiomycetes—Application to the identification of mycorrhizae and rusts. Mol. Ecol. 1993, 2, 113–118. [Google Scholar] [CrossRef] [PubMed]
  26. White, T.J.; Bruns, T.; Lee, S.; Taylor, J. Amplification and Direct Sequencing of Fungal Ribosomal Rna Genes for Phylogenetics. In PCR Protocols; Innis, M.A., Gelfand, D.H., Sninsky, J.J., White, T.J., Eds.; Academic Press: San Diego, CA, USA, 1990; pp. 315–322. [Google Scholar]
  27. Martin, M. Cutadapt removes adapter sequences from high-throughput sequencing reads. EMBnet J. 2021, 1, 10–12. [Google Scholar] [CrossRef]
  28. Edgar, R.C. Search and clustering orders of magnitude faster than BLAST. Bioinformatics 2010, 26, 2460–2461. [Google Scholar] [CrossRef] [Green Version]
  29. Edgar, R.C. UPARSE: Highly accurate OTU sequences from microbial amplicon reads. Nat. Methods 2013, 10, 996–998. [Google Scholar] [CrossRef]
  30. Nilsson, R.H.; Larsson, K.H.; Taylor, A.; Bengtsson-Palme, J.; Jeppesen, T.S.; Schigel, D.; Kennedy, P.; Picard, K.; Glockner, F.O.; Tedersoo, L.; et al. The UNITE database for molecular identification of fungi: Handling dark taxa and parallel taxonomic classifications. Nucleic Acids Res. 2019, 47, D259–D264. [Google Scholar] [CrossRef]
  31. Caporaso, J.G.; Kuczynski, J.; Stombaugh, J.; Bittinger, K.; Bushman, F.D.; Costello, E.K.; Fierer, N.; Pẽa, A.G.; Goodrich, J.K.; Gordon, J.I.; et al. QIIME allows analysis of high-throughput community sequencing data. Nat. Methods 2010, 7, 335–336. [Google Scholar] [CrossRef] [Green Version]
  32. Segata, N.; Izard, J.; Waldron, L.; Gevers, D.; Miropolsky, L.; Garrett, W.S.; Huttenhower, C. Metagenomic biomarker discovery and explanation. Genome Biol. 2011, 12, R60. [Google Scholar] [CrossRef] [Green Version]
  33. Yu, J.; Guo, M.; Jiang, W.; Yang, M.; Pang, X. Assessment of the Microbiome and Potential Aflatoxin Associated with the Medicinal Herb Platycladus orientalis. Front Microbiol. 2020, 11, 582679. [Google Scholar] [CrossRef] [PubMed]
  34. Jiang, W.; Guo, M.; Yang, M.; Mantri, N.; Chen, X.; Pang, X. High-throughput analysis of fungal communities in Myristicae Semen. LWT Food Sci. Technol. 2020, 128, 109499. [Google Scholar] [CrossRef]
  35. Guo, M.; Jiang, W.; Yang, M.; Dou, X.; Pang, X. Characterizing fungal communities in medicinal and edible Cassiae Semen using high-throughput sequencing. Int. J. Food Microbiol. 2020, 319, 108496. [Google Scholar] [CrossRef] [PubMed]
  36. Kowalska, K.; Habrowska-Gorczynska, D.E.; Piastowska-Ciesielska, A.W. Zearalenone as an endocrine disruptor in humans. Environ. Toxicol. Pharmacol. 2016, 48, 141–149. [Google Scholar] [CrossRef] [PubMed]
  37. Barros, G.; Zanon, M.S.; Palazzini, J.M.; Haidukowski, M.; Pascale, M.; Chulze, S. Trichothecenes and zearalenone production by Fusarium equiseti and Fusarium semitectum species isolated from Argentinean soybean. Food Addit. Contam. Part A Chem. Anal. Control Expo. Risk Assess. 2012, 29, 1436–1442. [Google Scholar] [CrossRef] [PubMed]
  38. Guo, M.; Jiang, W.; Luo, J.; Yang, M.; Pang, X. Analysis of the Fungal Community in Ziziphi Spinosae Semen through High-Throughput Sequencing. Toxins 2018, 10, 494. [Google Scholar] [CrossRef] [Green Version]
  39. Wei, R.; Qiu, F.; Kong, W.; Wei, J.; Yang, M.; Luo, Z.; Qin, J.; Ma, X. Co-occurrence of aflatoxin B1, B2, G1, G2 and ochrotoxin A in Glycyrrhiza uralensis analyzed by HPLC-MS/MS. Food Control 2013, 32, 216–221. [Google Scholar] [CrossRef]
  40. Prouillac, C.; Koraichi, F.; Videmann, B.; Mazallon, M.; Rodriguez, F.; Baltas, M.; Lecoeur, S. In vitro toxicological effects of estrogenic mycotoxins on human placental cells: Structure activity relationships. Toxicol. Appl. Pharmacol. 2012, 259, 366–375. [Google Scholar] [CrossRef]
  41. Zinedine, A.; Soriano, J.M.; Molto, J.C.; Manes, J. Review on the toxicity, occurrence, metabolism, detoxification, regulations and intake of zearalenone: An oestrogenic mycotoxin. Food Chem. Toxicol. 2007, 45, 1–18. [Google Scholar] [CrossRef]
  42. Kong, W.; Wei, R.; Logrieco, A.F.; Wei, J.; Wen, J.; Xiao, X.; Yang, M. Occurrence of toxigenic fungi and determination of mycotoxins by HPLC-FLD in functional foods and spices in China markets. Food Chem. 2014, 146, 320–326. [Google Scholar] [CrossRef]
  43. Nian, Y.; Wang, H.; Ying, G.; Yang, M.; Wang, Z.; Kong, W.; Yang, S. Transfer rates of aflatoxins from herbal medicines to decoctions determined by an optimized high-performance liquid chromatography with fluorescence detection method. J. Pharm. Pharmacol. 2018, 70, 278–288. [Google Scholar] [CrossRef] [PubMed]
  44. Shim, W.B.; Ha, K.S.; Kim, M.G.; Kim, J.S.; Chung, D.H. Evaluation of the transfer rate of ochratoxin a to decoctions of herbal medicines. Food Sci. Biotechnol. 2014, 23, 2103–2108. [Google Scholar] [CrossRef]
  45. Xia, F.; Chen, X.; Guo, M.Y.; Bai, X.H.; Liu, Y.; Shen, G.R.; Li, Y.L.; Lin, J.; Zhou, X.W. High-throughput sequencing-based analysis of endogenetic fungal communities inhabiting the Chinese Cordyceps reveals unexpectedly high fungal diversity. Sci. Rep. 2016, 6, 33437. [Google Scholar] [CrossRef] [PubMed]
  46. Luo, X.; Li, H.; Jiang, D.; Meng, J.; Zhang, F.; Xu, Q.; Chen, X.; Liu, C.; Yang, Y. Analysis of Fungi on Coix (Coix lacryma-jobi) Seed and the Effect of Its Aqueous Extract on the Growth of Aspergillus flavus. J. Food Prot. 2019, 82, 1775–1782. [Google Scholar] [CrossRef]
Figure 1. Analysis of fungal diversity in MOR and AOF samples. (a) Venn diagram of OTUs in the MOR and AOF groups; (b) Venn diagram of OTUs in the moldy and non-moldy samples; (c) Rarefaction curves for OTUs in all samples; and (d) PCoA diagram. of fungal compositions in samples.
Foods 11 01748 g001
Figure 2. Fungal composition of the MOR samples at the phylum (a), class (b), order (c), and family (d) levels.
Foods 11 01748 g002
Figure 3. Composition analyses of the fungal microbiomes in the MOR samples. (a) Fungal composition in MOR samples at genus level; (b) Heatmap of the top 20 genera in MOR samples.
Foods 11 01748 g003
Figure 4. Fungal composition of the AOF samples at the phylum (a), class (b), order (c), and family (d) levels.
Foods 11 01748 g004
Figure 5. Composition analyses of the fungal microbiomes in the AOF samples. (a) Fungal composition in AOF samples at genus level; (b) Heatmap of the top 20 genera in AOF samples.
Foods 11 01748 g005
Figure 6. Comparison of fungal microbiomes in the MOR and AOF samples. (a) Evident difference in fungal microbiomes between the MOR and AOF groups based on ANOSIM; (b) Differentially abundant fungal taxa between the MOR and AOF groups; (c) UPGMA clustering based on unweighted UniFrac distance analysis; and (d) Differentially abundant fungal taxa between the moldy and non–moldy samples.
Foods 11 01748 g006
Table 1. Voucher information and GenBank accession numbers of the samples.
NameSample IDGroup MoldyGroup SourceGenBank
Accession No.
Morindae Officinalis RadixMCK1MORNoNMHaikou, HainanSAMN19591296
Morindae Officinalis RadixMCK2MORNoNMHaikou, HainanSAMN19591297
Morindae Officinalis RadixMCK3MORNoNMHaikou, HainanSAMN19591298
Morindae Officinalis RadixGDM1MORYesMMQingping, GuangdongSAMN19591299
Morindae Officinalis RadixGDM2MORYesMMQingping, GuangdongSAMN19591300
Morindae Officinalis RadixGDM3MORYesMMQingping, GuangdongSAMN19591301
Morindae Officinalis RadixGXM1MORYesMMYulin, GuangxiSAMN19591302
Morindae Officinalis RadixGXM2MORYesMMYulin, GuangxiSAMN19591303
Morindae Officinalis RadixGXM3MORYesMMYulin, GuangxiSAMN19591304
Alpiniae Oxyphyllae FructusACK1AOFNoNAHaikou, HainanSAMN19591305
Alpiniae Oxyphyllae FructusACK2AOFNoNAHaikou, HainanSAMN19591306
Alpiniae Oxyphyllae FructusACK3AOFNoNAHaikou, HainanSAMN19591307
Alpiniae Oxyphyllae FructusHNA1AOFYesMAQingping, GuangdongSAMN19591308
Alpiniae Oxyphyllae FructusHNA2AOFYesMAQingping, GuangdongSAMN19591309
Alpiniae Oxyphyllae FructusHNA3AOFYesMAQingping, GuangdongSAMN19591310
Alpiniae Oxyphyllae FructusGXA1AOFYesMAYulin, GuangxiSAMN19591311
Alpiniae Oxyphyllae FructusGXA2AOFYesMAYulin, GuangxiSAMN19591312
Alpiniae Oxyphyllae FructusGXA3AOFYesMAYulin, GuangxiSAMN19591313
Table 2. Alpha-diversity indices of samples.
Sample No.ShannonSimpsonChao1AceGoods_Coverage
MCK14.0550.857249.794257.6510.999
MCK23.7910.779364.441354.4970.998
MCK33.9710.865269.150282.9100.999
GDM14.4120.910315.250297.8790.998
GDM24.6180.902321.588323.1930.999
GDM34.0680.840347.370333.6590.998
GXM13.2690.721274.000280.8690.998
GXM23.4410.751243.077253.7480.999
GXM33.0980.679280.278294.3170.998
ACK13.1220.740349.241330.0540.998
ACK23.4030.766290.250300.3230.998
ACK34.0500.745424.241402.0270.998
HNA13.7060.843294.286309.5560.998
HNA24.8860.931315.038308.2070.999
HNA33.7860.803273.933276.3850.999
GXA13.4760.712311.838322.0780.998
GXA23.3980.761238.037244.680.999
GXA34.0640.839257.500269.8690.999
Publisher’s Note: MDPI stays neutral with regard to jurisdictional claims in published maps and institutional affiliations.

