
Development of Seven New dPCR Animal Species Assays and a Reference Material to Support Quantitative Ratio Measurements of Food and Feed Products
 , ,
, ,
Abstract
:1. Introduction
2. Materials and Methods
2.1. DNA, Meat and MBM Samples
2.2. DNA Extraction
2.3. Droplet Digital PCR
2.4. Preparing DNA Mixtures
2.5. Synthetic DNA RM
3. Results
3.1. Seven Novel Species-Specific Assays
3.2. Modifications to the Myostatin Assay
3.3. Confirmation of Copy Number Ratio between Myostatin and Species-Specific Assay Targets
3.4. Ratio Measurements from Meat Mixtures
3.5. Synthetic DNA Reference Material
3.6. Digital PCR Performance Is Impacted by Processing of the Meat Samples
4. Discussion
Author Contributions
Funding
Data Availability Statement
Conflicts of Interest
References
- Smith, M.; Ashraf, M.; Austin, C.; Lester, R. Product Fraud: Impacts on Australian Agriculture, Fisheries and Forestry Industries. AgriFutures Australia. 2021. Available online: https://agrifutures.com.au/wp-content/uploads/2021/11/21-039.pdf (accessed on 7 August 2023).
- Prado, M.; Berben, G.; Fumière, O.; Duijn, G.v.; Mensinga-Kruize, J.; Reaney, S.; Boix, A.; Holst, C.v. Detection of ruminant meat and bone meals in animal feed by real-time polymerase chain reaction: Result of an interlaboratory study. J. Agric. Food Chem. 2007, 55, 7495–7501. [Google Scholar] [CrossRef] [PubMed]
- Muflihah; Hardianto, A.; Kusumaningtyas, P.; Prabowo, S.; Hartati, Y.W. DNA-based detection of pork content in food. Heliyon 2023, 9, e14418. [Google Scholar] [CrossRef]
- Druml, B.; Kaltenbrunner, M.; Hochegger, R.; Cichna-Markl, M. A novel reference real-time PCR assay for the relative quantification of (game) meat species in raw and heat-processed food. Food Control 2016, 70, 392–400. [Google Scholar] [CrossRef]
- Iwobi, A.; Sebah, D.; Spielmann, G.; Maggipinto, M.; Schrempp, M.; Kraemer, I.; Gerdes, L.; Busch, U.; Huber, I. A multiplex real-time PCR method for the quantitative determination of equine (horse) fractions in meat products. Food Control 2017, 74, 89–97. [Google Scholar] [CrossRef]
- Ballin, N.Z.; Vogensen, F.K.; Karlsson, A.H. Species determination—Can we detect and quantify meat adulteration? Meat Sci. 2009, 83, 165–174. [Google Scholar] [CrossRef]
- Temisak, S.; Thangsunan, P.; Boonil, J.; Yenchum, W.; Hongthong, K.; Yata, T.; Rios-Solis, L.; Morris, P. Accurate determination of meat mass fractions using DNA measurements for quantifying meat adulteration. Int. J. Food Sci. Technol. 2021, 56, 6345–6358. [Google Scholar] [CrossRef]
- Cutarelli, A.; Fulgione, A.; Fraulo, P.; Serpe, F.P.; Gallo, P.; Biondi, L.; Corrado, F.; Citro, A.; Capuano, F. Droplet Digital PCR (ddPCR) Analysis for the Detection and Quantification of Cow DNA in Buffalo Mozzarella Cheese. Animals 2021, 11, 1270. [Google Scholar] [CrossRef]
- Chen, A.; Wei, C.; Chen, G.; Zhao, Y.; Yang, S. Duplex PCR approach for the detection and quantification of donkey, horse and mule in raw and heat-processed meat products. Food Sci. Technol. 2014, 50, 834–839. [Google Scholar] [CrossRef]
- Dolch, K.; Andrée, S.; Schwägele, F. Comparison of Real-Time PCR Quantification Methods in the Identification of Poultry Species in Meat Products. Foods 2020, 9, 1049. [Google Scholar] [CrossRef]
- Hebert, P.D.N.; Ratnasingham, S.; deWaard, J.R. Barcoding animal life: Cytochrome c oxidase subunit 1 divergences among closely related species. Proc. Biol. Sci. 2003, 270, S96–S99. [Google Scholar] [CrossRef]
- O’Hara, R.; Tedone, E.; Ludlow, A.; Huang, E.; Arosio, B.; Mari, D.; Shay, J.W. Quantitative mitochondrial DNA copy number determination using droplet digital PCR with single-cell resolution. Genome Res. 2019, 29, 1878–1888. [Google Scholar] [CrossRef] [PubMed]
- Qin, P.; Hong, Y.; Kim, H.-Y. Multiplex-PCR Assay for Simultaneous Identification of Lamb, Beef and Duck in Raw and Heat-Treated Meat Mixtures. Food Saf. 2015, 36, 367–374. [Google Scholar] [CrossRef]
- Chisholm, J.; Conyers, C.; Booth, C.; Lawley, W.; Hird, H. The detection of horse and donkey using real-time PCR. Meat Sci. 2005, 70, 727–732. [Google Scholar] [CrossRef] [PubMed]
- Floren, C.; Wiedemann, I.; Brenig, B.; Schütz, E.; Beck, J. Species identification and quantification in meat and meat products using droplet digital PCR (ddPCR). Food Chem. 2015, 173, 1054–1058. [Google Scholar] [CrossRef]
- Garcia, R.A.; Phillips, J.G. Physical distribution and characteristics of meat and bone meal protein. J. Sci. Food Agric. 2008, 89, 329–336. [Google Scholar] [CrossRef]
- Kaltenbrunner, M.; Hochegger, R.; Cichna-Markl, M. Tetraplex real-time PCR assay for the simultaneous identification and quantification of roe deer, red deer, fallow deer and silka deer for deer meat authenticarion. Food Chem. 2018, 269, 486–494. [Google Scholar] [CrossRef]
- Köppel, R.; Ganeshan, A.; Weber, S.; Pietsch, K.; Graf, C.; Hochegger, R.; Griffiths, K.; Burkhardt, S. Duplex digital PCR for the determination of meat proportions of sausages containing meat from chicken, turkey, horse, cow, pig and sheep. Eur. Food Res. Technol. 2019, 245, 853–862. [Google Scholar] [CrossRef]
- Köppel, R.; Ruf, J.; Rentsch, J. Multiplex real-time PCR for the detection and quantification of DNA from beef, pork, horse and sheep. Eur. Food Res. Technol. 2011, 232, 151–155. [Google Scholar] [CrossRef]
- Köppel, R.; Ruf, J.; Zimmerli, F.; Breitenmoser, A. Multiplex real-time PCR for the detection and quantification of DNA from beef, pork, chicken and turkey. Eur. Food Res. Technol. 2008, 227, 1199–1203. [Google Scholar] [CrossRef]
- Köppel, R.; Ganeshan, A.; Velsen, F.v.; Weber, S.; Schmid, J.; Graf, C.; Hochegger, R. Digital duplex versus real-time PCR for the determination of meat proportions from sausages containing pork and beef. Eur. Food Res. Technol. 2019, 245, 151–157. [Google Scholar] [CrossRef]
- Ren, J.; Deng, T.; Huang, W.; Chen, Y.; Ge, Y. A digital PCR method for identifying and quantifying adulteration of meat species in raw and processed food. PLoS ONE 2017, 12, e0173567. [Google Scholar] [CrossRef] [PubMed]
- Pinheiro, L.B.; Coleman, V.A.; Hindson, C.M.; Herrmann, J.; Hindson, B.J.; Bhat, S.; Emslie, K.R. Evaluation of a Droplet Digital Polymerase Chain Reaction Format for DNA Copy Number Quantification. Anal. Chem. 2011, 84, 1003–1011. [Google Scholar] [CrossRef] [PubMed]
- Laube, I.; Zagon, J.; Spiegelberg, A.; Butschke, A.; Kroh, L.W.; Broll, H. Development and design of a ‘ready-to-use’ reaction plate for a PCR-based simultaneous detection of animal species used in foods. Int. J. Food Sci. Technol. 2007, 42, 9–17. [Google Scholar] [CrossRef]
- Nixon, G.J.; Wilkes, T.M.; Burns, M.J. Development of a real-time PCR approach for the relative quantitation of horse DNA. Anal. Methods 2015, 20, 8590–8596. [Google Scholar] [CrossRef]
- Tan, E.T.T.; Ng, J.C.; Jassim, R.A.; D’Arcy, B.R.; Netzel, G.; Fletcher, M.T. Emerging food safety risk of hepatotoxic indospicine in feral Australian camel meat. Food Control 2020, 113, 107205. [Google Scholar] [CrossRef]
- Brodmann, P.D.; Moor, D. Senstive and semi-quantiative TaqMan real-time polymerase chain reaction systems for the detection of beef (Bos taurus) and the detection of the family Mammalia in food and feed. Meat Sci. 2003, 65, 599–607. [Google Scholar] [CrossRef]
- Laube, I.; Spiegelberg, A.; Butschke, A.; Zagon, J.; Schauzu, M.; Kroh, L.; Broll, H. Methods for the detection of beef and pork in foods using real-time polymerase chain reaction. Int. J. Food Sci. Technol. 2003, 38, 111–118. [Google Scholar] [CrossRef]
- Druml, B.; Hochegger, R.; Cichna-Markl, M. Duplex real-time PCR assay for the simultaneous determination of the roe deer (Capreolus capreolus) and deer (sum of fallow deer, red deer and sika deer) content in game meat products. Food Control 2015, 57, 370–376. [Google Scholar] [CrossRef]
- Druml, B.; Mayer, W.; Cichna-Markl, M.; Hochegger, R. Development and validation of a TaqMan real-time PCR assay for the identification and quantification of roe deer (Capreolus capreolus) in food to detect food adulteration. Food Chem. 2015, 178, 319–326. [Google Scholar] [CrossRef]
- Kaltenbrunner, M.; Hochegger, R.; Cichna-Markl, M. Red deer (Cervus elaphus)-specific real-time PCR assay for the detection of food adulteration. Food Control 2018, 89, 157–166. [Google Scholar] [CrossRef]
- Köppel, R.; Michael Daniels, N.F.; Brünen-Nieweler, C. Multiplex real-time PCR for the detection and quantification of DNA from duck, goose, chicken, turkey and pork. Eur. Food Res. Technol. 2013, 236, 1093–1098. [Google Scholar] [CrossRef]
- Emslie, K.R.; McLaughlin, J.L.H.; Griffiths, K.; Forbes-Smith, M.; Pinheiro, L.B.; Burke, D.G. Droplet Volume Variability and Impact on Digital PCR Copy Number Concentration Measurements. Anal. Chem. 2019, 91, 4124–4131. [Google Scholar] [CrossRef] [PubMed]
- ISO 17025:2017(E); General Requirements for the Competence of Testing and Calibration Laboratories. ISO: Geneva, Switzerland, 2017.


| Species | Name | Primer/Probe Sequence | Length |
|---|---|---|---|
| 1 Beef Assay, beta-actin gene | Rd 1 F | GTAGGTGCACAGTACGTTCTGAAG | 96 bp |
| Rd 1 R | GGCCAGACTGGGCACATG | ||
| Bos-ActiB_FAM | FAM-CGGCACACTCGGCTGTGTTCCTTGC-BHQ1 | ||
| 2 Pig Assay, beta-actin gene | Sus_ACTB-F | GGAGTGTGTATCCCGTAGGTG | 103 bp |
| Sus_ACTB-R | CTGGGGACATGCAGAGAGTG | ||
| Sus1_TMP | HEX-TCTGACGTGACTCCCCGACCTGG-BHQ1 | ||
| 2 Sheep Assay, prolactin receptor | OA-PRLR-F | CCAACATGCTTTTAAACCCTCAA | 88 bp |
| OA-PRLR-R | GGAACTGTAGCCTTCTGACTCG | ||
| OA-PRLR-FAM | FAM-TGCCTTTCCTTCCCCGCCAGTCTC-BHQ1 | ||
| 1 Chicken Assay, growth factor gene | Gallus1 F | CAGCTGGCCTGCCGG | 76 bp |
| Gallus1 R | CCCAGTGGAATGTGGTATTCA | ||
| Gallus1 TMP | HEX-TCTGCCACTCCTCTGCACCCAGT-BHQ1 | ||
| 6 Water Buffalo Assay, beta-actin gene | BubF_689776 | GTGCACAATACGTTCTGAAGTG | 110 bp |
| BubR_688804 | CCACAAGGGGCAGTCAA | ||
| BubP_686035F | FAM-ATCCCCAGCACACTTAGCTGTGTTCC-BHQ1 | ||
| 3 Goat Assay, cyclic GMP phosphodiesterase | capraPDE-f | TACCCATCAAGCAGACTCTAGCA | 96 bp |
| capraPDE-r | ATATTTCAGCTAAGGAAAAAAAAAGAAG | ||
| capraPDE-probe | HEX-ATTTTTGTCGCATTCGCTTCATCTGT-BHQ1 | ||
| 2 Horse Assay, growth hormone receptor | ec-ghr1-F | CCAACTTCATCATGGACAACGC | 107 bp |
| ec-ghr1-R | GTTAAAGCTTGGCTCGACACG | ||
| ec-ghr1-Cy5 | FAM-AAGTGCATCCCCGTGGCCCCTCA-BHQ1 | ||
| 6 Horse Assay, prolactin gene | EquF_638806 | GCAGTTGACAGCCCCACTT | 74 bp |
| EquR_636141 | TGCTGGTGTCAGATCTACTCT | ||
| EquP_632044F | FAM-GGGAGGCCACACTCTTGCACAAGAG -BHQ1 | ||
| 6 Donkey Assay, prolactin gene | AsiF_841634 | GCAGTTGACAGCCCCACTC | 74 bp |
| AsiR_848969 | TGCTGGTGTCAGATCTACTCC | ||
| AsiP_844970H | HEX-GGAGGCCACGCTCTTGCACAGG-BHQ1 | ||
| 6 Kangaroo Assay, omega globin gene | KanF_729413 | GCGTTGGGCTAAACTAGGTT | 91 bp |
| KanR_728566 | TCCTCTACCACATCCTCCAC | ||
| KanP_721842H | HEX-TGCGGGACCCTGGTCATGAGTGCTT-BHQ1 | ||
| 4 Turkey Assay, prolactin receptor | MG-ProlR-F | CAAAGAAAGCAGGGAAAAGGA | 83 bp |
| MG-ProlR-R | TGCACTCTCGTTGTTAAAAAGGA | ||
| MG-ProlR-Cy5 | FAM-CTGGGAAAGTTACTGTGTAGCCTCAGAACG-BHQ1 | ||
| 6 Duck Assay, prolactin receptor | AnaF_407450 | GAGATGTTCAAGAAAATAAAGCTGT | 91 bp |
| AnaR_408406 | CTCTCACTGTTAGAAAGGAGTG | ||
| AnaP_403910H | HEX-TGGGAAACTCAGTGTGTAGCCTCAGAACGG-BHQ1 | ||
| 6 Camel Assay, prolactin gene | CamF_309073 | CAGTTGACAGCCCCGCTG | 102 bp |
| CamR_308908 | TTAAGCAGGGTCGCTCTTGT | ||
| CamP_305227F | FAM-CACGCTGTTGCACAAGAGCAGATTTG-BHQ1 | ||
| 6 Crocodile/Alligator Assay, insulin gene | CrocF_470384 | TCTAGCCCCAGTGTCAGCTA | 91 bp |
| CrocR_471332 | CCCTTTCACCACACACCAGA | ||
| CrocP_477150H | HEX-CCAGCGCCTGTGTGGCTCTCAC-BHQ1 | ||
| Myostatin 77 bp Assays | 3 MYw-f | TTGTGCARATCCTGAGACTCAT | 77 bp |
| 5 MY77 reverse | GTCAAGTTTCARAGATCGRATT | ||
| MY77R_251895 | GTCAAGTTTCARAGATCGRATTCC | ||
| 3 MYw-probe | FAM-CCCATGAAAGACGGTACAAGRTATACTG-BHQ1 | ||
| MY97P_256895F_YR | FAM-CCCATGAAAGAYGGTACAAGRTATACTG-BHQ1 |
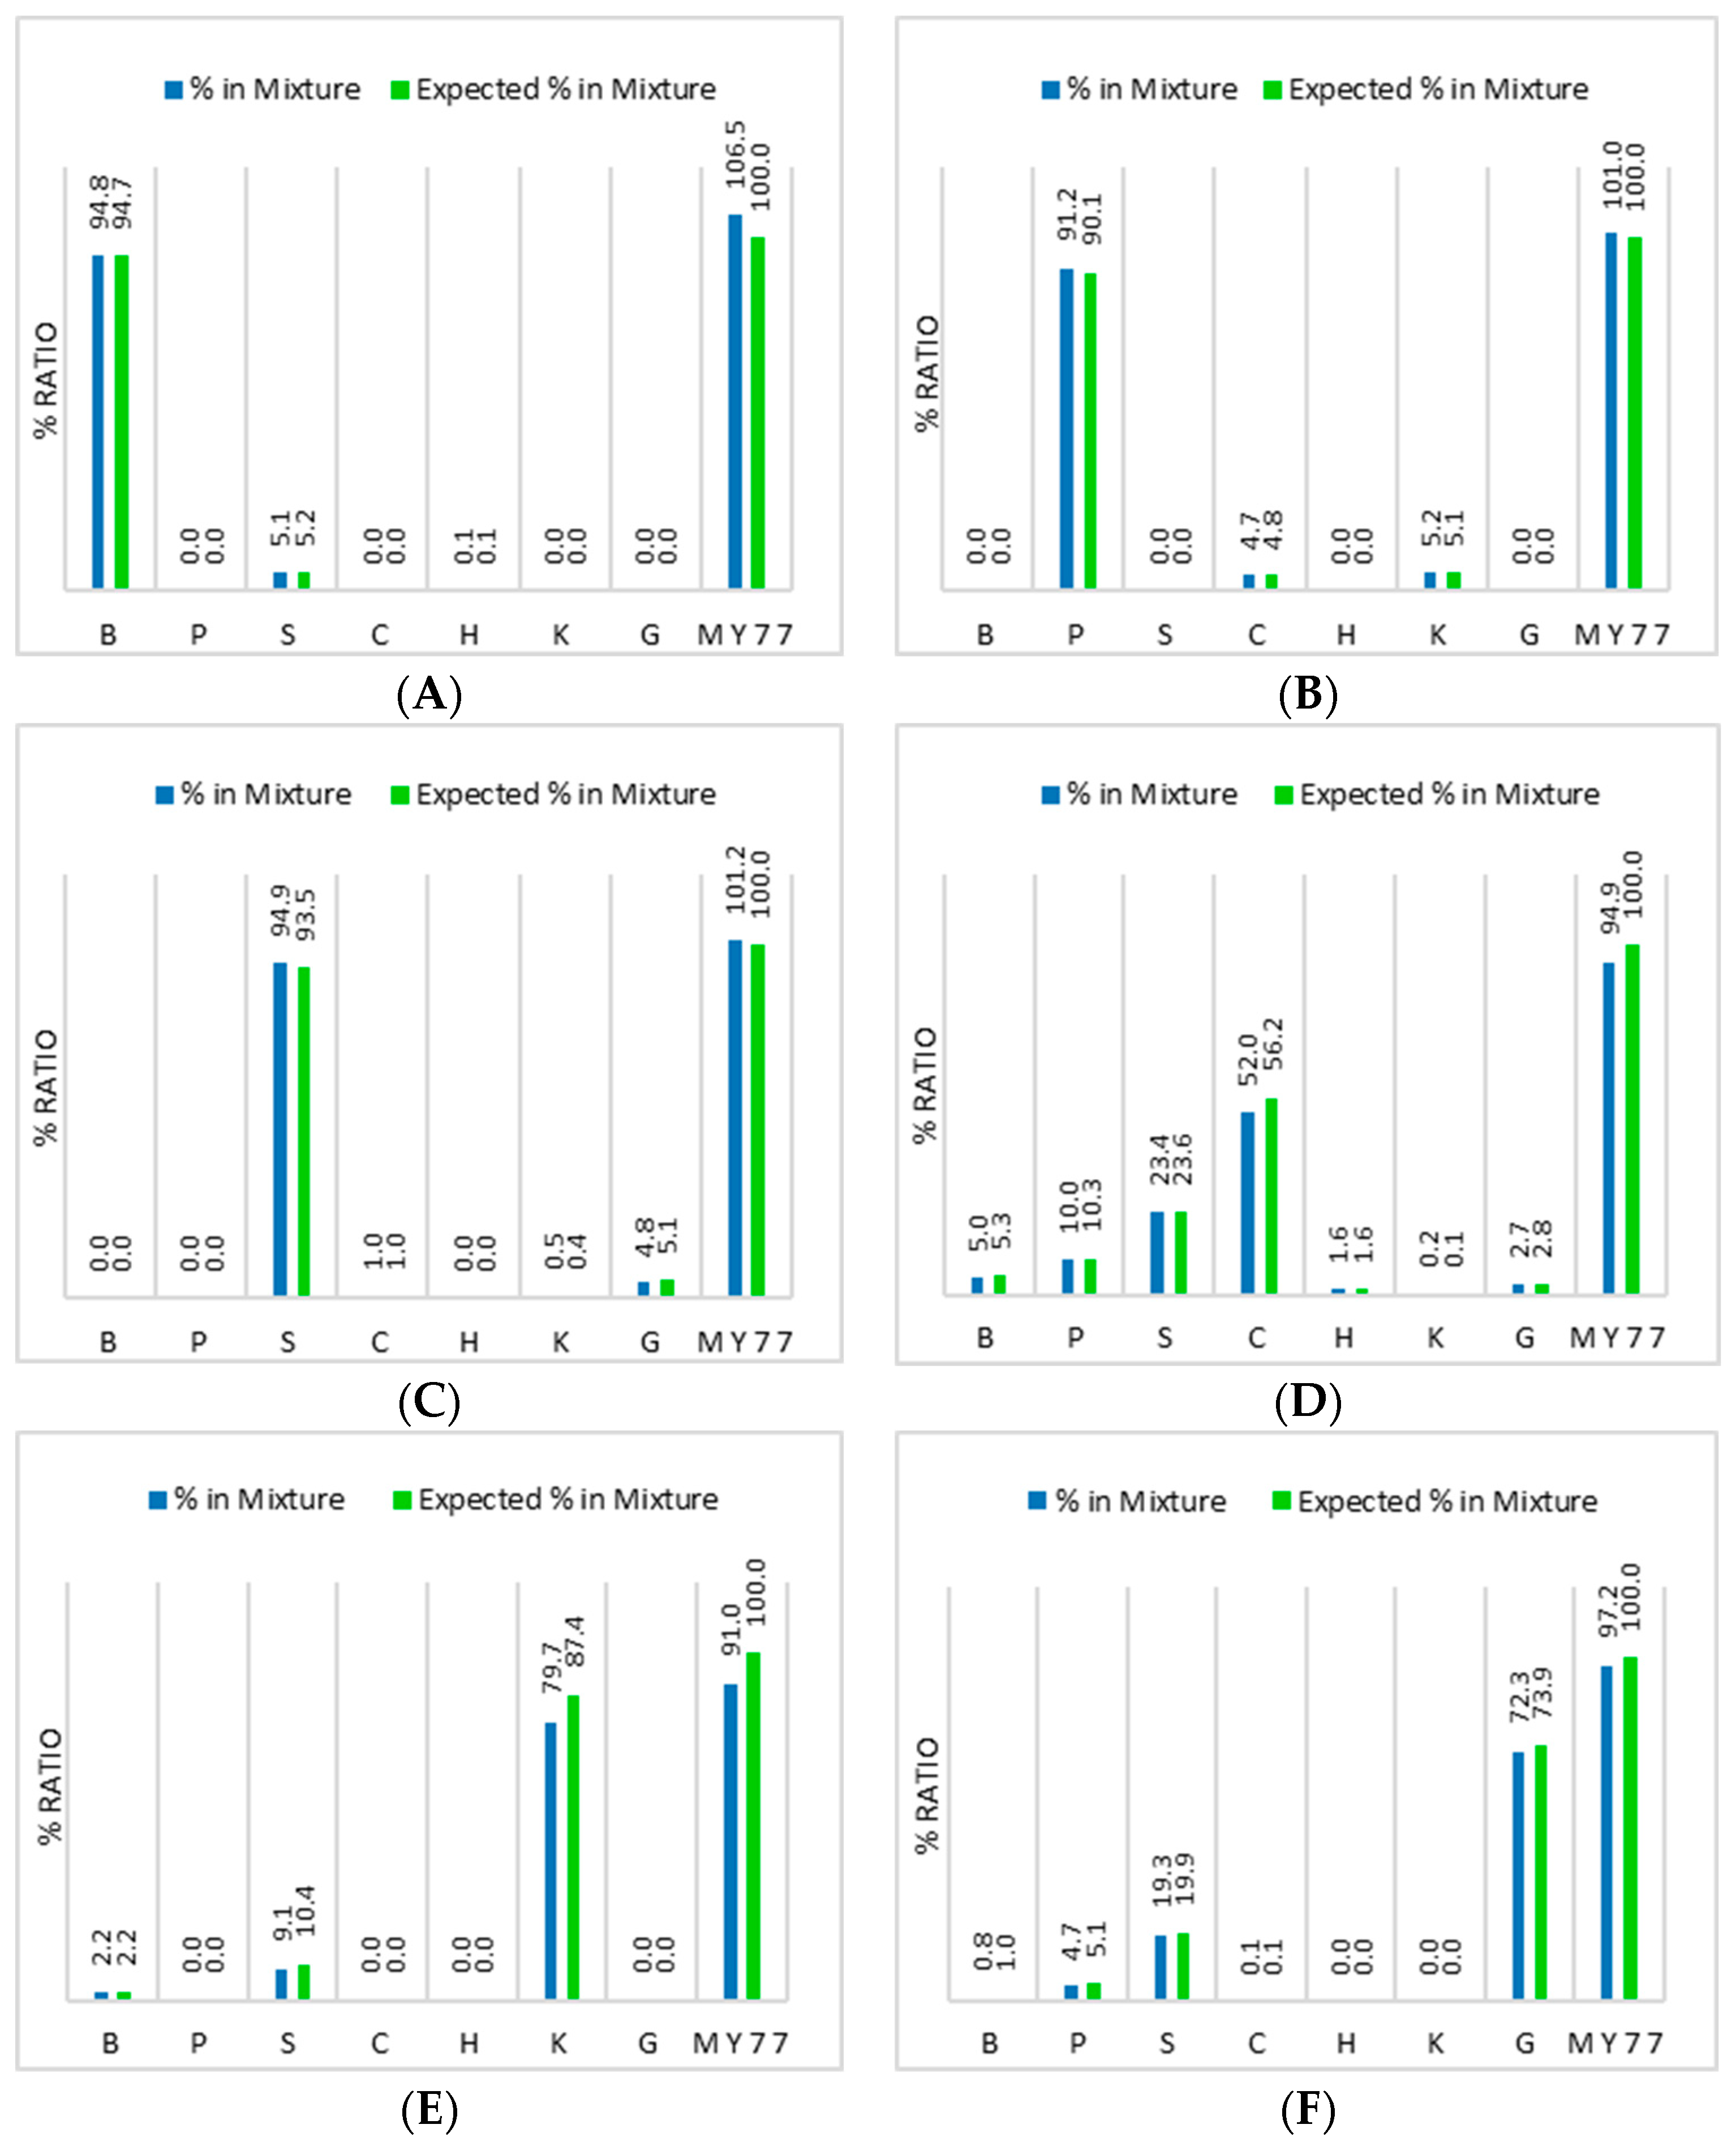
| Mixture 1 | Mixture 2 | Mixture 3 | Mixture 4 | Mixture 5 | Mixture 6 | |
|---|---|---|---|---|---|---|
| Beef DNA | 94.7% | - | - | 5.3% | 2.2% | 1.0% |
| Pig DNA | - | 90.1% | - | 10.3% | - | 5.1% |
| Sheep DNA | 5.2% | - | 93.5% | 23.6% | 10.4% | 19.9% |
| Chicken DNA | - | 4.8% | 1.0% | 56.2% | - | 0.1% |
| Horse DNA | 0.1% | - | - | 1.6% | - | - |
| Kangaroo DNA | - | 5.1% | 0.4% | 0.1% | 87.4% | - |
| Goat DNA | - | - | 5.1% | 2.8% | - | 73.9% |
Disclaimer/Publisher’s Note: The statements, opinions and data contained in all publications are solely those of the individual author(s) and contributor(s) and not of MDPI and/or the editor(s). MDPI and/or the editor(s) disclaim responsibility for any injury to people or property resulting from any ideas, methods, instructions or products referred to in the content. |
© 2023 by the authors. Licensee MDPI, Basel, Switzerland. This article is an open access article distributed under the terms and conditions of the Creative Commons Attribution (CC BY) license (https://creativecommons.org/licenses/by/4.0/).
Share and Cite
Griffiths, K.R.; McLaughlin, J.L.H.; Hall, F.; Partis, L.; Hansen, S.C.; Tulloch, R.; Burke, D.G. Development of Seven New dPCR Animal Species Assays and a Reference Material to Support Quantitative Ratio Measurements of Food and Feed Products. Foods 2023, 12, 3839. https://doi.org/10.3390/foods12203839
Griffiths KR, McLaughlin JLH, Hall F, Partis L, Hansen SC, Tulloch R, Burke DG. Development of Seven New dPCR Animal Species Assays and a Reference Material to Support Quantitative Ratio Measurements of Food and Feed Products. Foods. 2023; 12(20):3839. https://doi.org/10.3390/foods12203839
Chicago/Turabian StyleGriffiths, Kate R., Jacob L. H. McLaughlin, Felicity Hall, Lina Partis, Samuel C. Hansen, Rachel Tulloch, and Daniel G. Burke. 2023. "Development of Seven New dPCR Animal Species Assays and a Reference Material to Support Quantitative Ratio Measurements of Food and Feed Products" Foods 12, no. 20: 3839. https://doi.org/10.3390/foods12203839