Article

The Authentication of Gayo Arabica Green Coffee Beans with Different Cherry Processing Methods Using Portable LED-Based Fluorescence Spectroscopy and Chemometrics Analysis

by
Meinilwita Yulia
1,2,
Analianasari Analianasari
1,
Slamet Widodo
3,
Kusumiyati Kusumiyati
4,
Hirotaka Naito
5 and
Diding Suhandy
2,6,*
1
Department of Agricultural Technology, Lampung State Polytechnic, Jl. Soekarno Hatta No. 10, Rajabasa, Bandar Lampung 35141, Indonesia
2
Spectroscopy Research Group (SRG), Laboratory of Bioprocess and Postharvest Engineering, Department of Agricultural Engineering, The University of Lampung, Bandar Lampung 35145, Indonesia
3
Department of Mechanical and Biosystem Engineering, Faculty of Agricultural Engineering and Technology, IPB University, Dramaga, Bogor 16680, Indonesia
4
Department of Agronomy, Faculty of Agriculture, Universitas Padjadjaran, Sumedang 45363, Indonesia
5
Department of Environmental Science and Technology, Graduate School of Bioresources, Mie University, 1577 Kurima-machiya-cho, Tsu-city 514-8507, Mie, Japan
6
Department of Agricultural Engineering, Faculty of Agriculture, The University of Lampung, Jl. Soemantri Brojonegoro No. 1, Bandar Lampung 35145, Indonesia
*
Author to whom correspondence should be addressed.
Foods 2023, 12(23), 4302; https://doi.org/10.3390/foods12234302
Submission received: 30 October 2023 / Revised: 24 November 2023 / Accepted: 24 November 2023 / Published: 28 November 2023

Abstract

:
Aceh is an important region for the production of high-quality Gayo arabica coffee in Indonesia. In this area, several coffee cherry processing methods are well implemented including the honey process (HP), wine process (WP), and natural process (NP). The most significant difference between the three coffee cherry processing methods is the fermentation process: HP is a process of pulped coffee bean fermentation, WP is coffee cherry fermentation, and NP is no fermentation. It is well known that the WP green coffee beans are better in quality and are sold at higher prices compared with the HP and NP green coffee beans. In this present study, we evaluated the utilization of fluorescence information to discriminate Gayo arabica green coffee beans from different cherry processing methods using portable fluorescence spectroscopy and chemometrics analysis. A total of 300 samples were used (n = 100 for HP, WP, and NP, respectively). Each sample consisted of three selected non-defective green coffee beans. Fluorescence spectral data from 348.5 nm to 866.5 nm were obtained by exciting the intact green coffee beans using a portable spectrometer equipped with four 365 nm LED lamps. The result showed that the fermented green coffee beans (HP and WP) were closely mapped and mostly clustered on the left side of PC1, with negative scores. The non-fermented (NP) green coffee beans were clustered mostly on the right of PC1 with positive scores. The results of the classification using partial least squares–discriminant analysis (PLS-DA), linear discriminant analysis (LDA), and principal component analysis–linear discriminant analysis (PCA-LDA) are acceptable, with an accuracy of more than 80% reported. The highest accuracy of prediction of 96.67% was obtained by using the PCA-LDA model. Our recent results show the potential application of portable fluorescence spectroscopy using LED lamps to classify and authenticate the Gayo arabica green coffee beans according to their different cherry processing methods. This innovative method is more affordable and could be easy to implement (in terms of both affordability and practicability) in the coffee industry in Indonesia.

1. Introduction

Coffee is one of the most important crop products in the world, with Indonesia playing an important role as the fourth largest global coffee producer. Indonesia contributes an average annual production of 683.64 million kg per year (which is about 11%) to the world’s global coffee production [1,2]. In Indonesia, several expensive green coffee beans such as Gayo arabica coffee are produced in the Aceh province, which has a specific climate and unique cherry processing methods [2]. Gayo arabica coffee is also well known as one of the important specialty coffees with a high quality and which is traded at an expensive price [3]. There are three main regions in Aceh province for high-quality Gayo green coffee bean production sites, namely, Central Aceh, Bener Meriah, and Gayo Lues region, which contribute 28.23% to the total Indonesian coffee production [2]. In many areas in Indonesia, several different coffee cherry processing methods have been implemented, including dry or natural, wet (fully washed), and honey or semi-dry processes [4,5]. Fermented Gayo arabica green coffee beans, known as Gayo arabica wine coffee, are also recognized as important arabica green coffee beans from Aceh, with international recognition as the most expensive Gayo arabica coffee in the world. For this reason, the price of Gayo arabica green coffee beans is strongly influenced by the cherry processing methods used [4].
For accurate authentication of green coffee beans, several analytical methods based on physical, chemical, and optical properties have been well reported. Some physical features of green coffee beans such as color, shape, and size are directly related to high-quality beans. Using that information, an application of a computer vision system for quality and defect inspection of green coffee beans has been established, and 90% accuracy could be obtained [6]. This imaging system is easy to use, relatively low-cost, and a green technology where intact measurements of green coffee beans can be established. However, this method is not believed to be suitable for evaluating green coffee beans with similar physical properties such as the evaluation of several green coffee beans from the same variety [6]. High-performance liquid chromatography (HPLC) has been selected by many researchers as the most versatile targeted analytical method for assessing the quality of green coffee beans based on chemical properties [7,8]. The results are accurate. However, several drawbacks exist such as being expensive, time-consuming, laborious with the involved chemical-based sample preparation, and technically not available in most laboratories in developing countries such as Indonesia [9].
On the other hand, various spectroscopy-based analytical methods using optical properties as a potential marker are available. These could be used for the non-targeted discrimination of intact green coffee beans according to different types of beans, cherry processing methods, and beans’ geographical origin. Arabica green coffee beans with a better quality and selling at higher prices could be successfully discriminated from robusta green coffee beans using Raman spectroscopy, near-infrared (NIR) spectroscopy, and laser-induced breakdown spectroscopy (LIBS) [10,11,12,13,14]. The identification of coffee variety (mostly to separate between arabica and robusta green coffee beans) was also evaluated by using nuclear magnetic resonance (NMR) spectroscopy and mid-infrared (MIR) spectroscopy [15,16]. Several spectroscopy methods in different electromagnetic regions, from NIR to Terahertz (THz), have been used to authenticate green coffee beans according to different cherry processing methods [17,18,19,20]. In particular, recently, the UV-visible region (usually from 200 nm to 700 nm) has been popular as a simple spectroscopic tool for green coffee bean authentication, both through using absorbance and fluorescence spectral data [21,22,23,24,25]. Overall, spectroscopy-based methods for green coffee bean evaluation are acceptable, with fast spectral data measurement and relatively affordable instrumentation. Spectroscopy is mostly a green method that is environmentally friendly and leads to zero chemical waste as well as the possibility for intact and in situ spectral acquisition without any sample preparation.
Currently, the utilization of a portable spectrometer equipped with LED lamps as a light source for quality evaluation purposes has been raised due to its affordability and flexibility. However, there are also several drawbacks of LED-based spectroscopy, such as the spectral range limitation and the necessity of arranging multiple LEDs for multiple excitation wavelengths. LED-based fluorescence spectroscopy with multiple LED excitation lamps will have a low spectral resolution compared with conventional spectroscopy systems [26,27,28]. On the other hand, Suhandy et al. [29] reported an authentication method based on portable and single LED-based fluorescence spectroscopy to assess adulteration in stingless bee honey (SBH). Preliminary laboratory work on the application of LED-based fluorescence spectroscopy on instant coffee geographic discrimination has been reported [30]. However, according to the literature and to the best of our knowledge, the application of portable and single LED-based fluorescence spectroscopy for intact green coffee bean authentication has not yet been studied. For this reason, in this study, we aimed to evaluate a promising application of portable and single LED-based fluorescence spectroscopy to evaluate Gayo arabica green coffee beans according to their different cherry processing methods. Three classification methods based on PLS-DA, LDA, and PCA-LDA were used to perform supervised classification tasks.

2. Materials and Methods

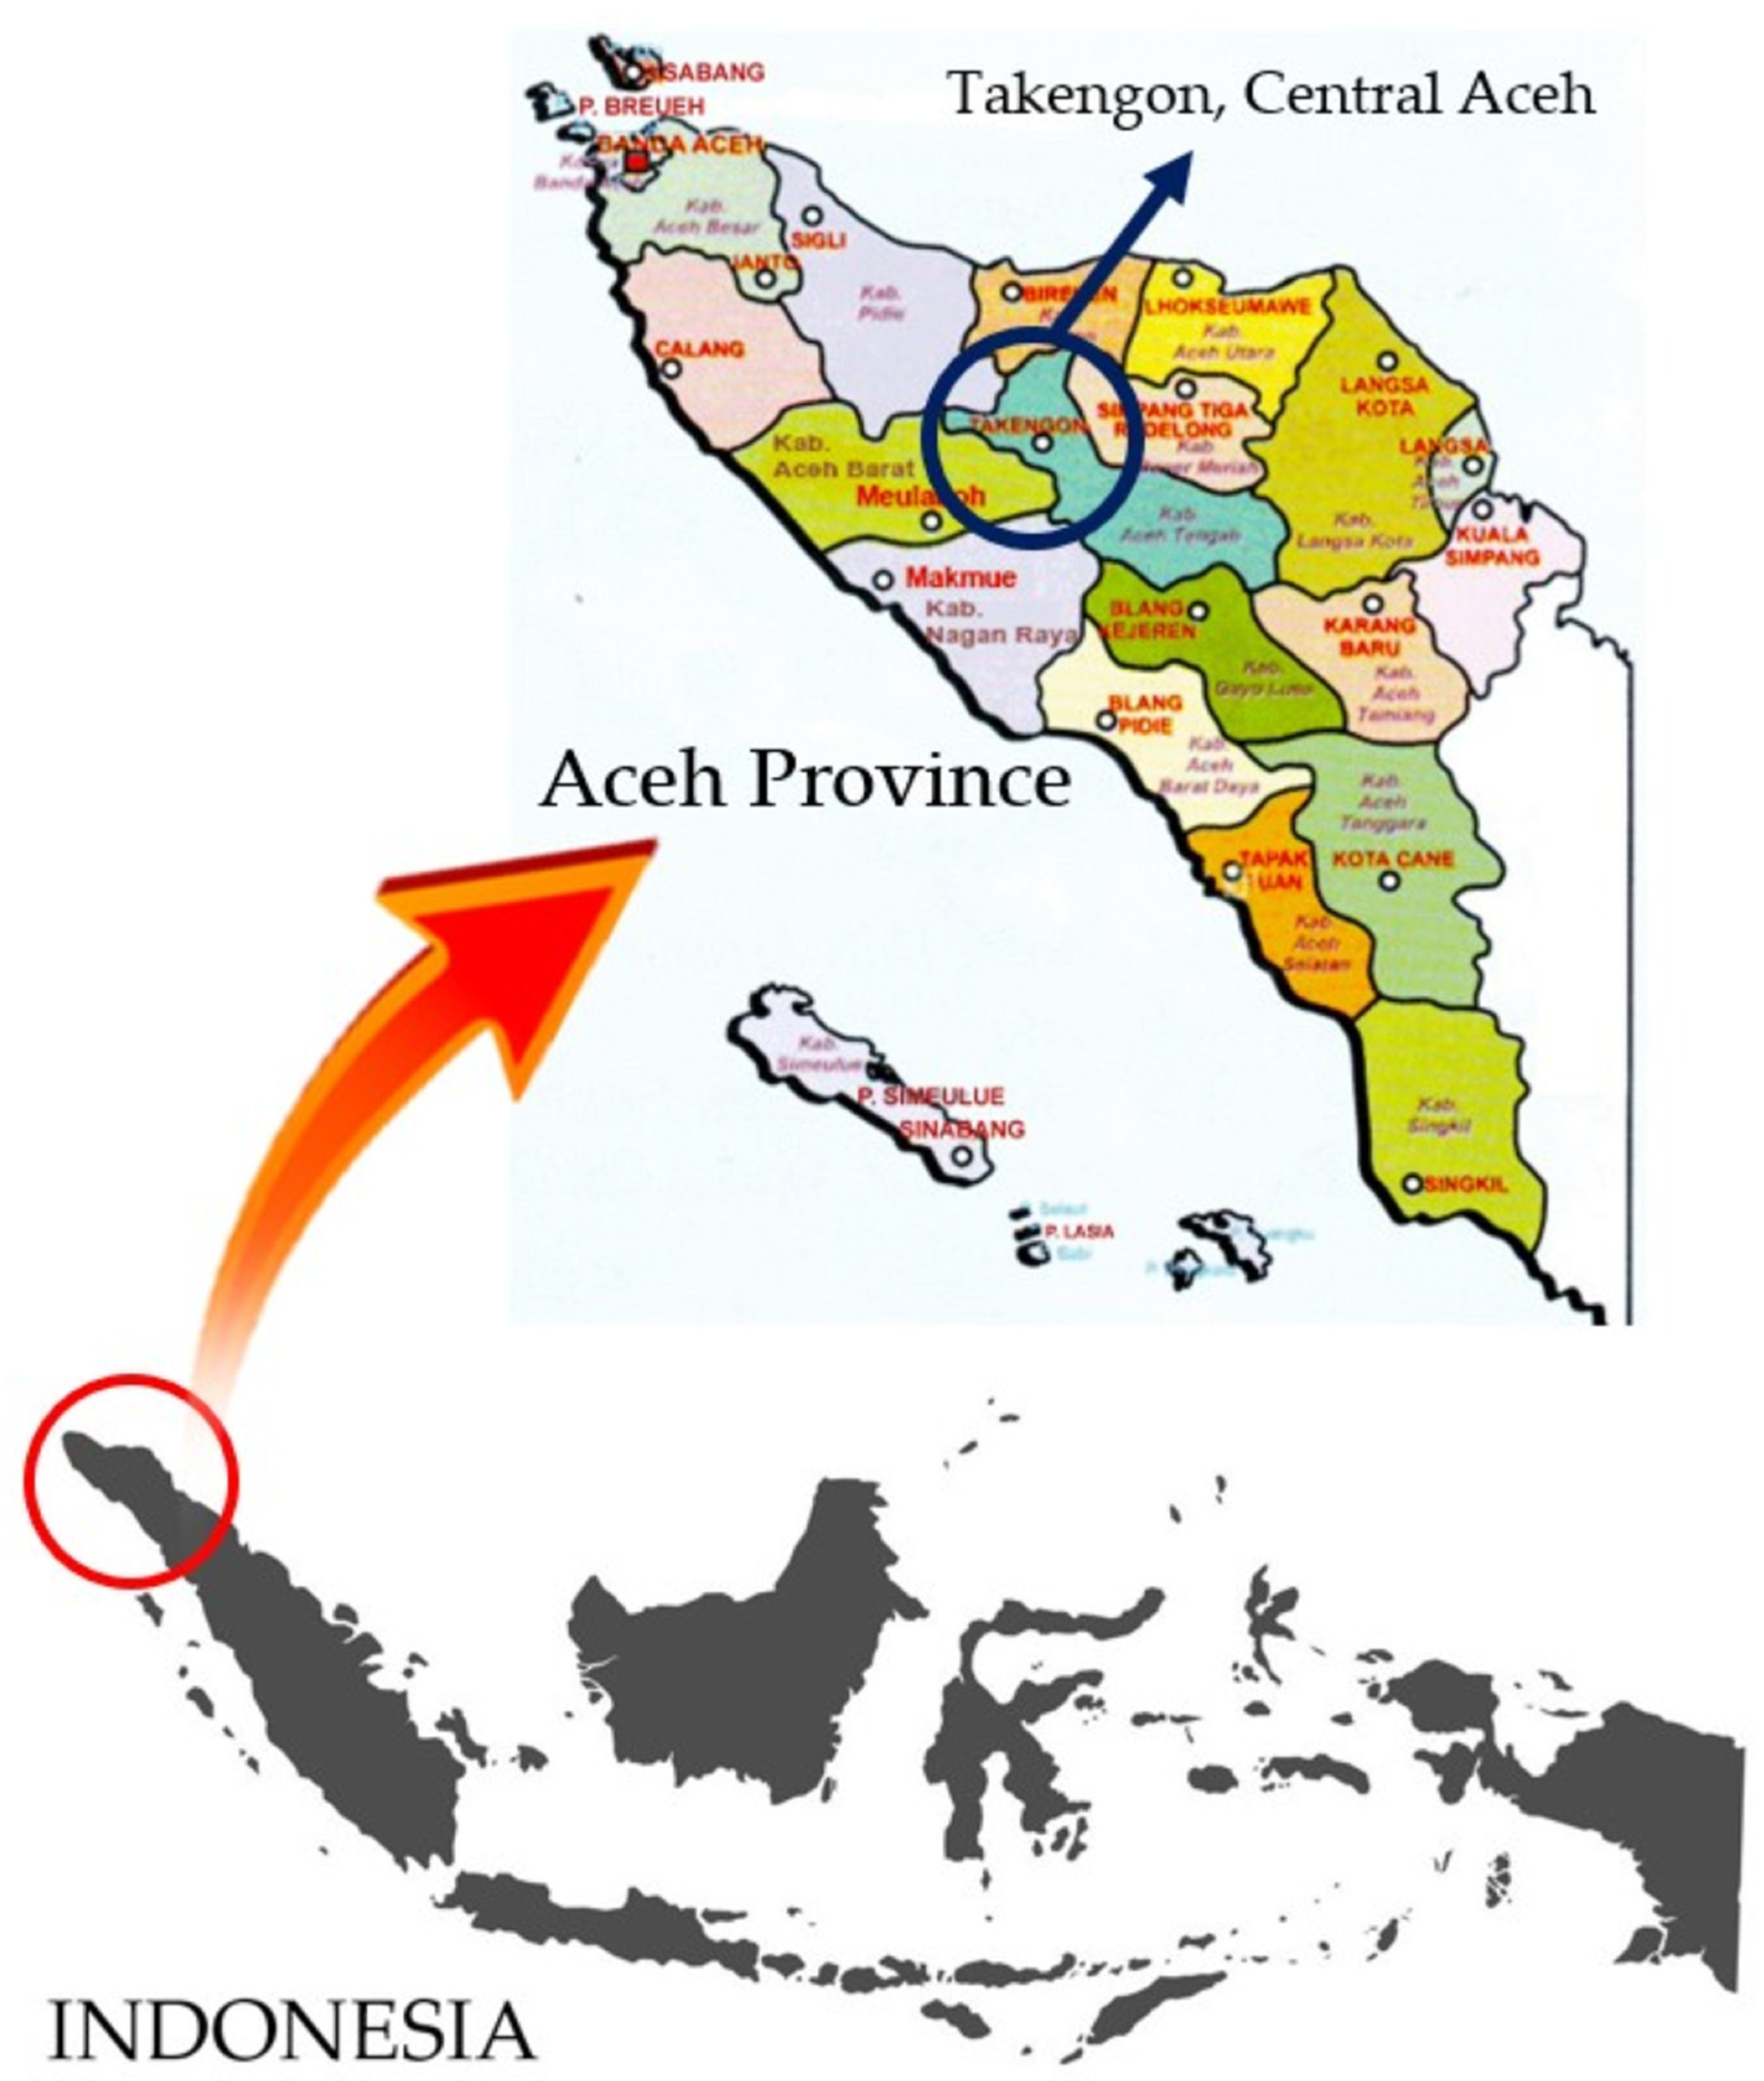
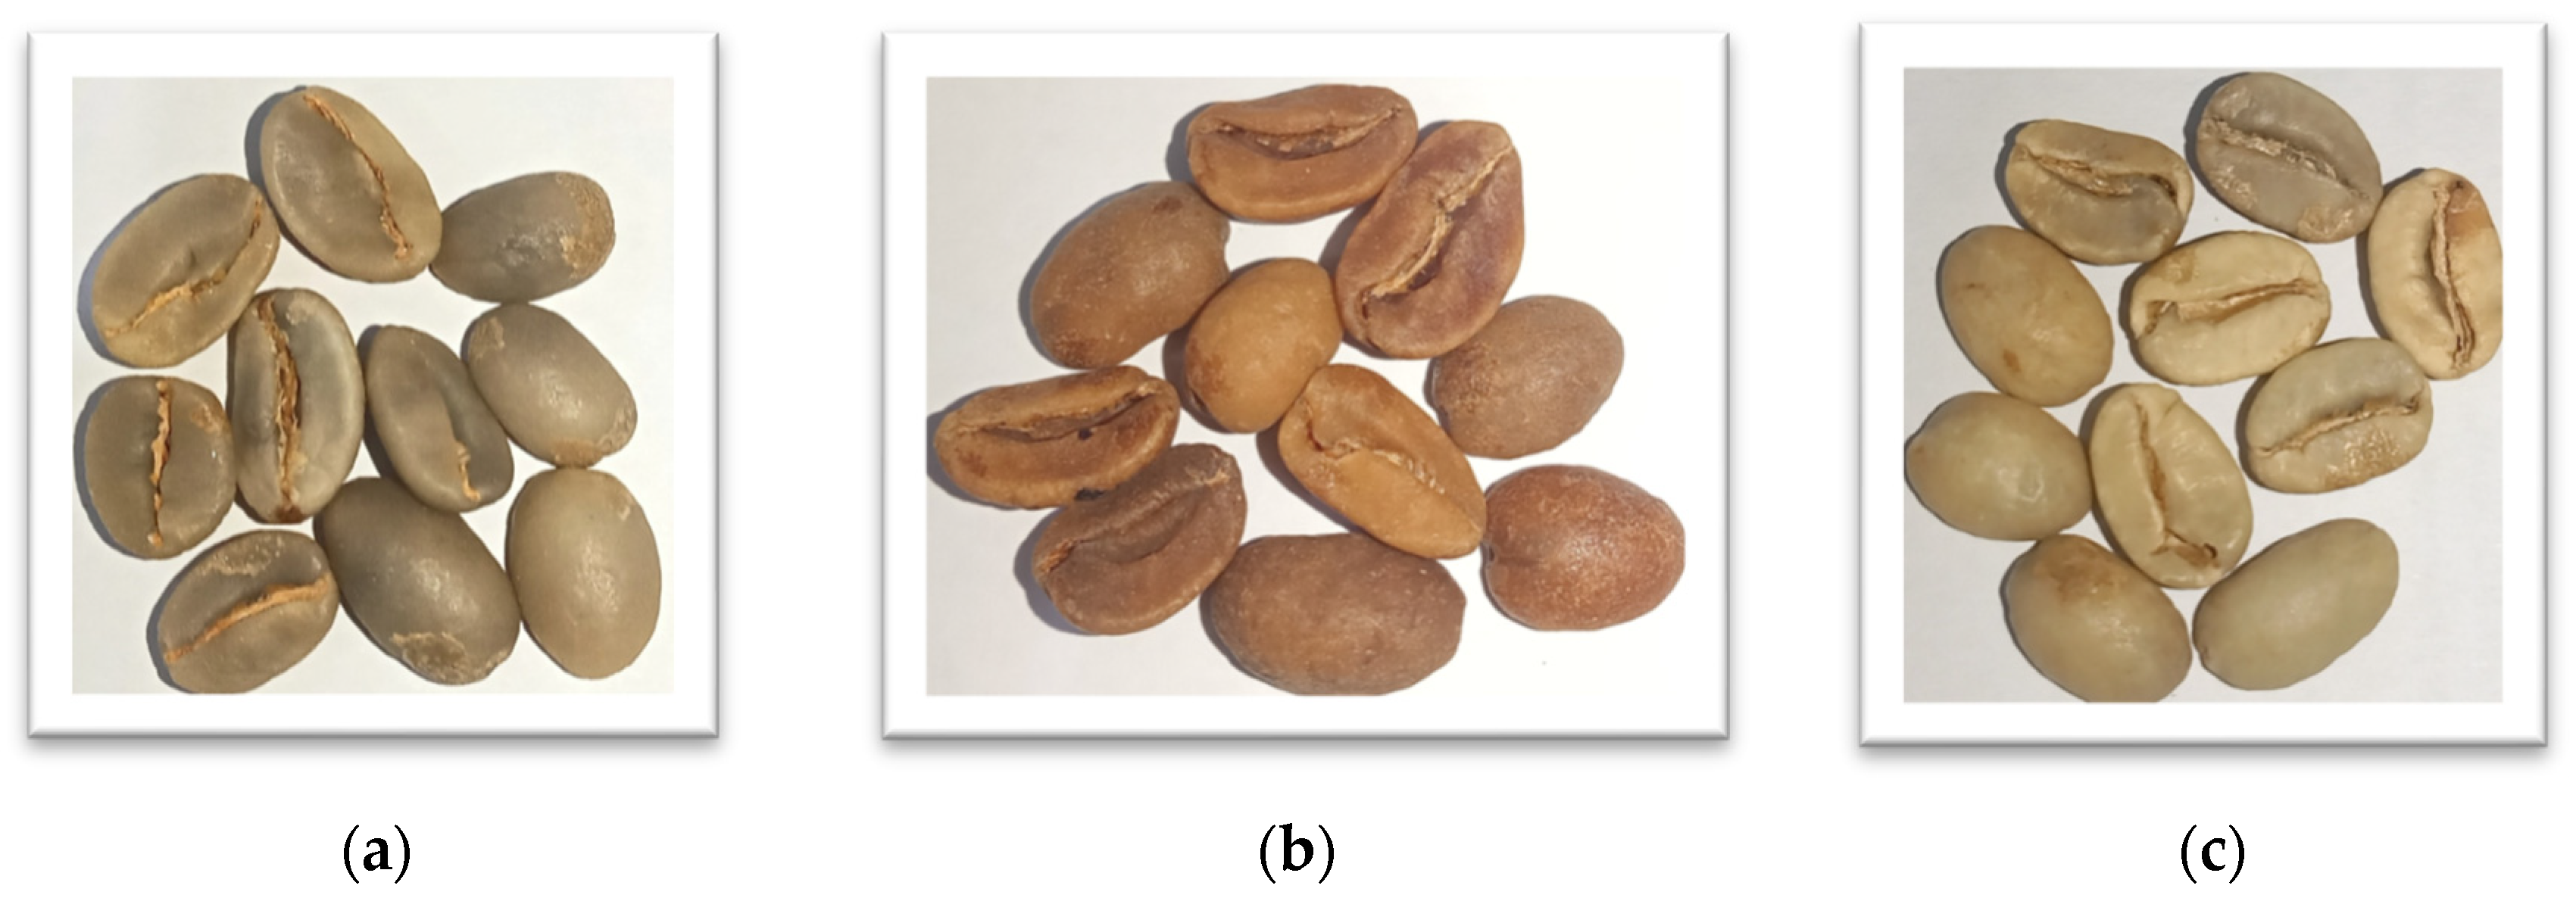
2.1. Green Coffee Bean Samples

The Gayo green coffee bean samples were collected directly from Takengon, Central Aceh (4°35′39.0″ N 96°48′48.8″ E) (See Figure 1). The samples are Gayo arabica green coffee beans with three different cherry processing methods: honey process (HP), wine process (WP), and natural process (NP). The HP and WP are both fermented coffee and are recognized as a modification of the wet cherry processing method [31]. For HP, the selected red coffee cherries are first peeled to remove the skin and preserve the wet parchment and then dried. For WP, the selected red cherries are washed, put in a transparent polyethylene (PE) plastic container, and closed tightly for 12 days of fermentation. After 12 days, the coffee cherries are dried without direct exposure to sunlight [32]. The NP is the most implemented coffee cherry processing method [33]. Here, the selected red cherries are directly dried (unwashed), utilizing natural sun-drying or artificial drying. Dried cherries are then peeled to expose the non-fermented green coffee beans [33]. The different cherry processing methods resulted in green coffee beans with different physical properties, as seen in Figure 2. It is not an easy task to classify the HP, WP, and NP green coffee beans using their shape and color information. The moisture content of all samples (HP, WP, and NP) was kept at 12% according to the Indonesian National Standard for green coffee beans (SNI 01-2907-2008).
In this present study, one hundred (n = 100) samples of Gayo arabica green coffee bean samples were prepared for each cherry processing method (total n = 300 samples). For each sample, three non-defective green coffee beans were selected for spectral acquisition. The samples were stored at room temperature (28 °C) in a light-protected plastic container until the sample spectral data acquisition [34].

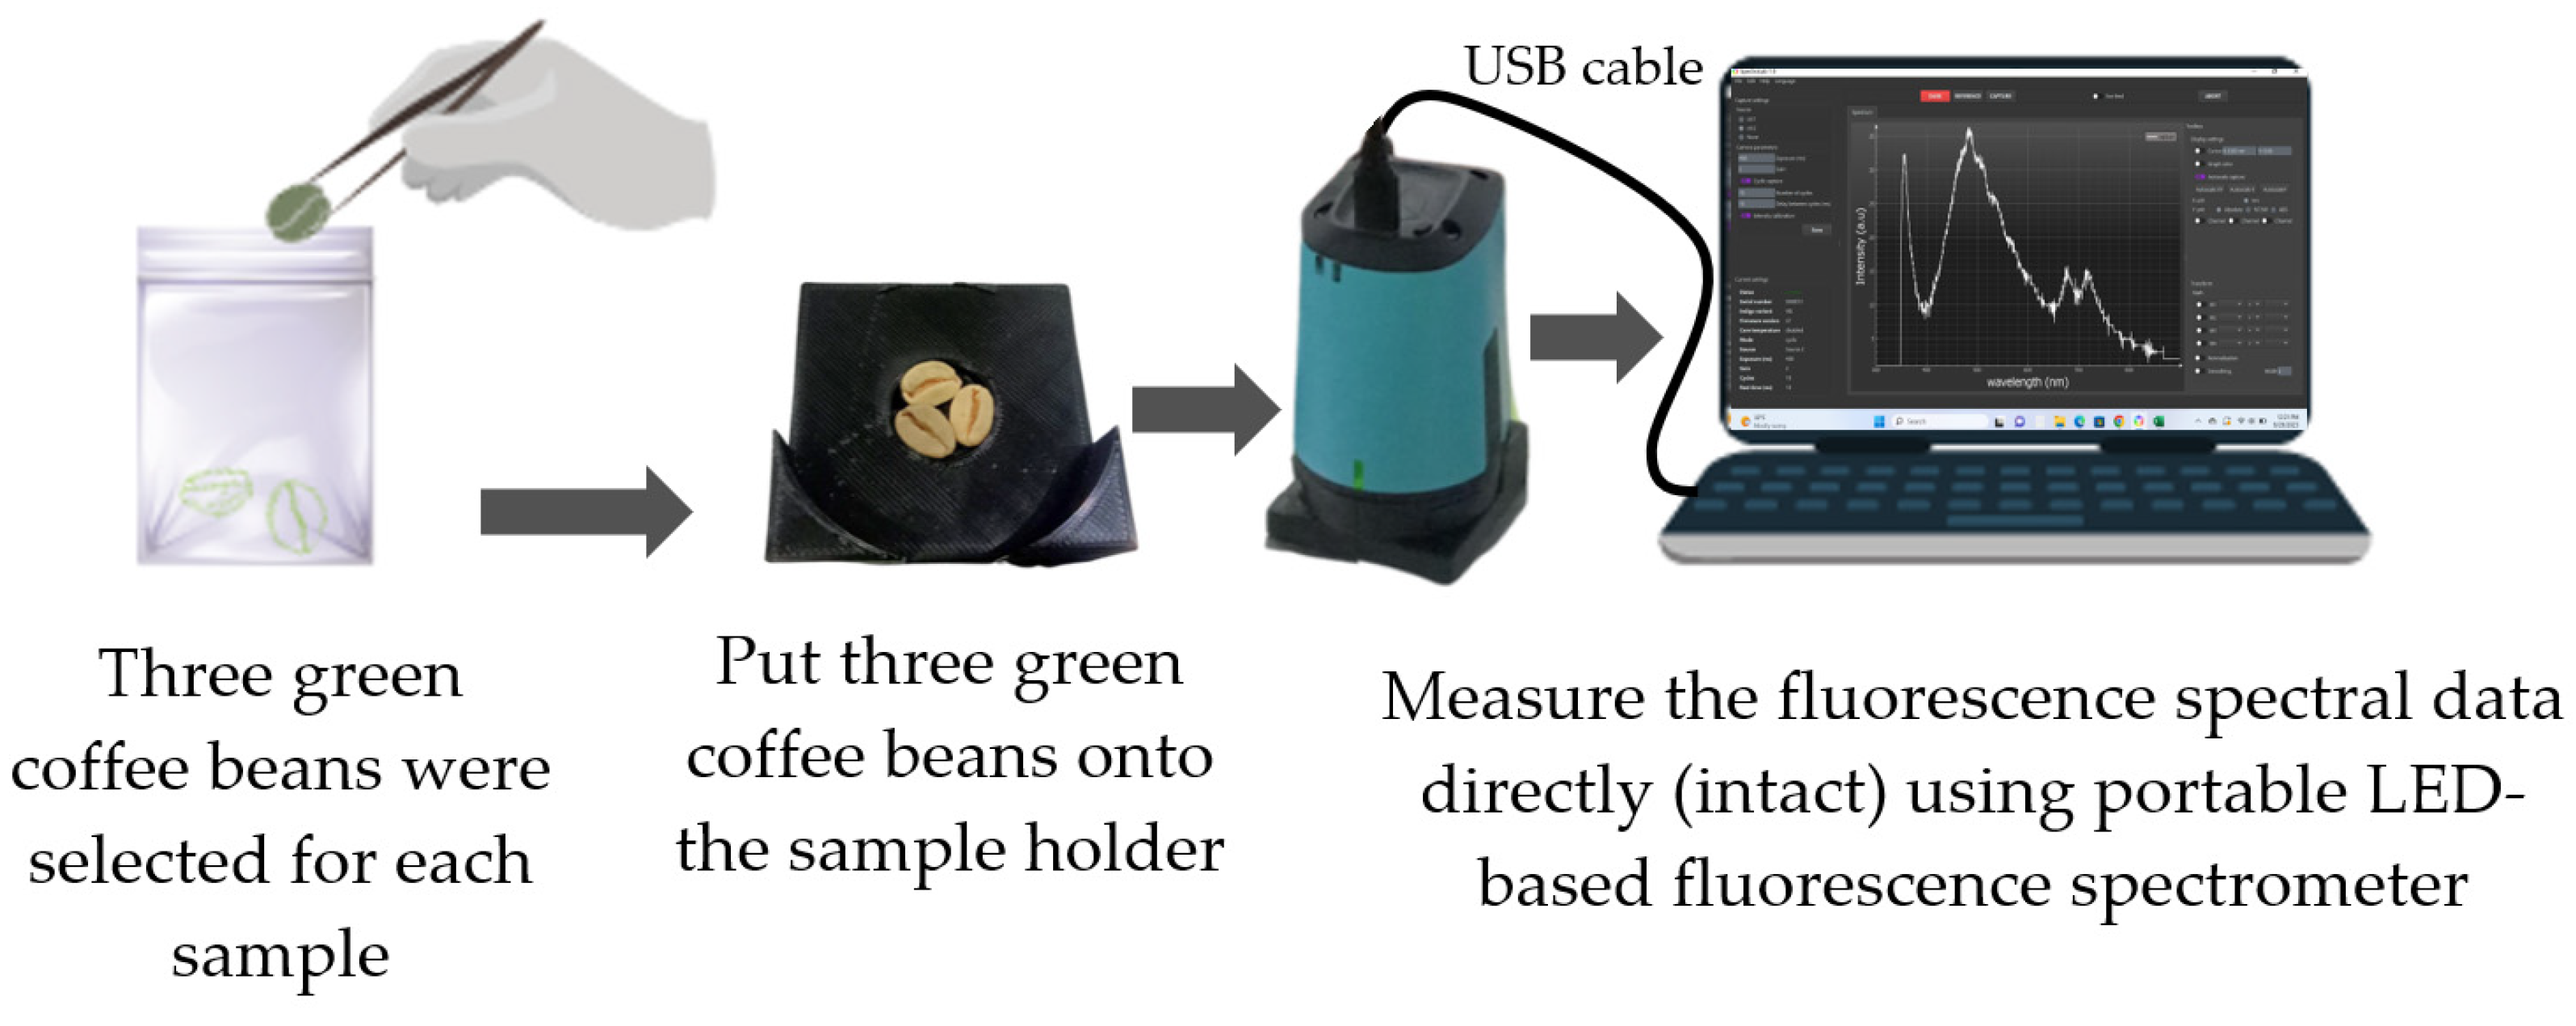
2.2. Spectral Acquisition

The intact spectral acquisition of Gayo arabica green coffee bean samples was conducted directly without any sample preparation using a low-cost, factory-calibrated, and portable fluorescence spectrometer from GoyaLab (Talence, France) equipped with 4 LED lamps (peak at wavelength 365 nm) as a light source, as seen in Figure 3. The use of a factory-calibrated portable spectrometer for food quality inspection purposes has been well reported [35,36]. The spectrometer was connected by a USB cable to the computer. The spectral acquisition was controlled by using SpectroLab software (version 1.0.24), and the parameter for fluorescence spectral data acquisition was determined as follows: exposure time 2000 ms and number of cycles 10. During spectral acquisition, the temperature and relative humidity of the experimental dark room were about 28 °C and 95%, respectively. For each sample, the fluorescence spectral data in the range of 348.5–866.5 nm with 0.5 nm interval were obtained for further chemometrics analysis.

2.3. Chemometrics Analysis

Unsupervised pattern recognition with 10 principal components (PCs) and a full cross-validation method were conducted based on principal component analysis (PCA). The result of PCA was generated for several plots such as score plot, x-loading plot, and influence plot. Three classification models based on PLS-DA, LDA, and PCA-LDA were used and compared. PLS-DA works based on a PLS regression algorithm. PLS-DA has been successfully applied, especially for evaluating green coffee beans, as currently reported in several published articles [12,18,21,22,37,38,39]. LDA and PCA-LDA have recently gained popularity as classic statistical methods for feature extraction and dimension reduction and are mostly employed among several supervised pattern recognition methods [40,41,42]. In LDA and PCA-LDA, the variance between the categories is to be maximized, and the variance within the categories is to be minimized [43]. To avoid model over-fitting in LDA and PCA-LDA models, it is required that the number of samples has to be at least twice as high as the number of variables, as mentioned by Harvey et al. [44]. In this study, all chemometrics were calculated by using the Unscrambler® X version (10.5.1, CAMO, Oslo, Norway).
The comparison of classification model performance was evaluated based on the accuracy value. The accuracy rate of all classification models was determined by using the following equation [5,45]:
Accuracy   Rate   ( % ) = Number   of   correct   classification   ( N CORR ) Number   of   total   samples   ( N TOT ) × 100 %

3. Results and Discussion

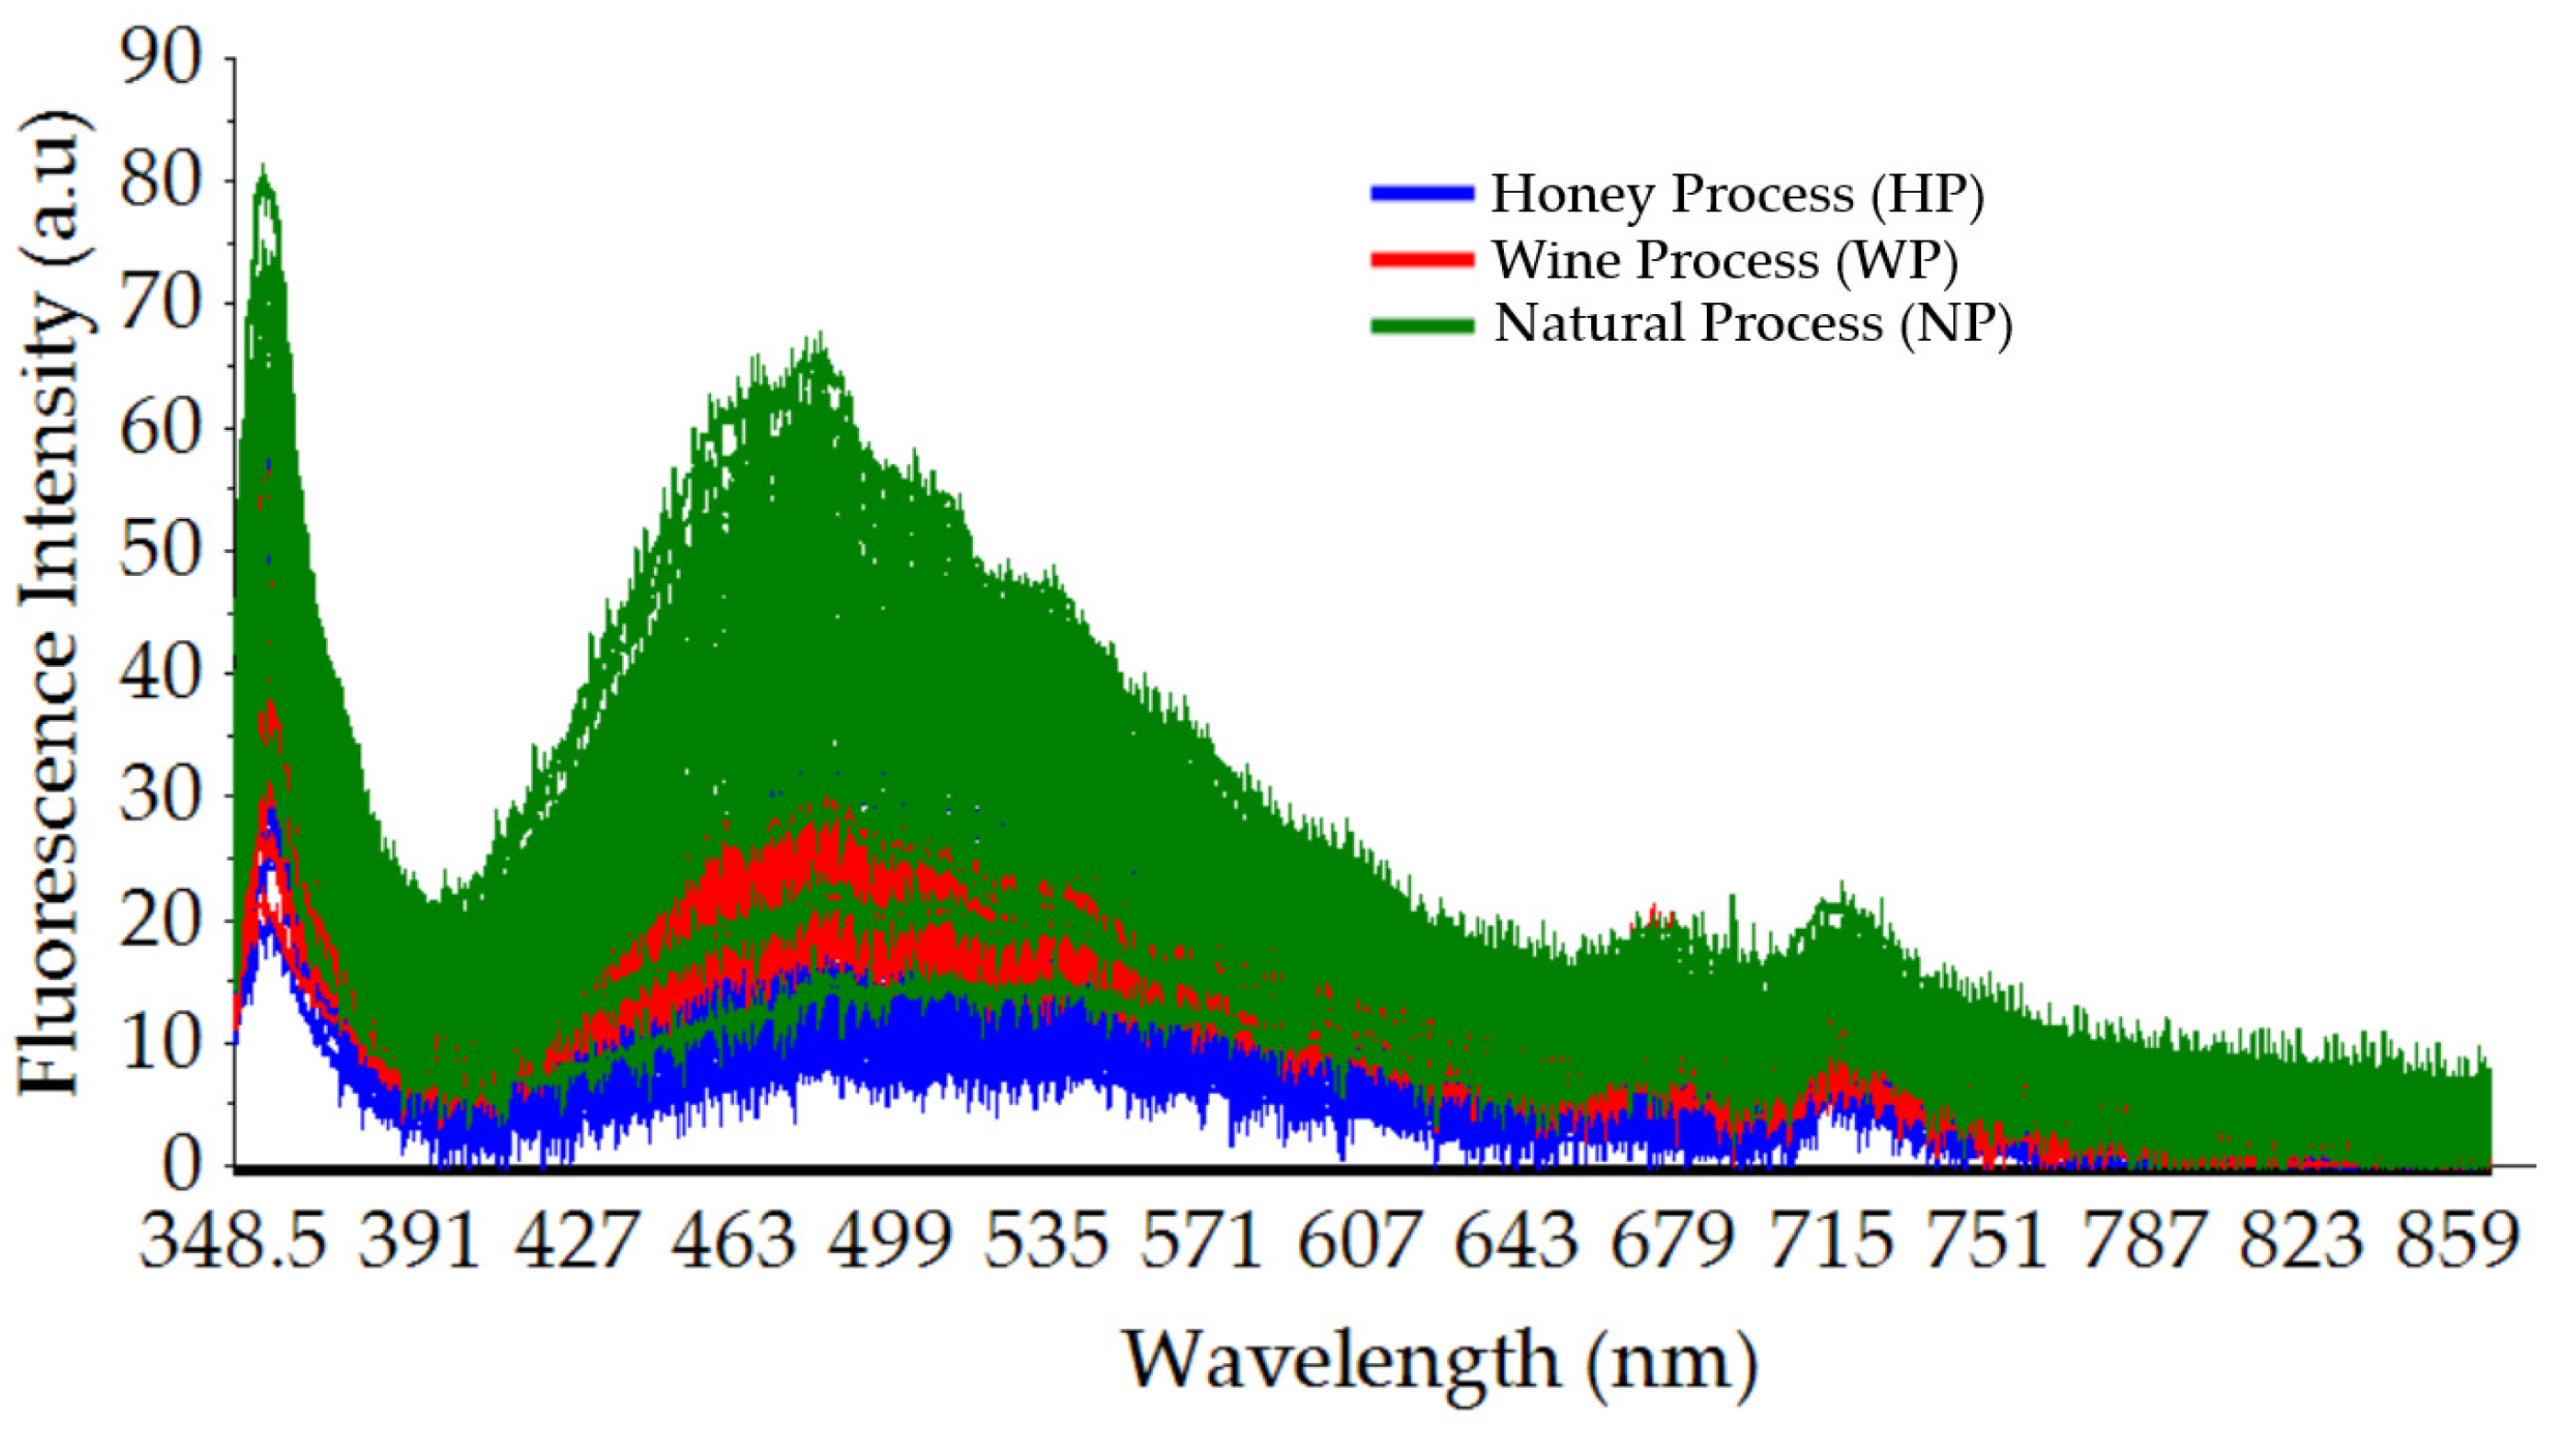
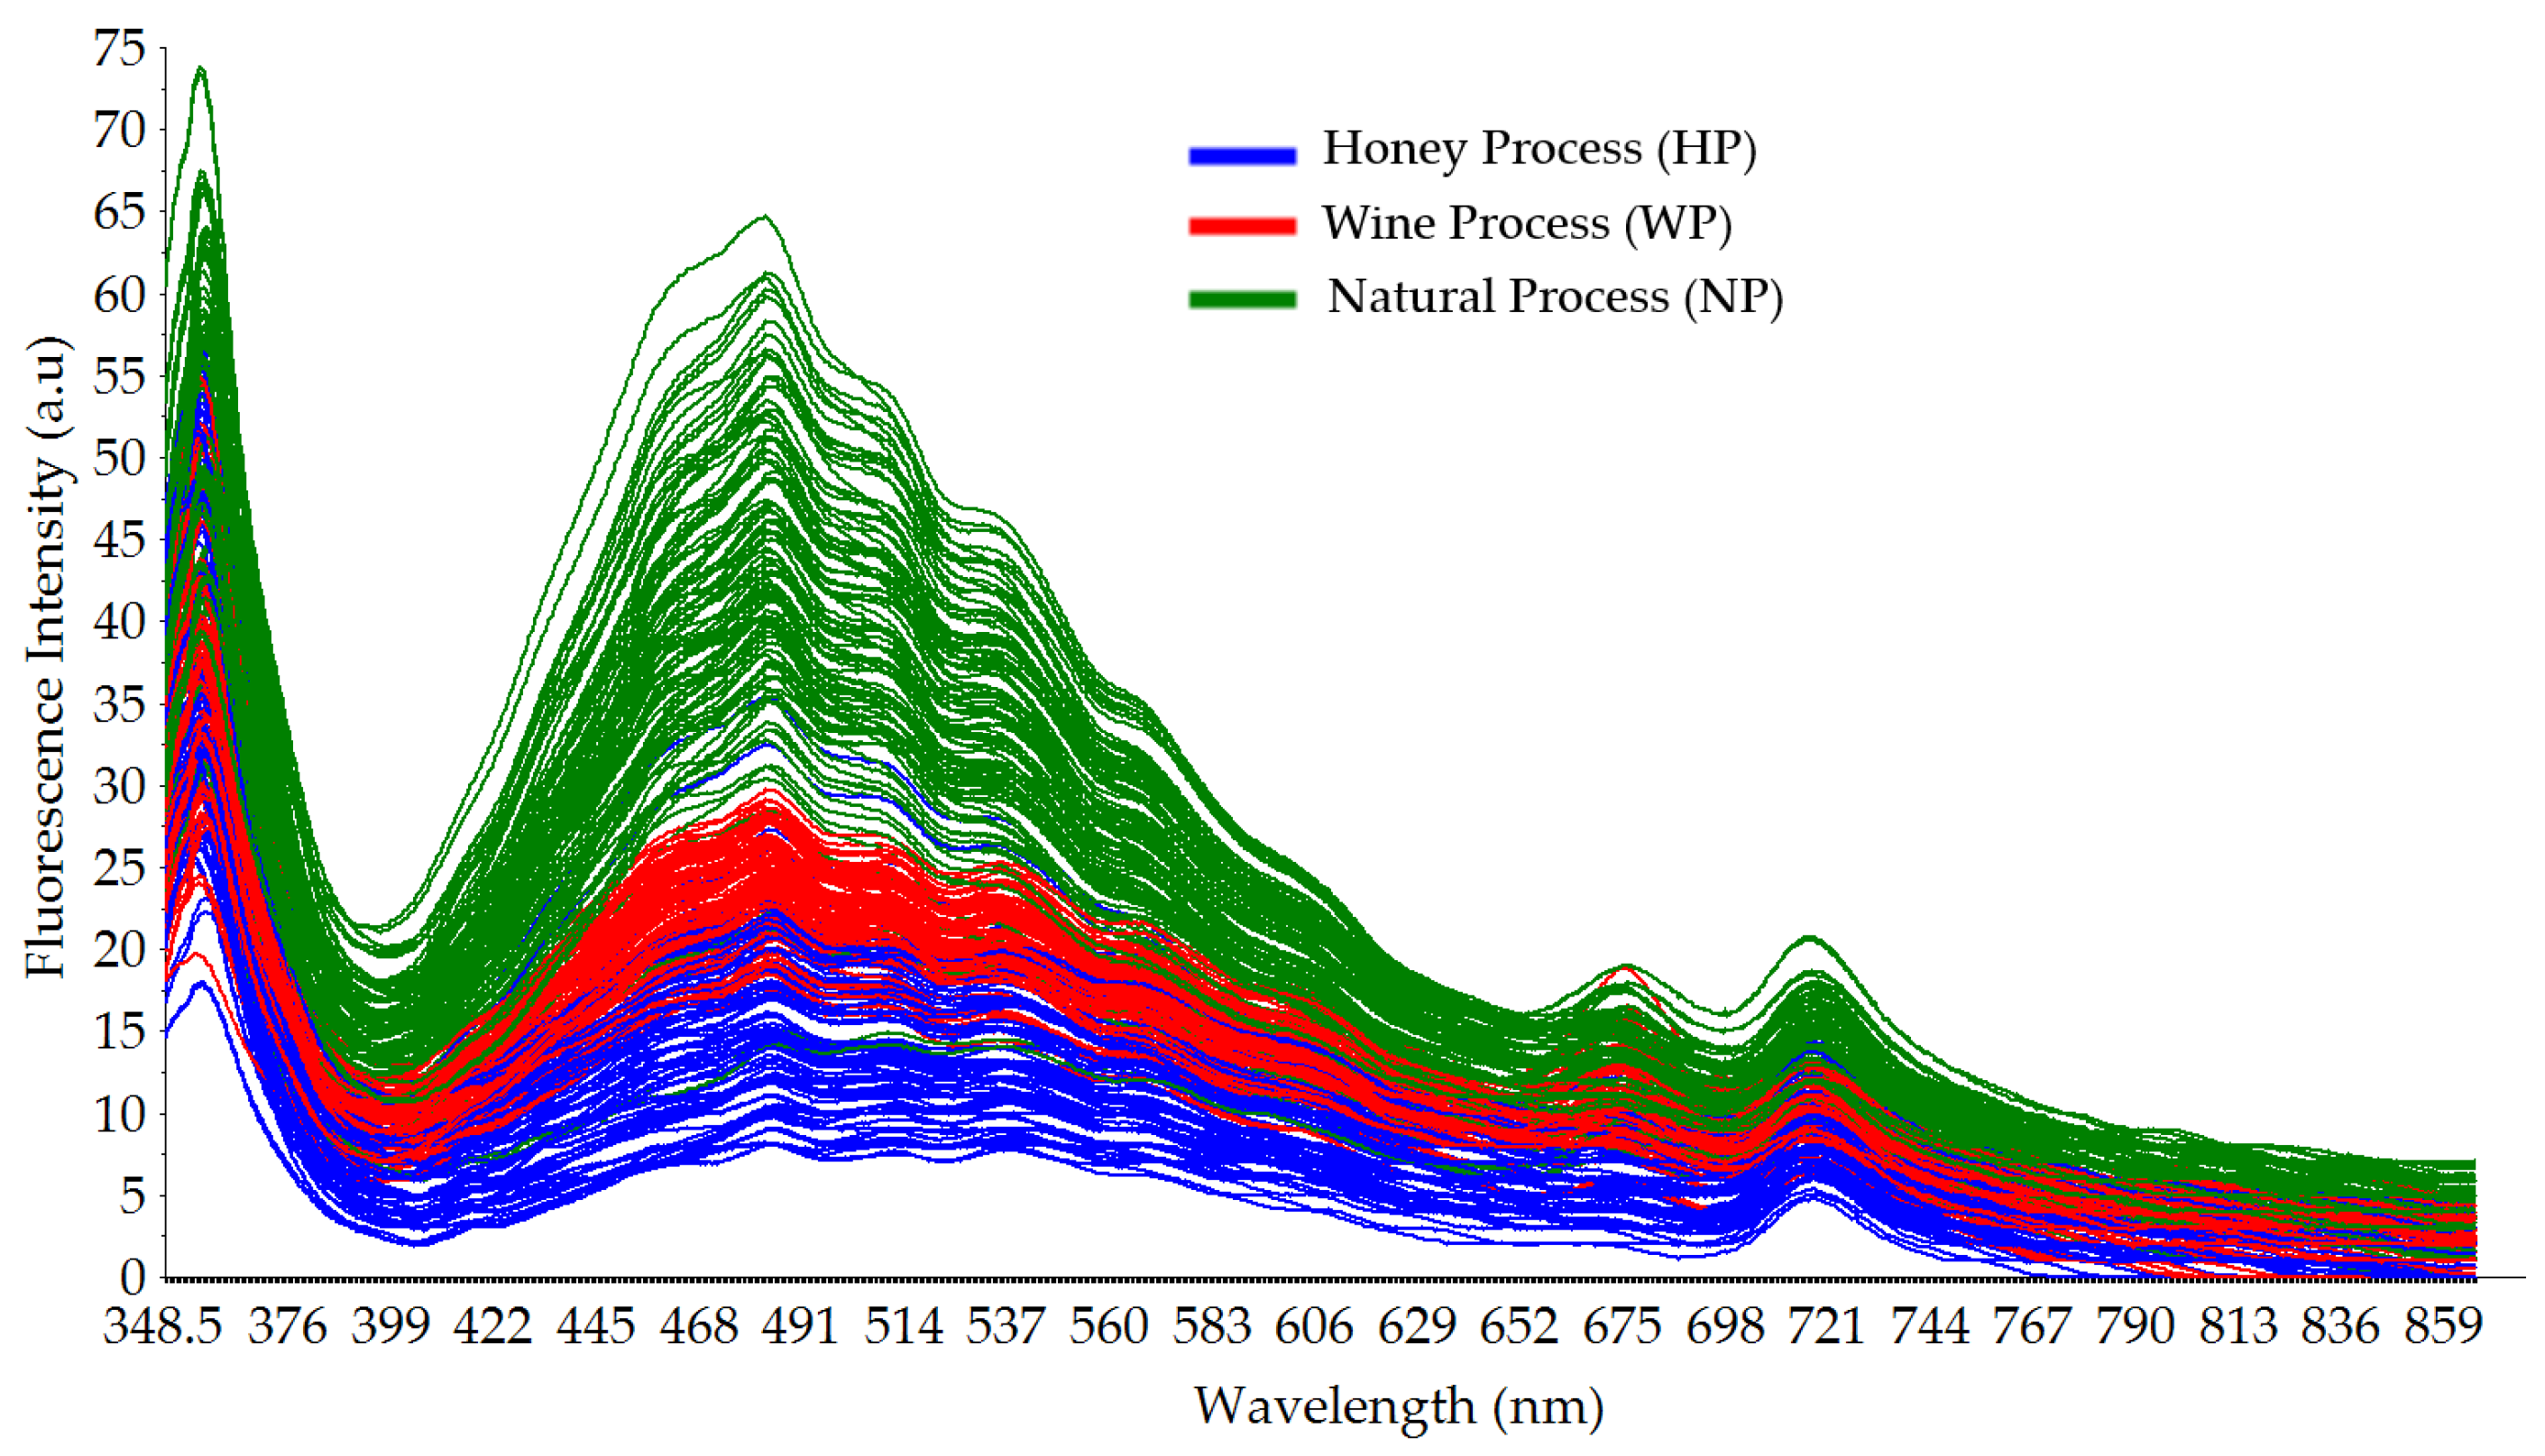
3.1. Typical Fluorescence Spectral Data
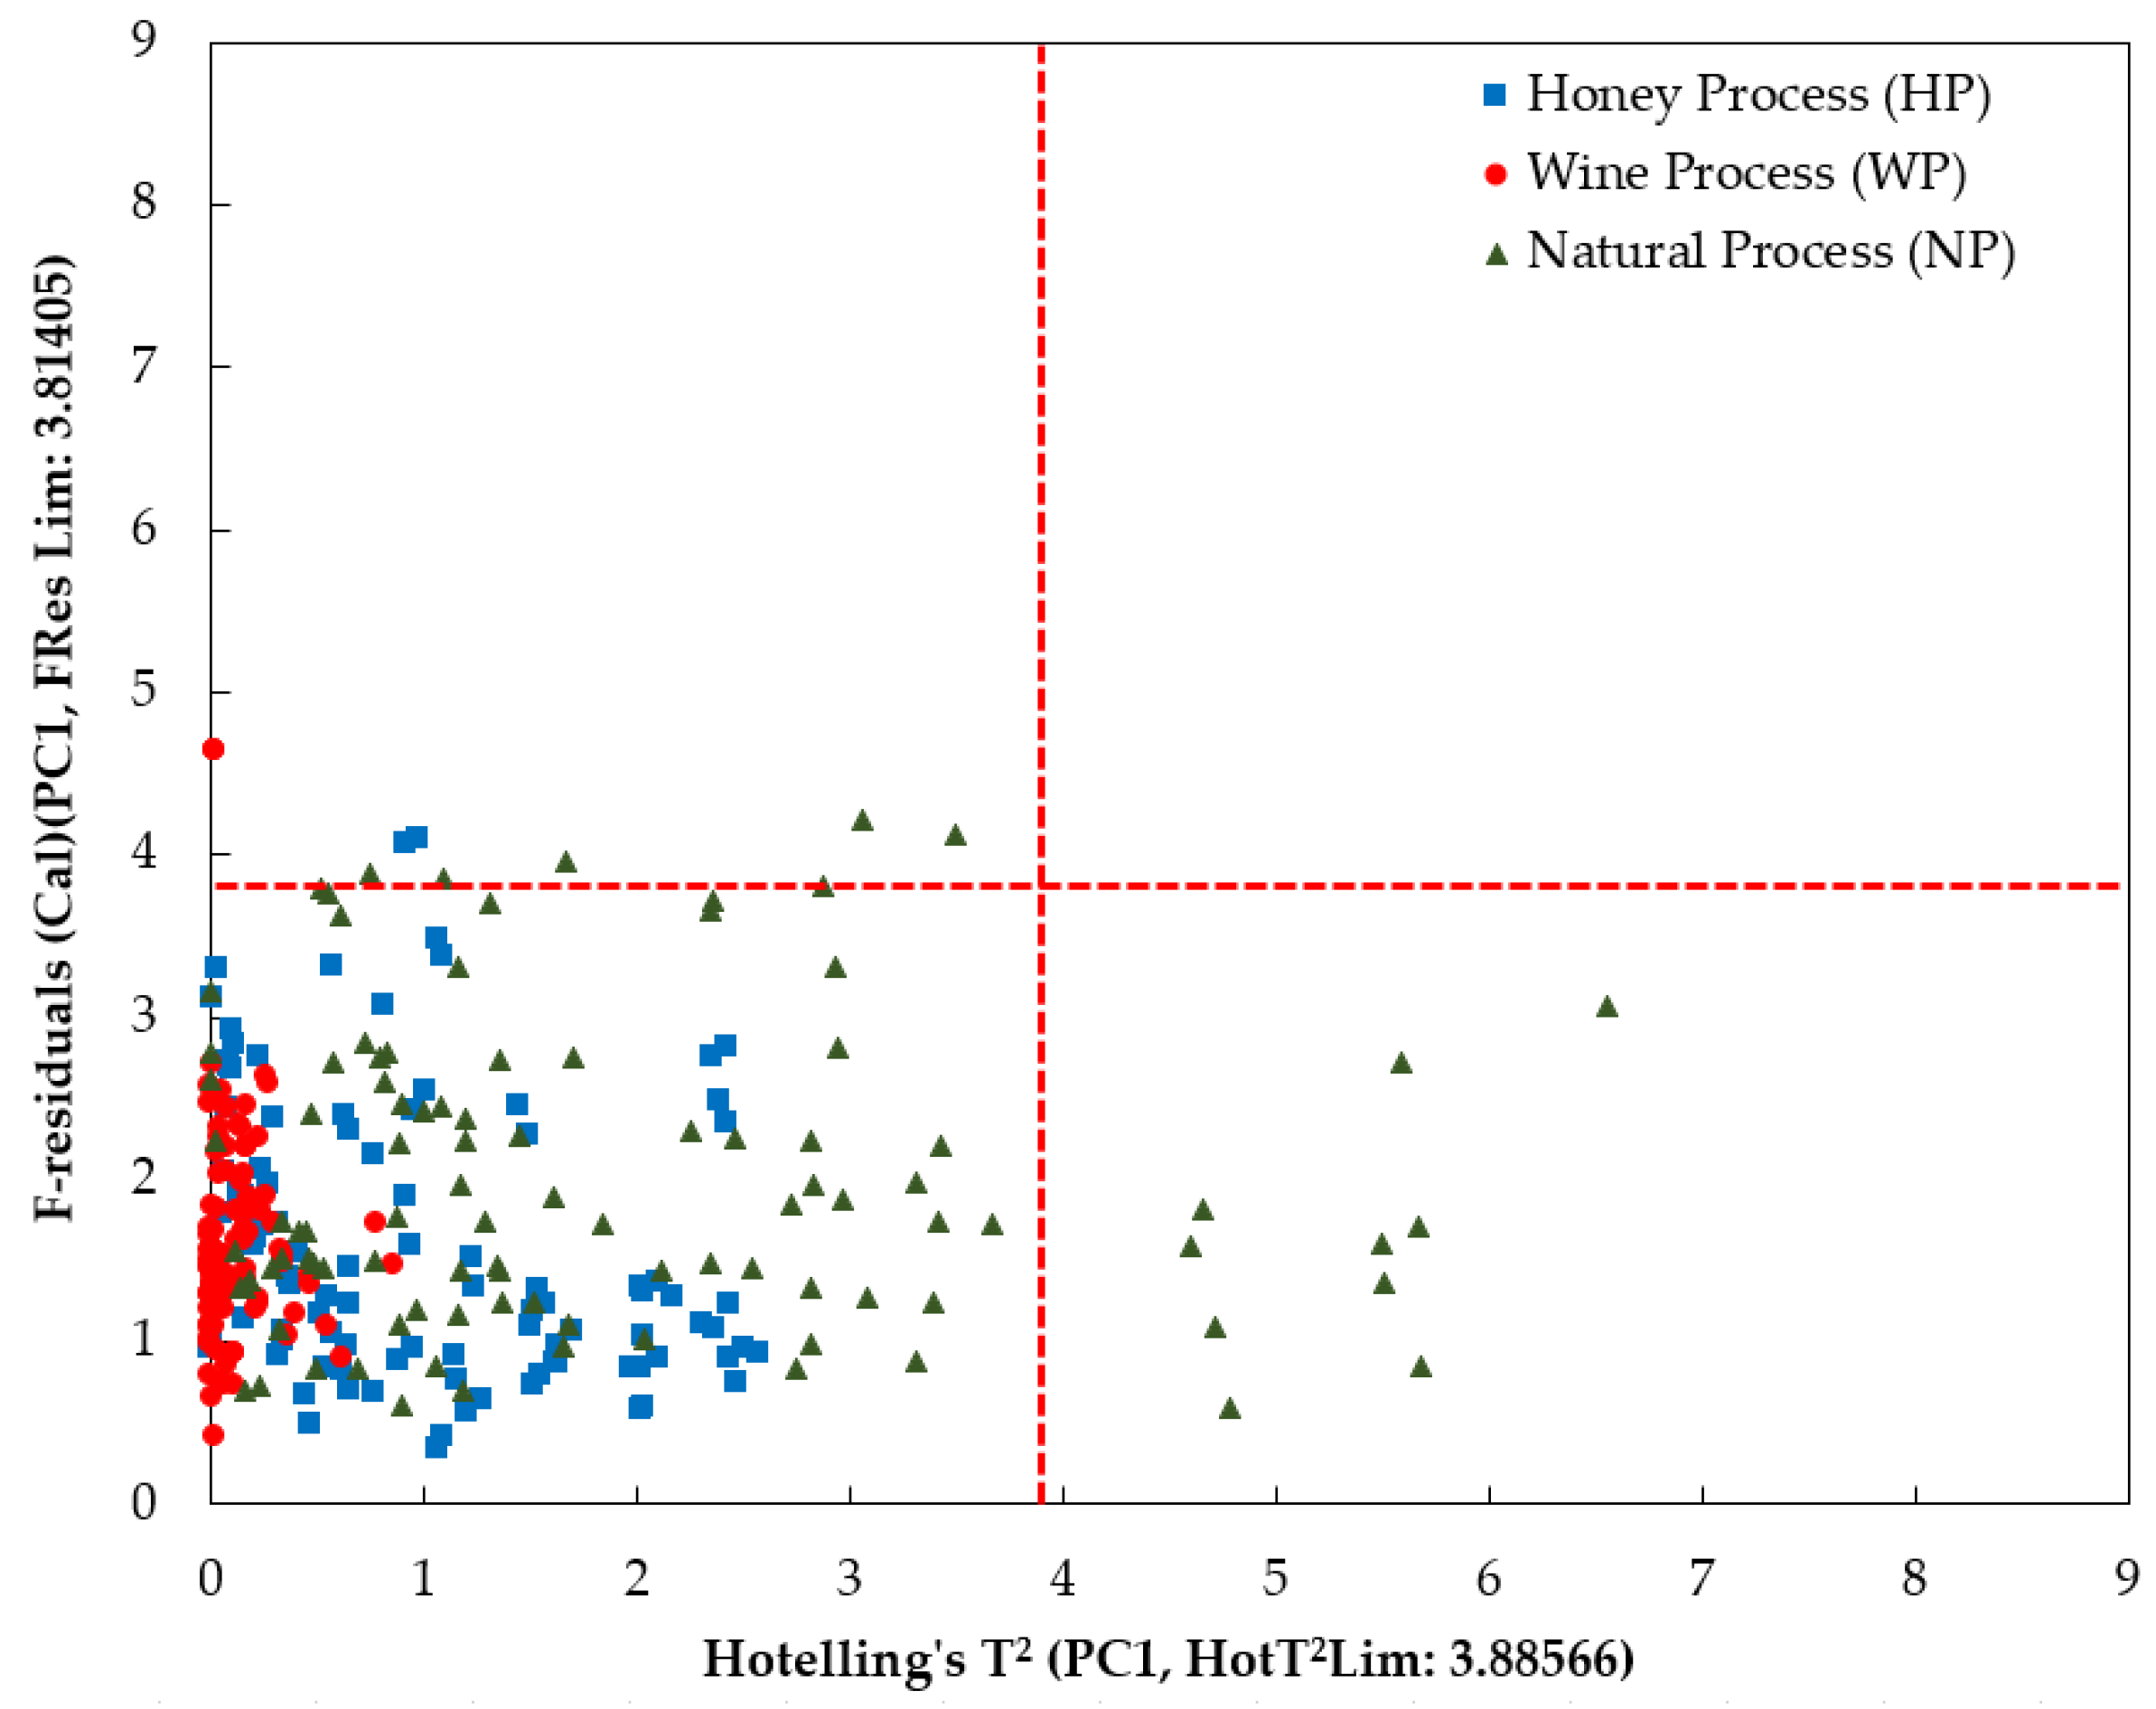
Figure 4 shows the typical broad fluorescence spectral data of Gayo arabica green coffee beans with three different cherry processing methods: the honey process (HP), wine process (WP), and natural process (NP). The obtained spectral data were highly noisy. After applying a moving average with 21-point smoothing, a better visualization of the fluorescence spectral data could be obtained, as seen in Figure 5. One major peak at around a wavelength of 460 nm was identified, and it was related to the presence of chlorogenic acids (CGAs), a polyphenolic compound in green coffee beans [46,47,48]. Suhandy and Yulia [48] measured the excitation–emission matrix (EEM) of several Indonesian ground-roasted coffees including peaberry and civet coffee. The highest fluorescence intensity was identified at 453 nm at a 370 nm excitation wavelength [48]. Several previous reports showed that green coffee beans are abundant with CGAs including caffeoylquinic acid (CQA), di-caffeoylquinic acid (diCQA), and feruloylquinic acid (FQA) [49,50,51]. The CGAs are important polyphenols in coffee and are widely used as indicators of the quality of coffee, since they directly affect the flavor and the nutritional value of the final coffee product [52]. The fermented green coffee bean samples (HP and WP) have a lower fluorescence intensity compared with those of the non-fermented green coffee beans (NP). This result is in line with several previous reports stating that the fermentation process is responsible for the decrease in the CGA content in green coffee beans [53,54]. A study on the influence of altitude, shade, and cherry processing method on CGAs in green coffee beans reported that unwashed coffee beans had significantly higher 3-caffeoylquinic (3-CQA) and caffeoyl feruloyl quinic acid (CFQA) contents than washed coffee beans [54].
A minor peak was observed at wavelengths around 670 and 720 nm both for fermented (HP and WP) and non-fermented (NP) green coffee bean samples. The peak at the wavelength of 670 nm is closely correlated to the presence of chlorophyll in green coffee beans, as is also reported in a previous work [30]. It is noted that the chlorophyll contents are not completely removed during the cherry processing method such as during the drying and fermentation process. Even after roasting, the fluorescence of the chlorophyll contents of ground-roasted coffee was also identified at a wavelength of 660 nm, as reported by Luo et al. [30]. A similar result was also observed in other green beans. For example, the chlorophyll fluorescence (CF) at wavelengths of 660 nm and 730 nm was also shown in soybean seeds, as demonstrated by Franca-Silva et al. [55].

3.2. PCA Analysis

PCA was calculated based on the smoothed fluorescence spectral data in the range of 348.5–866.5 nm. The result of PCA calculation using the first ten principal components (PC) is shown in Table 1, both for the calibration and validation steps. The scores of the first three principal components are depicted in Figure 6. The cumulative percentage variance (CPV) of PC1, PC2, and PC3 was 99% and met the required minimum CPV for reliable PCA [56]. The high CPV shows the quality of the analysis in transforming the original fluorescence spectral data into PCs. The result of the score plot showed that a possible separation of Gayo arabica green coffee beans according to different cherry processing methods could be established. The fermented (HP and WP) green coffee beans could be well separated from the non-fermented ones (NP). Along PC1 (with 91% explained variance), the non-fermented samples (NP) were mostly clustered in the right part with positive scores, while the fermented samples (HP and WP) were in the left part with negative scores. Along PC1, the proposed PCA is also enabled to discriminate two fermented green coffee beans between the HP and WP samples.
A plot with x-loadings in the y-axis and wavelengths in the x-axis is commonly used to analyze the most contributed variables during PCA calculation [57,58,59]. The high positive and negative x-loadings for the first three PCs are displayed in Figure 7, including the wavelengths at 390 nm, 470 nm, 480 nm, 680 nm, and 720 nm. This plot is important for investigating the most significant wavelengths that are responsible for the discrimination of fermented (HP and WP) and non-fermented (NP) green coffee bean samples. In PC1 and PC3, the fluorescence of CGAs could be identified at the wavelength of 470 nm and 480 nm in positive and negative directions. Since PC1 explained more than 90% of the spectral data variance compared with that of PC3, CGAs in Gayo arabica green coffee bean samples were mostly affected by PC1 only. In PC3, high x-loading was also identified at 680 nm, corresponding with the fluorescence of chlorophyll contents. Since the fermented coffee (NP) is mostly clustered at the right of PC1, it is suggested that the non-fermented coffee (NP) has higher CGAs compared with those of the fermented coffee samples (HP and WP). The chlorophyll content is similar for the fermented (HP and WP) and non-fermented (NP) coffee samples, since along PC3, all Gayo arabica green coffee bean samples clustered at positive scores. Thus, the CGAs are a good candidate marker to authenticate Gayo arabica green coffee beans with different cherry processing methods.
The calculation of PCA was also utilized to investigate any possible outlier present by analyzing the influence plot of Hotelling’s T2 statistics and F-residual values [60,61]. Any sample with high Hotelling’s T2 statistics and F-residual values outside the limit (the red dashed lines) would have been assigned as outliers and excluded from further analysis. The limit for Hotelling’s T2 statistics and F-residual is 3.88566 and 3.81405, respectively, as seen in Figure 8. Several NP samples have high Hotelling’s T2 statistics and exceed the limit. These samples are well described by the model. However, those samples may be influential to the model. There are no reported samples that exceeded the two limits in this study, as seen in Figure 8.

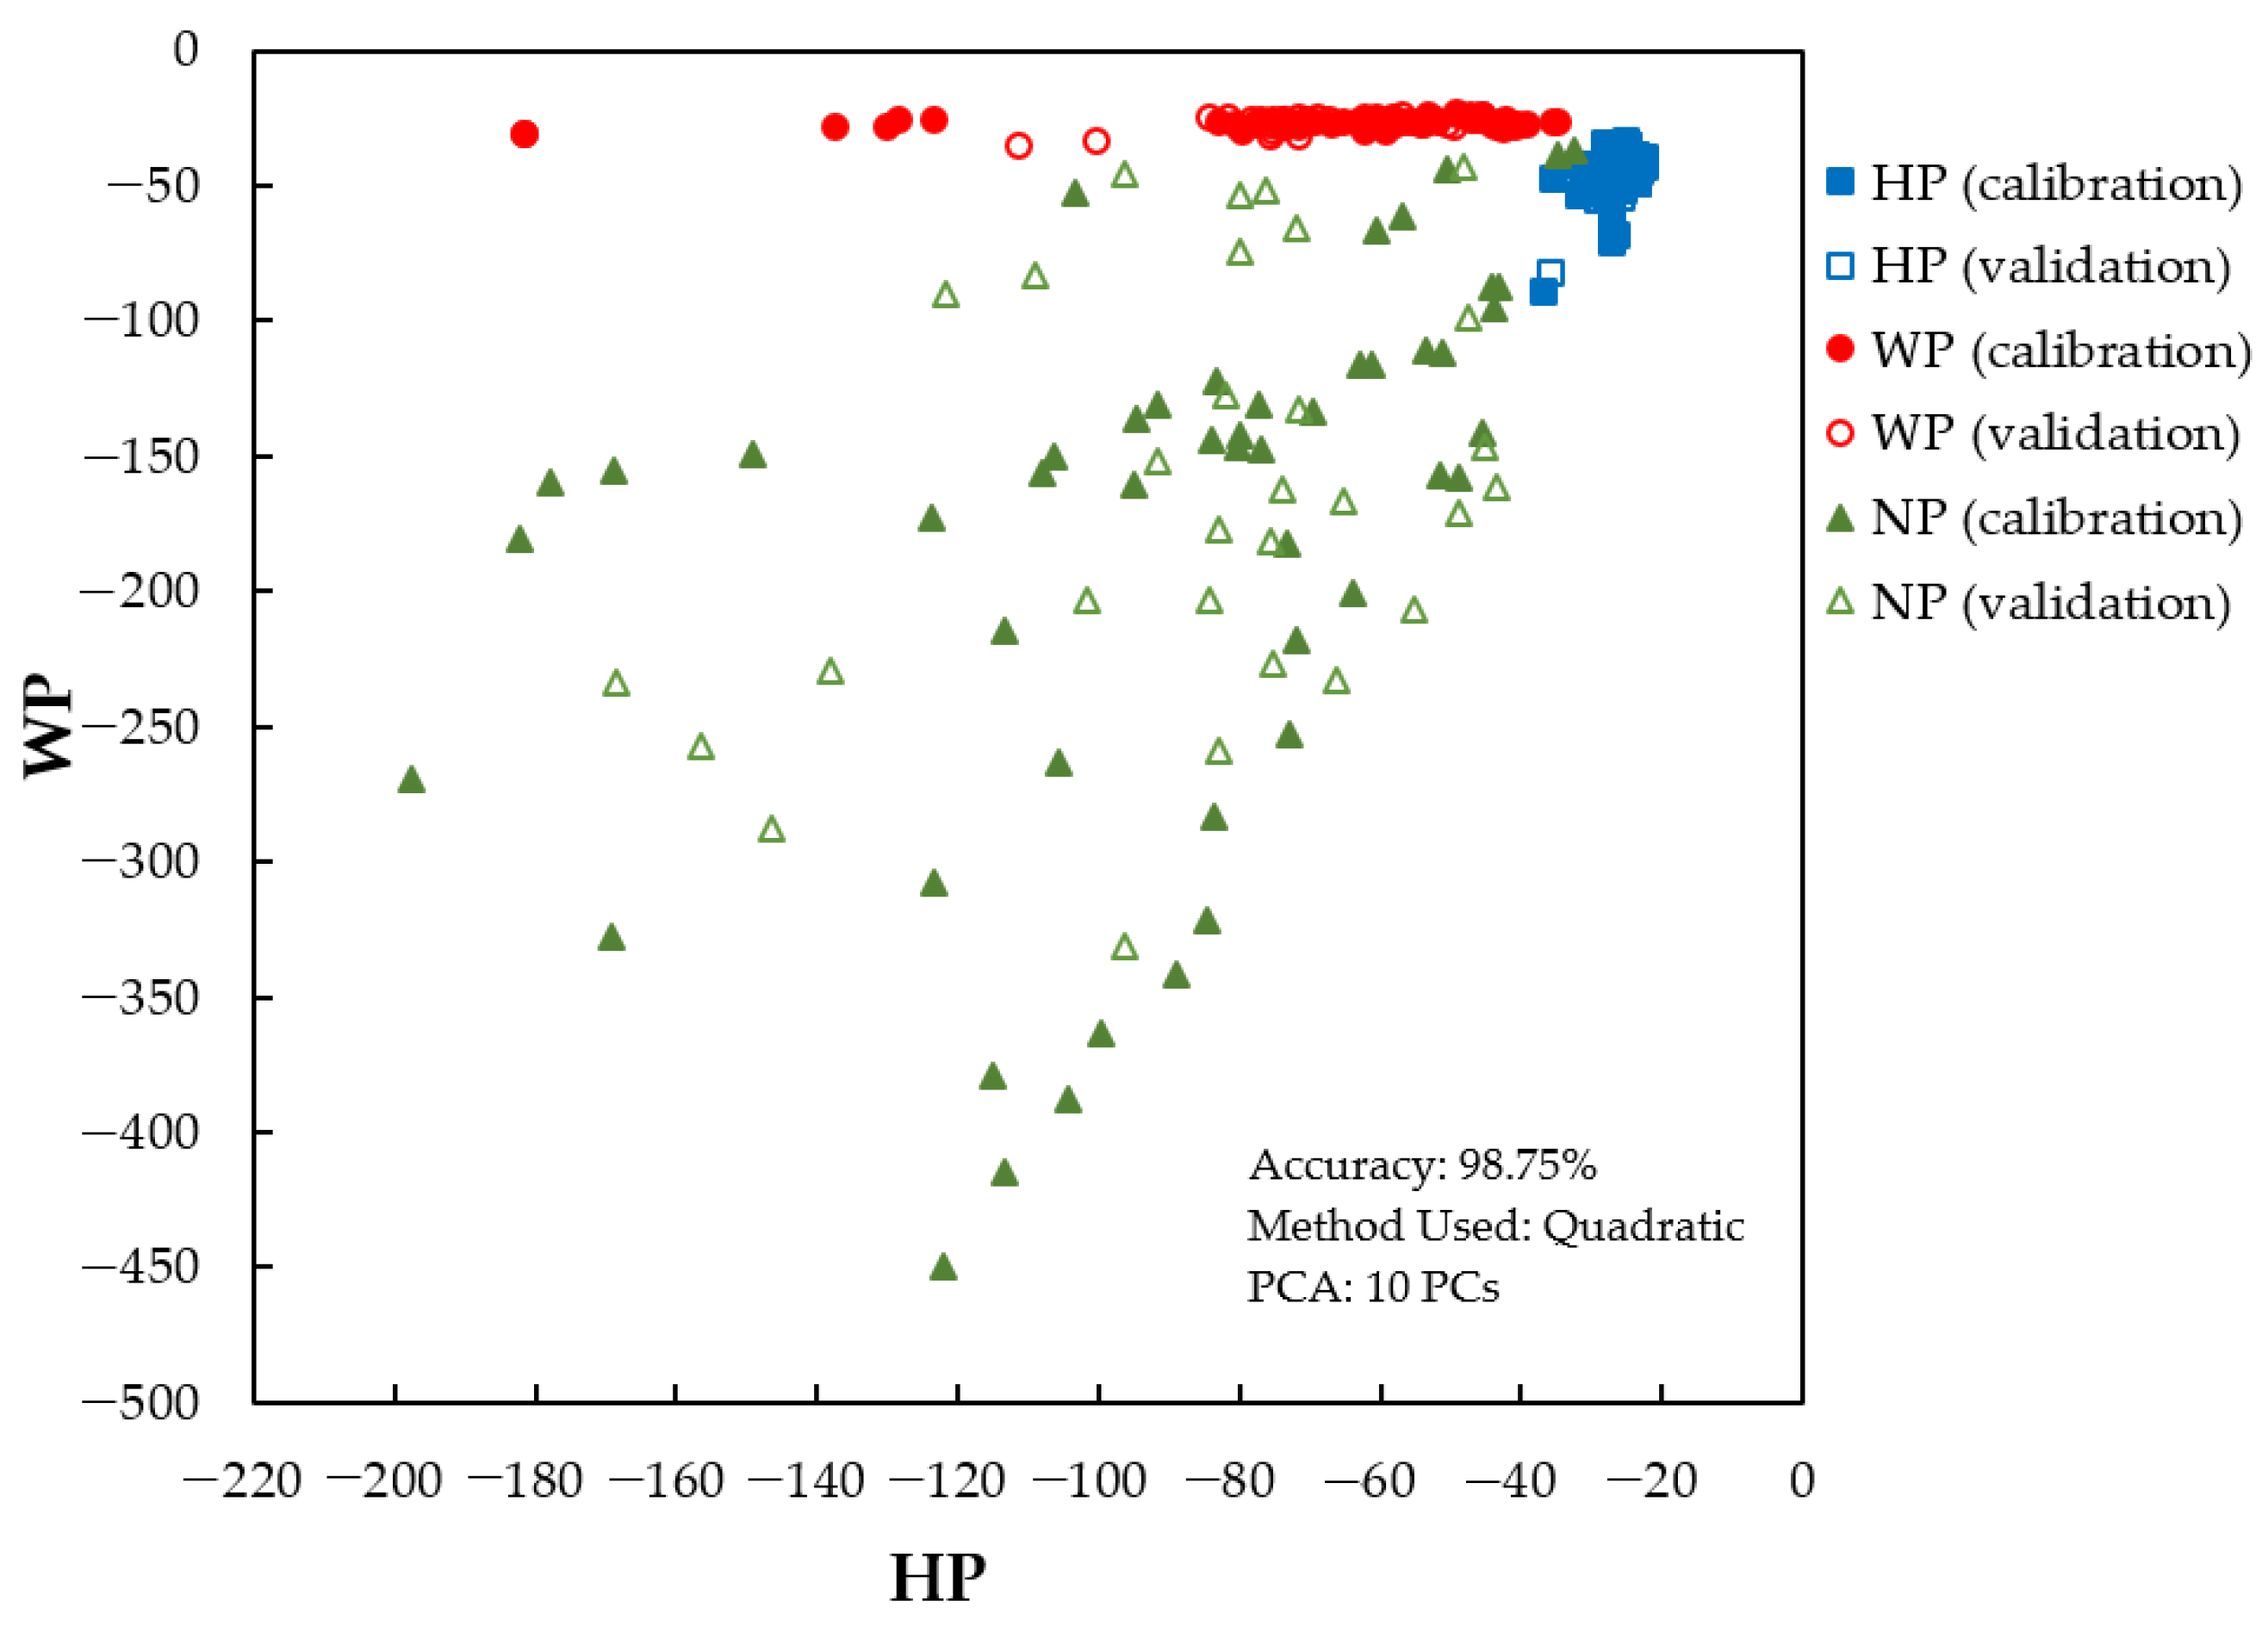
3.3. Classification Model Development Result Using PLS-DA, LDA, and PCA-LDA

To ensure robustness, all models were validated using an external validation sample set. For this purpose, for each class (HP, WP, and NP), the samples were randomly assigned into three sets, namely, the calibration sample set (n = 50), validation sample set (n = 30), and prediction sample set (n = 20). The first classification model was the PLS-DA model. This model was developed using all calibration sample sets (total n = 150) and validated using all validation sample sets (total n = 90). The number of latent variables (LVs) for the PLS-DA calibration model was determined by the Unscrambler. The suggested number of LVs is 4. The obtained accuracy for calibration and validation using the PLS-DA model is 83.33% (number of correct samples = 125 out of 150) and 88.89% (number of correct samples = 80 out of 90), respectively. For LDA, the wavelengths at 390 nm, 470 nm, 480 nm, 680 nm, and 720 nm (five variables) were used as predictors. The LDA model accuracy was 95.00%, 96.67%, and 93.33% for the linear, quadratic, and Mahalanobis methods, respectively. Improved accuracy was obtained by using PCA-LDA. The PCA-LDA model was developed using the first 10 PCs (CPV = 99.96% for both calibration and validation, respectively). The obtained accuracy was 96.25%, 98.75%, and 97.50% for the linear, quadratic, and Mahalanobis methods, respectively. The best classification model using PCA-LDA with a quadratic method is displayed in Figure 9.
The previously reported classification model for green coffee bean authentication (both in intact and powder samples) using other spectroscopy methods was comparable to our results. Raman spectral data in the range of m 200 cm−1 to 2000 cm−1 with a resolution of 6 cm−1 was obtained, and it was combined with several discriminant analyses (DA) to classify several coffee cultivars [11]. The lowest accuracy rate of 98.7% was obtained for the LDA model. Okubo and Kurata [12] reported the use of NIR spectroscopy to authenticate intact green coffee beans from seven different locations including Cuba, Ethiopia, Indonesia (Bali, Java, and Sumatra), Tanzania, and Yemen. The classification using the soft independent modeling of class analogy (SIMCA) method gave an accuracy rate of 73–100%. Similar NIR spectroscopy was applied to classify intact green coffee beans from two continents, Central–South America and Asia. The classification model was developed using interval PLS-DA (iPLS-DA). The best PLS-DA model was obtained with an accuracy rate of 98.6% both for calibration and cross-validation [17]. The LDA classification model was also used to discriminate between powder of green coffee beans of the Coffea arabica (arabica) and Coffea canephora (robusta) species from Java Island, Indonesia, based on ultraviolet–visible (UV-Vis) and NIR spectroscopy-based determination of caffeine and chlorogenic acid contents. Accuracies of 97% and 95% were obtained for UV-Vis spectroscopy and NIR spectroscopy, respectively [23]. A discriminant analysis (DA) with an accuracy rate of 95–100% was used to classify three arabica green coffee beans from Java Island, Indonesia (Java Preanger, Bondowoso, and Malang). Long wavelength NIR spectra were measured for intact green coffee bean samples in the range of 1000–2500 nm [62]. Bona et al. [63] reported the application of Fourier transform near-infrared (FT-NIR) spectroscopy combined with the support vector machine (SVM) classification method to differentiate several arabica green coffee beans from different regions in Brazil. The intact spectral acquisition was performed in the range of 1100–2498 nm at 2 nm intervals. The accuracy of SVM in calibration and validation was 99.59–100%. Currently, UV-Vis spectroscopy in the region of 230–450 nm was successfully applied to classify green coffee beans with different geographical origins in Brazil [22]. Three classification models were applied, including soft independent modeling of class analogy (SIMCA), data-driven SIMCA (DD-SIMCA), and one-class partial least squares (OCPLS). The accuracy was high, especially for the DD-SIMCA and OCPLS methods, where 93% accuracy could be reported.

3.4. The Result of Predictions

Table 2 shows the result of our prediction using the three developed classification models: PLS-DA, LDA, and PCA-LDA. The total prediction samples were 60 (n = 20 for HP, WP, and NP). In general, the classification result was acceptable for all classification models, with the lowest accuracy of 83.33% obtained for the PLS-DA model. Since PLS-DA is a full-spectrum-based technique, the analytical information overlaps, which interferes with the performance of the classification models in terms of accuracy [64]. The highest accuracy rate of 96.67% was obtained for the PCA-LDA model. The superiority of PCA-LDA was also reported in several previous qualitative studies [5,65]. Lasalvia et al. [66] briefly compared the performance of PCA-LDA and PLS-DA for the classification of simulated vibrational spectra. They showed that the PCA-LDA model seems a little better than the PLS-DA model for a slightly major accuracy and specificity in the classification of FTIR spectra. It is noted that the accuracy of LDA (95.00%) is quite similar to that of the PCA-LDA model (96.67%). The LDA model is developed using only five variables that are directly related to the CGAs and the chlorophyll contents in green coffee beans. This model is quite easy to understand compared with the PCA-LDA model.

4. Conclusions

Portable LED-based fluorescence spectroscopy combined with three classification methods based on PLS-DA, LDA, and PCA-LDA have been applied to assess the Gayo arabica green coffee beans with different cherry processing methods. Overall, our results show that it is possible to classify the samples into three different classes regardless of the type of classification model used. The wavelengths at 480 nm and 680 nm make important contributions to the classification of Gayo arabica green coffee beans with different cherry processing methods. Those wavelengths are directly related to the CGAs and chlorophyll content in green coffee beans. This fluorescence method is easy to use in many Indonesian coffee industries with the following features: non-destructive, affordable, and fast without any sample preparation (possible for intact spectral acquisition). Additionally, to validate our result, it is also important to include other sources of sample variability by using coffee samples from other geographical origins, botanical origins (robusta and liberica), and different farming systems (organic and non-organic).

Author Contributions

Conceptualization, D.S., M.Y. and H.N.; methodology, D.S., S.W. and H.N.; software, M.Y.; validation, M.Y., K.K. and A.A.; formal analysis, D.S., K.K. and H.N.; investigation, M.Y. and D.S.; resources, D.S.; data curation, D.S.; writing—original draft preparation, M.Y. and D.S.; writing—review and editing, M.Y., D.S., S.W. and K.K.; visualization, D.S.; supervision, M.Y. and D.S.; project administration, M.Y. and D.S.; funding acquisition, M.Y. All authors have read and agreed to the published version of the manuscript.

Funding

This research and the APC was funded by the Indonesian Directorate General of Vocational Education, Ministry of Education, Culture, Research, and Technology, through a National Research Collaboration 2023-2025 grant number 159/SPK/D.D4/PPK.01.APTV/VI/2023 and grant number 275/PL15.8/PP/2023.

Data Availability Statement

The datasets generated for this study are available upon reasonable request from the corresponding authors.

Acknowledgments

The authors gratefully acknowledge all members of the Spectroscopy Research Group (SRG) at the Department of Agricultural Engineering, Faculty of Agriculture, University of Lampung, for their assistance during the collection of the samples and spectral acquisition. The authors also gratefully acknowledge Garry J Piller of the Graduate School of Agriculture (GSA), Kyoto University, Japan, for final proofreading of the manuscript.

Conflicts of Interest

The authors declare no conflict of interest.

References

  1. Rahmah, D.M.; Putra, A.S.; Ishizaki, R.; Noguchi, R.; Ahamed, T. A Life Cycle Assessment of Organic and Chemical Fertilizers for Coffee Production to Evaluate Sustainability toward the Energy–Environment–Economic Nexus in Indonesia. Sustainability 2022, 14, 3912. [Google Scholar] [CrossRef]
  2. Fadhil, R.; Maarif, M.S.; Bantacut, T.; Hermawan, A. A prospective Strategy for Institutional Development of Gayo Coffee Agroindustry in Aceh Province, Indonesia. Bulg. J. Agric. Sci. 2018, 24, 959–966. [Google Scholar]
  3. Suhandy, D.; Yulia, M. The Classification of Arabica Gayo Wine Coffee using UV-Visible Spectroscopy and PCA-DA Method. In Proceedings of the 3rd Annual Applied Science and Engineering Conference (AASEC 2018), Bandung, Indonesia, 18 April 2018. [Google Scholar] [CrossRef]
  4. Taufiqurrahman; Fajri; Hakim, L. The Value-Added Analysis of Gayo Arabica Coffee Based on Processing. Int. J. Multicult. Multirelig. Underst. 2020, 7, 56–59. [Google Scholar]
  5. Suhandy, D.; Yulia, M. Classification of Lampung Robusta Specialty Coffee According to Differences in Cherry Processing Methods Using UV Spectroscopy and Chemometrics. Agriculture 2021, 11, 109. [Google Scholar] [CrossRef]
  6. García, M.; Candelo-Becerra, J.E.; Hoyos, F.E. Quality and Defect Inspection of Green Coffee Beans Using a Computer Vision System. Appl. Sci. 2019, 9, 4195. [Google Scholar] [CrossRef]
  7. Wang, X.; Lim, L.-T.; Fu, Y. Review of Analytical Methods to Detect Adulteration in Coffee. J. AOAC Int. 2020, 103, 295–305. [Google Scholar] [CrossRef] [PubMed]
  8. Núñez, N.; Collado, X.; Martínez, C.; Saurina, J.; Núñez, O. Authentication of the Origin, Variety and Roasting Degree of Coffee Samples by Non-Targeted HPLC-UV Fingerprinting and Chemometrics. Application to the Detection and Quantitation of Adulterated Coffee Samples. Foods 2020, 9, 378. [Google Scholar] [CrossRef]
  9. Weldegebreal, B.; Redi-Abshiro, M.; Chandravanshi, B.S. Development of New Analytical Methods for the Determination of Caffeine Content in Aqueous Solution of Green Coffee Beans. Chem. Cent. J. 2017, 11, 126. [Google Scholar] [CrossRef]
  10. El-Abassy, R.M.; Donfack, P.; Materny, A. Discrimination Between Arabica and Robusta Green Coffee Using Visible Micro Raman Spectroscopy and Chemometric Analysis. Food Chem. 2011, 126, 1443–1448. [Google Scholar] [CrossRef]
  11. Luna, A.S.; da Silva, A.P.; da Silva, C.S.; Lima, I.C.A.; de Gois, J.S. Chemometric Methods for Classification of Clonal Varieties of Green Coffee Using Raman Spectroscopy and Direct Sample Analysis. J. Food Compos. Anal. 2019, 76, 44–50. [Google Scholar] [CrossRef]
  12. Okubo, N.; Kurata, Y. Nondestructive Classification Analysis of Green Coffee Beans by Using Near-Infrared Spectroscopy. Foods 2019, 8, 82. [Google Scholar] [CrossRef] [PubMed]
  13. Mutz, Y.S.; do Rosario, D.; Galvan, D.; Schwan, R.F.; Bernardes, P.C.; Conte-Junior, C.A. Feasibility of NIR Spectroscopy Coupled with Chemometrics for Classification of Brazilian Specialty Coffee. Food Control 2023, 149, 109696. [Google Scholar] [CrossRef]
  14. Guerrero, A.M.D.; Cabrera, L.V.P.; Reyes, T.F.; Izaguirre, R.O. Laser-Induced Breakdown Spectroscopy (LIBS) Applied in the Differentiation of Arabica and Robusta Coffee. Opt. Photon. J. 2017, 7, 79965. [Google Scholar] [CrossRef]
  15. Wei, F.; Furihata, K.; Koda, M.; Hu, F.; Kato, R.; Miyakawa, T.; Tanokura, M. 13C NMR-Based Metabolomics for the Classification of Green Coffee Beans According to Variety and Origin. J. Agric. Food Chem. 2012, 60, 10118–10125. [Google Scholar] [CrossRef] [PubMed]
  16. Zhang, C.; Wang, C.; Liu, F.; He, Y. Mid-Infrared Spectroscopy for Coffee Variety Identification: Comparison of Pattern Recognition Methods. J. Spectrosc. 2016, 2016, 7927286. [Google Scholar] [CrossRef]
  17. Giraudo, A.; Grassi, S.; Savorani, F.; Gavoci, G.; Casiraghi, E.; Geobaldo, F. Determination of the Geographical Origin of Green Coffee Beans Using NIR Spectroscopy and Multivariate Data Analysis. Food Control 2019, 99, 137–145. [Google Scholar] [CrossRef]
  18. Minh, Q.N.; Lai, Q.D.; Minh, H.N.; Kieu, M.T.T.; Gia, N.L.; Le, U.; Hang, M.P.; Nguyen, H.D.; Chau, T.D.A.; Doan, N.T.T. Authenticity Green Coffee Bean Species and Geographical Origin Using Near-Infrared Spectroscopy Combined with Chemometrics. Int. J. Food Sci. Technol. 2022, 57, 4507–4517. [Google Scholar] [CrossRef]
  19. Dharmawan, A.; Masithoh, R.E.; Amanah, H.Z. Development of PCA-MLP Model Based on Visible and Shortwave Near Infrared Spectroscopy for Authenticating Arabica Coffee Origins. Foods 2023, 12, 2112. [Google Scholar] [CrossRef]
  20. Yang, S.; Li, C.; Mei, Y.; Liu, W.; Liu, R.; Chen, W.; Han, D.; Xu, K. Determination of the Geographical Origin of Coffee Beans Using Terahertz Spectroscopy Combined with Machine Learning Methods. Front. Nutr. 2021, 8, 2021. [Google Scholar] [CrossRef]
  21. Quan, N.M.; Phung, H.M.; Uyen, L.; Dat, L.Q.; Ngoc, L.G.; Hoang, N.M.; Tu, T.K.M.; Dung, N.H.; Ai, C.T.D.; Trinh, D.N.T. Species and Geographical Origin Authenticity of Green Coffee Beans Using UV–VIS Spectroscopy and PLS-DA Prediction Model. Food Chem. Adv. 2023, 2, 100281. [Google Scholar] [CrossRef]
  22. dos Santos, L.B.; Tarabal, J.; Sena, M.M.; Almeida, M.R. UV-Vis Spectroscopy and One-Class Modeling for the Authentication of the Geographical Origin of Green Coffee Beans from Cerrado Mineiro, Brazil. J. Food Compos. Anal. 2023, 123, 105555. [Google Scholar] [CrossRef]
  23. Adnan, A.; Naumann, M.; Mörlein, D.; Pawelzik, E. Reliable Discrimination of Green Coffee Beans Species: A Comparison of UV-Vis-Based Determination of Caffeine and Chlorogenic Acid with Non-Targeted Near-Infrared Spectroscopy. Foods 2020, 9, 788. [Google Scholar] [CrossRef] [PubMed]
  24. Xie, J.-Y.; Tan, J. Front-Face Synchronous Fluorescence Spectroscopy: A Rapid and Non-Destructive Authentication Method for Arabica Coffee Adulterated with Maize and Soybean Flours. J. Consum. Prot. Food Saf. 2022, 17, 209–219. [Google Scholar] [CrossRef]
  25. Naito, H.; Suhandy, D.; Morio, Y.; Murakami, K. Discrimination Between Normal Coffee Beans and Peaberries Using Excitation-Emission Matrix Measured by a Hand-Held Optical System. In Proceedings of the 3rd International Conference on Agricultural Postharvest Handling and Processing (ICAPHP 2021), Bogor, Indonesia, 12–14 October 2021. [Google Scholar] [CrossRef]
  26. Graf, A.; Claßen, J.; Solle, D.; Hitzmann, B.; Rebner, K.; Hoehse, M. A Novel LED-Based 2D-Fluorescence Spectroscopy System for In-Line Monitoring of Chinese Hamster Ovary Cell Cultivations—Part I. Eng. Life Sci. 2019, 19, 352–362. [Google Scholar] [CrossRef] [PubMed]
  27. Shin, Y.-H.; Gutierrez-Wing, M.T.; Choi, J.-W. Review—Recent Progress in Portable Fluorescence Sensors. J. Electrochem. Soc. 2021, 168, 017502. [Google Scholar] [CrossRef]
  28. Hart, S.J.; Jiji, R.D. Light Emitting Diode Excitation Emission Matrix Fluorescence Spectroscopy. Analyst 2002, 127, 1693–1699. [Google Scholar] [CrossRef] [PubMed]
  29. Suhandy, D.; Al Riza, D.F.; Yulia, M.; Kusumiyati, K. Non-Targeted Detection and Quantification of Food Adulteration of High-Quality Stingless Bee Honey (SBH) via a Portable LED-Based Fluorescence Spectroscopy. Foods 2023, 12, 3067. [Google Scholar] [CrossRef]
  30. Luo, S.; Yan, C.; Chen, D. Preliminary Study on Coffee Type Identification and Coffee Mixture Analysis by Light Emitting Diode Induced Fluorescence Spectroscopy. Food Control 2022, 138, 109044. [Google Scholar] [CrossRef]
  31. Febrianto, N.A.; Zhu, F. Coffee Bean Processing: Emerging Methods and Their Effects on Chemical, Biological and Sensory Properties. Food Chem. 2023, 412, 135489. [Google Scholar] [CrossRef]
  32. Sulaiman, I.; Hasni, D.; Alkausar, R. Effect of Moisture Contents and Roasting Degree on Quality of Wine Coffee from Arabica Gayo. Int. J. Adv. Sci. Eng. Inf. Technol. 2022, 12, 1586–1592. [Google Scholar] [CrossRef]
  33. Pereira, G.V.M.; Neto, D.P.C.; Júnior, A.I.M.; Vásquez, Z.S.; Medeiros, A.B.P.; Vandenberghe, L.P.S.; Soccol, C.R. Exploring the Impacts of Postharvest Processing on the Aroma Formation of Coffee Beans—A Review. Food Chem. 2019, 272, 441–452. [Google Scholar] [CrossRef]
  34. Robert, J.V.; de Gois, J.S.; Rocha, R.B.; Luna, A.S. Direct Solid Sample Analysis Using Synchronous Fluorescence Spectroscopy Coupled with Chemometric Tools for the Geographical Discrimination of Coffee Samples. Food Chem. 2022, 371, 131063. [Google Scholar] [CrossRef] [PubMed]
  35. Minas, I.S.; Blanco-Cipollone, F.; Sterle, D. Accurate Non-Destructive Prediction of Peach Fruit Internal Quality and Physiological Maturity with A Single Scan Using Near Infrared Spectroscopy. Food Chem. 2021, 335, 127626. [Google Scholar] [CrossRef] [PubMed]
  36. Moon, E.J.; Kim, Y.; Xu, Y.; Na, Y.; Giaccia, A.J.; Lee, J.H. Evaluation of Salmon, Tuna, and Beef Freshness Using a Portable Spectrometer. Sensors 2020, 20, 4299. [Google Scholar] [CrossRef] [PubMed]
  37. Muñiz-Valencia, R.; Jurado, J.M.; Ceballos-Magaña, S.G.; Alcázar, A.; Reyes, J. Geographical Differentiation of Green Coffees According to Their Metal Content by Means of Supervised Pattern Recognition Techniques. Food Anal. Methods 2013, 6, 1271–1277. [Google Scholar] [CrossRef]
  38. Mendes, G.A.; de Oliveira, M.A.L.; Rodarte, M.P.; dos Anjos, V.C.; Bell, M.J.V. Origin Geographical Classification of Green Coffee Beans (Coffea arabica L.) Produced in Different Regions of the Minas Gerais State by FT-MIR and Chemometric. Curr. Res. Food Sci. 2022, 5, 298–305. [Google Scholar] [CrossRef] [PubMed]
  39. Sim, J.; Dixit, Y.; Mcgoverin, C.; Oey, I.; Frew, R.; Reis, M.M.; Kebede, B. Machine Learning-Driven Hyperspectral Imaging for Non-Destructive Origin Verification of Green Coffee Beans Across Continents, Countries, and Regions. Food Control 2024, 156, 110159. [Google Scholar] [CrossRef]
  40. Jia, S.; Yang, L.; An, D.; Liu, Z.; Yan, Y.; Li, S.; Zhang, X.; Zhu, D.; Gu, J. Feasibility of Analyzing Frost-Damaged and Non-Viable Maize Kernels Based on Near Infrared Spectroscopy and Chemometrics. J. Cereal Sci. 2016, 69, 145–150. [Google Scholar] [CrossRef]
  41. Girolamo, A.D.; Cortese, M.; Cervellieri, S.; Lippolis, V.; Pascale, M.; Logrieco, A.F.; Suman, M. Tracing the Geographical Origin of Durum Wheat by FT-NIR Spectroscopy. Foods 2019, 8, 450. [Google Scholar] [CrossRef]
  42. Hassoun, A.; Måge, I.; Schmidt, W.F.; Temiz, H.T.; Li, L.; Kim, H.Y.; Nilsen, H.; Biancolillo, A.; Aït-Kaddour, A.; Sikorski, M.; et al. Fraud in Animal Origin Food Products: Advances in Emerging Spectroscopic Detection Methods over the Past Five Years. Foods 2020, 9, 1069. [Google Scholar] [CrossRef]
  43. Kennard, R.W.; Stone, L.A. Computer Aided Design of Experiments. Technometrics 1969, 11, 137–148. [Google Scholar] [CrossRef]
  44. Harvey, T.J.; Gazi, E.; Henderson, A.; Snook, R.D.; Clarke, N.W.; Brown, M.; Gardner, P. Factors Influencing the Discrimination and Classification of Prostate Cancer Cell Lines by FTIR Microspectroscopy. Analyst 2009, 134, 1083–1091. [Google Scholar] [CrossRef] [PubMed]
  45. Basri, K.N.; Hussain, M.N.; Bakar, J.; Sharif, Z.; Khir, M.F.A.; Zoolfakar, A.S. Classification and Quantification of Palm Oil Adulteration Via Portable NIR Spectroscopy. Spectrochim. Acta A Mol. Biomol. Spectrosc. 2017, 173, 335–342. [Google Scholar] [CrossRef] [PubMed]
  46. Belay, A.; Kim, H.K.; Hwang, Y.-H. Binding of Caffeine with Caffeic Acid and Chlorogenic Acid Using Fluorescence Quenching, UV/vis and FTIR Spectroscopic Techniques. Luminescence 2016, 31, 565–572. [Google Scholar] [CrossRef] [PubMed]
  47. Botelho, B.G.; Oliveira, L.S.; Franca, A.S. Fluorescence Spectroscopy as Tool for the Geographical Discrimination of Coffees Produced in Different Regions of Minas Gerais State in Brazil. Food Control 2017, 77, 25–31. [Google Scholar] [CrossRef]
  48. Suhandy, D.; Yulia, M. Discrimination of Several Indonesian Specialty Coffees Using Fluorescence Spectroscopy Combined with SIMCA Method. In Proceedings of the 3rd International Conference on Chemical Engineering Sciences and Applications (the 3rd ICChESA 2017), Banda Aceh, Indonesia, 20–21 September 2017. [Google Scholar] [CrossRef]
  49. Pimpley, V.; Patil, S.; Srinivasan, K.; Desai, N.; Murthy, P.S. The Chemistry of Chlorogenic Acid from Green Coffee and Its Role in Attenuation of Obesity and Diabetes. Prep. Biochem. Biotechnol. 2020, 50, 969–978. [Google Scholar] [CrossRef] [PubMed]
  50. Perrone, D.; Farah, A.; Donangelo, C.M.; de Paulis, T.; Martin, P.R. Comprehensive Analysis of Major and Minor Chlorogenic Acids and Lactones in Economically Relevant Brazilian Coffee Cultivars. Food Chem. 2008, 106, 859–867. [Google Scholar] [CrossRef]
  51. Shraddha, T.; Neha, M.; Neetu, M. Pharmacological Perspective of Green Coffee Beans and their Metabolites: A Review. Curr. Nutr. Food Sci. 2023, 19, 346–356. [Google Scholar] [CrossRef]
  52. Farah, A.; Monteiro, M.C.; Calado, V.; Franca, A.S.; Trugo, L.C. Correlation Between Cup Quality and Chemical Attributes of Brazilian Coffee. Food Chem. 2006, 98, 373–380. [Google Scholar] [CrossRef]
  53. Mills, C.E.; Oruna-Concha, M.J.; Mottram, D.S.; Gibson, G.R.; Spencer, J.P.E. The Effect of Processing on Chlorogenic Acid Content of Commercially Available Coffee. Food Chem. 2013, 141, 3335–3340. [Google Scholar] [CrossRef]
  54. Mintesnot, A.; Dechassa, N. Effect of Altitude, Shade, and Processing Methods on the Quality and Biochemical Composition of Green Coffee Beans in Ethiopia. East Afr. J. Sci. 2018, 12, 87–100. [Google Scholar]
  55. Franca-Silva, F.; Cicero, S.M.; Gomes-Junior, F.G.; Medeiros, A.D.; Franca-Neto, J.B.; Dias, D.C.F.S. Quantification of Chlorophyll Fluorescence in Soybean Seeds by Multispectral Images and Their Relationship with Physiological Potential. J. Seed Sci. 2022, 44, e202244023. [Google Scholar] [CrossRef]
  56. Li, W.; Huang, W.; Fan, D.; Gao, X.; Zhang, X.; Meng, Y.; Liu, T.C. Rapid Quantification of Goat Milk Adulteration with Cow Milk Using Raman Spectroscopy and Chemometrics. Anal. Methods 2023, 15, 455–461. [Google Scholar] [CrossRef] [PubMed]
  57. Suhandy, D.; Yulia, M. Peaberry Coffee Discrimination Using UV-Visible Spectroscopy Combined with SIMCA and PLS-DA. Int. J. Food Prop. 2017, 20 (Suppl. S1), S331–S339. [Google Scholar] [CrossRef]
  58. Lapcharoensuk, R.; Fhaykamta, C.; Anurak, W.; Chadwut, W.; Sitorus, A. Nondestructive Detection of Pesticide Residue (Chlorpyrifos) on Bok Choi (Brassica rapa subsp. Chinensis) Using a Portable NIR Spectrometer Coupled with a Machine Learning Approach. Foods 2023, 12, 955. [Google Scholar] [CrossRef] [PubMed]
  59. Yulia, M.; Ningtyas, K.R.; Kuncoro, S.; Aurum, F.S.; Suhandy, D. A Low-Cost and Eco-Friendly Approach for Rapid Discrimination Between Authentic and Feeding Luwak Arabica Coffees. In Proceedings of the 5th International Conference on Sustainable Agriculture (ICoSA 2022), Yogyakarta, Indonesia, 20–21 July 2022. [Google Scholar] [CrossRef]
  60. Fodor, M.; Jókai, Z.; Matkovits, A.; Benes, E. Assessment of Maturity of Plum Samples Using Fourier Transform Near-Infrared Technique Combined with Chemometric Methods. Foods 2023, 12, 3059. [Google Scholar] [CrossRef] [PubMed]
  61. Oliveira, M.M.; Ferreira, M.V.S.; Kamruzzaman, M.; Barbin, D.F. Prediction of Impurities in Cocoa Shell Powder Using NIR Spectroscopy. J. Pharm. Biomed. Anal. Open 2023, 2, 100015. [Google Scholar] [CrossRef]
  62. Kurniawan, F.; Budiastra, I.W.; Sutrisno, S.; Widyotomo, S. Classification of Arabica Java Coffee Beans Based on Their Origin using NIR Spectroscopy. In Proceedings of the 2nd International Conference on Agriculture Postharvest Handling and Processing (ICAPHP 2018), Bali, Indonesia, 29–31 August 2018. [Google Scholar] [CrossRef]
  63. Bona, E.; Marquetti, I.; Link, J.V.; Makimori, G.Y.F.; Arca, V.C.; Lemes, A.L.G.; Ferreira, J.M.G.; Scholz, M.G.S.; Valderrama, P.; Poppi, R.J. Support Vector Machines in Tandem with Infrared Spectroscopy for Geographical Classification of Green Arabica Coffee. LWT Food Sci. Technol. 2017, 76 Pt B, 330–336. [Google Scholar] [CrossRef]
  64. Diniz, P.H.G.D.; Barbosa, M.F.; Milanez, K.D.T.M.; Pistonesi, M.F.; de Araújo, M.C.U. Using UV–Vis Spectroscopy for Simultaneous Geographical and Varietal Classification of Tea Infusions Simulating a Home-Made Tea Cup. Food Chem. 2016, 192, 374–379. [Google Scholar] [CrossRef]
  65. Szabó, E.; Gergely, S.; Salgó, A. Linear Discriminant Analysis, Partial Least Squares Discriminant Analysis, and Soft Independent Modeling of Class Analogy of Experimental and Simulated Near-Infrared Spectra of a Cultivation Medium for Mammalian Cells. J. Chemom. 2018, 32, e3005. [Google Scholar] [CrossRef]
  66. Lasalvia, M.; Capozzi, V.; Perna, G. A Comparison of PCA-LDA and PLS-DA Techniques for Classification of Vibrational Spectra. Appl. Sci. 2022, 12, 5345. [Google Scholar] [CrossRef]
Disclaimer/Publisher’s Note: The statements, opinions, and data contained in all publications are solely those of the individual author(s) and contributor(s) and not of MDPI and/or the editor(s). MDPI and/or the editor(s) disclaim responsibility for any injury to people or property resulting from any ideas, methods, instructions or products referred to in the content.
Figure 1. The geographical origin of Gayo arabica green coffee beans used in this study.
Foods 12 04302 g001
Figure 2. Three types of Gayo arabica green coffee beans were used in this study: (a) honey process (HP); (b) wine process (WP); and (c) natural process (NP).
Foods 12 04302 g002
Figure 3. The intact spectral acquisition system for Gayo arabica green coffee beans using portable LED-based fluorescence spectroscopy.
Foods 12 04302 g003
Figure 4. Raw typical fluorescence spectral data of intact Gayo arabica green coffee beans (HP, WP, and NP) with different cherry processing methods in the range of 348.5–866.5 nm.
Foods 12 04302 g004
Figure 5. Smoothed typical fluorescence spectral data of intact Gayo arabica green coffee beans (HP, WP, and NP) with different cherry processing methods in the range of 348.5–866.5 nm.
Foods 12 04302 g005
Figure 6. The score plot of the first three PCs from PCA calculation on the smoothed fluorescence spectral data in the range of 348.5–866.5 nm.
Foods 12 04302 g006
Figure 7. X-loading versus wavelength plot of the first three PCs from PCA calculation on the smoothed fluorescence spectral data in the range of 348.5–866.5 nm.
Foods 12 04302 g007
Figure 8. The influence plot from PCA calculation on the smoothed fluorescence spectral data in the range of 348.5–866.5 nm.
Foods 12 04302 g008
Figure 9. The PCA-LDA model with quadratic method calculated on the smoothed fluorescence spectral data in the range of 348.5–866.5 nm.
Foods 12 04302 g009
Table 1. The result of PCA calculation using the first ten principal components (PCs) in the calibration and validation steps.
Principal Components (PCs)Cumulative Percentages Variance (CPV) (%)
CalibrationValidation
PC191.1691.00
PC296.1496.03
PC398.5898.52
PC499.3099.27
PC599.5699.53
PC699.7399.71
PC799.8899.87
PC899.9299.92
PC999.9599.94
PC1099.9699.96
Table 2. The result of classification using the smoothed fluorescence spectral data in the range of 348.5–866.5 nm for three different classification models.
Classification Model SamplesActualAccuracy Rate (%)
HPWPNP
PLS-DAPredictedHP160083.33
WP4206
NP0014
LDAPredictedHP202095.00
WP0170
NP0120
PCA-LDAPredictedHP200096.67
WP0180
NP0220
Disclaimer/Publisher’s Note: The statements, opinions and data contained in all publications are solely those of the individual author(s) and contributor(s) and not of MDPI and/or the editor(s). MDPI and/or the editor(s) disclaim responsibility for any injury to people or property resulting from any ideas, methods, instructions or products referred to in the content.

