
Development of Healthy Snacks Incorporating Meal from Tenebrio molitor and Alphitobius diaperinus Using 3D Printing Technology


Abstract
:1. Introduction
2. Materials and Methods
2.1. Dough Preparation and Printing
2.2. Snack Characterization
2.2.1. Dough Rheological Properties
2.2.2. Texture Properties
2.2.3. Nutritional Characterization
2.3. Antioxidant Capacity
2.3.1. DPPH
2.3.2. FRAP
2.3.3. Total Phenolic Content
2.4. Opinion Study
2.5. Statistical Analysis
3. Results
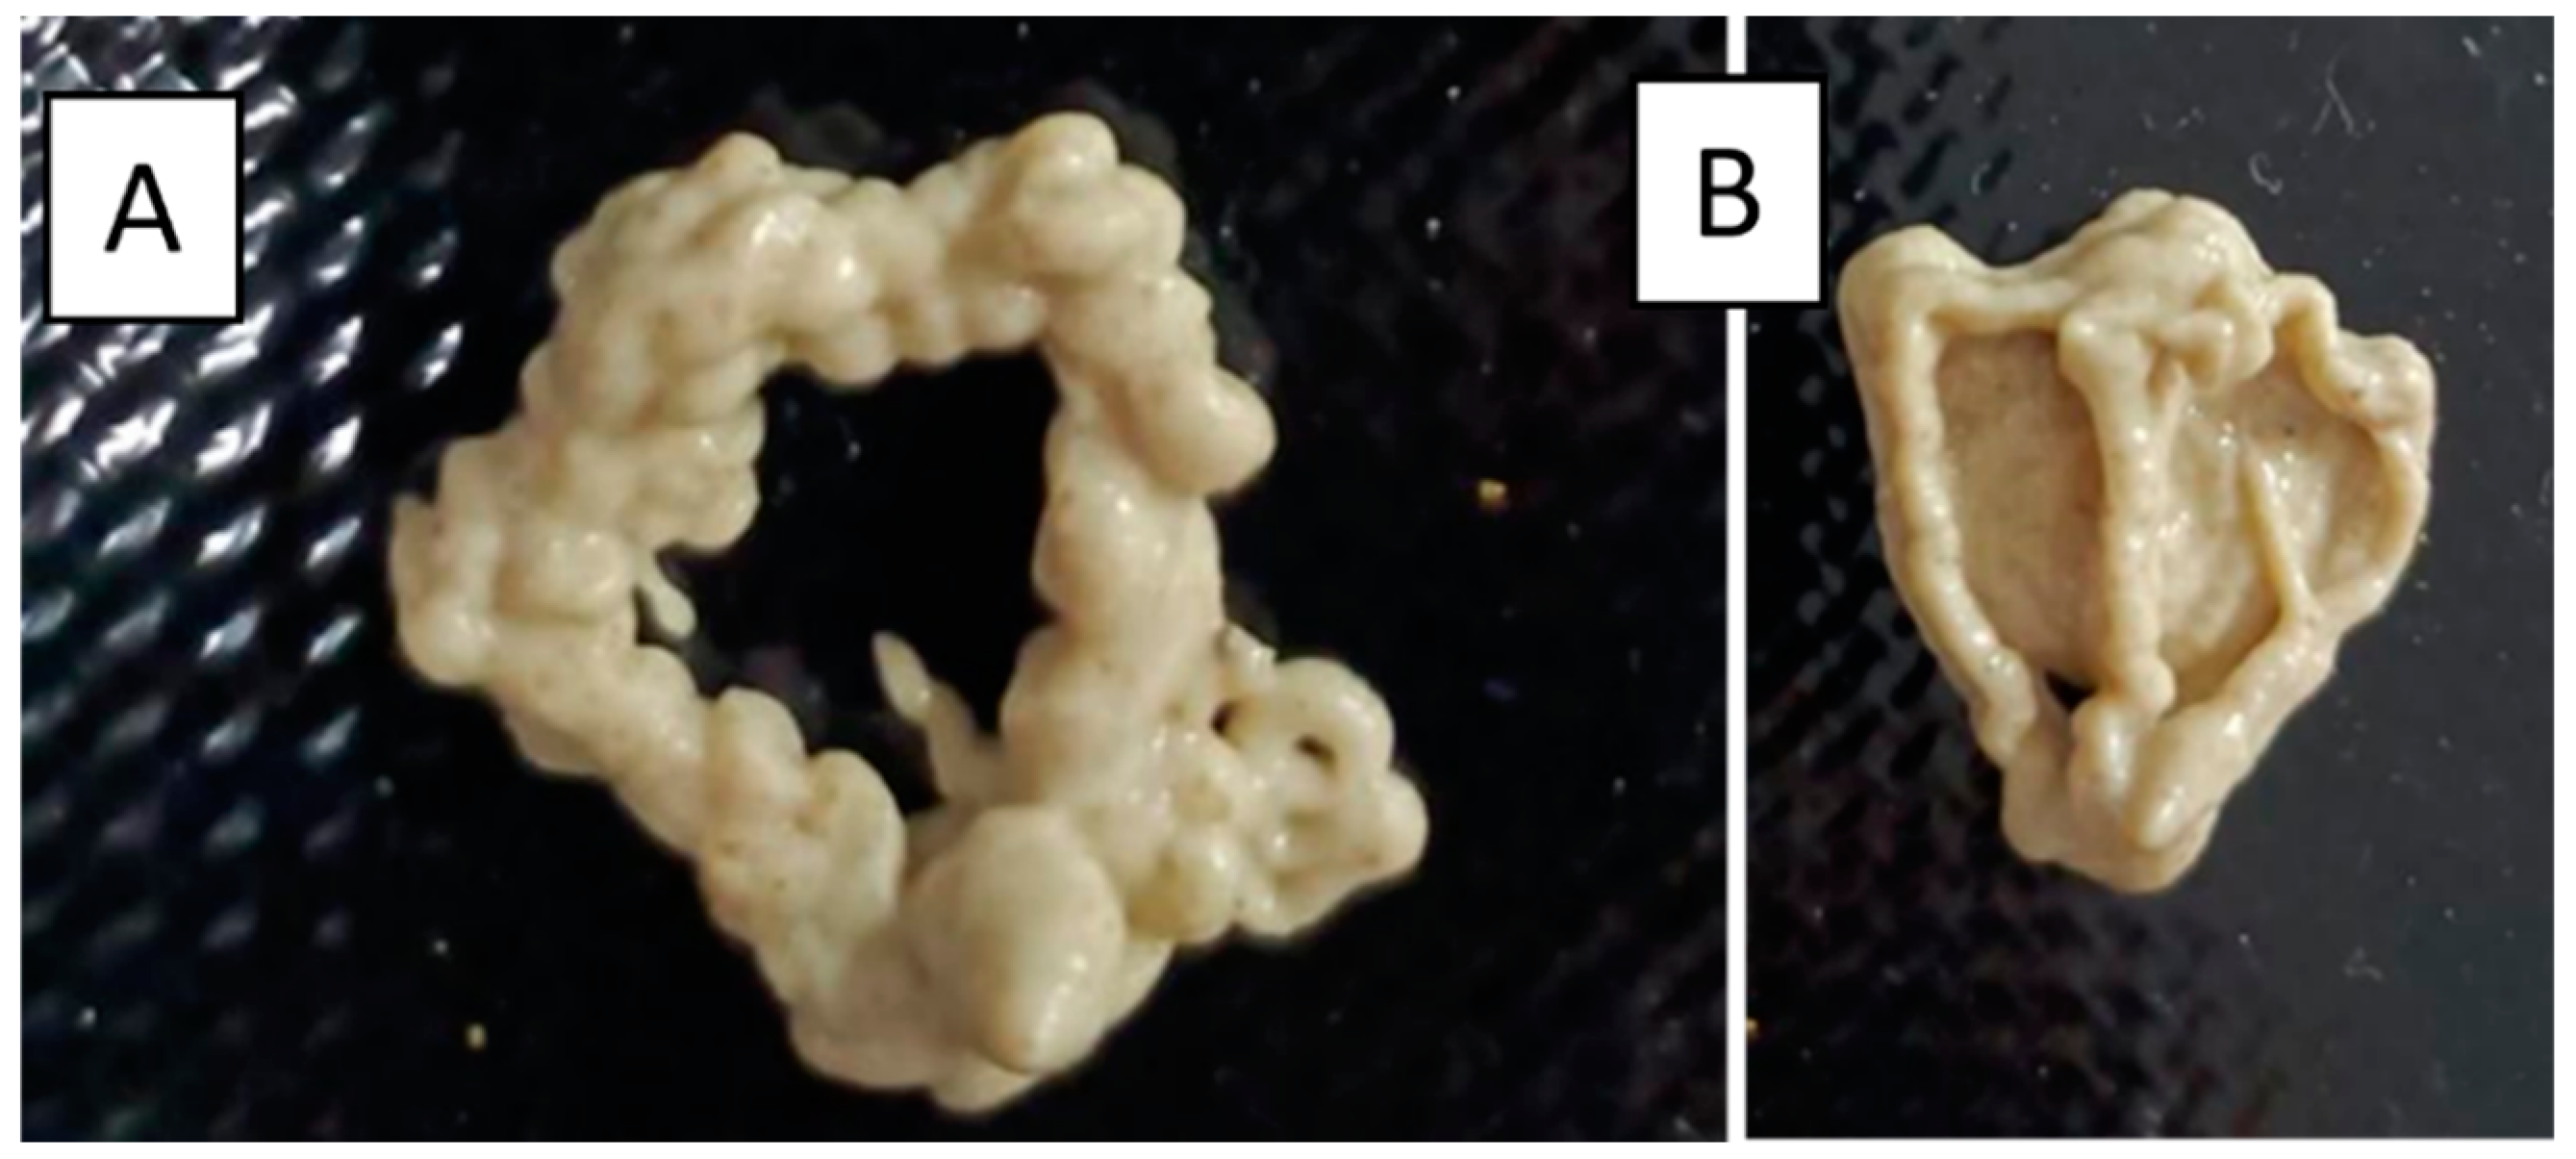
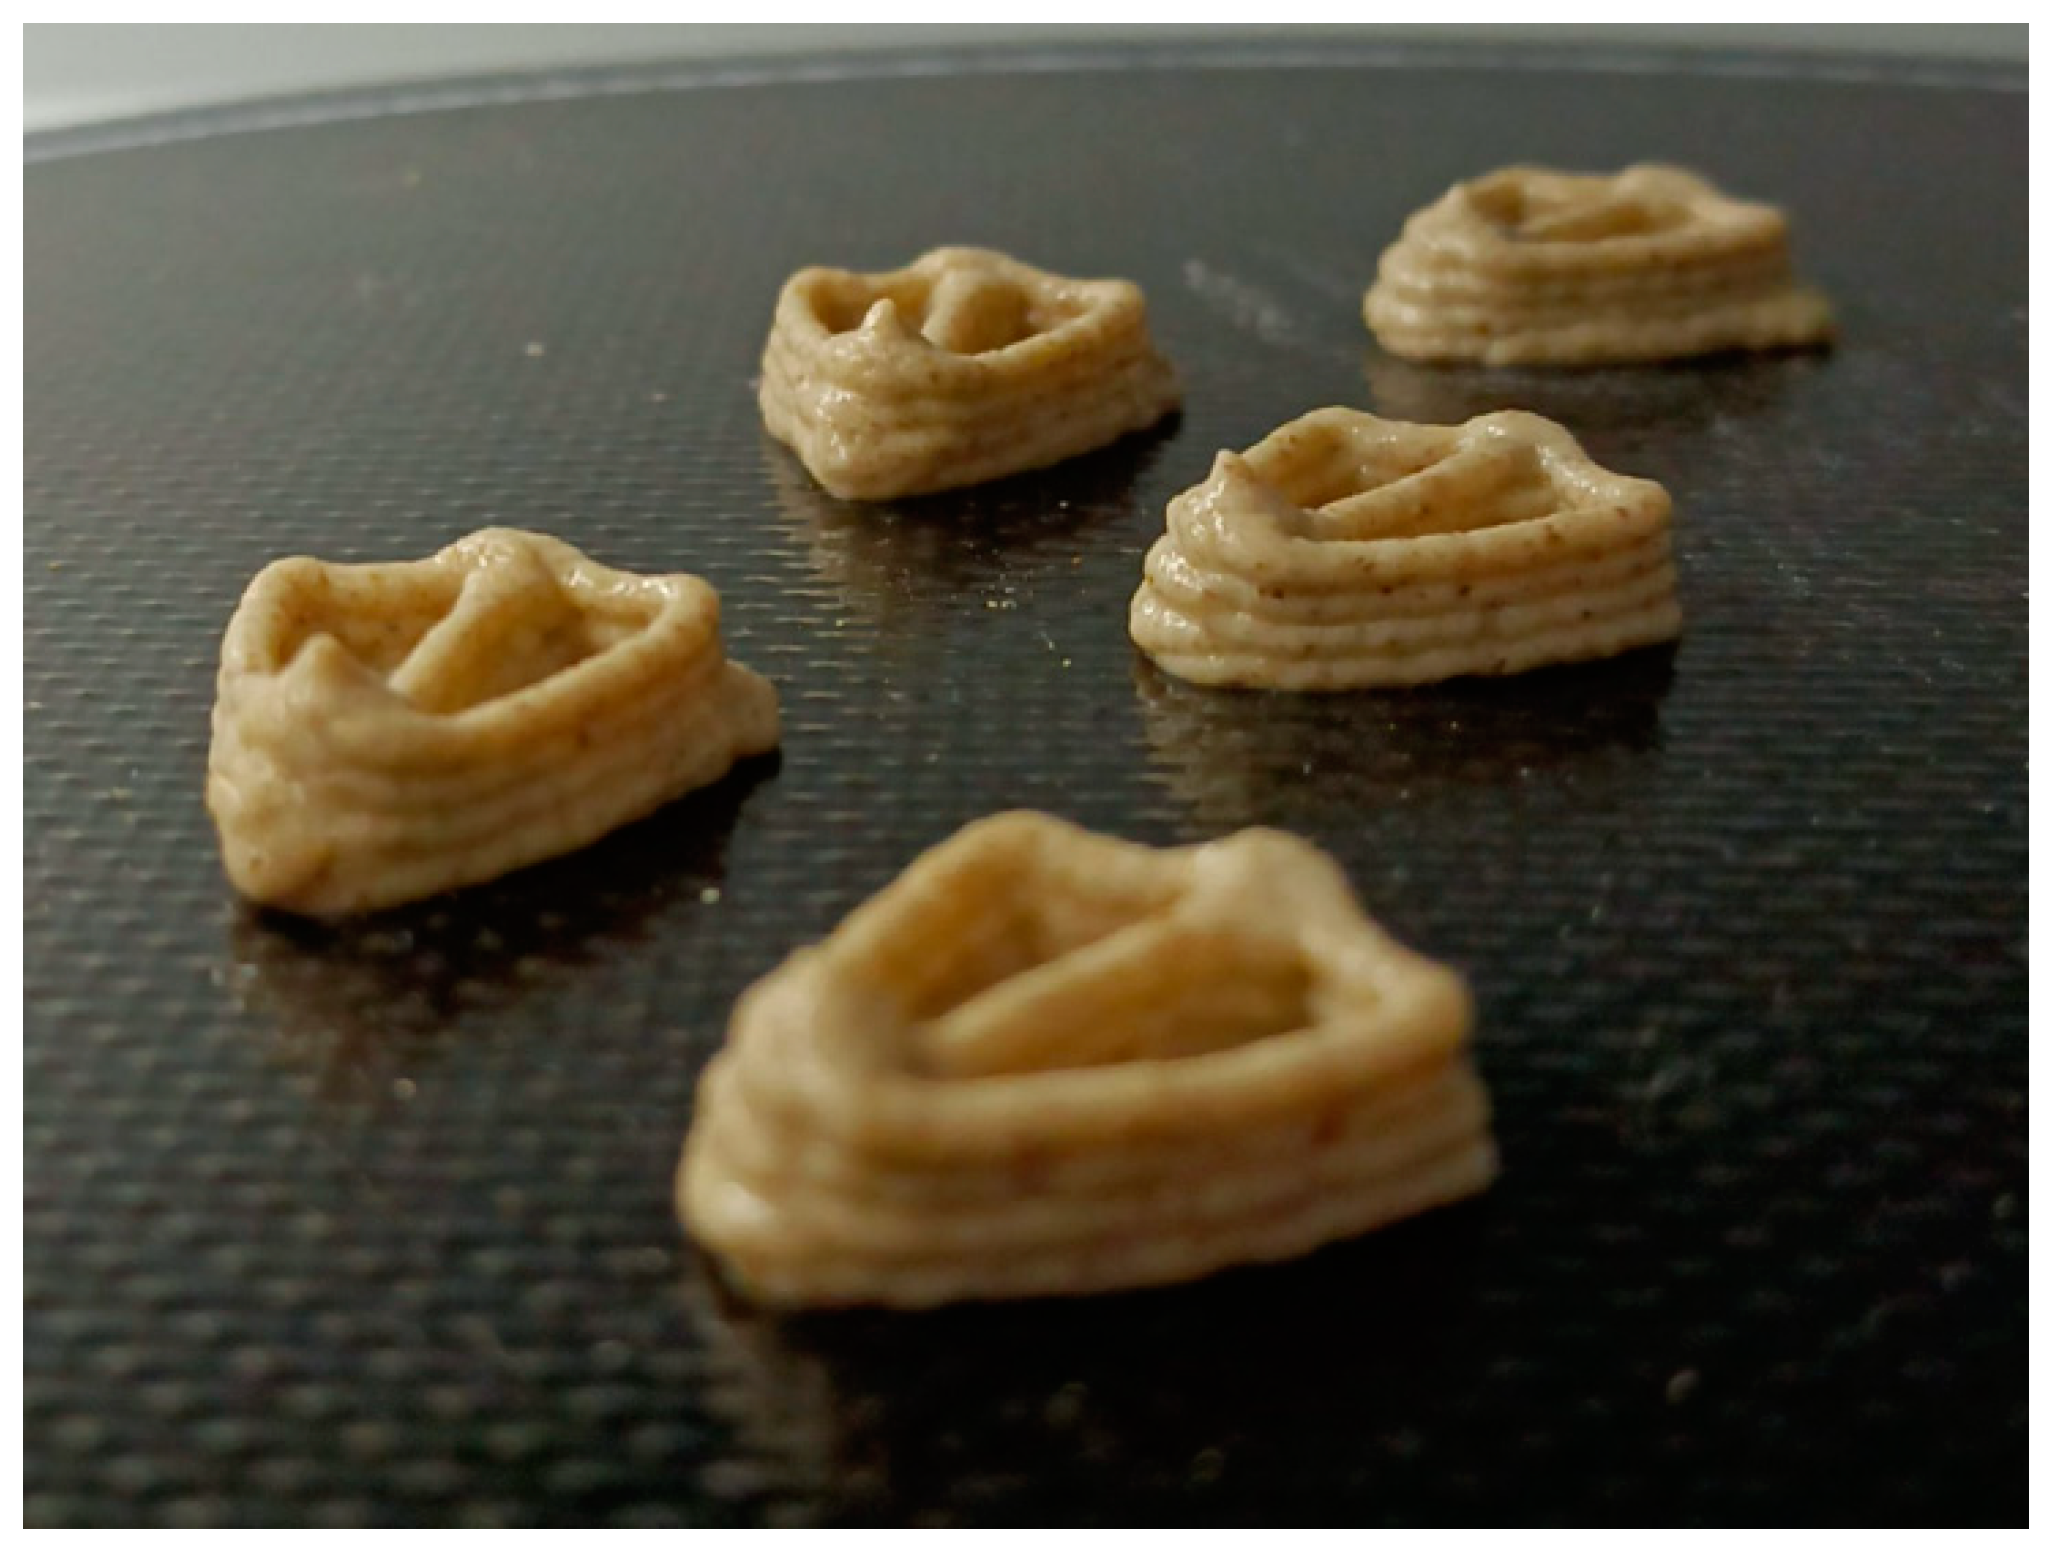
3.1. Snack Printing
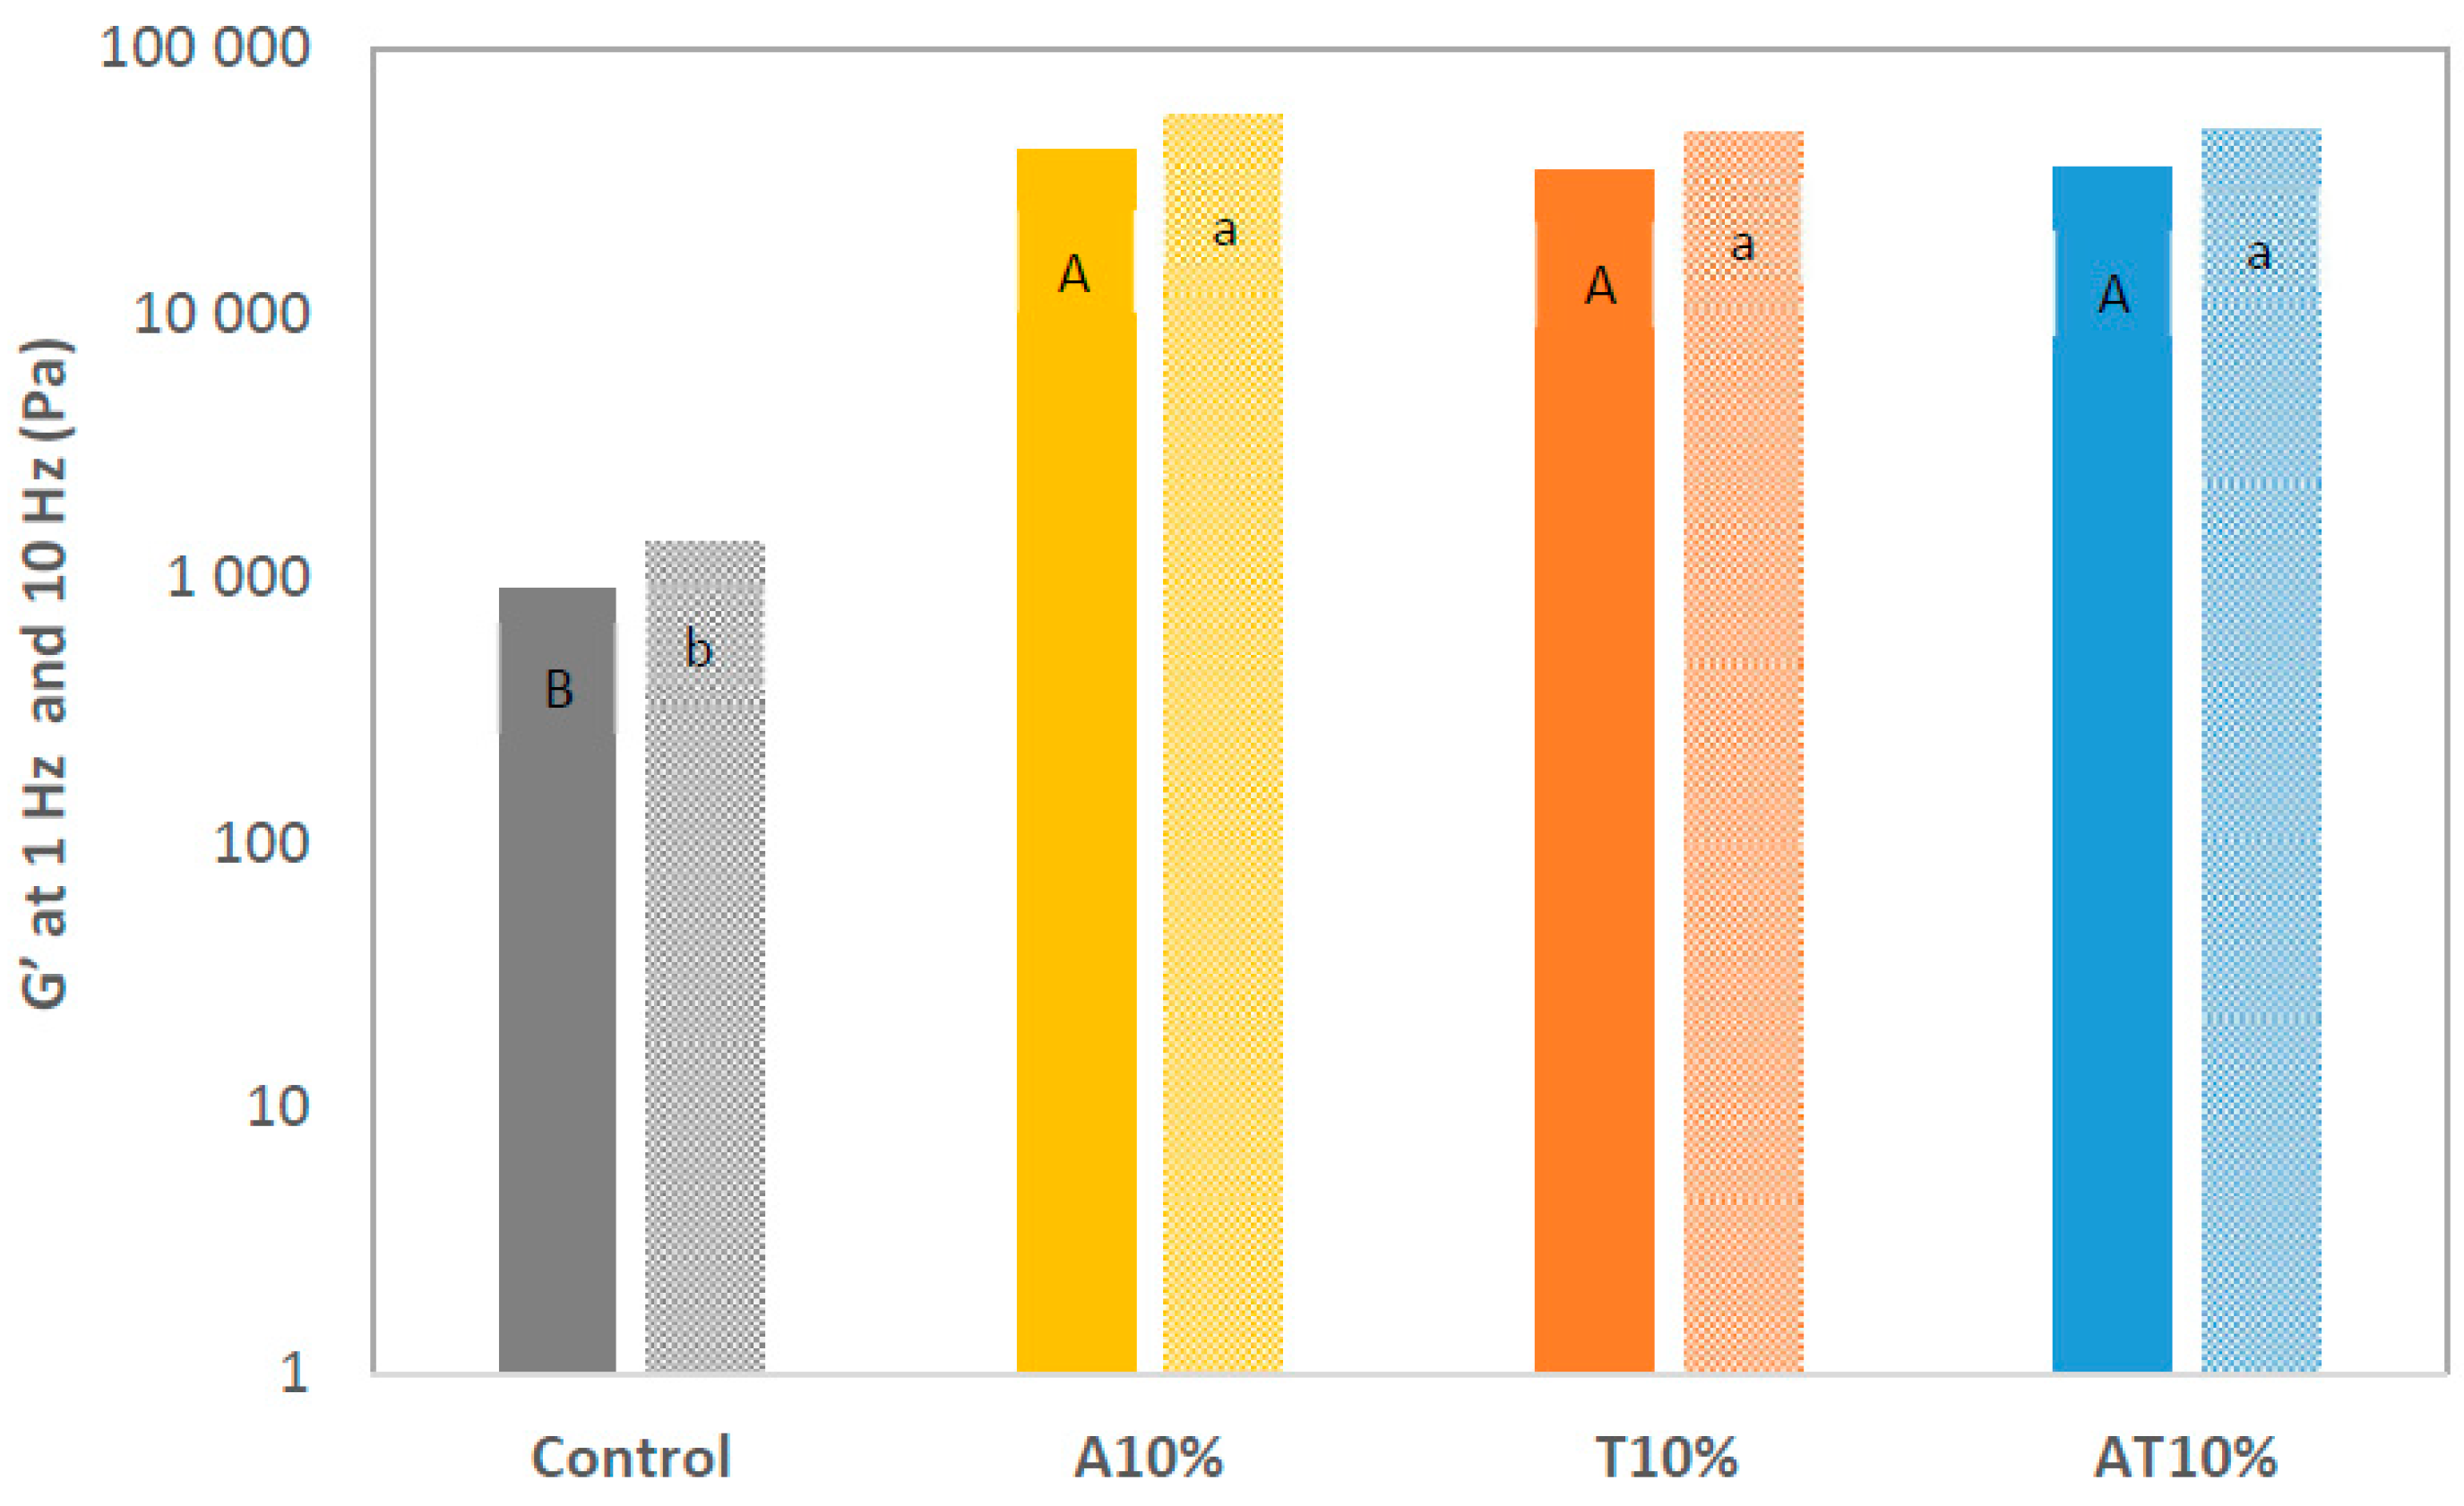
3.2. Dough Rheological Properties
3.3. Snack Texture
3.4. Nutritional Characterization
3.5. Antioxidant Potential and Total Phenolics
3.6. Opinion Study
4. Conclusions
Author Contributions
Funding
Institutional Review Board Statement
Informed Consent Statement
Data Availability Statement
Acknowledgments
Conflicts of Interest
References
- United Nations Department of Economic and Social Affairs, Population Division. World Population Prospects 2022: Summary of Results; UN DESA/POP/2022/TR/NO. 3; United Nations Department of Economic and Social Affairs, Population Division: New York City, NY, USA, 2022. [Google Scholar]
- Tilman, D.; Balzer, C.; Hill, J.; Befort, B.L. Global Food Demand and the Sustainable Intensification of Agriculture. Proc. Natl. Acad. Sci. USA 2011, 108, 20260–20264. [Google Scholar] [CrossRef] [PubMed]
- FAO; WHO. Hazards Associated with Animal Feed. Report of the Joint FAO/WHO Expert Meeting 12–15 May 2015, FAO Headquarters, Rome, Italy; FAO Animal Production and Health Report; FAO: Rome, Italy, 2019; No. 13; p. 286. [Google Scholar]
- FAO. Looking at Edible Insects from a Food Safety Perspective. Challenges and Opportunities for the Sector; FAO: Rome, Italy, 2021. [Google Scholar]
- Lesnik, J. Edible Insects and Human Evolution; University Press of Florida: Gainesville, FL, USA, 2018. [Google Scholar]
- Jongema, Y. Worldwide List of Recorded Edible Insects; “Top Ten Trends for 2019” Innova Market Insights, ProFood Tech—March 2019; Lee, V., Ed.; Department of Entomology, Wageningen University & Research: Wageningen, The Netherlands, 2017. [Google Scholar]
- Van Huis, A.; Van Itterbeeck, J.; Klunder, H.; Mertens, E.; Halloran, A.; Muir, G.; Vantomme, P. Edible Insects: Future Prospects for Food and Feed Security; FAO Forestry Paper 171; Food and Agriculture Organization of the United Nations: Rome, Italy, 2013; Volume 1, pp. 1–187. [Google Scholar]
- Ramos-Elorduy, J.; Pino Moreno, J.M.; Escamilla Prado, E.; Alvarado Perez, M.; Lagunez Otero, J.; Ladron de Guevara, O. Nutritional value of edible insects from the state of Oaxaca, Mexico. J. Food Compos. Anal. 1997, 10, 142–157. [Google Scholar] [CrossRef]
- Yen, A. Insects as food and feed in the Asia Pacific region: Current perspectives and future directions. J. Insects Food Feed 2015, 1, 33–55. [Google Scholar] [CrossRef]
- Costa-Neto, E.M. Edible insects in Latin America: Old challenges, new opportunities. J. Insects Food Feed 2016, 2, 1–2. [Google Scholar] [CrossRef]
- Kim, T.K.; Yong, H.I.; Kim, Y.B.; Kim, H.W.; Choi, Y.S. Edible insects as a protein source: A review of public perception, processing technology, and research trends. Food Sci. Anim. Resour. 2019, 39, 521–554. [Google Scholar] [CrossRef] [PubMed]
- Raheem, D.; Carrascosa, C.; Oluwole, O.B.; Nieuwland, M.; Saraiva, A.; Millán, R.; Raposo, A. Traditional consumption of and rearing edible insects in Africa, Asia and Europe. Crit. Rev. Food Sci. Nutr. 2019, 59, 2169–2188. [Google Scholar] [CrossRef] [PubMed]
- Fagan, B. The Little Ice Age: How Climate Made History. J. Calif. Great Basin Anthropol. 2000, 24, 309–312. [Google Scholar]
- Williams, J.P.; Williams, J.R.; Kirabo, A.; Chester, D.; Peterson, M. Nutrient Content and Health Benefits of Insects. Insects as Sustainable Food Ingredients; Academic Press: Cambridge, MA, USA, 2016; pp. 61–84. [Google Scholar]
- Alexander, P.; Brown, C.; Arneth, A.; Dias, C.; Finnigan, J.; Moran, D.; Mark Rounsevell MD, A. Could consumption of insects, cultured meat or imitation meat reduce global agricultural land use? Glob. Food Secur. 2017, 15, 22–32. [Google Scholar] [CrossRef]
- Dinev, I. The darkling beetle (Alphitobius diaperinus)—A health hazard for broiler chicken production. Trakia J. Sci. 2013, 11, 1–4. [Google Scholar]
- Kozaki, T.; Kimmelblatt, B.A.; Hamm, R.L.; Scott, J.G. Comparison of two acetylcholinesterase gene cDNAs of the lesser mealworm, Alphitobius diaperinus, in insecticide susceptible and resistant strains. Arch. Insect Biochem. Physiol. 2008, 67, 130–138. [Google Scholar] [CrossRef]
- Rumbos, C.I.; Karapanagiotidis, I.T.; Mente, E.; Athanassiou, C.G. The lesser mealworm Alphitobius diaperinus: A noxious pest or a promising nutrient source? Rev. Aquac. 2019, 11, 1418–1437. [Google Scholar] [CrossRef]
- Adámková, A.; Kourimská, L.; Borkovcová, M.; Kulma, M.; Mlček, J. Nutritional values of edible Coleoptera (Tenebrio molitor, Zophobas morio and Alphitobius diaperinus) reared in the Czech Republic. Potravinarstvo 2016, 10, 663–671. [Google Scholar] [CrossRef] [PubMed]
- Niyonsaba, H.; Höhler, J.; Kooistra, J.; Van der Fels-Klerx, H.J.; Meuwissen MP, M. Profitability of insect farms. J. Insects Food Feed 2021, 7, 923–934. [Google Scholar] [CrossRef]
- Errico, S.; Spagnoletta, A.; Verardi, A.; Moliterni, S.; Dimatteo, S.; Sangiorgio, P. Tenebrio molitor as a source of interesting natural compounds, their recovery processes, biological effects, and safety aspects. Compr. Rev. Food Sci. Food Saf. 2022, 21, 148–197. [Google Scholar] [CrossRef] [PubMed]
- Kurečka, M.; Kulma, M.; Petříčková, D.; Plachý, V.; Kouřimská, L. Larvae and pupae of Alphitobius diaperinus as promising Protein Alternatives. Eur. Food Res. Technol. 2021, 247, 2527–2532. [Google Scholar] [CrossRef]
- Gumul, D.; Oracz, J.; Kowalski, S.; Mikulec, A.; Skotnicka, M.; Karwowska, K.; Areczuk, A. Bioactive compounds and antioxidant composition of nut bars with addition of various edible insect flours. Molecules 2023, 28, 3556. [Google Scholar] [CrossRef]
- Kowalski, S.; Gumul, D.; Oracz, J.; Rosicka-Kaczmarek, J.; Mikulec, A.; Mickowska, B.; Skotnicka, M.; Zborowski, M. Chemical composition, antioxidant properties and sensory aspects of sponge cakes supplemented with edible insect flours. Antioxidants 2023, 12, 1912. [Google Scholar] [CrossRef]
- Nino, M.C.; Reddivari, L.; Osorio, C.; Kaplan, I.; Liceaga, A.M. Insects as a source of phenolic compounds and potential health benefits. J. Insects Food Feed 2021, 7, 1077–1087. [Google Scholar] [CrossRef]
- Dankar, I.; Haddarah, A.; Omar FE, L.; Sepulcre, F.; Pujolà, M. 3D printing technology: The new era for food customization and elaboration. Trends Food Sci. Technol. 2018, 75, 231–242. [Google Scholar] [CrossRef]
- Letras, P.; Oliveira, S.; Varela, J.; Nunes, M.C.; Raymundo, A. 3D printed gluten-free cereal snack with incorporation of Spirulina (Arthrospira platensis) and/or Chlorella vulgaris. Algal Res. 2021, 68, 102863. [Google Scholar] [CrossRef]
- Oliveira, S.; Sousa, I.; Raymundo, A. Printability evaluation of Chlorella vulgaris snacks. Algal Res. 2022, 68, 102879. [Google Scholar] [CrossRef]
- Oliveira, S.; Torres Pérez, M.D.; Sousa, I.; Raymundo, A. 3D-printed Chlorella vulgaris snacks: A contribution to a healthy diet. Front. Food Sci. Technol. 2023, 3, 1265828. [Google Scholar] [CrossRef]
- Severini, C.; Azzollini, D.; Albenzio, M.; Derossi, A. On printability, quality and nutritional properties of 3D printed cereal based snacks enriched with edible insects. Food Res. Int. 2018, 106, 666–676. [Google Scholar] [CrossRef] [PubMed]
- Zhang, W.; Jia, Y.; Guo, C.; Devahastin, S.; Hu, X.; Yi, J. Effect of compositions and physical properties on 3D printability of gels from selected commercial edible insects: Role of protein and chitin. Food Chem. 2024, 433, 137349. [Google Scholar] [CrossRef] [PubMed]
- Bourne, M. Sensory Methods of Texture and Viscosity Measurement: Sensory Texture Profiling. In Food Texture and Viscosity: Concept and Measurement, 2nd ed.; Taylor, S., Ed.; Academic Press: Cambridge, MA, USA, 2002; pp. 259–266. [Google Scholar]
- Batista, A.; Niccolai, A.; Bursic, I.; Sousa, I.; Raymundo, A.; Rodolfi, L.; Biondi, N.; Tredici, M. Microalgae as functional ingredients in savory food products: Application to wheat crackers. Foods 2019, 8, 611. [Google Scholar] [CrossRef] [PubMed]
- Regulation (EU) No. 1169/2011 of the European Parliament and of the Council of 25 October 2011 on the provision of food information to consumers.
- Martins, R.; Gouvinhas, I.; Nunes, M.C.; Peres, J.; Raymundo, A.; Barros, A. Acorn flour as a source of bioactive compounds in gluten-free bread. Molecules 2020, 25, 3568. [Google Scholar] [CrossRef] [PubMed]
- Djouadi, A.; Sales, J.R.; Carvalho, M.O.; Raymundo, A. Development of healthy protein-rich crackers using Tenebrio molitor flour. Foods 2022, 11, 702. [Google Scholar] [CrossRef] [PubMed]
- Brand-Williams, W.; Cuvelier, M.E.; Berset, C. Use of a free radical method to evaluate antioxidant activity. LWT—Food Sci. Technol. 1995, 28, 25–30. [Google Scholar] [CrossRef]
- Sánchez-Moreno, C.; Larrauri, J.; Saura-Calixto, F. A procedure to measure the antiradical efficiency of polyphenols. J. Sci. Food Agric. 1998, 76, 270–276. [Google Scholar] [CrossRef]
- Benzie, I.; Strain, J.J. The ferric reducing ability of plasma (FRAP) as a measure of antioxidant power: The FRAP assay. Anal. Biochem. 1996, 239, 70–76. [Google Scholar] [CrossRef]
- Álvarez-Castillo, E.; Oliveira, S.; Bengoechea, C.; Sousa, I.; Raymundo, A.; Guerrero, A. A rheological approach to 3D printing of plasma protein based doughs. J. Food Eng. 2021, 288, 110255. [Google Scholar] [CrossRef]
- Uribe-Wandurraga, Z.N.; Zhang, L.; Martijn, W.J.; Noort, M.; Schutyser, A.I.; García-Segovia, P.; Martínez-Monzó, J. Printability and physicochemical properties of microalgae-enriched 3D-printed snacks. Food Bioprocess Technol. 2020, 13, 2029–2042. [Google Scholar] [CrossRef]
- Montanari, F.; Pinto de Moura, A.; Cunha, L.M. Production and Commercialization of Insects as Food and Feed. Production and Commercialization of Insects as Food and Feed; Springer International Publishing: Berlin/Heidelberg, Germany, 2021. [Google Scholar]
- Rumpold, B.A.; Schlüter, O.K. Nutritional composition and safety aspects of edible insects. Mol. Nutr. Food Res. 2013, 57, 802–823. [Google Scholar] [CrossRef] [PubMed]
- Nino, M.C.; Reddivari, L.; Ferruzzi, M.G.; Liceaga, A.M. Targeted phenolic characterization and antioxidant bioactivity of extracts from edible Acheta domesticus. Foods 2021, 10, 2295. [Google Scholar] [CrossRef]
- Regulation (EC) No 1924/2006 of the European Parliament and of the Council of 20 December 2006 on nutrition and health claims made on foods.


| Ingredients | Control | A10% | T10% | AT10% |
|---|---|---|---|---|
| Wheat flour (g) | 15.00 | 12.50 | 12.50 | 12.50 |
| Rice flour (g) | 15.00 | 12.50 | 12.50 | 12.50 |
| Maize starch (g) | 23.80 | 17.75 | 17.75 | 17.75 |
| Xanthan gum (g) | 0.20 | 0.25 | 0.25 | 0.25 |
| Salt (g) | 1.00 | 1.00 | 1.00 | 1.00 |
| Edible oil (g) | 5.00 | - | - | - |
| Insect flour (g) | 0.00 | 10.00 | 10.00 | 10.00 |
| Water (g) | 40.00 | 46.00 | 46.00 | 46.00 |
| Total weight (g) | 100.00 | 100.00 | 100.00 | 100.00 |
| Samples | Control | T10% | A10% | AT10% |
|---|---|---|---|---|
| Moisture (%) | 2.02 ± 0.03 a | 0.82 ± 0.01 c | 0.36 ± 0.01 d | 1.72 ± 0.06 b |
| Ash (%) | 3.12 ± 0.05 a | 4.06 ± 0.00 b | 4.48 ± 0.01 a | 3.43 ± 0.09 d |
| Total fat (%) | 0.04 ± 0.02 d | 0.13 ± 0.09 c | 0.15 ± 0.04 b | 0.23 ± 0.12 a |
| Protein (%) | 6.01 ± 0.47 d | 13.46 ± 0.85 bc | 15.64 ± 0.85 a | 13.35 ± 0.61 b |
| Fiber (%) | 1.25 ± 0.68 a | 1.51 ± 0.59 a | 1.43 ± 0.23 a | 1.99 ± 0.16 a |
| Carbohydrates (%) * | 87.57 | 80.03 | 77.94 | 79.29 |
| Energy (kcal/100 g) | 379.69 | 381.11 | 381.34 | 380.58 |
| Samples | Control% + SD (mg/100 g) | T10% + SD (mg/100 g) | A10% + SD (mg/100 g) | AT10% + SD (mg/100 g) |
|---|---|---|---|---|
| Na | 657.97 ± 2.61 d | 787.81 ± 4.38 c | 865.09 ± 12.00 b | 1058.34 ± 6.87 a |
| K | 95.02 ± 0.65 d | 220.45 ± 4.19 c | 235.82 ± 4.30 b | 236.01 ± 4.19 a |
| Ca | 14.25 ± 13.71 a | 13.48 ± 1.82 a | 26.74 ± 1.76 a | 18.88 ± 3.51 a |
| Mg | 17.79 ± 0.23 d | 55.23 ± 0.60 a | 35.22 ± 0.48 c | 47.41 ± 0.60 b |
| P | 70.69 ± 2.14 d | 188.16 ± 1.46 c | 199.19 ± 3.02 a | 198.57 ± 1.52 b |
| S | 70.38 ± 1.00 d | 111.06 ± 2.05 c | 131.20 ± 2.05 a | 122.88 ± 1.20 b |
| Fe | 2.59 ± 0.94 a | 3.05 ± 0.20 a | 2.20 ± 0.25 a | 3.47 ± 0.97 a |
| Cu | 0.42 ± 0.01 a | 0.70 ± 0.03 b | 0.74 ± 0.05 b | 0.69 ± 0.02 b |
| Zn | 0.68 ± 0.02 d | 2.76 ± 0.02 bc | 2.69 ± 0.04 b | 2.82 ± 0.03 a |
| Mn | 0.59 ± 0.04 a | 0.61 ± 0.01 a | 0.56 ± 0.01 a | 0.58 ± 0.01 a |
| B | 0.34 ± 0.48 a | 0.06 ± 0.02 a | 0.05 ± 0.01 a | 0.06 ± 0.01 a |
| DPPH (AAE mg/g DW) | FRAP (AAE mg/g DW) | TPC (GAE g/g DW) | |
|---|---|---|---|
| Control | 0.17 ± 0.03 a | 0.27 ± 0.01 a | 0.11 ± 0.03 a |
| A10% | 0.90 ± 0.12 b | 0.87 ± 0.07 b | 0.64 ± 0.08 b |
| T10% | 0.81 ± 0.04 b | 0.92 ± 0.07 b | 0.56 ± 0.09 b |
| AT10% | 0.75 ± 0.04 b | 0.99 ± 0.10 b | 0.59 ± 0.04 b |
Disclaimer/Publisher’s Note: The statements, opinions and data contained in all publications are solely those of the individual author(s) and contributor(s) and not of MDPI and/or the editor(s). MDPI and/or the editor(s) disclaim responsibility for any injury to people or property resulting from any ideas, methods, instructions or products referred to in the content. |
© 2024 by the authors. Licensee MDPI, Basel, Switzerland. This article is an open access article distributed under the terms and conditions of the Creative Commons Attribution (CC BY) license (https://creativecommons.org/licenses/by/4.0/).
Share and Cite
Herdeiro, F.M.; Carvalho, M.O.; Nunes, M.C.; Raymundo, A. Development of Healthy Snacks Incorporating Meal from Tenebrio molitor and Alphitobius diaperinus Using 3D Printing Technology. Foods 2024, 13, 179. https://doi.org/10.3390/foods13020179
Herdeiro FM, Carvalho MO, Nunes MC, Raymundo A. Development of Healthy Snacks Incorporating Meal from Tenebrio molitor and Alphitobius diaperinus Using 3D Printing Technology. Foods. 2024; 13(2):179. https://doi.org/10.3390/foods13020179
Chicago/Turabian StyleHerdeiro, Francisco Madail, Maria Otília Carvalho, Maria Cristiana Nunes, and Anabela Raymundo. 2024. "Development of Healthy Snacks Incorporating Meal from Tenebrio molitor and Alphitobius diaperinus Using 3D Printing Technology" Foods 13, no. 2: 179. https://doi.org/10.3390/foods13020179