
An Efficient Workflow for Quality Control Marker Screening and Metabolite Discovery in Dietary Herbs by LC-Orbitrap-MS/MS and Chemometric Methods: A Case Study of Chrysanthemum Flowers


Abstract
:
1. Introduction
2. Materials and Methods
2.1. Chemicals and Materials
2.2. Preparation of the Sample Solution
2.3. LC-Orbitrap-MS/MS Analysis
2.4. Data Pretreatment and Processing
2.5. Quality Control Marker Screening and Compound Discovery
3. Results and Discussion
3.1. Optimization of the Method
3.2. Quality Control Marker Screening
3.3. Compound Discovery and Identification
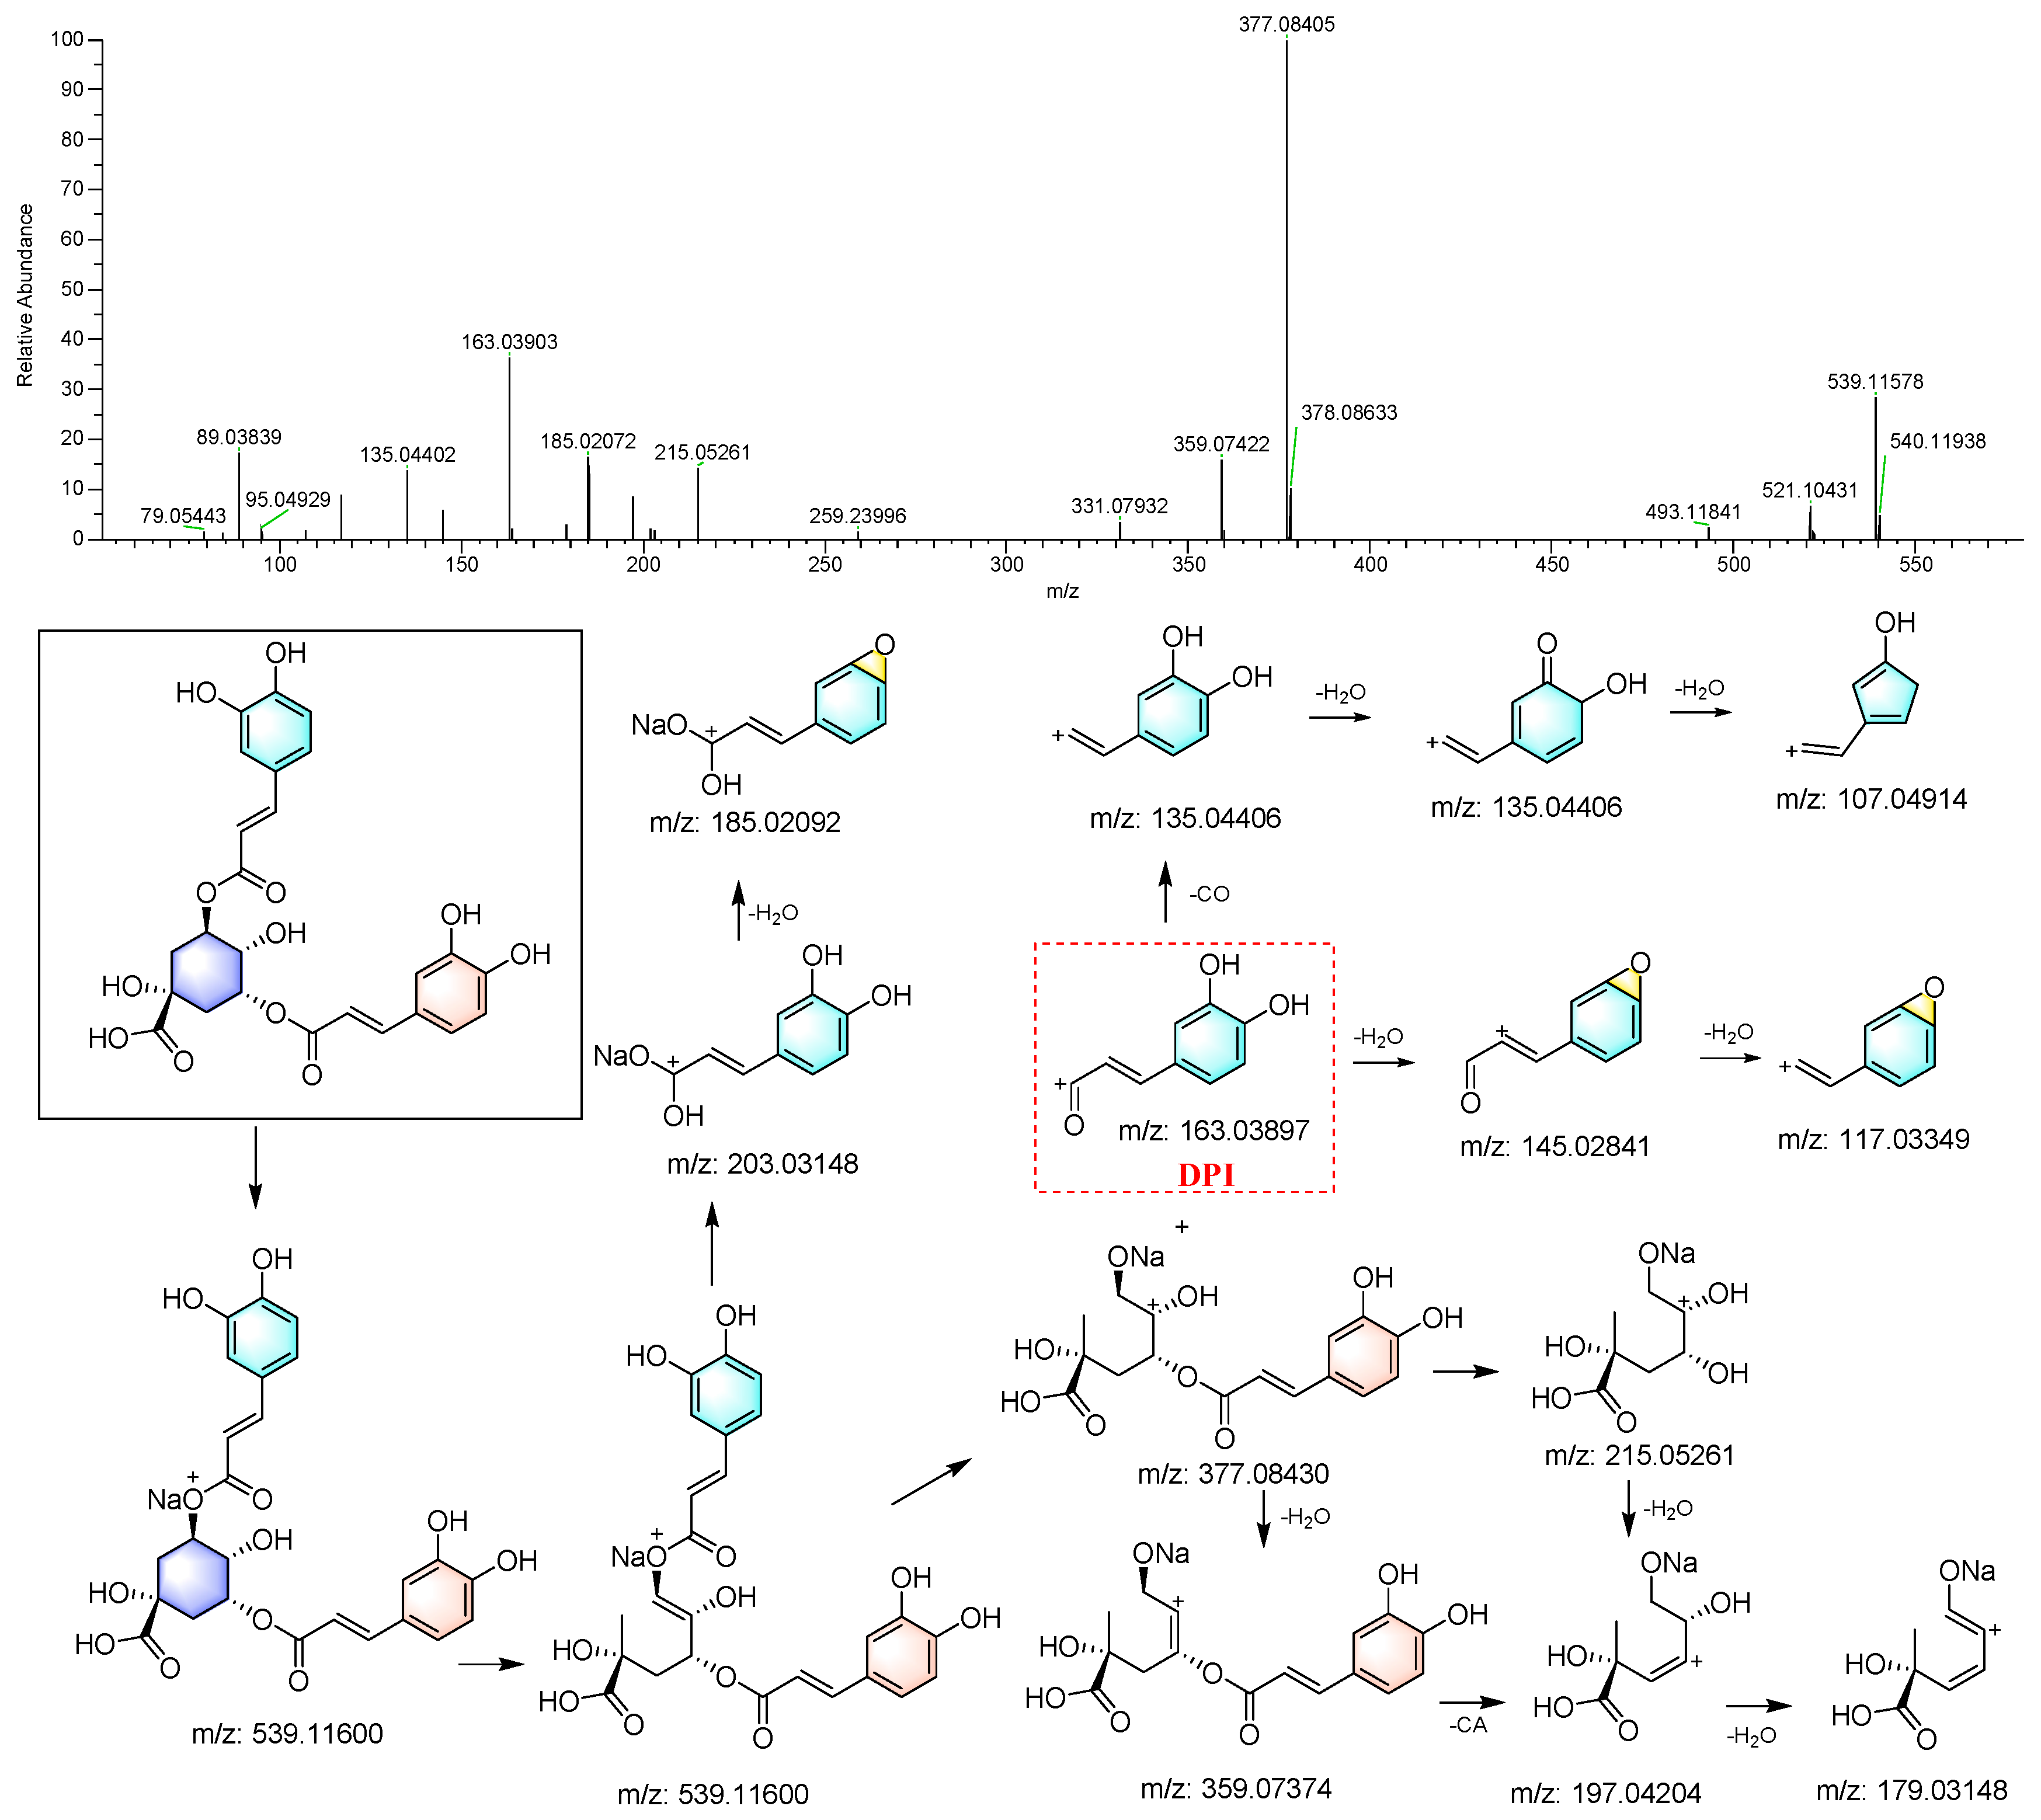
3.3.1. Identification of Caffeoylquinic Acid
3.3.2. Identification of Flavonoids
3.3.3. Identification of Other Compounds
3.3.4. In-Source Fragmentation and Partial Verification of the Identification Results
4. Conclusions
Supplementary Materials
Author Contributions
Funding
Institutional Review Board Statement
Informed Consent Statement
Data Availability Statement
Conflicts of Interest
References
- Zhang, X.; Su, M.; Du, J.; Zhou, H.; Li, X.; Zhang, M.; Hu, Y.; Ye, Z. Profiling of naturally occurring proanthocyanidins and other phenolic compounds in a diverse peach germplasm by LC-MS/MS. Food Chem. 2023, 403, 134471. [Google Scholar] [CrossRef] [PubMed]
- Arslan, M.; Tahir, H.E.; Zareef, M.; Shi, J.; Rakha, A.; Bilal, M.; Xiaowei, H.; Zhihua, L.; Xiaobo, Z. Recent trends in quality control, discrimination and authentication of alcoholic beverages using nondestructive instrumental techniques. Trends Food Sci. Technol. 2021, 107, 80–113. [Google Scholar] [CrossRef]
- D’Ovidio, C.; Locatelli, M.; Perrucci, M.; Ciriolo, L.; Furton, K.G.; Gazioglu, I.; Kabir, A.; Merone, G.M.; de Grazia, U.; Ali, I.; et al. LC-MS/MS application in pharmacotoxicological field: Current state and new applications. Molecules 2023, 28, 2127. [Google Scholar] [CrossRef] [PubMed]
- Mukherjee, P.K. Chapter 11—LC–MS: A rapid technique for understanding the plant metabolite analysis. In Quality Control and Evaluation of Herbal Drugs; Mukherjee, P.K., Ed.; Elsevier: Amsterdam, The Netherlands, 2019; pp. 459–479. [Google Scholar]
- Guo, J.; Shen, S.; Xing, S.; Yu, H.; Huan, T. ISFrag: De novo recognition of in-source fragments for liquid chromatography–mass spectrometry data. Anal. Chem. 2021, 93, 10243–10250. [Google Scholar] [CrossRef] [PubMed]
- Kushwaha, M.; Qayum, A.; Sharma, N.; Abrol, V.; Choudhary, P.; Murtaza, M.; Singh, S.K.; Vishwakarma, R.A.; Goutam, U.; Jain, S.K.; et al. LC–PDA–MS/MS-based dereplication guided isolation of a new optical isomer of 19,20-epoxycytochalasin-N and its cytotoxic activity. ACS Omega 2022, 7, 29135–29141. [Google Scholar] [CrossRef] [PubMed]
- Liu, Q.; Li, B.; Sun, K.; Li, C.; Shehla, N.; Yang, Y.; Cao, L.; Wang, W.; Liu, R. Simultaneously qualitative and quantitative analysis of the representative components in Kadsura heteroclita stem by UHPLC-Q-Orbitrap HRMS. J. Food Drug Anal. 2021, 29, 319–363. [Google Scholar] [CrossRef] [PubMed]
- Lin, L.; Harnly, J.M. Identification of the phenolic components of chrysanthemum flower (Chrysanthemum morifolium Ramat). Food Chem. 2010, 120, 319–326. [Google Scholar] [CrossRef]
- Youssef, F.S.; Eid, S.Y.; Alshammari, E.; Ashour, M.L.; Wink, M.; El-Readi, M.Z. Chrysanthemum indicum and Chrysanthemum morifolium: Chemical composition of their essential oils and their potential use as natural preservatives with antimicrobial and antioxidant activities. Foods 2020, 9, 1460. [Google Scholar] [CrossRef] [PubMed]
- Yuan, H.; Jiang, S.; Liu, Y.; Daniyal, M.; Jian, Y.; Peng, C.; Shen, J.; Liu, S.; Wang, W. The flower head of Chrysanthemum morifolium Ramat. (Juhua): A paradigm of flowers serving as Chinese dietary herbal medicine. J. Ethnopharmacol. 2020, 261, 113043. [Google Scholar] [CrossRef]
- Guo, Y.; Zhang, H.; Shao, S.; Sun, S.; Yang, D.; Lv, S. Anthocyanin: A review of plant sources, extraction, stability, content determination and modifications. Int. J. Food Sci. Technol. 2022, 57, 7573–7591. [Google Scholar] [CrossRef]
- Faisal, Z.; Saeed, F.; Afzaal, M.; Akram, N.; Shah, Y.A.; Islam, F.; Ateeq, H. Phytochemical profile and food applications of edible flowers: A comprehensive treatise. J. Food Process. Pres. 2022, 46, 17061. [Google Scholar] [CrossRef]
- Yuan, H.; Luo, J.; Lyu, M.; Jiang, S.; Qiu, Y.; Tian, X.; Liu, L.; Liu, S.; Ouyang, Y.; Wang, W. An integrated approach to Q-marker discovery and quality assessment of edible Chrysanthemum flowers based on chromatogram–effect relationship and bioinformatics analyses. Ind. Crop. Prod. 2022, 188, 115745. [Google Scholar] [CrossRef]
- Chinese Pharmacopoeia Commission. Pharmacopoeia of the People’s Republic of China; Chemical Industry Press: Beijing, China, 2020. [Google Scholar]
- Peng, A.; Lin, L.; Zhao, M. Screening of key flavonoids and monoterpenoids for xanthine oxidase inhibitory activity-oriented quality control of Chrysanthemum morifolium Ramat. ‘Boju’ based on spectrum-effect relationship coupled with UPLC-TOF-MS and HS-SPME-GC/MS. Food Res. Int. 2020, 137, 109448. [Google Scholar] [CrossRef] [PubMed]
- Long, W.; Bai, X.; Wang, S.; Chen, H.; Yin, X.-L.; Gu, H.-W.; Yang, J.; Fu, H. UHPLC-QTOF-MS-based untargeted metabolomics and mineral element analysis insight into the geographical differences of Chrysanthemum morifolium Ramat cv. “Hangbaiju” from different origins. Food Res. Int. 2023, 163, 112186. [Google Scholar] [CrossRef]
- Dai, T.; Sun, G. The analysis of active compounds in Flos Chrysanthemi Indici by UHPLC Q exactive HF hybrid Quadrupole-Orbitrap MS and comprehensive quality assessment of its preparation. Food Funct. 2021, 12, 1769–1782. [Google Scholar] [CrossRef] [PubMed]
- Louisse, J.; Mulder, P.P.J.; Gerssen, A.; Stoopen, G.; Rijkers, D.; van de Schans, M.G.M.; Peijnenburg, A.A.C.M. Bioassay-directed analysis-based identification of relevant pyrrolizidine alkaloids. Arch. Toxicol. 2022, 96, 2299–2317. [Google Scholar] [CrossRef] [PubMed]
- Tian, T.; Jin, Y.; Ma, Y.; Xie, W.; Xu, H.; Zhang, K.; Zhang, L.; Du, Y. Identification of metabolites of oridonin in rats with a single run on UPLC-Triple-TOF-MS/MS system based on multiple mass defect filter data acquisition and multiple data processing techniques. J. Chromatogr. B 2015, 1006, 80–92. [Google Scholar] [CrossRef] [PubMed]
- Qi, J.; Xu, D.; Zhou, Y.; Qin, M.; Yu, B. New features on the fragmentation patterns of homoisoflavonoids in Ophiopogon japonicus by high-performance liquid chromatography/diode-array detection/electrospray ionization with multi-stage tandem mass spectrometry. Rapid Commun. Mass Spectrom. 2010, 24, 2193–2206. [Google Scholar] [CrossRef] [PubMed]
- Qi, L.; Chen, C.; Li, P. Structural characterization and identification of iridoid glycosides, saponins, phenolic acids and flavonoids in Flos Lonicerae Japonicae by a fast liquid chromatography method with diode-array detection and time-of-flight mass spectrometry. Rapid Commun. Mass Spectrom. 2009, 23, 3227–3242. [Google Scholar] [CrossRef]
- He, Z.; Zhao, L.; Liu, X.; Xu, Y. The application of in-source fragmentation in ultra-high performance liquid chromatography-electrospray ionization -tandem mass spectrometry for pesticide residue analysis. J. Chromatogr. A 2020, 1633, 461637. [Google Scholar] [CrossRef]
- He, Z.; Xu, Y.; Zhang, Y.; Liu, B.; Liu, X. On the use of in-source fragmentation in ultrahigh-performance liquid chromatography–electrospray ionization–high-resolution mass spectrometry for pesticide residue analysis. J. Agric. Food Chem. 2019, 67, 10800–10812. [Google Scholar] [CrossRef] [PubMed]
- Xu, Y.; Lu, W.; Rabinowitz, J.D. Avoiding misannotation of in-source fragmentation products as cellular metabolites in liquid chromatography–mass spectrometry-based metabolomics. Anal. Chem. 2015, 87, 2273–2281. [Google Scholar] [CrossRef] [PubMed]
- Muehlwald, S.; Buchner, N.; Kroh, L.W. Investigating the causes of low detectability of pesticides in fruits and vegetables analysed by high-performance liquid chromatography—Time-of-flight. J. Chromatogr. A 2018, 1542, 37–49. [Google Scholar] [CrossRef] [PubMed]

| Samples | Species | Batches | Amount/Batch (g) | Geographical Origin |
|---|---|---|---|---|
| BJ | C. morifolium | 10 | 200–500 | Anhui (Bozhou) * |
| CJ | C. morifolium | 9 | 50–300 | Anhui (Chuzhou) * |
| GJ | C. morifolium | 12 | 80–500 | Anhui * |
| HaJ | C. morifolium | 13 | 40–1000 | Zhejiang (Hangzhou) *, Hebei, Fujian, Guangxi |
| HuJ | C. morifolium | 12 | 40–500 | Henan * |
| JSHJ | C. morifolium | 12 | 40–500 | Jiangxi *, Hunan, Fujian, Anhui |
| YJ | C. indicum | 12 | 100–500 | Hunan, Anhui, Guizhou, Guangxi, Henan, Sichuan, Shaanxi |
| Features | VIP Value | RT (min) | Formula | Adduct | Experimental m/z | Error (ppm) | MS/MS Fragment | Identification |
|---|---|---|---|---|---|---|---|---|
| M1 | 3.14 | 37.028 | C14H14O2 | [M+H]+ | 215.10686 | 0.950 | 197.09605, 171.08034, 169.06474, 153.06985, 126.06200, 115.05412, 107.04900, 91.05415, 77.03855 | Not identified |
| M2 | 2.36 | 8.911 | C11H16O3 | [M+H]+ | 197.11722 | −0.001 | 179.10651, 161.09559, 135.11668, 133.10103, 107.08538, 105.06976, 95.04897, 91.05408, 81.06990, 67.05418 | Loliolide |
| M3 | 2.15 | 42.581 | C28H42N4O5 | [M+H]+ | 515.32123 | −3.038 | 453.16962, 317.17847, 261.22092, 184.07304, 135.11687, 121.10077, 107.08530, 81.06983, 67.05418 | Not identified |
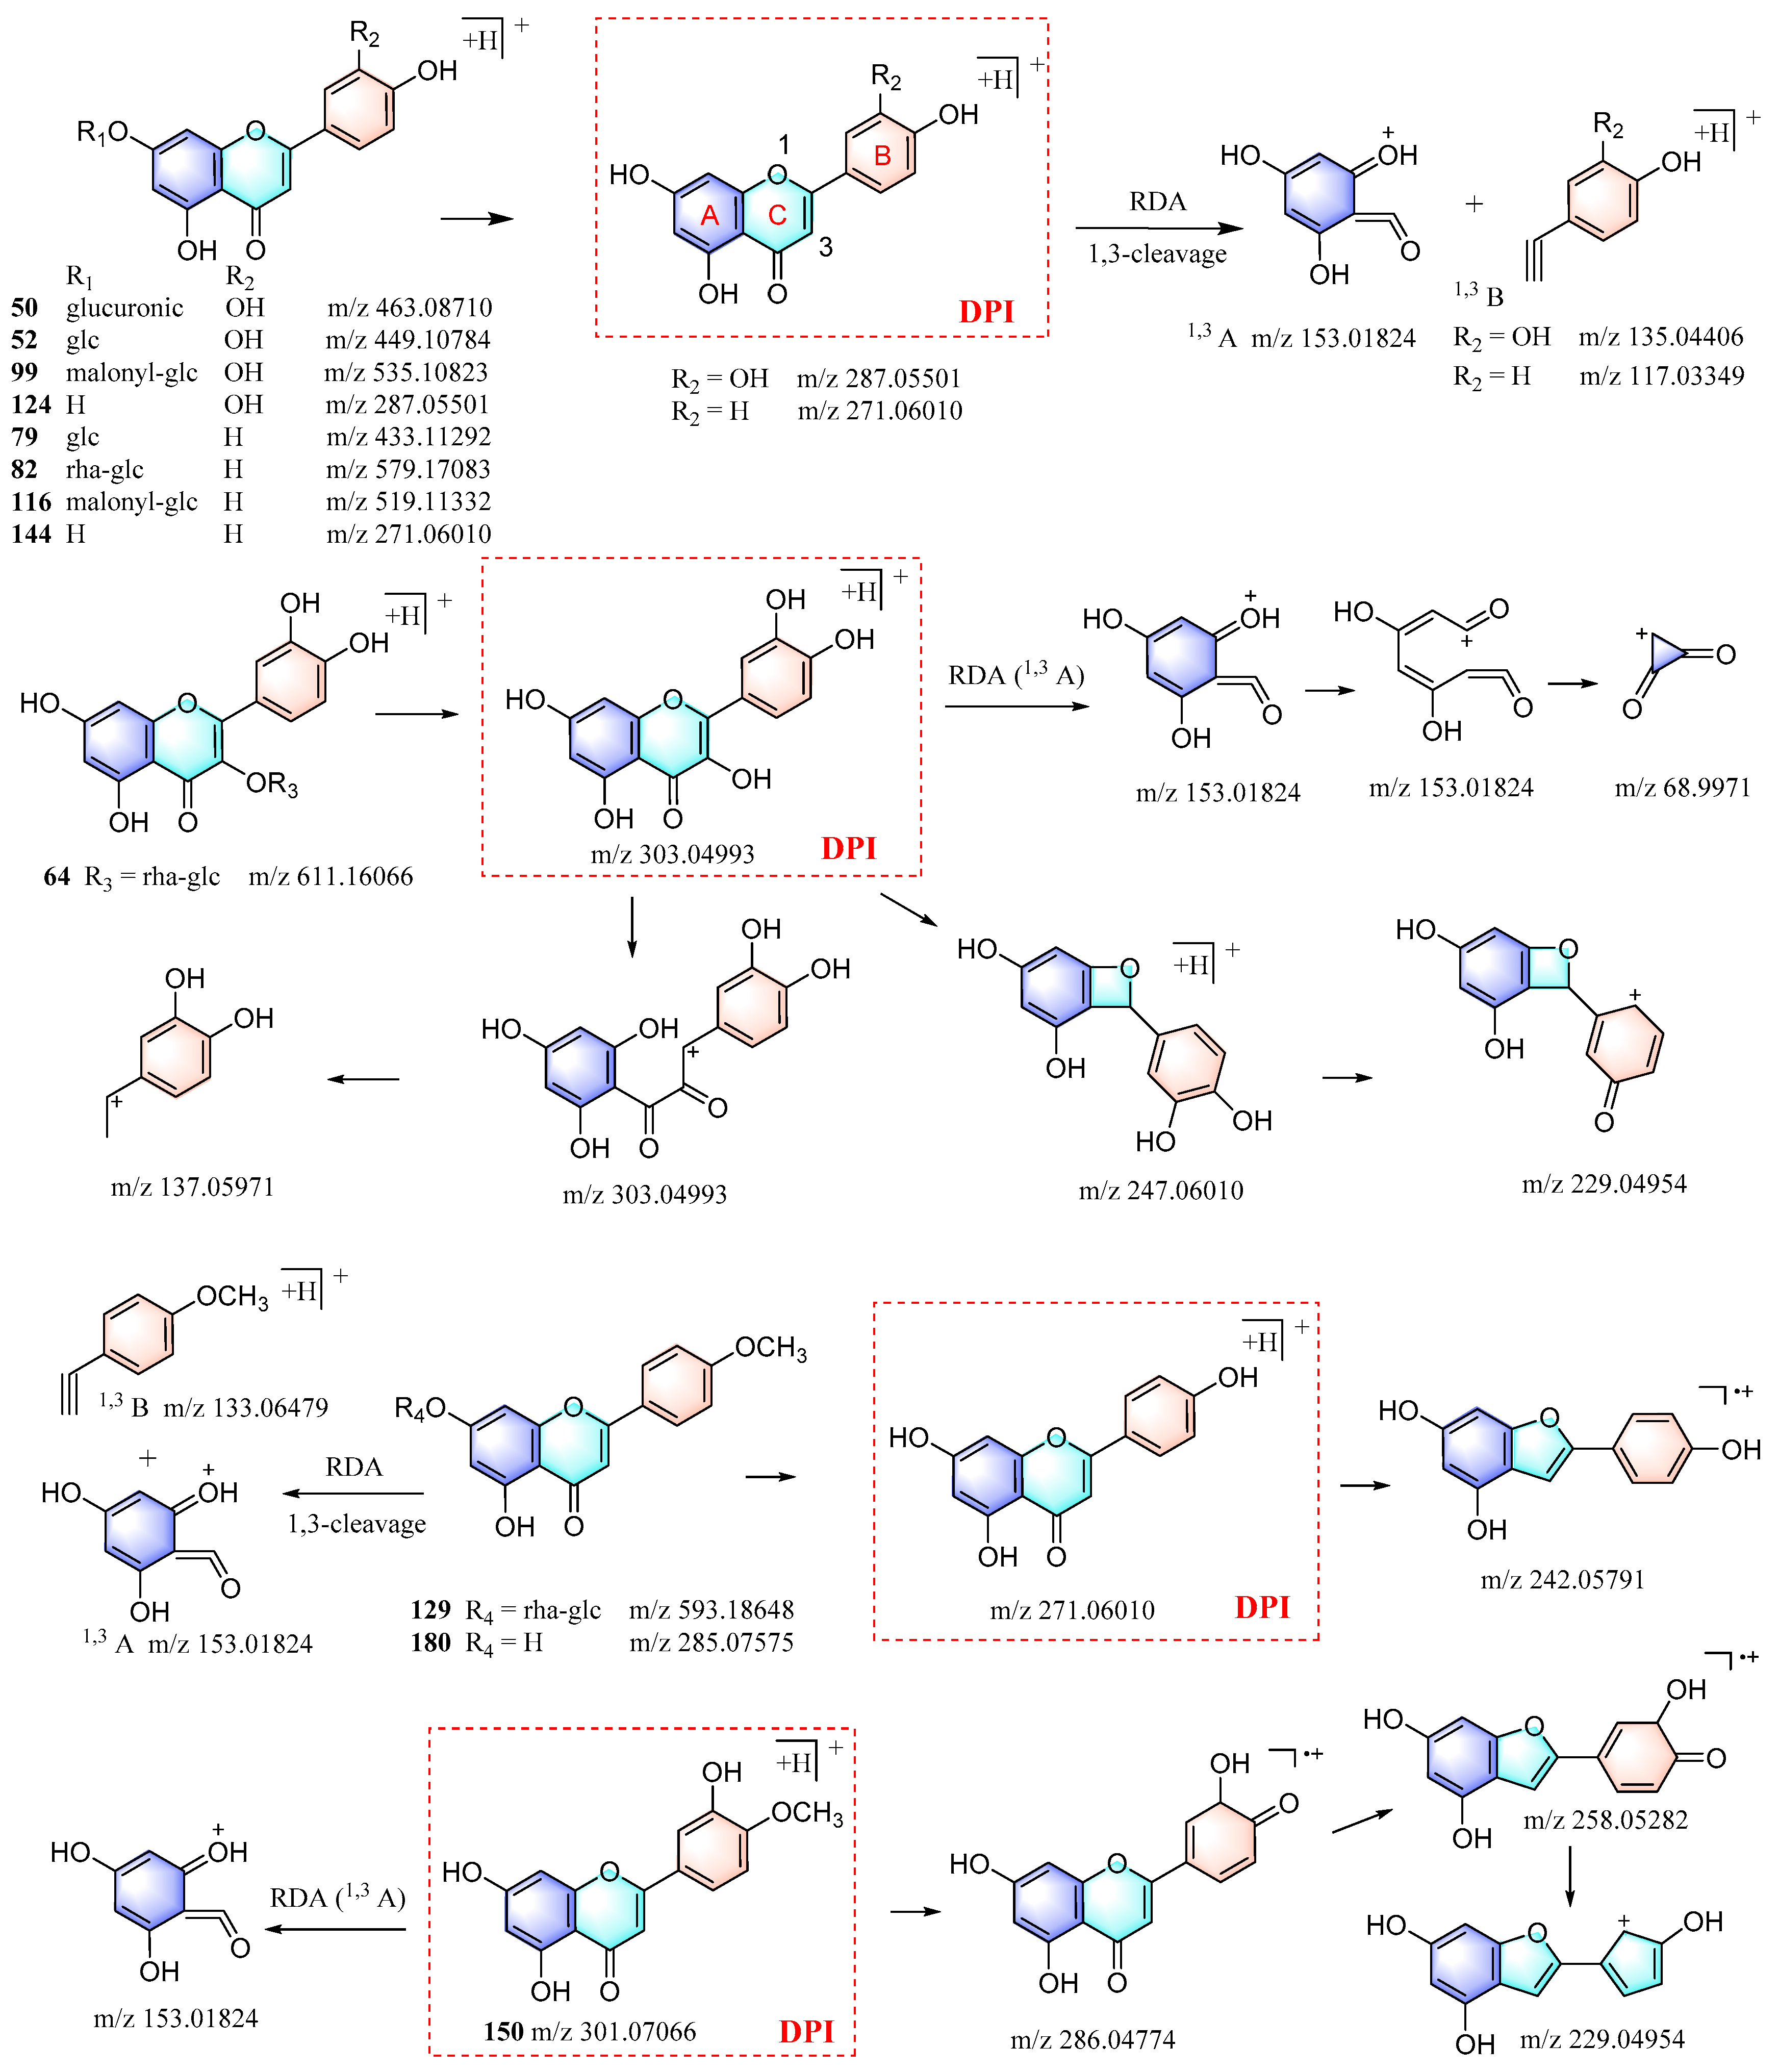
| M4 | 2.07 | 13.201 | C21H18O12 | [M+H]+ | 463.08682 | −0.608 | 287.05487, 269.04379, 241.04924, 229.03900, 213.05444, 203.03415, 179.03360, 171.02832, 161.02264, 153.01826, 137.02319, 135.04413, 117.03323, 115.05326, 89.03847 | Luteolin-7-O-β-D-glucuronide |
| M5 | 2.57 | 47.401 | C27H50N2O4 | [M+Na]+ | 467.38544 | −1.093 | 256.01831, 229.02219, 142.03166, 90.43191, 64.22938 | Not identified |
| M6 | 2.02 | 32.150 | C46H50N4O8 | [M+H]+ | 787.36951 | −0.799 | 641.33398, 623.32062, 495.29810, 477.28815, 250.25378, 275.17529, 203.11819, 147.04408, 129.13860, 119.04903, 112.11247, 91.05423 | Tetra-trans-p-coumaroylspermine isomer |
| M7 | 2.39 | 20.884 | C24H22O13 | [M+H]+ | 519.11322 | −0.185 | 299.06247, 271.06012, 229.02782, 153.01810, 119.04888, 91.05378, 68.99718, 67.01790 | Apigenin-7-O-malonylglucoside isomer |
| M8 | 7.22 | 24.417 | C24H22O13 | [M+H]+ | 519.11310 | −0.417 | 271.05997, 243.06416, 229.05414, 171.02888. 163.03972, 153.01813, 145.02803, 119.04910, 91.05403, 68.99709, 67.01784 | Apigenin-7-O-malonylglucoside |
| M9 | 3.09 | 17.164 | C21H20O10 | [M+Na]+ | 455.09405 | −1.796 | 329.05490, 293.04218, 229.03677, 203.08504, 71.06578, 68.14845 | Apigenin-7-O-β-D-glucoside (M10) |
| M10 | 11.34 | 17.197 | C21H20O10 | [M+H]+ | 433.11258 | −0.791 | 271.06003, 243.06487, 229.04843, 203.08511, 171.02910, 163.03928, 153.01814, 145.02826, 119.04900, 91.05417, 68.99722, 67.01775 | Apigenin-7-O-β-D-glucoside |
| M11 | 2.82 | 17.198 | C15H10O5 | [M+H]+ | 271.06009 | −0.035 | 229.01183, 203.08510, 171.02907, 163.03899, 153.01833, 145.02829, 119.04906, 91.05415, 68.99709 | Apigenin-7-O-β-D-glucoside (ISF product of M10) |
| M12 | 4.35 | 19.155 | C22H22O11 | [M+H]+ | 463.12317 | −0.685 | 301.07019, 286.04672, 258.05182, 229.04846, 153.01793, 106.04081, 59.89636 | Diosmetin-7-O-β-D-glucoside isomer |
| M13 | 3.27 | 25.323 | C25H24O14 | [M+H]+ | 549.12366 | −0.402 | 463.12891, 301.07059, 286.04712, 258.05209, 229.04926, 153.01816, 68.99689 | Diosmetin-7-O-(6″-malonylglucoside) isomer |
| M14 | 2.82 | 15.098 | C9H6O3 | [M+H]+ | 163.03903 | 0.367 | 149.06023, 145.03960, 117.03344, 107.04896, 95.04910, 89.03857, 79.05422 | 1,5-O-Dicaffeoyl quinic acid (ISF product of M15) |
| M15 | 2.32 | 15.099 | C25H24O12 | [M+H]+ | 517.13367 | −0.738 | 337.09283, 319.08026, 229.03595, 163.03897, 145.02834, 135.04405, 117.03335, 107.04913, 95.04906, 89.03851 | 1,5-O-Dicaffeoyl quinic acid |
| M16 | 2.01 | 15.100 | C16H18O9 | [M+H]+ | 355.10239 | 0.091 | 229.03082, 203.08519, 163.03896, 145.02837, 117.03336, 89.03949 | 1,5-O-Dicaffeoyl quinic acid (ISF product of M15) |
| M17 | 4.28 | 22.809 | C15H24O3 | [M+Na]+ | 275.16187 | 0.381 | 229.01579, 175.07280, 165.59151, 73.07964, 60.67187, 57.18082 | Indicumenone |
| M18 | 3.50 | 36.799 | C15H26O2 | [M+Na]+ | 261.18246 | −0.156 | 229.02008, 141.96776, 118.73338, 93.66092, 83.32710 | Drimendiol |
| M19 | 2.48 | 28.268 | C15H24O3 | [M+Na]+ | 275.16180 | 0.126 | 229.04546, 203.08495, 194.26845, 160.05701, 114.43626, 103.98212, 70.73609, 65.73772 | Ilicic acid |
| M20 | 2.56 | 35.532 | C15H24O2 | [M-H2O+H]+ | 219.17448 | −1.869 | 201.16397, 173.13269, 163.11157, 145.10121, 135.08055, 119.08559, 107.08549, 95.08551, 93.06987, 81.06995, 67.05430 | α-Cyperone |
| M21 | 2.03 | 19.411 | C19H26O7 | [M+Na]+ | 389.15700 | −0.189 | 367.98987, 302.21576, 247.13544, 229.01994, 203.08496, 173.09686, 145.10120, 131.08569, 91.05424 | Not identified |
| M22 | 4.01 | 32.815 | C19H26O6 | [M+Na]+ | 373.16 | 2.066 | 313.14053, 271.13022, 253.11945, 231.13818, 157.10114, 142.07777, 129.07016, 105.07031, 83.01060 | 1,6-O,O-Diacetylbritannilactone |
| M23 | 3.62 | 29.930 | C15H10O5 | [M+H]+ | 271.05945 | −2.396 | 243.006442, 229.04283, 225.05389, 171.02852, 153.01788, 145.02776, 121.02822, 119.04874, 91.05399, 68.99594, 67.01771 | Apigenin |
| M24 | 2.22 | 30.496 | C16H12O6 | [M+H]+ | 301.07037 | −0.977 | 286.04688, 258.05194, 229.04887, 153.01804, 106.04115, 58.59438, 54.55778 | Diosmetin |
| M25 | 4.30 | 34.924 | C16H12O5 | [M+H]+ | 285.07574 | −0.033 | 270.05237, 242.05739, 153.01828, 133.06473, 124.01496, 118.04072, 90.04630, 68.99710, 67.01776 | Acacetin |
Disclaimer/Publisher’s Note: The statements, opinions and data contained in all publications are solely those of the individual author(s) and contributor(s) and not of MDPI and/or the editor(s). MDPI and/or the editor(s) disclaim responsibility for any injury to people or property resulting from any ideas, methods, instructions or products referred to in the content. |
© 2024 by the authors. Licensee MDPI, Basel, Switzerland. This article is an open access article distributed under the terms and conditions of the Creative Commons Attribution (CC BY) license (https://creativecommons.org/licenses/by/4.0/).
Share and Cite
Yuan, H.; Xie, Q.; Liang, L.; Luo, J.; Jiang, S.; Peng, C.; Wang, W. An Efficient Workflow for Quality Control Marker Screening and Metabolite Discovery in Dietary Herbs by LC-Orbitrap-MS/MS and Chemometric Methods: A Case Study of Chrysanthemum Flowers. Foods 2024, 13, 1008. https://doi.org/10.3390/foods13071008
Yuan H, Xie Q, Liang L, Luo J, Jiang S, Peng C, Wang W. An Efficient Workflow for Quality Control Marker Screening and Metabolite Discovery in Dietary Herbs by LC-Orbitrap-MS/MS and Chemometric Methods: A Case Study of Chrysanthemum Flowers. Foods. 2024; 13(7):1008. https://doi.org/10.3390/foods13071008
Chicago/Turabian StyleYuan, Hanwen, Qingling Xie, Ling Liang, Jiangyi Luo, Sai Jiang, Caiyun Peng, and Wei Wang. 2024. "An Efficient Workflow for Quality Control Marker Screening and Metabolite Discovery in Dietary Herbs by LC-Orbitrap-MS/MS and Chemometric Methods: A Case Study of Chrysanthemum Flowers" Foods 13, no. 7: 1008. https://doi.org/10.3390/foods13071008