3.1. Effect of Pressure, Temperature (T), Treatment Time (t), and Storage (S) on Rheological Properties of Heat-Induced CF Gel
The four-way mixed-model ANOVA showed significant (
p < 0.05) pressure and treatment
T main effects for all the rheological properties derived from mechanical spectra (
Table 1). Treatment
t and storage
S were not significant for
n” and
n’ values (regression coefficient relating
G” or
G’ and
f), respectively. Even so, pressure had a more significant effect on rheological parameters (higher
F values), followed by
T, treatment
t, and
S (in that order). In addition, pressure,
T, treatment
t, and
S had a more significant effect on the loss modulus (
G”) values (higher
F values).
Table 1.
Four-way analysis of variance of the rheological properties of heat-induced chickpea flour gel at 75 °C for 15 min derived from mechanical spectra after cooling to 25 °C (high hydrostatic pressure treatments: 200, 400, and 600 MPa; 10, 25, and 50 °C; 5, 15, and 25 min, in samples without and with storage, and unpressurized slurry). F and p values.
| Parameter | Pressure
(df = 2) | Temperature (T)
(df = 2) | Time (t)
(df = 2) | Storage (S)
(df = 1) | Pressure × T
(df = 4) | Pressure × t
(df = 4) | Pressure × S
(df = 2) | T × t
(df = 4) |
|---|
| F value | p value | F value | p value | F value | p value | F value | p value | F value | p value | F value | p value | F value | p value | F value | p value |
|---|
| G’(Pa) | 3765.9 | 0.000 | 1144.7 | 0.000 | 616.0 | 0.000 | 9.8 | 0.002 | 365.5 | 0.000 | 29.8 | 0.000 | 1743.6 | 0.000 | 544.3 | 0.000 |
| G” (Pa) | 8883.9 | 0.000 | 2083.6 | 0.000 | 1308.3 | 0.000 | 63.8 | 0.000 | 430.5 | 0.000 | 29.4 | 0.000 | 3678.7 | 0.000 | 1282.7 | 0.000 |
| tan δ (-) | 566.5 | 0.000 | 255.6 | 0.000 | 61.4 | 0.000 | 6.4 | 0.013 | 148.9 | 0.000 | 18.3 | 0.000 | 13.2 | 0.000 | 6.6 | 0.000 |
| n’(-) | 75.4 | 0.000 | 20.7 | 0.000 | 5.8 | 0.004 | 1.9 | 0.173 | 35.0 | 0.000 | 1.0 | 0.428 | 0.15 | 0.861 | 1.2 | 0.320 |
| n” (-) | 21.0 | 0.000 | 14.7 | 0.000 | 2.8 | 0.064 | 4.1 | 0.045 | 64.6 | 0.000 | 14.0 | 0.000 | 5.0 | 0.009 | 2.3 | 0.060 |
| G'0 − G”0 (Pa sn) | 2830.3 | 0.000 | 871.3 | 0.000 | 461.1 | 0.000 | 11.9 | 0.001 | 285.7 | 0.000 | 24.4 | 0.000 | 1306.8 | 0.000 | 404.5 | 0.000 |
| Parameter | T × S
(df = 2) | t × S
(df = 2) | Pressure × T × t
(df = 8) | Pressure × T × S
(df = 4) | Pressure × t × S
(df = 4) | T × t × S
(df = 4) | Pressure × T × t × S
(df = 8) |
| F value | p value | F value | p value | F value | p value | F value | pvalue | Fvalue | p value | F value | p value | F value | p value |
| G’(Pa) | 21.7 | 0.000 | 134.8 | 0.000 | 232.5 | 0.000 | 136.0 | 0.000 | 198.0 | 0.000 | 510.3 | 0.000 | 169.9 | 0.000 |
| G” (Pa) | 38.9 | 0.000 | 303.0 | 0.000 | 401.9 | 0.000 | 400.5 | 0.000 | 479.4 | 0.000 | 1182.9 | 0.000 | 444.5 | 0.000 |
| tan δ (-) | 22.9 | 0.000 | 44.1 | 0.054 | 6.4 | 0.000 | 10.4 | 0.000 | 12.3 | 0.000 | 35.8 | 0.000 | 5.5 | 0.000 |
| n’(-) | 0.0 | 0.961 | 1.9 | 0.152 | 1.6 | 0.138 | 0.8 | 0.552 | 1.2 | 0.320 | 0.3 | 0.874 | 0.7 | 0.682 |
| n” (-) | 14.8 | 0.000 | 23.4 | 0.000 | 1.7 | 0.119 | 14.8 | 0.000 | 12.5 | 0.000 | 8.1 | 0.000 | 5.7 | 0.000 |
| G’0 − G”0 (Pa sn) | 15.0 | 0.000 | 99.9 | 0.000 | 177.4 | 0.000 | 100.1 | 0.000 | 145.2 | 0.000 | 377.1 | 0.000 | 124.2 | 0.000 |
On the other hand, pressure ×
T interaction was significant for all rheological parameters, whereas the effects of binary pressure ×
t, pressure ×
S, and
T ×
S interactions were not significant for slope of storage modulus (
n’). In turn,
T ×
t interaction was not significant for the slopes of the two moduli (
n’ and
n”), whereas
t ×
S interaction was not significant for
n’ and loss tangent (tan
δ). Triple pressure ×
T ×
t interaction only was not significant for the slopes of both
G’ and
G”. Consequently, the effect of pressure was dependent on both
T and treatment
t, corroborating previous findings [
6,
7,
8]. According to Bauer and Knorr [
6], at constant
T and treatment
t, the degree of gelatinization increased with increasing pressure. Moreover, the higher the
T, the lower the pressure of complete gelatinization was in the
T range investigated (29, 39, 48, and 57 °C), and at constant
T and pressure the degree of gelatinization of potato, wheat, and tapioca starch suspensions increased with increasing treatment
t between 5 and 60 min. Stolt
et al. [
8] also showed that in barley starch suspensions rheological properties, microstructure, and loss of birefringence, as well as melting of amylopectin crystals as determined by DSC, were all both pressure- and
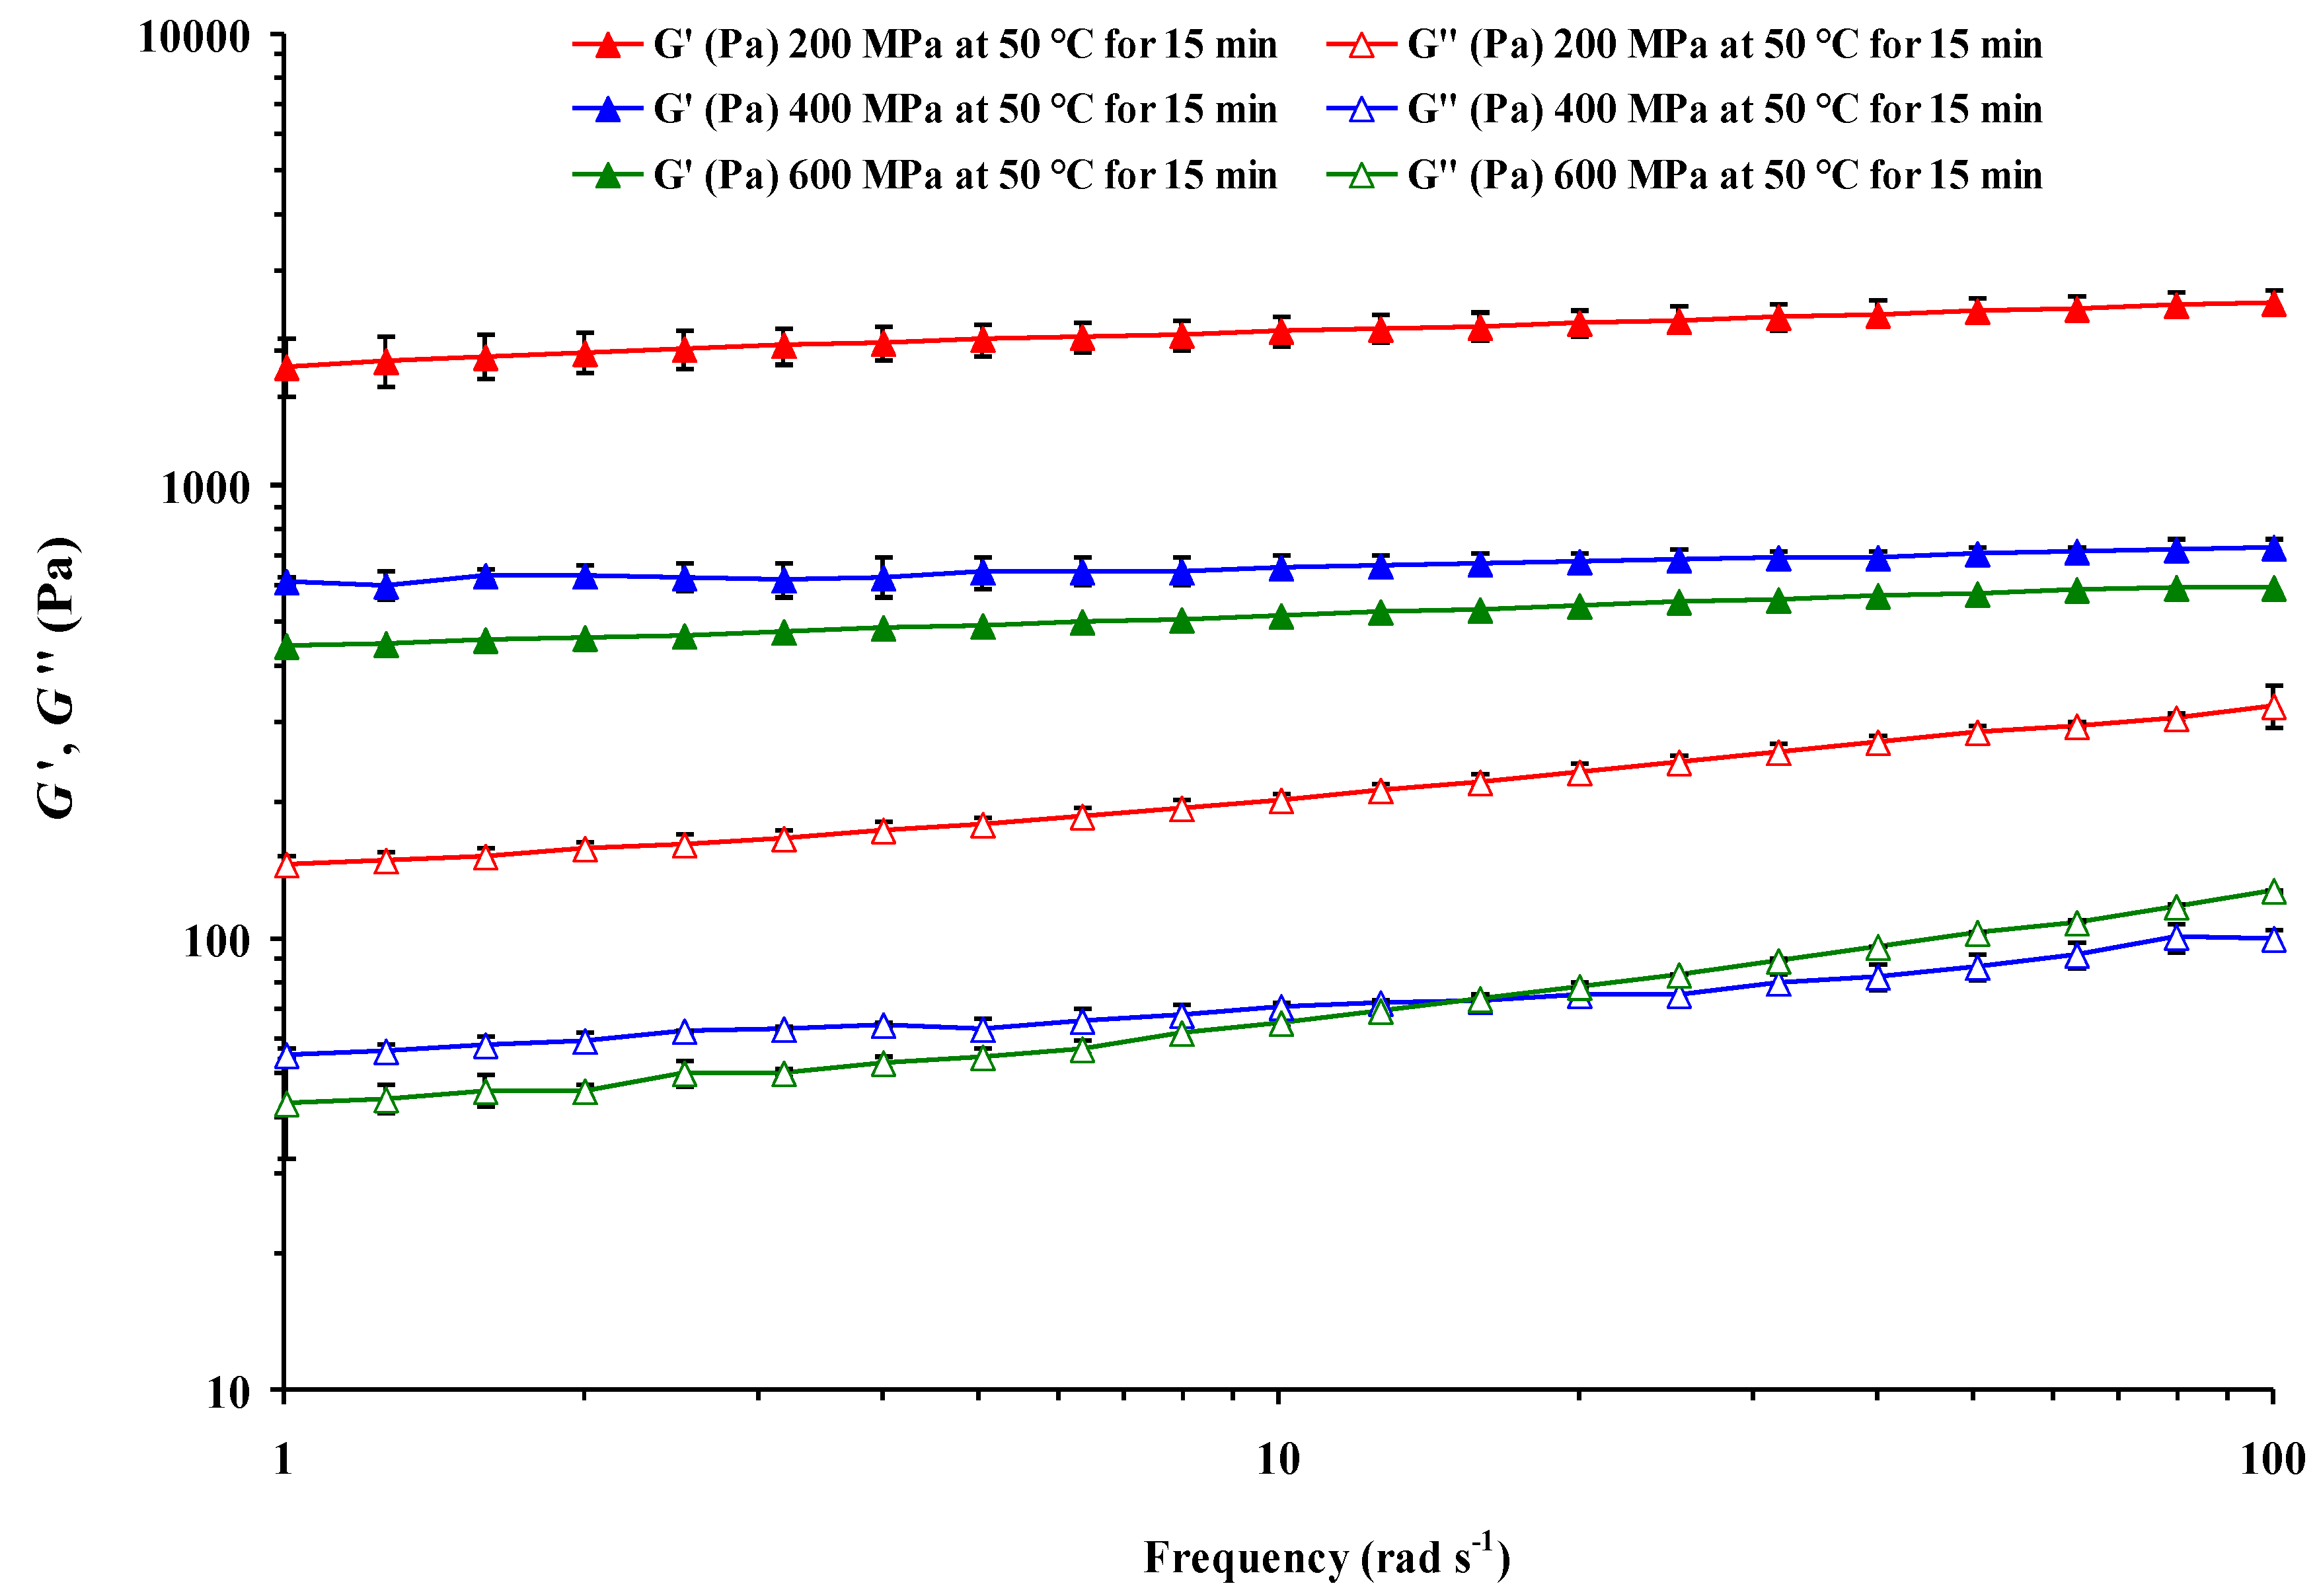
t-dependent. In this study, at a constant 50 °C for 15 min, CF gel rigidity decreased with increasing pressure (
Figure 2). This result would also indicate that CF slurry at the highest pressure (600 MPa) had a higher degree of gelatinization during pressurization. The viscoelasticity of thermally-induced CF paste increased as a function of slurry concentration and decreased with increasing pressure applied in proportion to the extent of HHP-induced gelatinization of starch [
5]. The authors just cited also found that the gelatinization enthalpies of the HHP-treated CF slurries reflected progressive gelatinization as the pressure level increased,
i.e., the enthalpy decreased with increasing pressure applied. However, no starch gelatinization peak was detected during thermal scanning of lentil slurries (untreated or treated) irrespective of moisture content or heating rate [
12]. The presence of a significant amount of proteins with sharp endothermic peak could hinder the traceability of a relatively small gelatinization lentil starch peak.
Figure 2.
Effect of pressure on mechanical spectra of heat-induced chickpea flour gel pressurized (15 min at 50 °C) at 25 °C. Mean values of six measurements ± error bars.
Figure 2.
Effect of pressure on mechanical spectra of heat-induced chickpea flour gel pressurized (15 min at 50 °C) at 25 °C. Mean values of six measurements ± error bars.
Frequency sweep tests of HHP-treated (
Figure 2) and unpressurized samples were carried out in the LVE range after
T equilibration to 25 °C, which enables the material to retain the structure. The LVE domain was previously established by an oscillatory stress sweep experiment for each sample, as shown previously [
5]. For all HHP treatments,
G’ values were greater than the
G” values, showing a weak-gel behavior with
G’ >
G”, suggesting that elastic properties were dominant over viscous properties (
Figure 2). Such behavior has been reported earlier for starch gels thermally induced from basmati rice [
11] and HHP-induced CF gels [
5].
Both paste and gel may be considered as composite materials, with swollen starch granules filling the polymer solution or polymer gel network, and, if the starch concentration is high enough, the paste can convert into a gel during cooling [
2,
24]. The viscosity of the paste is the result of the swelling and disintegration of the granules, and the gel formation is the result of the reassociation of the starch macromolecules, especially the amylose, solubilized in the gelatinization process.
In turn, triple pressure ×
T ×
S, pressure ×
t ×
S,
T ×
t ×
S interactions, and quadruple interaction pressure ×
T ×
t ×
S only were not significant for
n’ (
Table 1). Therefore, the effect of storage was also dependent on pressure and both
T and treatment
t. Once more, all the double, triple, and quadruple interactions had a more significant effect on the
G” values of the heat-induced CF gels after pressurization. As an example, frequency sweeps of
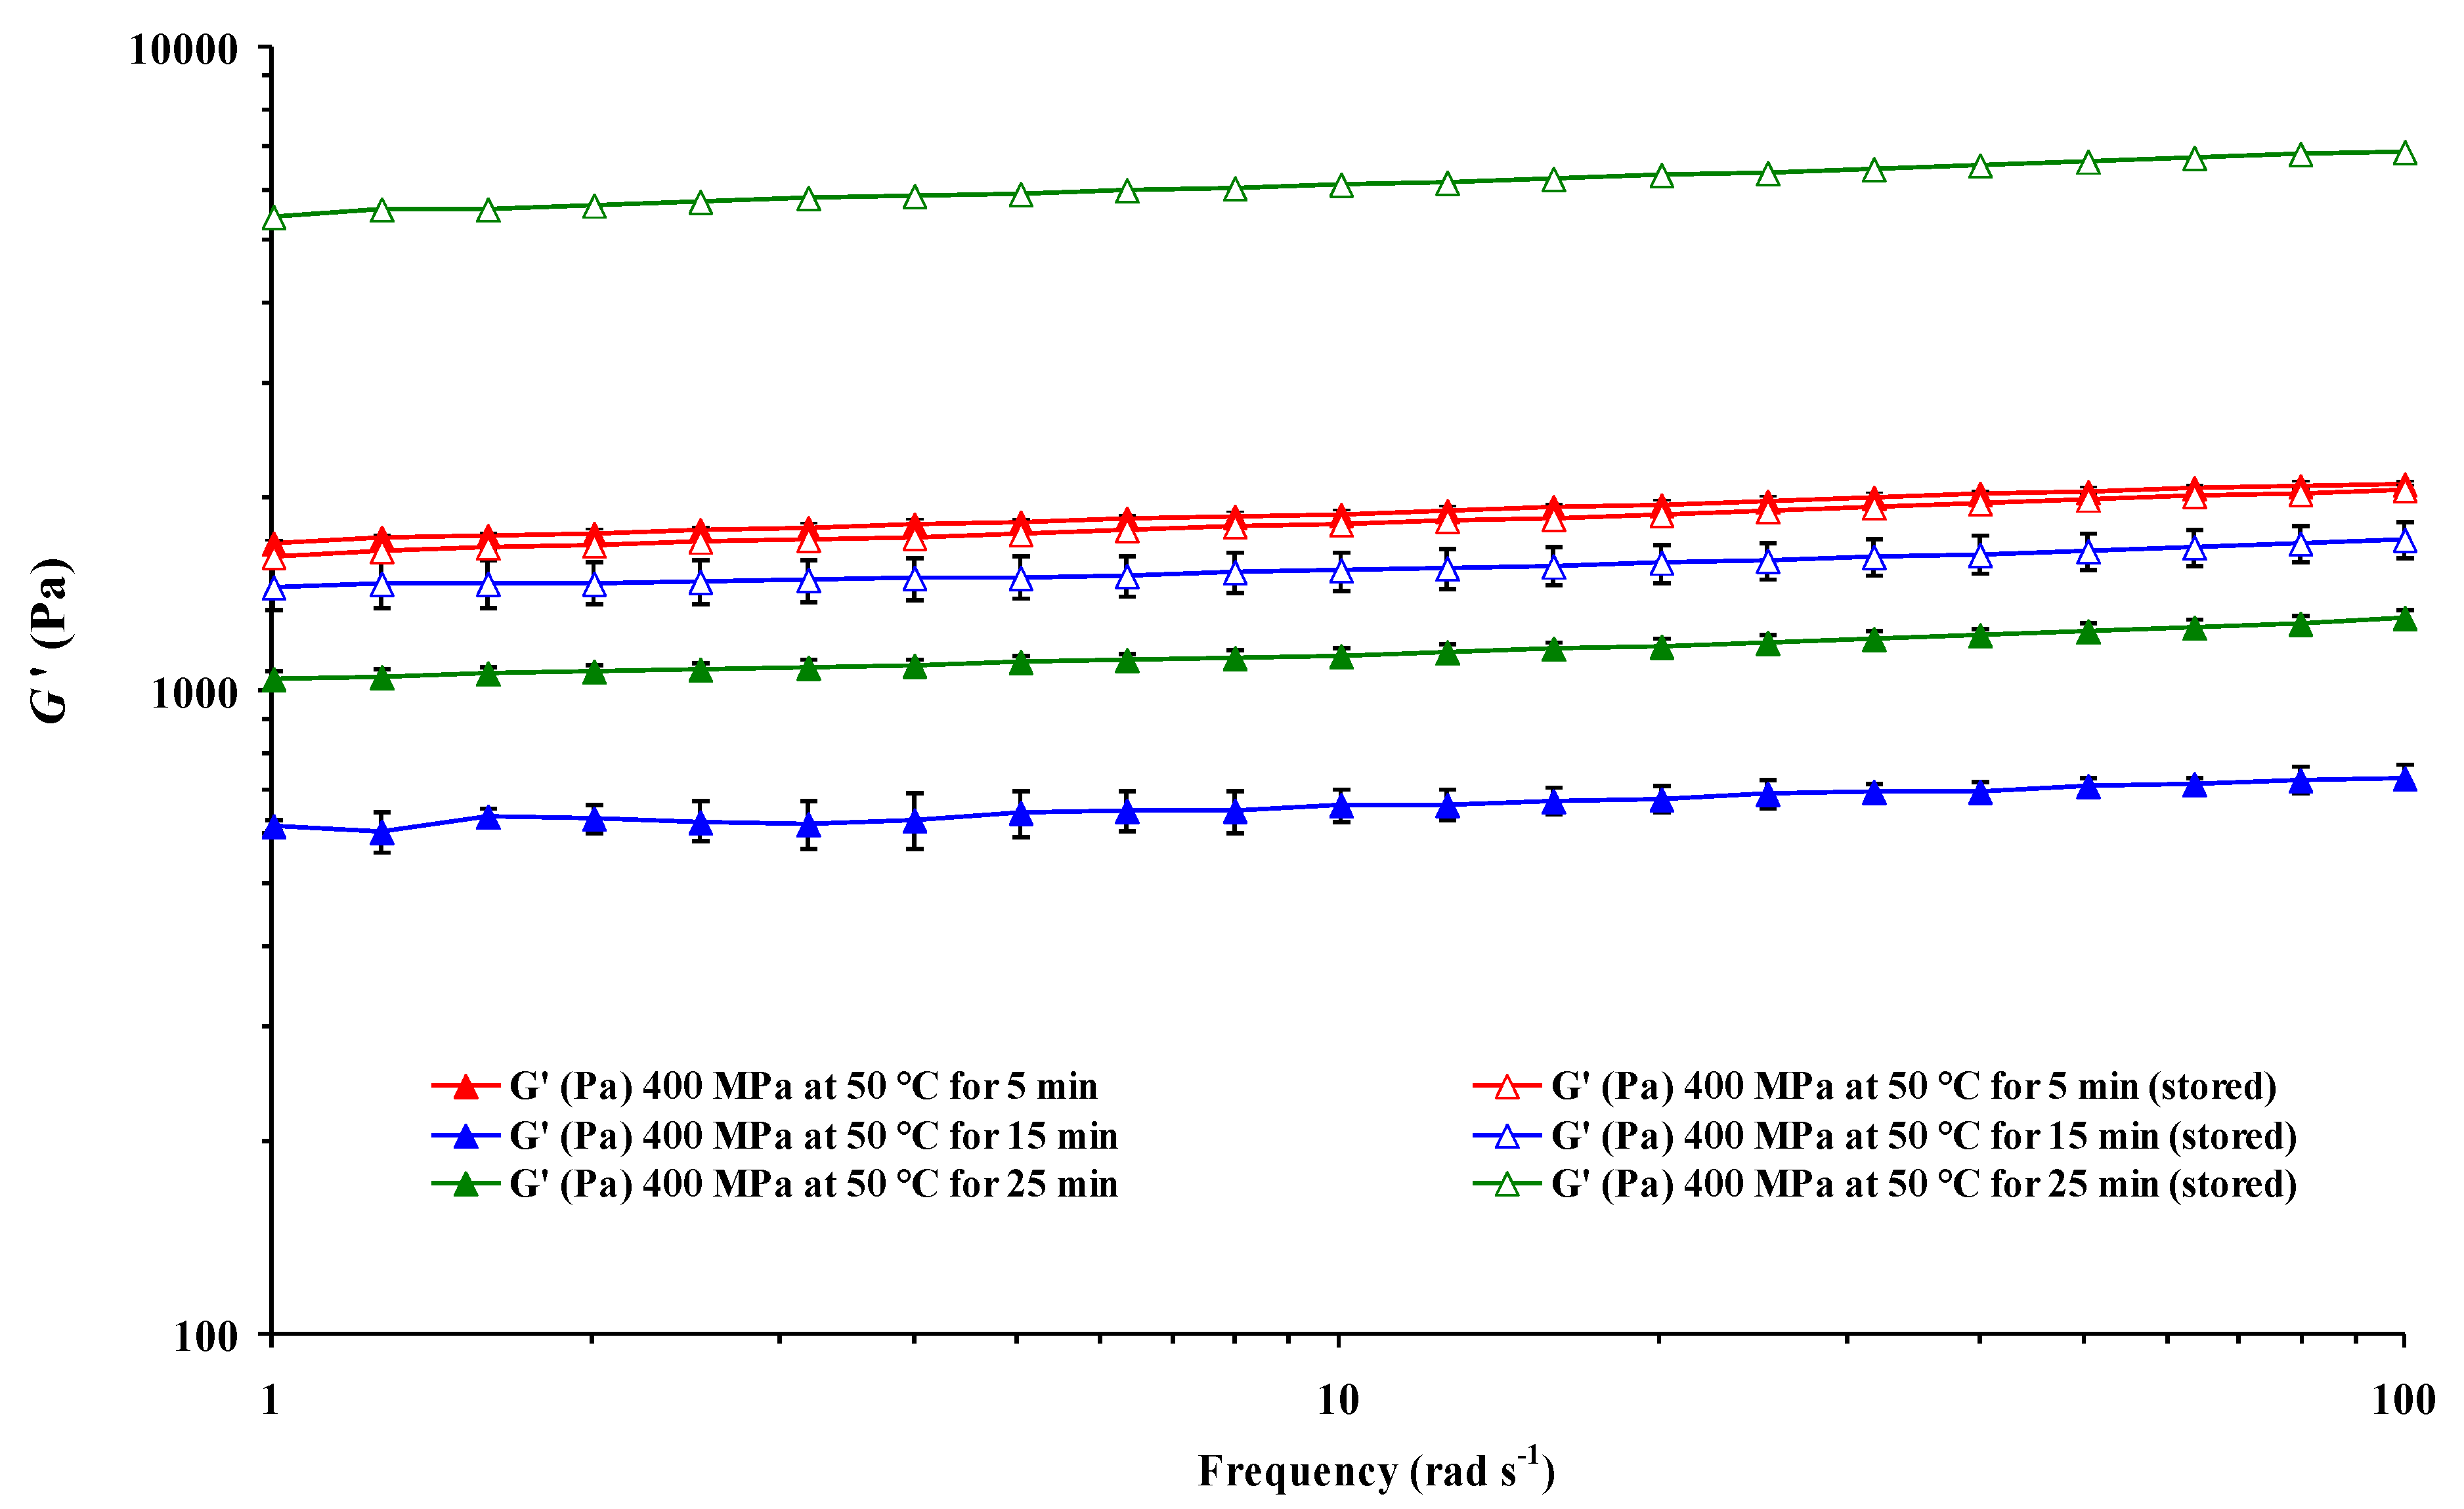
G’ for CF slurries HHP-treated at 400 MPa and 50 °C for 5, 15, and 25 min are shown in
Figure 3, where it is possible to see that the effect of
S on the
G’ values at constant pressure and
T was dependent on treatment
t.
Figure 3.
Effect of treatment time and storage on frequency sweeps of elastic modulus (G’) of heat-induced chickpea flour gel pressurized (400 MPa at 50 °C) at 25 °C. Mean values of six measurements ± error bars.
Figure 3.
Effect of treatment time and storage on frequency sweeps of elastic modulus (G’) of heat-induced chickpea flour gel pressurized (400 MPa at 50 °C) at 25 °C. Mean values of six measurements ± error bars.
At 50 °C for 15 and 25 min, G’ increased after storage, but decreased after pre-treatment for 5 min. It is possible, therefore, that there was physical aging of starch in HHP-treated slurry samples during storage. An increased rapid retrogradation of leached amylose (as indicated by a higher increase in G’ values on cooling) due to disintegration might explain the significant increase in G’ upon cooling for CF slurries pre-treated at 400 MPa and 50 °C for 15 and 25 min.
Table 2 and
Table 3 show mean values of rheological and power law parameters, respectively, for the CF gels HHP-treated at the various combinations of the four factors studied. Values for unpressurized sample are given as a reference, but they were not included for statistical analyses. As can be seen, for the unpressurized sample only the effect of storage was considered for statistical analysis. The
G’ and
G” values for the untreated case without
S or refrigeration were 3499.0 ± 137.2 and 334.3 ± 5.1 Pa, respectively (
Table 2), whereas for refrigerated samples the magnitudes of
G’ and
G” were significantly lower, showing that for only
T-induced gelatinization of CF slurry without previous pressurization both elasticity and viscosity decreased with storage. According to Oey
et al. [
25], the increase in elasticity of the samples treated at the lowest pressure could be attributed to an increase in the linearity of the cell walls and volumes of particles owing to the permeability of the cell walls. In normal rice starch the degree of swelling did not change until the treatment pressure was greater than 300 MPa, and then increased rapidly as the treatment pressure increased up to 500 MPa [
26]. The maximum degree of swelling was approximately 50%. Waxy rice starch showed a minor increase in the degree of swelling at treatment pressures below 300 MPa. The degree of swelling then increased very sharply between 300 and 400 MPa and reached 100% at 400 MPa.
Table 2.
Mean values of rheological properties (G’, G”, and tan δ at 1 Hz) of chickpea flour gel heat-induced at 75 °C for 15 min derived from mechanical spectra after cooling to 25 °C in samples without and with storage for the different pressures (200, 400, and 600 MPa) and treatment temperatures (10 and 25 °C) applied for 5, 15, and 25 min, and for untreated samples.
| HHP (MPa) | Storage (S) | 10 °C |
|---|
| 5 min | 15 min | 25 min |
|---|
| G’ (Pa) | G” (Pa) | tan δ (-) | G’ (Pa) | G” (Pa) | tan δ (-) | G’ (Pa) | G” (Pa) | tan δ (-) |
|---|
| 200 | Not stored | 1853.3Cb2 | 177.8Ca2 | 0.10Aa1 | 3217.3Ba1* | 281.2Ba1* | 0.09A,Ba1 | 3770.7Aa1* | 315.6Aa1* | 0.08Ba1 |
| (68.5) | (3.4) | (0.00) | (141.6) | (4.6) | (0.00) | (137.6) | (3.2) | (0.00) |
| Stored | 2122.3Bb1* | 200.9Ba1* | 0.09Aa2 | 2654.7Ab1 | 239.5Ab1 | 0.09Aa1 | 1700.7Cb2 | 152.1Cb3 | 0.09Aa1 |
| (70.1) | (2.4) | (0.00) | (59.0) | (0.4) | (0.00) | (54.2) | (1.8) | (0.00) |
| 400 | Not stored | 2551.3Ba1 | 167.8Bb1 | 0.07Ab2 | 3184.7Aa1 | 195.0Ab1 | 0.06Bc2 | 1611.7Cb1 | 99.1Cc2 | 0.06Bb2 |
| (124.9) | (2.9) | (0.00) | (149.6) | (3.4) | (0.00) | (58.2) | (5.2) | (0.00) |
| Stored | 3176.0Ca1* | 203.5Ca1* | 0.06Ac2 | 5472.0Aa1* | 355.7Aa1* | 0.07Ac2 | 3588.7Ba2* | 239.3Ba2* | 0.07Ac1 |
| (89.3) | (0.3) | (0.00) | (118.4) | (6.0) | (0.00) | (78.1) | (1.7) | (0.00) |
| 600 | Not stored | 720.6Cc2 | 64.1Cc2 | 0.09Ab2* | 1491.0Ab1 | 124.1Ac1 | 0.08Bb2 | 1335.7Bc1 | 110.2Bb2 | 0.08Ba2 |
| (20.1) | (3.3) | (0.00) | (44.7) | (5.2) | (0.00) | (29.0) | (4.9) | (0.00) |
| Stored | 1526.3Ac1* | 120.7Ab1* | 0.08Ab3 | 1452.3Bc1 | 111.5Bc1 | 0.08Bb2 | 1403.7Bc1 | 113.1A,Bc2 | 0.08Bb2 |
| (33.0) | (2.9) | (0.00) | (21.7) | (4.5) | (0.00) | (28.7) | (3.2) | (0.00) |
| HHP (MPa) | Storage (S) | 25 °C |
| 5 min | 15 min | 25 min |
| G’ (Pa) | G” (Pa) | tan δ (-) | G’ (Pa) | G” (Pa) | tan δ (-) | G’ (Pa) | G” (Pa) | tan δ (-) |
| 200 | Not stored | 1296.3Ca3 | 127.2Ca3 | 0.10Aa1* | 2052.3Ba2 | 179.0Ba2 | 0.09Bb1 | 2727.3Aa1,2 | 236.3Aa2 | 0.09Ba1 |
| (54.4) | (2.4) | (0.00) | (81.1) | (1.5) | (0.00) | (89.4) | (1.7) | (0.00) |
| Stored | 1704.0Cb2* | 154.1Ca2* | 0.09Ab2 | 2233.7Ba2 | 179.5Ba3 | 0.08Ba2 | 2706.7Aa1 | 229.7Aa2 | 0.08Ba1 |
| (66.1) | (1.8) | (0.00) | (66.7) | (1.1) | (0.00) | (107.4) | (2.5) | (0.00) |
| 400 | Not stored | 673.9Bb3 | 57.0Bb3 | 0.08Bb1* | 556.4Ac2 | 56.4Bc3 | 0.10Aa,b1* | 1723.7Cb1 | 114.9Ab1 | 0.07Cb1 |
| (2.7) | (1.0) | (0.00) | (36.2) | (3.3) | (0.00) | (56.8) | (1.0) | (0.00) |
| Stored | 2374.7Ba2* | 151.6Ba2* | 0.06Ac2 | 1338.7Cb2* | 91.9Cc3* | 0.07Ab1 | 2640.7Aa3* | 168.9Ab3* | 0.06Ab1 |
| (71.7) | (2.6) | (0.00) | (21.1) | (0.1) | (0.00) | (81.7) | (1.3) | (0.00) |
| 600 | Not stored | 549.0Cc3 | 53.4Bb2 | 0.10Aa2 | 854.8Bb2 | 81.4Bb2 | 0.10Aa2 | 1218.0Ac2 | 104.6Ac2 | 0.09Aa2 |
| (10.3) | (3.5) | (0.00) | (24.2) | (5.0) | (0.00) | (43.0) | (4.9) | (0.00) |
| Stored | 842.5Cc2* | 82.5Bb2* | 0.10Aa2 | 1229.3Ac2* | 99.4Ab2* | 0.08Ca2 | 1121.7Bb3 | 99.1Ac3 | 0.09Ba2 |
| (8.3) | (1.8) | (0.00) | (21.7) | (2.0) | (0.00) | (31.8) | (2.7) | (0.00) |
| HHP (MPa) | Storage (S) | 50 °C |
| 5 min | 15 min | 25 min |
| G’ (Pa) | G” (Pa) | tan δ (-) | G’ (Pa) | G” (Pa) | tan δ (-) | G’ (Pa) | G” (Pa) | tan δ (-) |
| 200 | Not stored | 4118.7Aa1* | 357.9Aa1* | 0.09Ab2 | 2133.7Ca2 | 185.6Ca2 | 0.09Ab1 | 2601.0Ba2 | 218.4Ba3 | 0.08Ab1 |
| (207.0) | (7.7) | (0.00) | (137.6) | (6.7) | (0.00) | (92.8) | (3.6) | (0.00) |
| Stored | 1242.3Cb3 | 122.9Cb3 | 0.10Ab1* | 2204.0Ba2 | 187.4Ba2 | 0.08Bb2 | 2774.0Ab1 | 237.2Ab1* | 0.09Bb1 |
| (17.3) | (0.7) | (0.00) | (85.5) | (1.5) | (0.00) | (87.5) | (3.2) | (0.00) |
| 400 | Not stored | 1845.0Ab2* | 134.5Ab2 | 0.07Bc2 | 649.6Cb2 | 65.7Cb2 | 0.10Ab1* | 1114.0Bc2 | 77.0Bc3 | 0.07Bc1 |
| (25.5) | (2.2) | (0.00) | (37.8) | (3.2) | (0.01) | (22.7) | (0.3) | (0.00) |
| Stored | 1771.7Ba3 | 150.0Ba2 | 0.08Ac1* | 1510.3Cb2* | 101.8Cb2* | 0.07Bc1 | 5971.0Aa1* | 429.8Aa1* | 0.07Bc1 |
| (23.3) | (2.0) | (0.00) | (88.1) | (0.4) | (0.00) | (77.0) | (9.6) | (0.00) |
| 600 | Not stored | 853.0Bc1* | 99.6Bc1* | 0.12Aa1 | 470.7Cb3 | 59.7Cb3 | 0.13Aa1 | 1287.7Ab1,2 | 152.7Ab1 | 0.12Aa1 |
| (35.0) | (9.2) | (0.01) | (13.4) | (3.2) | (0.01) | (17.0) | (3.5) | (0.00) |
| Stored | 295.3Bc3 | 44.4Bc3 | 0.15Aa1* | 484.6Cc3 | 54.7Cc3 | 0.11Aa1 | 1256.3Ac2 | 134.5Ac1 | 0.11Aa1 |
| (42.2) | (3.2) | (0.01) | (14.1) | (1.5) | (0.00) | (41.2) | (2.7) | (0.00) |
| 0.1 | Not stored | 3499.0*
(137.2) | 334.3*
(5.1) | 0.10
(0.00) | | | | | | |
| Stored | 1874.3
(58.9) | 187.4
(1.7) | 0.10
(0.00) | | | | | | |
Table 3.
Mean values of power law parameters (n’, n”, and G’0 – G”0 at 1 Hz) from Equations (1) and (2) of chickpea flour gel heat-induced at 75 °C for 15 min derived from mechanical spectra after cooling to 25 °C in samples without and with storage for the different pressures (200, 400, and 600 MPa) and treatment temperatures (10 and 25 °C) applied for 5, 15, and 25 min, and for untreated samples.
| HHP (MPa) | Storage (S) | 10 °C |
|---|
| 5 min | 15 min | 25 min |
|---|
| n’ | n” | G’0 − G”0 (Pa sn) | n’ | n” | G’0 − G”0 (Pa sn) | n’ | n” | G’0 − G”0 (Pa sn) |
|---|
| 200 | Not stored | 0.07Aa1 | 0.18Ab2 | 1667.4Cb2 | 0.06Aa1 | 0.18Ab1 | 2926.1Ba1* | 0.06Aa1 | 0.19Ab1 | 3443.0Aa1* |
| (0.01) | (0.00) | (70.2) | (0.01) | (0.01) | (146.6) | (0.00) | (0.00) | (145.3) |
| Stored | 0.07Aa1 | 0.18Ab2 | 1919.3Bb1* | 0.06Aa1 | 0.17Ba2 | 2408.3Ab1 | 0.06Aa1 | 0.18Aa,b2 | 1545.7Cb1 |
| (0.01) | (0.00) | (77.1) | (0.00) | (0.01) | (64.5) | (0.01) | (0.00) | (57.9) |
| 400 | Not stored | 0.05Ab1 | 0.21Ba1 | 2375.6Ba1 | 0.05Ab1 | 0.21Ba1* | 2980.9Aa1 | 0.05Aa1 | 0.25Aa1* | 1511.3Cb1 |
| (0.01) | (0.01) | (130.9) | (0.01) | (0.01) | (163.2) | (0.01) | (0.01) | (64.1) |
| Stored | 0.05Ab1 | 0.20Aa1 | 2963.7Ca1* | 0.07Ab1 | 0.18Aa1 | 5105.8Aa1* | 0.05Ab1 | 0.19Aa1 | 3341.7Ba2* |
| (0.00) | (0.01) | (97.8) | (0.01) | (0.01) | (140.8) | (0.00) | (0.01) | (89.5) |
| 600 | Not stored | 0.05Ab3 | 0.19Ab2 | 656.0Cc2 | 0.04Ab2 | 0.17Ab1 | 1366.5Ab1 | 0.05Aa2 | 0.18Ab1 | 1221.5Bc1 |
| (0.00) | (0.01) | (18.1) | (0.00) | (0.01) | (43.3) | (0.00) | (0.00) | (28.1) |
| Stored | 0.04Ab2 | 0.17Ab2 | 1400.8Ac1* | 0.04Ab2 | 0.18Aa2 | 1337.3Bc1 | 0.04Ab2 | 0.17Ab2 | 1287.0Bc1 |
| (0.00) | (0.01) | (25.1) | (0.00) | (0.00) | (21.5) | (0.00) | (0.01) | (25.6) |
| HHP (MPa) | Storage (S) | 25 °C |
| 5 min | 15 min | 25 min |
| n’ | n” | G’0 −G”0 (Pa sn) | n’ | n” | G’0 −G”0 (Pa sn) | n’ | n” | G’0 −G”0 (Pa sn) |
| 200 | Not stored | 0.07Aa1 | 0.20Ab1 | 1163.3Ca3 | 0.06Aa1 | 0.19Aa1 | 1872.1Ba2 | 0.06Aa1 | 0.19Ab1 | 2487.0Aa2 |
| (0.00) | (0.00) | (56.5) | (0.01) | (0.01) | (83.6) | (0.01) | (0.00) | (96.9) |
| Stored | 0.06Aa1 | 0.19Aa1 | 1548.4Cb2* | 0.06Aa1 | 0.20Aa1 | 2052.0Ba2 | 0.06Aa1 | 0.19Ab1 | 2469.3Aa2 |
| (0.01) | (0.00) | (69.1) | (0.01) | (0.00) | (73.5) | (0.01) | (0.00) | (113.8) |
| 400 | Not stored | 0.06Ab1 | 0.21Ab1 | 617.2Bb3 | 0.04Ab1 | 0.19Ba2 | 501.0Ac2 | 0.05Aa,b1 | 0.22Aa2* | 1604.4Cb1 |
| (0.00) | (0.00) | (4.1) | (0.01) | (0.00) | (36.6) | (0.01) | (0.00) | (63.0) |
| Stored | 0.05Ab1 | 0.19Ba1 | 2213.6Ba2* | 0.07Aa1 | 0.20A,Ba1 | 1247.1Cb2* | 0.05Ab1 | 0.21Aa1 | 2461.2Aa3* |
| (0.01) | (0.01) | (79.0) | (0.00) | (0.00) | (25.4) | (0.01) | (0.00) | (87.6) |
| 600 | Not stored | 0.06Ab2 | 0.23Aa1* | 498.3Ac3 | 0.05Bb2 | 0.19Aa1 | 773.1Bb2 | 0.04Bb2 | 0.19Ab1* | 1114.1Cc2* |
| (0.00) | (0.01) | (5.71) | (0.00) | (0.02) | (18.5) | (0.00) | (0.01) | (37.0) |
| Stored | 0.05Aa,b1,2 | 0.15Bb2 | 753.9Cc2* | 0.05Aa2 | 0.19Aa2 | 1127.9Ac2* | 0.05Ab2 | 0.16Bc2 | 1020.2Bb3 |
| (0.00) | (0.01) | (7.6) | (0.00) | (0.01) | (13.0) | (0.00) | (0.01) | (30.1) |
| HHP (MPa) | Storage (S) | 50 °C |
| 5 min | 15 min | 25 min |
| n’ | n” | G’0 −G”0 (Pa sn) | n’ | n” | G’0 −G”0 (Pa sn) | n’ | n” | G’0 −G”0 (Pa sn) |
| 200 | Not stored | 0.07Aa1 | 0.16Cb3 | 3732.5Aa1* | 0.07Aa1 | 0.18Aa1 | 1931.8Ca2 | 0.06Ab1 | 0.17Bb2 | 2371.7Ba2 |
| (0.01) | (0.00) | (226.2) | (0.01) | (0.00) | (148.4) | (0.01) | (0.00) | (98.2) |
| Stored | 0.06Aa1 | 0.16Bb3 | 1116.1Cb3 | 0.06Aa1 | 0.17Ab2 | 2014.8Ba2 | 0.06Ab1 | 0.16Bb3 | 2525.4Ab2 |
| (0.00) | (0.00) | (21.5) | (0.00) | (0.00) | (86.0) | (0.01) | (0.00) | (93.8) |
| 400 | Not stored | 0.05Ab1 | 0.19Ba,b2* | 1701.6Ab2* | 0.04Ab1 | 0.12Cb3 | 551.2Cb2 | 0.05Ac1 | 0.21Aa2* | 1037.8Bb2 |
| (0.00) | (0.01) | (20.9) | (0.00) | (0.01) | (29.8) | (0.01) | (0.01) | (21.1) |
| Stored | 0.05Ab1 | 0.16Ab2 | 1620.5Ba3 | 0.07Bb1 | 0.18Ab1* | 1416.6Cb2* | 0.05Ac1 | 0.16Ab2 | 5524.3Aa1* |
| (0.00) | (0.01) | (23.4) | (0.01) | (0.02) | (91.9) | (0.01) | (0.01) | (89.6) |
| 600 | Not stored | 0.08Aa1 | 0.21Aa1,2 | 755.2Bc1* | 0.07Aa1 | 0.19Aa1 | 407.4Cb3 | 0.08Aa1 | 0.20Aa1 | 1124.6Ab2 |
| (0.01) | (0.02) | (37.3) | (0.01) | (0.01) | (7.2) | (0.01) | (0.01) | (26.2) |
| Stored | 0.06Aa1 | 0.22Ba1 | 248.4Bc3 | 0.07Aa1 | 0.23Aa1* | 430.0Cc3 | 0.07Aa1 | 0.21Ba1 | 1110.4Ac2 |
| (0.01) | (0.01) | (40.0) | (0.01) | (0.01) | (13.4) | (0.00) | (0.01) | (41.6) |
| 0.1 | Not stored | 0.07
(0.01) | 0.16
(0.00) | 3149.8*
(147.5) | | | | | | |
| Stored | 0.07
(0.00) | 0.18
(0.01) | 1684.3
(64.0) | | | | | | |
For refrigerated or stored samples the range of variation of both
G’ and
G” was wider, ranging from 295.3 ± 42.2 to 5971.0 ± 77.0 Pa and from 44.4 ± 3.2 to 429.8 ± 9.6 Pa, respectively. The lowest
G’ and
G” values were obtained for stored CF slurries treated with 600 MPa at 50 °C for 5 min, but the highest ones corresponded to the refrigerated CF slurries treated with 400 MPa at 50 °C for 25 min. A previous study also showed that complete gelatinization (100%) was associated with CF slurries at the lowest concentration (1:5) after HHP with 600 MPa at 25 °C for 15 min [
5]. Clearly, other additional structural features seem to be responsible for the altered
G’ and
G” values obtained for the samples pre-treated with 400 and 600 MPa at 50 °C for 25 min. Results would appear to indicate that breakdown of granules and some splitting of macromolecules could be assumed at 400 and 600 MPa and higher
T and
ts. In these cases, retrogradation probably occurred outside the granules, explaining the higher parameter values obtained for the CF slurries HHP-treated at 400 MPa and 50 °C for 25 min. Other publications showed the presence of a residual crystalline order after pressure treatment, referred to as “rapid retrogradation” occurring even during or immediately after pressurization [
4,
10], and the greater the degree of gelatinization induced by the pressure treatment, the greater the extent of “rapid retrogradation”. On the other hand, denaturation of protein component could also affect the rheological properties of these samples.
On the other hand, at constant
T and treatment
t, for non-stored HHP-treated CF slurries both
G’ and
G” values tended to decrease with increasing pressure (
Table 2). At 10 °C for 5 min,
G’ increased between 200 and 400 MPa, but decreased after pre-treatment with 600 MPa. In contrast, for CF slurries pre-treated at 25 °C for 15 min and at 50 °C for 25 min, both
G’ and
G” values decreased between 200 and 400 MPa, but increased significantly after treatment with 600 MPa, the increase being more significant at the higher
T. This result might reflect the presence of an appreciable number of swollen starch granules in the CF slurries after these HHP treatments at 600 MPa, which prevent further swelling.
The effects of increasing
T are essentially energy and volume effects due to thermal expansivity [
26]. For unrefrigerated samples, at 200 and 400 MPa for 5 and 15 min, there was a significant decrease in
G’ and
G” (
Table 2) when
T was increased from 10 to 25 °C, but both moduli increased again when
T was increased to 50 °C, especially at the shortest
t. At 200 MPa for 25 min,
G’ and
G” decreased with increasing treatment
T. Conversely, after pressurization at 400 MPa for 25 min, both
G’ and
G” values increased when
T was increased from 10 to 25 °C, but decreased at 50 °C. For the CF gels induced from unrefrigerated samples pressurized at 600 MPa for 5 min,
G’ and
G” decreased when
T was increased from 10 to 25 °C, but increased at 50 °C. At 600 MPa for 15 min, the
G' and
G" values decreased significantly and the tan
δ values increased with
T. Finally, at 600 MPa for 25 min, both
G’ and
G” values decreased when
T was increased from 10 to 25 °C, but increased at 50 °C.
Therefore, increasing
T from 10 to 50 °C increased the degree of gelatinization of the slurries, especially of those pressurized at 200 and 400 MPa for 25 min and at 600 MPa for 15 min, and consequently the
T-induced CF gels subsequently had inferior mechanical strength. However, the
T effect was more significant at a constant pressure of 600 MPa and
t of 15 min. Note that at 600 MPa for 5, 15, and 25 min there was a significant increase in tan
δ when
T was increased from 10 to 50 °C. This would represent a less structured system at the highest
T, as can be observed from the significantly greater values of loss tangent [
27]. On the other hand, tan
δ =
G”/
G’ values were significantly lower than 0.5 in all the
T-induced CF gels without and after pressurization for the various combinations, meaning that the samples behave like a viscoelastic gel because
G’ is larger than
G”, indicating the presence of a network structure [
28]. For normal rice starch, at 400 MPa the degree of gelatinization (
ηinitial) increased gradually as the temperature was increased from 10 to 60 °C [
26], whereas for waxy rice starch, at 350 MPa
ηinitial increased gradually as the temperature was increased from 20 to 60 °C.
With regard to the treatment
t effect, at constant pressure and
T, unrefrigerated samples HHP-treated at 200 and 600 MPa and 10 °C, at 200, 400, and 600 MPa and 25 °C, and at 600 MPa and 50 °C showed a significant increase in both
G’ and
G” values (
Table 2), with increasing treatment
t from 5 up to 25 min, resulting in an increase in CF paste and gel rigidity, confirming that HHP-induced gelatinization is also a
t-dependent process [
6]. This result could indicate an association between amylose and amylopectin induced by pressurization throughout these different HHP treatment combinations, which produced a cross-linking-like network that displayed resistance to shear force and increased viscosity [
16]. As mentioned previously, for the slurries pre-treated at 200 MPa and 10 °C for 25 min without previous
S, the
G’ value (3770.7 ± 137.6 Pa) was higher than the value achieved by the unpressurized sample, indicative of its higher ability for
T-induced gelatinization even after pressurization at the lowest pressure and
T for 25 min. Similarly, CF samples containing a flour-to-water ratio of 1:5 that were pre-treated at 150 MPa (at 25 °C for 15 min) and then heated under isothermal conditions up to 75 or 90 °C had significantly higher
G’ and
G” values than the unpressurized case, suggesting that HHP-induced melting of granules started at pressures >150 MPa [
5].
Conversely, at constant pressure and T, unrefrigerated samples HHP-treated at 400 MPa and 10 °C, as well as at 200 and 400 MPa and 50 °C, showed a significant decrease in both G’ and G” valueswith increasing treatment t from 5 up to 25 min. In addition, a significant decrease in both G’ and G” values was observed with increasing treatment t from 5 up to 15 min for CF slurries pre-treated at 200, 400, and 600 MPa and 50 °C, whereas the contrary was true after pressurization at the same pressures and 10 °C.
Table 2 also shows the effect of pressure,
T, and treatment
t on the rheological properties of heat-induced CF gels after keeping the HHP-treated CF slurries for one week under refrigeration or storage at 4 °C. At constant
T and treatment
t, for CF slurries pre-treated at 25 °C for 15 and 25 min and at 50 °C for 5 and 15 min, both
G’ and
G” values decreased significantly with increasing pressure applied, reflecting progressive gelatinization as the pressure level increased from 400 to 600 MPa for these
T and treatment
t combinations. On the other hand, the low
G’ and
G” values obtained for the CF gels after pressurization at 600 MPa and 50 °C would appear to indicate that the starch had been completely gelatinized by the HHP treatment at 600 MPa and 50 °C for 5 and 15 min. Samples of sorghum starch pre-treated at 500 and 600 MPa at 20 °C for 10 min showed no increase in viscosity, and therefore a complete gelatinization induced by HHP treatment was assumed [
9]. Likewise, also after pressurization with 500 MPa, gelatinization was nearly complete and only a very small increase in complex modulus occurred upon pasting [
29]. Moreover, the onset complex modulus increased sharply between 300 and 500 MPa and exhibited a sigmoidal-shaped curve. Nevertheless, for the other
T and treatment
t combinations the values of both
G’ and
G” increased when the pressure increased from 200 to 400 MPa, but also decreased when the pressure increased to 600 MPa.
With regard to the treatment
T effect on stored CF slurries, at constant pressure and
t, samples HHP-treated at 200, 400, and 600 MPa for 5 and 15 min showed a significant decrease in their viscoelastic properties (
Table 2) with increasing treatment
T from 10 up to 50 °C, resulting in a reduction in CF paste and gel rigidity, confirming that HHP-induced gelatinization is also a
T-dependent process [
6,
7]. In accordance with Stolt
et al. [
8], the same degree of gelatinization can be brought about by different pressure–
T combinations,
i.e., lower pressure can, to a certain extent, be compensated for by higher treatment
T. Conversely, different results were obtained for the samples HHP-treated at the longest
t. For the samples HHP-treated at 200 and 400 MPa for 25 min, both
G’ and
G” values were significantly higher at 50 than at 10 °C, and the same was true for the viscosity of the CF slurries pressurized at 600 MPa for 25 min. According to Oh
et al. [
7], this result might indicate that a breakdown of granules caused an increase in elasticity and viscosity of refrigerated samples HHP-treated at 200, 400, and 600 MPa and 50 °C for 25 min, with significant leaching of amylose, and therefore a higher extent of recrystallization occurring outside the starch granules. As the quantity of amylose surrounding starch granules was higher in this case, CF gels obtained using this high
T and treatment
t had a stronger matrix. Similarly, pressure treatment at 650 MPa for 6 min resulted in a complete breakdown of granules in waxy corn starch, whereas high-amylose corn starch retained a granular structure [
30].
With regard to the effect of treatment t on the viscoelastic properties of the refrigerated CF slurries, at constant pressure and T, samples HHP-treated at 200, 400, and 600 MPa and 50 °C showed a significant increase in both G’ and G” values with increasing treatment t from 5 up to 25 min. Therefore, it is possible that these more severe HHP treatments at the highest T and longest t would result in a greater degree of breakdown of the granules in the CF slurries.
During gelation, double helices are formed between the leached amylose molecules, and a network develops. This network is reinforced by the embedded deformed gelatinized granules. Upon storage of starch gels, recrystallization occurs: owing to the reassociation and crystallization of starch chains, a new semi-crystalline structure is formed. This reassociation is referred to as retrogradation [
31]. Starch retrogradation was found to be the major factor affecting stability and varied greatly among different starches and starch fractions [
32,
33]. The newly formed crystals exhibit a B-pattern, independent of the crystalline pattern of the native starch [
34]. Recrystallization is a slow, two-phase process. The short-term (~1–2 days) recrystallization is dominated by crystallization within the amylose matrix. The double helices form very stable crystals, as they have a melting temperature of about 150 °C [
35]. Amylopectin retrogradation is much slower (∼10 days) and the crystals have a lower thermal stability, melting between 50 and 60 °C [
34].
The retrogradation of pressure-induced barley starch gels was studied using DSC [
8], because it had been reported that pressure-induced starch gels in general are less sensitive to retrogradation than heat-induced gels [
13]. In order to investigate the starch retrogradation of HHP-treated CF slurries, at each combination of pressure,
T, and treatment
t the subsequent
T-treatment for inducing CF gels was carried out twice, immediately after HHP treatment and after 1 week of storage at 4 °C. Both
G’ and
G” values were significantly higher for the unpressurized CF gel without storage as compared with the unpressurized sample after refrigeration (
Table 2). Initially, this decrease may only be associated with sedimentation, flocculation, or coalescence phenomena occurring in the unpressurized CF slurry during storage. In this study, retrogradation from starch gelatinization by heat is discounted because, although the HHP-treated CF slurries were cooled to 25 °C before measurements, there was no time for gel aging.
In addition, both storage and loss moduli also decreased with storage for the CF slurries pre-treated with 200 MPa at 10 °C for 15 and 25 min and at 50 °C for 5 min, as well as for the CF slurries pre-treated with 400 and 600 MPa at 50 °C for 5 min. Conversely, for CF slurry pre-treated with 200, 400, and 600 MPa at 10 and 25 °C for 5 min, with 400 MPa at 10, 25, and 50 °C for 15 and 25 min, and with 600 MPa at 25 °C for 15 min, both
G’ and
G” values were significantly higher for the heat-induced CF gels after storage. As the retrogradation process takes place, the starch paste becomes increasingly opaque and could form a cuttable gel. With time, this gel becomes rubbery and has a tendency to release water [
31]. In native corn starch an increase in the critical shear stress and a decrease in the critical shear strain were found, which reflected the presence of a stiffer system but one that was more sensitive to the stress applied. According to Kapri and Bhattacharya [
2], during retrogradation there is a progressive change from elasto-viscoplastic behavior (presence of a yield stress) to an elastic gel with viscous damping. The events occurring during gelatinization and recrystallization of a starch suspension, especially the granule swelling and leaching of amylose/amylopectin, will strongly change the rheological properties of a starch suspension. It has also been stated that pressure-treated samples exhibited a relatively lower extent of recrystallization compared with thermally treated dispersion during storage, suggesting that less retrogradation occurred in the pressurized starch than in the heated starch [
8,
9,
13,
29]. Therefore the increase in the moduli of the HHP-treated CF slurries is probably a consequence of the retrogradation phenomena dominated by crystallization within the amylose matrix occurring during the storage period. However, further research is necessary to explain why both
G’ and
G” values were lower in the stored HHP-treated CF slurries for some combinations of the factors.
On the other hand, there were non-significant differences between the viscoelastic properties of refrigerated and unrefrigerated CF slurries HHP-treated at 600 MPa and 50 °C for both 15 and 25 min (
Table 2). Results would appear to indicate that breakdown of granules and some splitting of macromolecules could be assumed at 600 MPa and higher
T and
ts. In these cases, retrogradation probably occurred outside the granules, which explains the lack of effect of storage on the parameter values obtained for the CF slurries HHP-treated at 600 MPa and 50 °C for both 15 and 25 min. However, to obtain a more detailed understanding of this difference in behavior, further research is necessary between 400 and 600 MPa, as well as between 25 and 50 °C. The information gathered from rheological measurements needs to be related to other analyses to characterize the HHP-induced gelatinization of CF slurry.
Table 3 shows the effects of pressure,
T, treatment
t, and
S on the power law parameters of heat-induced CF gels without and with storage. Exponents
n’ and
n” may be related to the time-stability of the network, given the frequency-dependence (
ω) of viscoelastic moduli [
36]. The
n’ values ranged between 0.04 ± 0.00 and 0.08 ± 0.01, reflecting that for all the CF gels
G’ is practically frequency-independent over this time range (
n’ < 0.1) [
37]. The highest
n’ values were obtained for CF slurries treated with 600 MPa at 50 °C for 5 and 25 min. This indicates a less time-stable matrix, resulting in a more shear-strain sensitive network for these CF gels. Note that, in fact, storage was not significant for
n’ values (
Table 1). In turn, the
n” values ranged between 0.12 ± 0.01 and 0.25 ± 0.01, therefore reflecting a higher
ω dependence associated with
G”. For unrefrigerated samples, a significant increase in
n” was observed with increasing pressure level from 200 to 400 MPa for CF gels pre-treated at 10 °C for 5, 15, and 25 min and at 25 °C for 25 min. Moreover, after 600 MPa at 25 °C for 5 min, CF gel had a significantly higher
n” than after 200 and 400 MPa, showing that the time-stability of the network decreased. Furthermore, at 400 MPa and 10 °C,
n” increased significantly with
t (
Table 3).
S also had a significant effect on the n” values of CF gels pre-treated at 400 MPa and 10 °C for 15 and 25 min, at 400 MPa and 25 °C for 25 min, at 400 MPa and 50 °C for 5, 15, and 25 min, at 600 MPa and 25 °C for 5 min and 25 min, and at 600 MPa and 50 °C for 15 min. Except for HHP treatments at 400 and 600 MPa and 50 °C for 15 min, the n” values were lower in the refrigerated samples, indicating a greater degree of connectivity, related to starch retrogradation occurring in these HHP-treated slurry samples during S.
The
gel strength (
G’
0 –
G”
0) parameter depends on the cross-linking density and the molecular chain [
19]. This parameter can be used to assess the firmness of gels upon subjection to a fairly rapid deformation such as depressing the gel quickly with one’s thumb and immediately releasing the pressure. It is worth emphasizing that for both unrefrigerated and refrigerated samples, at 10 °C for 5, 15, and 25 min,
gel strength increased between 200 and 400 MPa, but decreased to a minimum after pre-treatment with 600 MPa (
Table 3). Furthermore, for samples without storage, at 25 °C for 5 and 25 min, and at 50 °C for 5, 15, and 25 min,
gel strength decreased significantly with pressure, mainly owing to HHP-induced gelatinization of starch. On the other hand, when the samples were pressurized at 400 and 600 MPa and 50 °C, there were no significant differences between the
G’
0 –
G”
0 values of the gels obtained from the unrefrigerated slurries pressurized for 15 and 25 min. Conversely, for refrigerated samples, at 50 °C for 15 min, the
gel strength decreased significantly to a minimum after pre-treatment with 600 MPa. This result would reflect that after pressurization at 50 °C for 15 min pressure-induced melting of the granules started at 200 MPa, and complete gelatinization was obtained after treatment with 600 MPa. The relationship between degree of gelatinization and treatment pressure followed a sigmoid-shaped curve [
9]. Such sigmoid curves were previously observed for the degree of gelatinization
vs. pressure, based on the loss of birefringence [
6] and on the swelling index [
13]. A sigmoidally-shaped gelatinization curve means that pressure-induced gelatinization occurs within a HHP range [
4], and that the treatment pressure has to be above a critical level for gelatinization to occur effectively [
26].
With regard to the treatment
T effect, at constant pressure and treatment
t, both unrefrigerated and refrigerated samples HHP-treated at 400 and 600 MPa for 15 and 25 min mostly showed a significant decrease in
gel strength (
Table 3) with increasing treatment
T from 10 up to 50 °C, resulting in a reduction in CF paste and gel rigidity, confirming that HHP-induced gelatinization is also a
T-dependent process [
6,
8]. Upon further increase in
T, the granules begin to break down and amylopectin solubilization increases, resulting in a decrease in consistency and overall stiffness [
38]. However, for samples HHP-treated at 600 MPa for 25 min, there were no significant differences between the
G’
0 −
G”
0 values of the gels obtained from the CF slurries pressurized at 25 and 50 °C. This result seems to show that after 600 MPa at 25 °C for 25 min complete gelatinization was obtained, suggesting that, at least at the highest pressure applied, the relationship between degree of gelatinization and treatment
T also follows a sigmoid-shaped curve.
The importance of treatment duration on starch gelatinization has been highlighted in a number of studies [
4,
6,
8]. In this study, at constant pressure and
T the effect of treatment
t on
gel strength was more ambiguous. Samples without storage treated at 200 and 600 MPa and 10 °C, and at 200, 400, and 600 MPa and 25 °C showed a significant increase in
G’
0 –
G”
0 values with increasing treatment
t. However, at the highest
T a weaker-structured matrix was obtained after pressurization at 200, 400, and 600 MPa for 15 min and subsequently the
gel strength increased with longer duration. Stolt
et al. [
8] observed that the consistency of a starch–water suspension increased with increasing processing time until a plateau was reached where the consistency did not change further. The more severe the treatment conditions (higher temperature and/or pressure), the faster this plateau value was reached. The use of starch gelatinization as a pressure–time–temperature indicator, an indicator of the severity of the treatment, for monitoring high pressure processing conditions has been discussed by Bauer and Knorr [
6].
3.2. Effect of Pressure, Temperature (T), and Treatment Time (t) on Textural Properties of CF Gel Heat-Induced from Pressurized Powder Form
All the CF samples that were pressurized in powder form turned into solid rock; therefore, they were hammered into smaller pieces to obtain a free-flowing powder. A similar observation was reported by Katopo
et al. [
16]. Normal maize, waxy maize, high-amylose maize VII, tapioca, potato, and rice starches were ultrahigh hydrostatic pressurized at 690 MPa in powder form by the authors just cited.
With regard to textural properties derived from
BS and TPA tests for the heat-induced CF gels made with the different pressurized powders, the three-way mixed-model ANOVA showed significant (
p < 0.05) pressure,
T, and treatment
t main effects for rupture strength (
RS) from the
BS test and especially for hardness (
Hard) from the TPA test (
Table 4). The effect of
T was not significant for
AdhBS and
Slope (brittleness) from the
BS test, and
AdhTPA and
Coh from the TPA test, whereas
t main effect was only significant for
RS,
Slope, and
Hard. Except for
RS and
Hard, pressure had a more significant effect on textural properties than either treatment
T or holding
t. Katopo
et al. [
16] also found that results obtained from samples with 1 h of pressurization were not significantly different from those obtained with 5 min of pressurization at 690 MPa, indicating that holding
t had a non-significant effect in their study.
On the other hand, pressure ×
t interaction was not significant for
RS and
AdhBS from the
BS test, and pressure ×
T ×
t interaction was only not significant for
AdhBS, whereas the effect of binary pressure ×
T interaction was not significant for
BS,
AdhBS, and
AdhTPA. In turn, double
T ×
t interaction was not significant for
BS,
AdhBS, Slope, and
AdhTPA. ANOVA also showed that all three main effects and all the interactions were not a significant (
p > 0.05) source of variation for the textural property
AdhBS from the
BS test. For this type of food, measurement of adhesiveness by the
BS method is not appropriate. Hoseney and Smewing [
39] stated that in order to study adhesive properties it is imperative to have a procedure that forces a clean separation at the probe–material interface.
As a result, except for
AdhBS from the
BS test, the effect of pressure on the textural properties of CF gel heat-induced from HHP-treated powder was dependent on both
T and treatment
t, although the three main effects and their interactions had a more significant effect on the rheological properties of the HHP-treated CF slurries (
Table 1). Graphs of three different textural properties are shown in
Figure 4,
Figure 5 and
Figure 6. Pressure main effect without considering
T and treatment
t main effects, as well as binary pressure ×
T interactions discarding the treatment
t effect, were chosen for representation because their
F values were mostly higher than those of the triple interactions, and compared with an untreated sample.
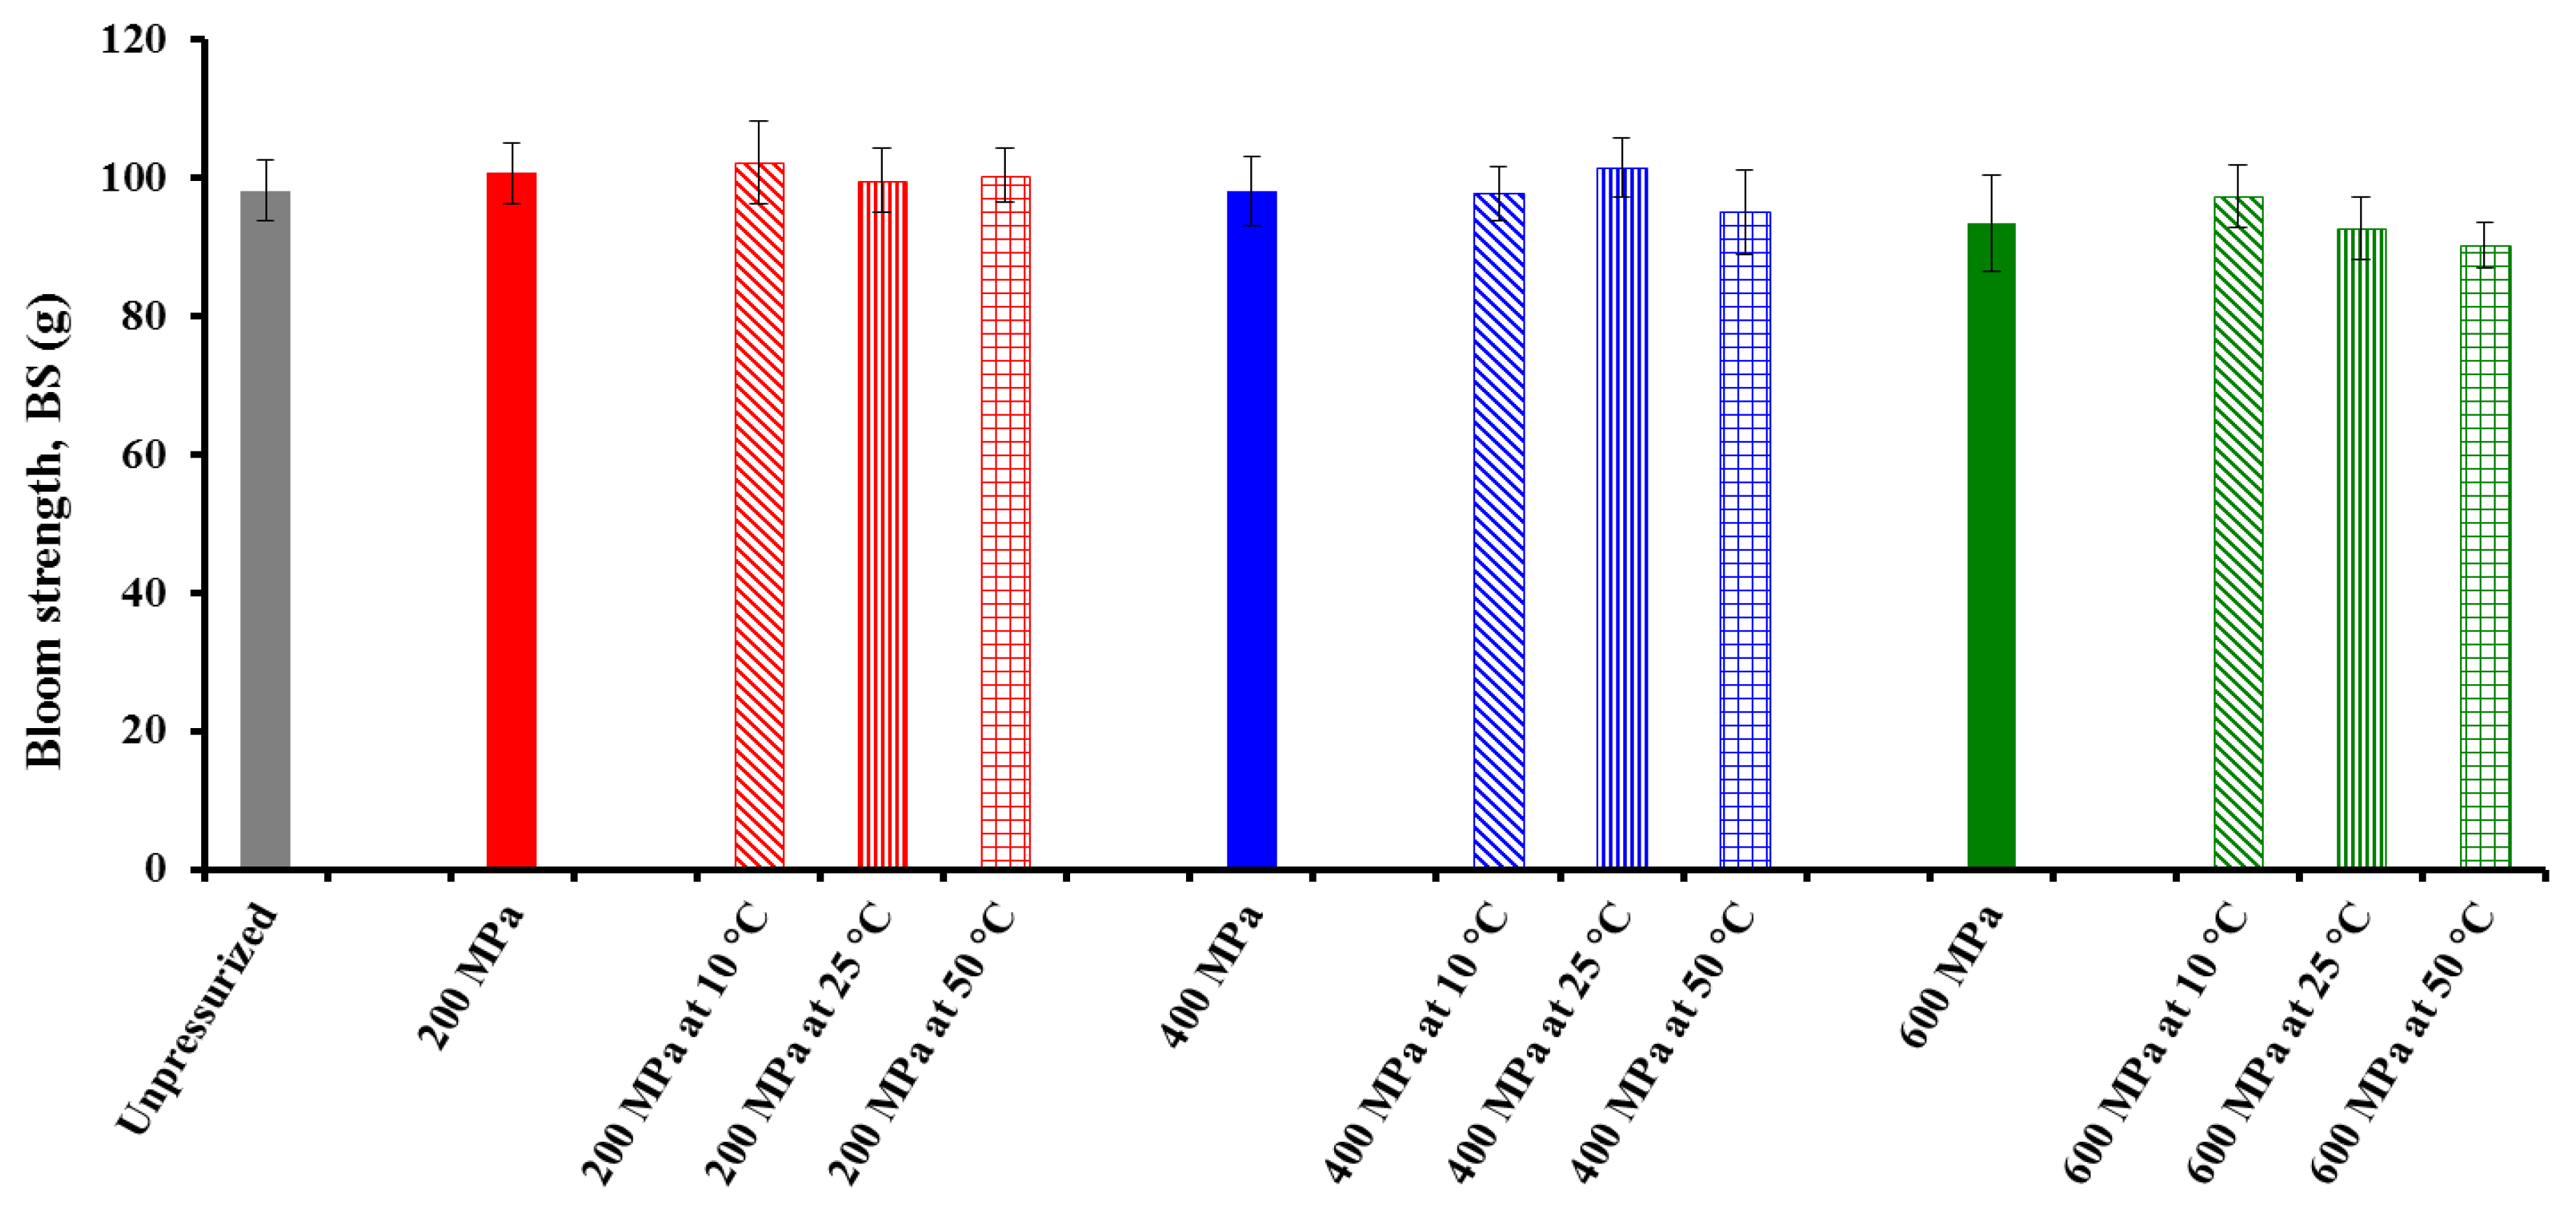
Figure 4.
Effect of pressure and treatment temperature on bloom strength (BS) of chickpea gel heat-induced from pressurized powder at 25 °C. Mean values of 10 measurements.
Figure 4.
Effect of pressure and treatment temperature on bloom strength (BS) of chickpea gel heat-induced from pressurized powder at 25 °C. Mean values of 10 measurements.
The effects of pressure are mainly volume effects caused by compressibility of the system [
26]. It can be observed that the
BS of the CF gels decreased with increasing pressure level, reflecting the fact that treatment of CF in powder form with increasing pressure causes an increase in starch gelatinization, in agreement with previous findings in other either starch- or flour-in-water suspensions [
5,
6,
7,
9,
29]. More interestingly, samples treated at 600 MPa showed a substantial decrease in their
BS values as compared with unpressurized powder.
Table 4.
Three-way analysis of variance of the textural properties of CF gel heat-induced from pressurized powder form after cooling to 25 °C (high hydrostatic pressure treatments: 200, 400, and 600 MPa, 10, 25, and 50 °C, 5, 15, and 25 min, and unpressurized sample). F and p values.
Table 4.
Three-way analysis of variance of the textural properties of CF gel heat-induced from pressurized powder form after cooling to 25 °C (high hydrostatic pressure treatments: 200, 400, and 600 MPa, 10, 25, and 50 °C, 5, 15, and 25 min, and unpressurized sample). F and p values.
| Parameter | Pressure (df = 2) | Temperature (T) (df = 2) | Time (t) (df = 2) | Pressure × T (df = 4) | Pressure × t (df = 4) | T × t (df = 4) | Pressure × T × t (df = 8) |
|---|
| F value | p value | F value | p value | F value | p value | F value | p value | F value | p value | F value | p value | F value | p value |
|---|
| BS (g) | 16.7 | 0.000 | 4.8 | 0.009 | 2.0 | 0.136 | 1.9 | 0.109 | 9.5 | 0.000 | 1.4 | 0.251 | 2.5 | 0.014 |
| RS (N) | 7.2 | 0.001 | 4.0 | 0.020 | 18.6 | 0.000 | 10.5 | 0.000 | 1.1 | 0.354 | 30.3 | 0.000 | 20.0 | 0.000 |
| AdhBS (N s) | 1.1 | 0.338 | 1.5 | 0.232 | 2.0 | 0.134 | 1.4 | 0.247 | 1.2 | 0.322 | 1.7 | 0.143 | 1.7 | 0.100 |
| Slope (N mm−1) | 16.7 | 0.000 | 1.5 | 0.216 | 4.9 | 0.008 | 6.4 | 0.000 | 4.6 | 0.001 | 2.3 | 0.057 | 5.5 | 0.000 |
| Hard (N) | 46.2 | 0.000 | 66.5 | 0.000 | 38.1 | 0.000 | 51.2 | 0.000 | 60.0 | 0.000 | 21.2 | 0.000 | 55.0 | 0.000 |
| AdhTPA (N s) | 6.1 | 0.003 | 0.1 | 0.873 | 1.4 | 0.253 | 2.2 | 0.066 | 9.6 | 0.000 | 0.4 | 0.817 | 8.1 | 0.000 |
| Spr (-) | 7.5 | 0.001 | 5.1 | 0.007 | 1.6 | 0.209 | 4.6 | 0.001 | 5.5 | 0.000 | 2.8 | 0.025 | 6.7 | 0.000 |
| Coh (-) | 1.2 | 0.292 | 0.8 | 0.450 | 0.4 | 0.702 | 5.5 | 0.000 | 5.2 | 0.000 | 4.4 | 0.002 | 2.9 | 0.004 |
Stolt
et al. [
8] found a complete loss of birefringence in barley starch after HHP treatment at 600 MPa for 15 min. HHP-induced melting of sorghum starch granules started at pressures >300 MPa and complete gelatinization was obtained after treatment with 600 MPa [
9]. However, the HHP-gelatinization in the presence of excess water is primarily depended on the applied pressure. The pressure range in which HHP gelatinization of starches can be achieved seems to be between 400 to 900MPa (400 MPa, e.g., for wheat starch and 800–900 MPa for potato starch) [
10]. On the other hand, both starch and protein are the major chickpea components. Therefore, in this study, the presence of proteins might have also been responsible for the lower BS values of the CF gels with increasing pressure level. HHP treatment has been shown to influence the functional properties of proteins through the disruption and reformation of hydrogen bonds and hydrophobic interactions leading to denaturation, aggregation, and gelation [
11]. The authors just cited inferred that the observed decrease in enthalpy for rice slurry after pressure treatment cannot be attributed solely to starch gelatinization or unfolding of proteins; rather, it results from combination of these components. These observations were supported by DSC data and the sodium dodecyl sulfate polyacrylamide gel electrophoresis (SDS-PAGE) indicated alterations in protein structures following HHP treatment. In turn, Fourier-transform infrared (FTIR) spectroscopy indicated a change in the secondary structure of post-process rice proteins. In any case, CF slurries subjected to 600 MPa at 25 °C for 15 min showed no peak and hence no enthalpy value, suggesting complete HHP-induced gelatinization of starch [
5].
Moreover, at constant pressure of 600 MPa the higher the
T, the lower the
BS in the
T range investigated (10, 25, and 50 °C), showing that the degree of gelatinization also increased with increasing treatment
T. For this reason, the bloom strength (
BS) of the CF gels obtained fell with increasing pressure. The gelling ability of chickpea flour in powder form and the viscous nature of cooked paste are important for the manufacture of gelled food products [
2]. At constant 200 MPa, samples HHP-treated at 25 and 50 °C also showed a decrease in
BS values as compared with those corresponding to 10 °C. Therefore, the application of high HHP of 600 MPa, adopted as a pre-processing instrument in combination with heating processes, could reduce the thermo-hardening of heat-induced CF gel remarkably, leading to the development of new chickpea-based products that possess desirable handling properties and sensory attributes. Conversely, pressurization at the lowest level may be a desirable feature for consumers who prefer a firm, solid-like structure. At constant 400 MPa the
BS values decreased significantly with increasing
T from 10 to 50 °C, although an unexpected high
BS value was obtained for samples HHP-treated at 400 MPa and 25 °C.
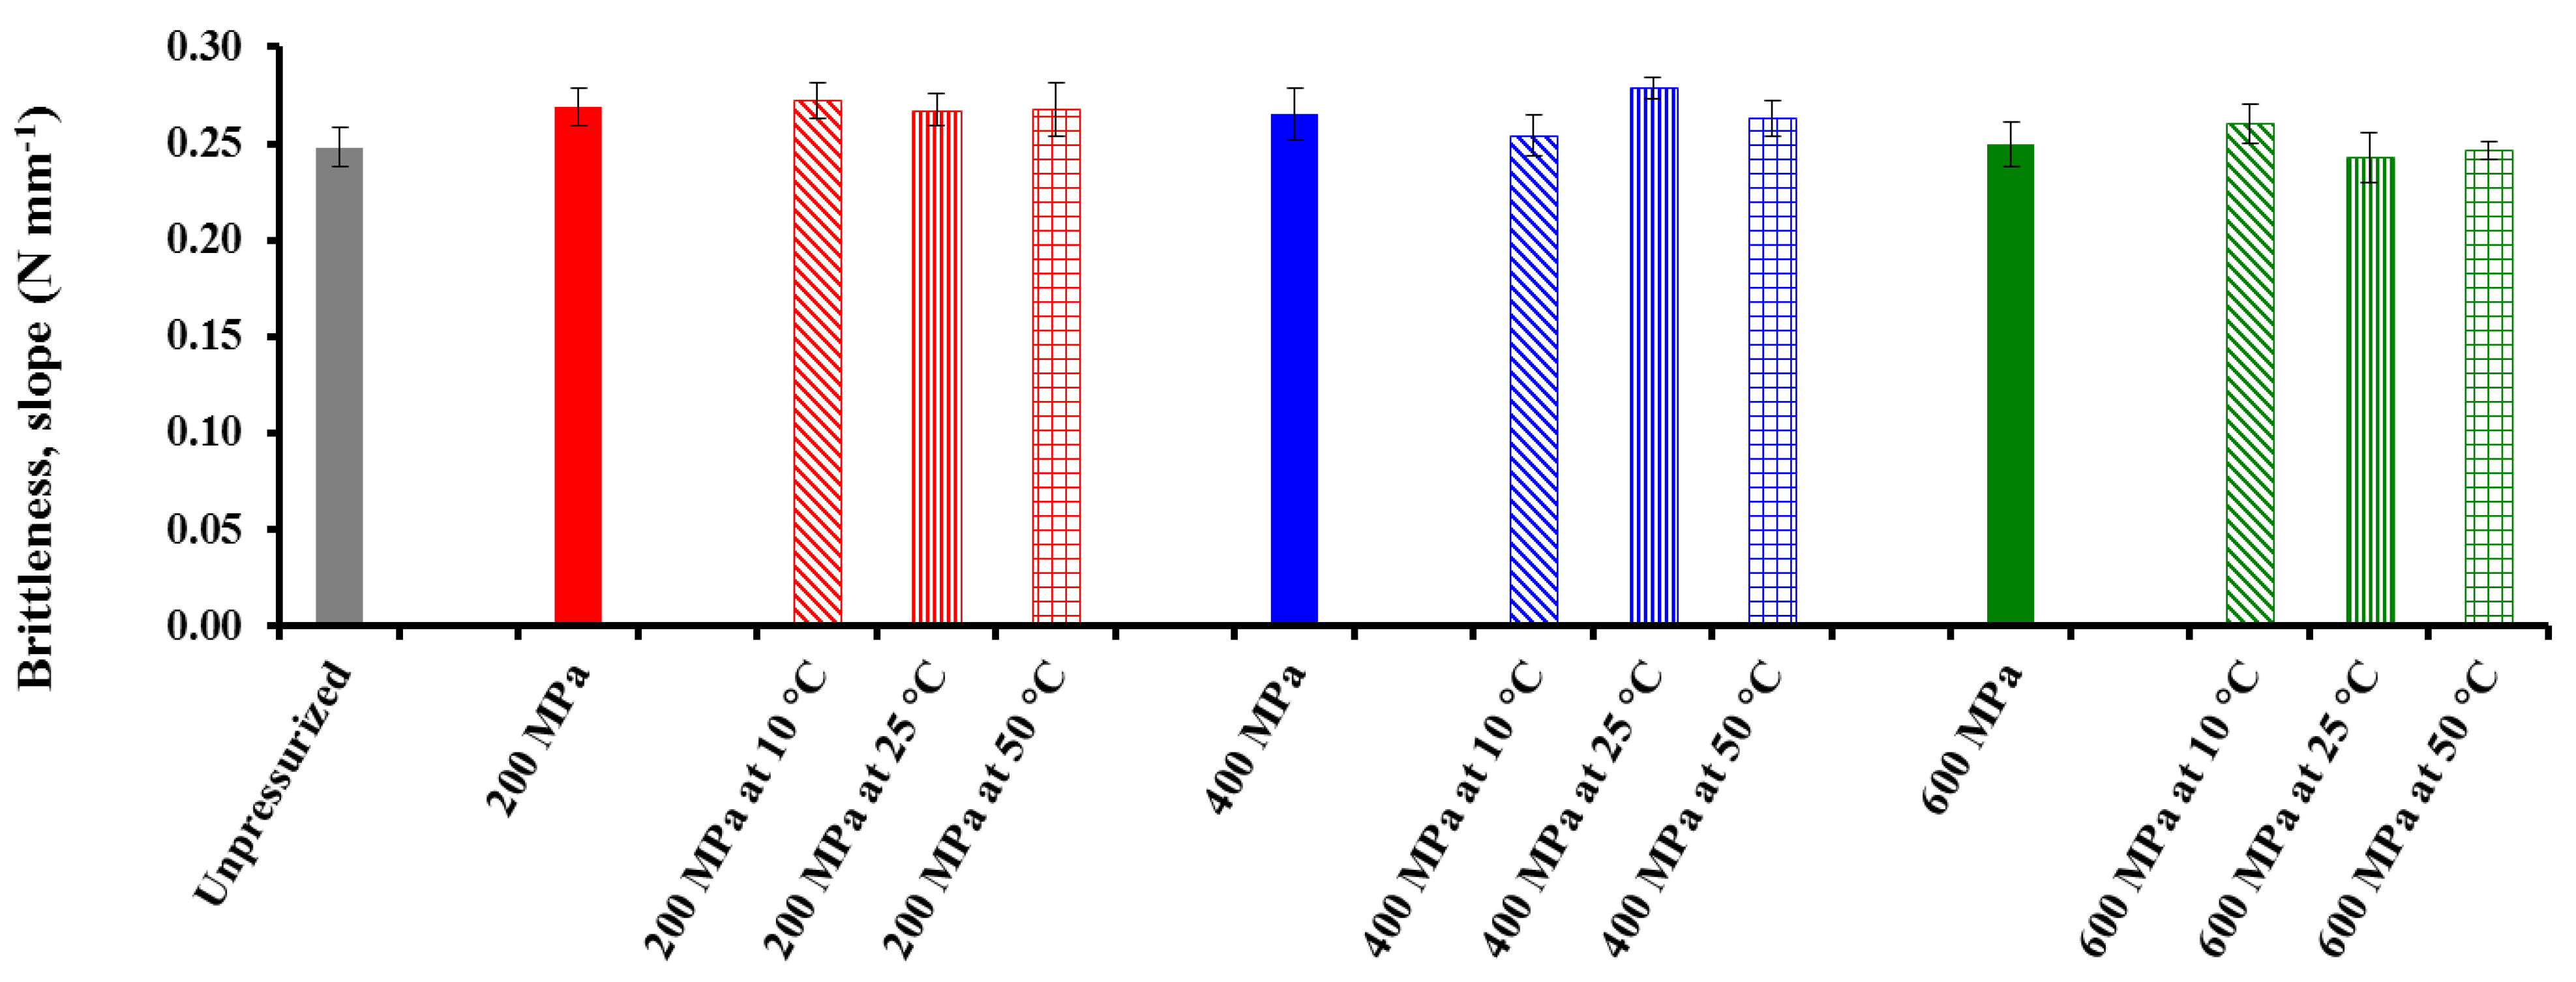
Figure 5.
Effect of pressure and treatment temperature on the brittleness (slope) of chickpea gel heat-induced from pressurized powder at 25 °C. Mean values of 10 measurements.
Figure 5.
Effect of pressure and treatment temperature on the brittleness (slope) of chickpea gel heat-induced from pressurized powder at 25 °C. Mean values of 10 measurements.
Gel strength is an indirect measure of the nature of a viscoelastic material [
40]. It also indicates the overall consistency of the formed gel that includes mechanical rigidity or hardness, cohesiveness or internal binding, and elasticity or springiness.
Figure 5 shows the slope of CF gels as a function of pressure and
T. The lowest brittleness is associated with the highest levels of these two factors. In turn,
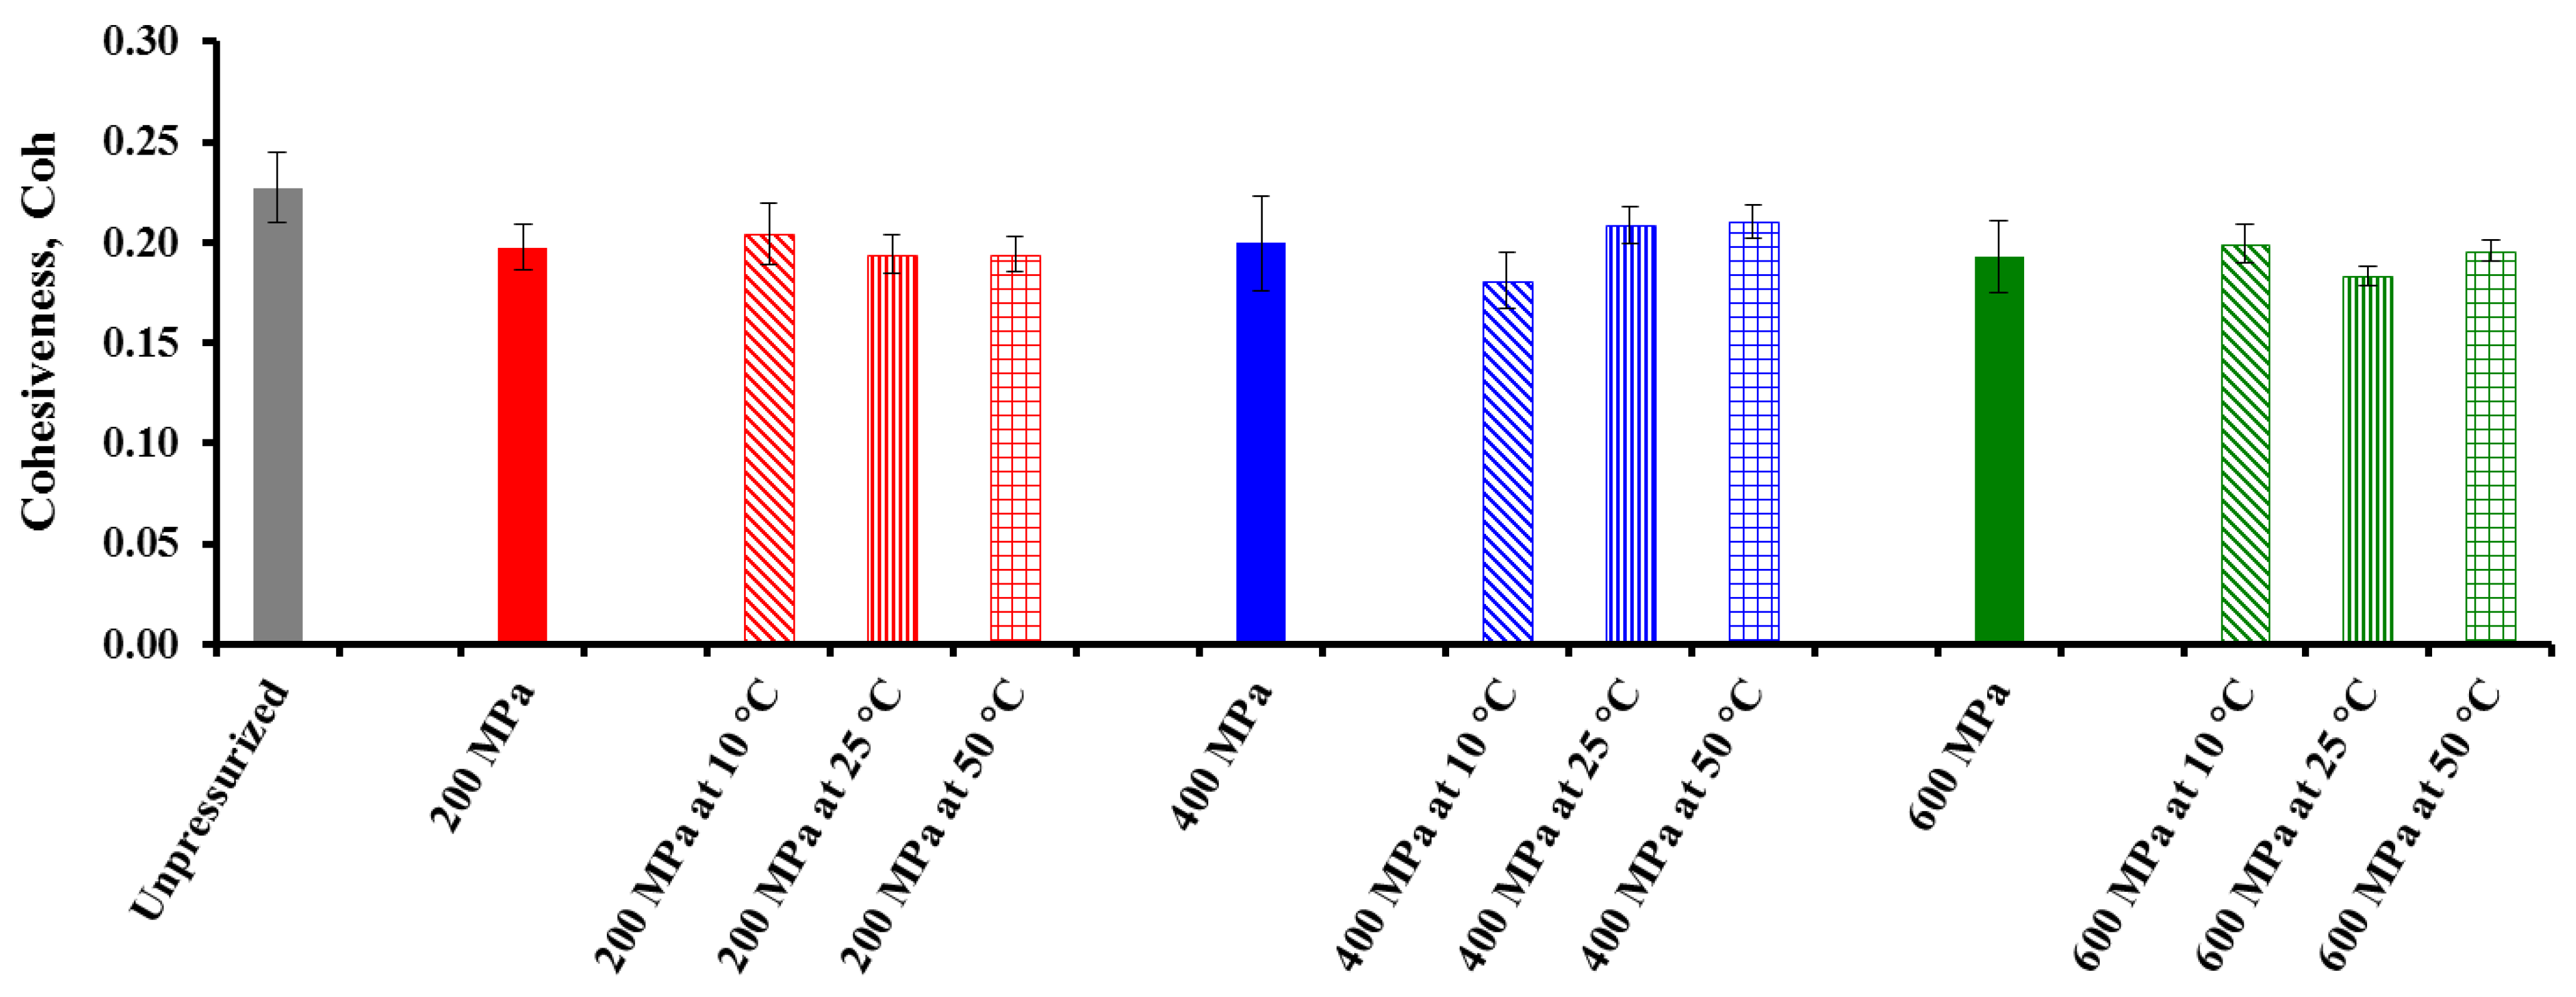
Figure 6 shows the
Coh values from TPA tests obtained for the heat-induced CF gels after pressurization. It can be seen that pressure did not have a significant effect on this textural property, and the highest
Coh value corresponded to unpressurized heat-induced CF gel. The effect of treatment
T on the
Coh of the gels was dependent on the pressure applied. At 200 and 600 MPa, there was a decrease in
Coh when
T was increased from 10 to 25 °C, but at the highest pressure
Coh increased again when
T was increased to 50 °C. Conversely, after pressurization at 400 MPa,
Coh increased when
T was increased from 10 to 25 °C, but scarcely changed at 50 °C. According to Katopo
et al. [
16], starch pressurized in powder form displays a lower gelatinization temperature and enthalpy change than native starch, indicating damage and loss of molecular order and crystallinity resulting from pressurization at 690 MPa.
Figure 6.
Effect of pressure and treatment temperature on the cohesiveness (Coh) of chickpea gel heat-induced from pressurized powder at 25 °C. Mean values of 10 measurements.
Figure 6.
Effect of pressure and treatment temperature on the cohesiveness (Coh) of chickpea gel heat-induced from pressurized powder at 25 °C. Mean values of 10 measurements.
Cohesiveness is a direct function of the work needed to overcome the internal bonding of the gel network [
41]. Thus, when the gel network shows a higher degree of gelatinization, this means that the internal bonds of the gel structure are broken to a greater extent. Such a gel recovers less during the imitative second bite. However, although unpressurized CF gels had higher resistance to deformation, the impact of pressure and
T on the textural properties derived from TPA tests was more ambiguous. Results would appear to indicate that the bloom strength test was a more adequate and suitable method for comparison of rigidity in the heat-induced CF gels after pressurization of the flour in powder form and, therefore, without water.


