

The Availability of Slow and Fast Calories in the Dutch Diet: The Current Situation and Opportunities for Interventions


Abstract
1. Introduction
2. Materials and Methods
2.1. Building the Eating Rate Database
2.1.1. Laboratory Measurements
Foods
Reference foods
Participants
Procedure
Calculating food-specific eating rate and energy intake rate
2.1.2. Additional Eating Rate Data
2.2. Data on Other Food Properties
2.2.1. Texture
- Liquids: Foods that flow and do not require chewing before swallowing (e.g., milk, beverages, yoghurt drinks);
- Semi-solids: Foods that are predominantly processed by squeezing them between tongue and palate, without the use of the molars (e.g., pudding, custard);
- Soft solids: Foods that require (initial) chewing between the molars, but do not have crispy sensations (e.g., cheese, processed meat);
- Hard solids: Crispy foods that require chewing between the molars and generally produce an acoustic sound emission during oral processing (e.g., crackers, raw vegetables, apples).
2.2.2. Food Composition
2.2.3. Taste
2.2.4. Food Groups
2.2.5. Recommended Foods
2.3. Categorization of Foods According to Energy Intake Rate within Food Groups
2.4. Statistical Analyses
3. Results
3.1. Descriptives
3.2. Data Checks
3.3. Eating Rate and Other Food Properties
3.3.1. Food Composition
3.3.2. Taste Intensity
3.3.3. Texture
3.3.4. Dutch Recommendations
3.4. Energy Intake Rate And Other Food Properties
3.4.1. Food Composition
3.4.2. Taste Intensity
3.4.3. Texture
3.4.4. Dutch Recommendations
3.5. Energy Intake Rate of Foods within Food Groups
4. Discussion
5. Conclusions
Supplementary Materials
Acknowledgments
Author Contributions
Conflicts of Interest
References
- Bolhuis, D.P.; Forde, C.G.; Cheng, Y.; Xu, H.; Martin, N.; de Graaf, C. Slow food: Sustained impact of harder foods on the reduction in energy intake over the course of the day. PLoS ONE 2014, 9, e93370. [Google Scholar] [CrossRef] [Scilit] [PubMed]
- Forde, C.G.; Leong, C.; Chia-Ming, E.; McCrickerd, K. Fast or slow-foods? Describing natural variations in oral processing characteristics across a wide range of asian foods. Food Funct. 2017, 8, 595–606. [Google Scholar] [CrossRef] [Scilit] [PubMed]
- Viskaal-van Dongen, M.; Kok, F.J.; de Graaf, C. Eating rate of commonly consumed foods promotes food and energy intake. Appetite 2011, 56, 25–31. [Google Scholar] [CrossRef] [Scilit] [PubMed]
- Robinson, E.; Almiron-Roig, E.; Rutters, F.; de Graaf, C.; Forde, C.G.; Tudur Smith, C.; Nolan, S.J.; Jebb, S.A. A systematic review and meta-analysis examining the effect of eating rate on energy intake and hunger. Am. J. Clin. Nutr. 2014, 100, 123–151. [Google Scholar] [CrossRef] [Scilit] [PubMed]
- Ohkuma, T.; Hirakawa, Y.; Nakamura, U.; Kiyohara, Y.; Kitazono, T.; Ninomiya, T. Association between eating rate and obesity: A systematic review and meta-analysis. Int. J. Obes. 2015, 39, 1589–1596. [Google Scholar] [CrossRef] [Scilit] [PubMed]
- Fogel, A.; Goh, A.T.; Fries, L.R.; Sadananthan, S.A.; Velan, S.S.; Michael, N.; Tint, M.-T.; Fortier, M.V.; Chan, M.J.; Toh, J.Y.; et al. Faster eating rates are associated with higher energy intakes during an ad libitum meal, higher BMI and greater adiposity among 4·5-year-old children: Results from the Growing Up in Singapore Towards Healthy Outcomes (GUSTO) cohort. Br. J. Nutr. 2017, 117, 1042–1051. [Google Scholar] [CrossRef] [Scilit] [PubMed]
- De Graaf, C.; Kok, F.J. Slow food, fast food and the control of food intake. Nat. Rev. Endocrinol. 2010, 6, 290–293. [Google Scholar] [CrossRef] [Scilit] [PubMed]
- De Graaf, C. Texture and satiation: The role of oro-sensory exposure time. Physiol. Behav. 2012, 107, 496–501. [Google Scholar] [CrossRef] [Scilit] [PubMed]
- Kokkinos, A.; le Roux, C.W.; Alexiadou, K.; Tentolouris, N.; Vincent, R.P.; Kyriaki, D.; Perrea, D.; Ghatei, M.A.; Bloom, S.R.; Katsilambros, N. Eating slowly increases the postprandial response of the anorexigenic gut hormones, peptide YY and glucagon-like peptide-1. J. Clin. Endocrinol. Metab. 2010, 95, 333–337. [Google Scholar] [CrossRef] [Scilit] [PubMed]
- Cecil, J.E.; Francis, J.; Read, N.W. Relative contributions of intestinal, gastric, oro-sensory influences and information to changes in appetite induced by the same liquid meal. Appetite 1998, 31, 377–390. [Google Scholar] [CrossRef] [Scilit] [PubMed]
- Kral, T.V.E.; Rolls, B.J. Energy density and portion size: Their independent and combined effects on energy intake. Physiol. Behav. 2004, 82, 131–138. [Google Scholar] [CrossRef] [Scilit] [PubMed]
- Vernarelli, J.A.; Mitchell, D.C.; Rolls, B.J.; Hartman, T.J. Dietary energy density and obesity: How consumption patterns differ by body weight status. Eur. J. Nutr. 2016, 1–11. [Google Scholar] [CrossRef] [Scilit] [PubMed]
- McCrickerd, K.; Lim, C.M.; Leong, C.; Chia, E.M.; Forde, C.G. Texture-based differences in eating rate reduce the impact of increased energy density and large portions on meal size in adults. J. Nutr. 2017, 147, 1208–1217. [Google Scholar] [CrossRef] [Scilit] [PubMed]
- Lasschuijt, M.P.; Mars, M.; Stieger, M.; Miquel-Kergoat, S.; de Graaf, C.; Smeets, P. Comparison of oro-sensory exposure duration and intensity manipulations on satiation. Physiol. Behav. 2017, 176, 76–83. [Google Scholar] [CrossRef] [Scilit] [PubMed]
- Zijlstra, N.; Mars, M.; De Wijk, R.A.; Westerterp-Plantenga, M.S.; De Graaf, C. The effect of viscosity on ad libitum food intake. Int. J. Obes. 2008, 32, 676–683. [Google Scholar] [CrossRef] [Scilit] [PubMed]
- Zijlstra, N.; Mars, M.; Stafleu, A.; De Graaf, C. The effect of texture differences on satiation in 3 pairs of solid foods. Appetite 2010, 55, 490–497. [Google Scholar] [CrossRef] [Scilit] [PubMed]
- Forde, C.G.; Van Kuijk, N.; Thaler, T.; De Graaf, C.; Martin, N. Oral processing characteristics of solid savoury meal components, and relationship with food composition, sensory attributes and expected satiation. Appetite 2013, 60, 208–219. [Google Scholar] [CrossRef] [Scilit] [PubMed]
- Ferriday, D.; Bosworth, M.; Godinot, N.; Martin, N.; Forde, C.; Van Den Heuvel, E.; Appleton, S.; Mercer Moss, F.; Rogers, P.; Brunstrom, J. Variation in the oral processing of everyday meals is associated with fullness and meal size; A potential nudge to reduce energy intake? Nutrients 2016, 8, 315. [Google Scholar] [CrossRef] [Scilit] [PubMed]
- Stieger, M.; van de Velde, F. Microstructure, texture and oral processing: New ways to reduce sugar and salt in foods. Curr. Opin. Colloid Interface Sci. 2013, 18, 334–348. [Google Scholar] [CrossRef] [Scilit]
- Bolhuis, D.P.; Lakemond, C.M.; De Wijk, R.A.; Luning, P.A.; Graaf, C. Both longer oral sensory exposure to and higher intensity of saltiness decrease ad libitum food intake in healthy normal-weight men. J. Nutr. 2011, 141, 2242–2248. [Google Scholar] [CrossRef] [Scilit] [PubMed]
- Van Rossum, C.; Fransen, H.; Verkaik-Kloosterman, J.; Buurma-Rethans, E.; Ocke, M. Dutch National Food Consumption Survey 2007–2010: Diet of Children and Adults Aged 7 to 69 Years; National Institute for Public Health and the Environment: Bilthoven, The Netherlands, 2011.
- Donders-Engelen, M.R.; Van der Heijden, L.; Hulshof, K.F.A.M. Maten, gewichten en codenummers 2003. In Division of Human Nutrition; Wageningen University and TNO Nutrition: Zeist, The Netherlands, 2003. [Google Scholar]
- Blundell, J.; De Graaf, C.; Hulshof, T.; Jebb, S.; Livingstone, B.; Lluch, A.; Mela, D.; Salah, S.; Schuring, E.; Van Der Knaap, H.; et al. Appetite control: Methodological aspects of the evaluation of foods. Obes. Rev. 2010, 11, 251–270. [Google Scholar] [CrossRef] [Scilit] [PubMed]
- Teo, P.S.; Van Langeveld, A.W.B.; Pol, K.; Siebelink, E.; De Graaf, C.; Martin, C.; Sylvie, I.; Yan, S.W.; Mars, M. Training of a Dutch and Malaysian sensory panel to assess basic taste intensities and fat sensations of commonly consumed foods. Food Qual. Prefer. 2017. Submitted for publication. [Google Scholar]
- Van Langeveld, A.W.B.; Teo, P.S.; De Vries, J.H.M.; De Graaf, C.; Mars, M. Taste-related energy intake by gender and weight status in the Netherlands. Br. J. Nutr. 2017. Submitted for publication. [Google Scholar]
- Van Stokkom, V.L.; Teo, P.S.; Mars, M.; De Graaf, C.; Van Kooten, O.; Stieger, M. Taste intensities of ten vegetables commonly consumed in the Netherlands. Food Res. Int. 2016, 87, 34–41. [Google Scholar] [CrossRef] [Scilit]
- Ireland, J.; van Erp-Baart, A.; Charrondiere, U.; Moller, A. Selection of a food classification system and a food composition database for future food consumption surveys. Eur. J. Clin. Nutr. 2002, 56, S33. [Google Scholar] [CrossRef] [Scilit] [PubMed]
- The Netherlands Nutrition Centre. The Netherlands Nutrition Centre, Wheel of Five. Available online: http://www.voedingscentrum.nl/nl/service/english.aspx (accessed on 28 June 2017).
- Kromhout, D.; Spaaij, C.J.; De Goede, J.; Weggemans, R.M. The 2015 Dutch food-based dietary guidelines. Eur. J. Clin. Nutr. 2016. [Google Scholar] [CrossRef] [Scilit] [PubMed]
- The Netherlands Nutrition Centre. Wat Staat er Niet in de Schijf van Vijf? Available online: http://www.voedingscentrum.nl/nl/gezond-eten-met-de-schijf-van-vijf/omgaan-met-producten-buiten-de-schijf-van-vijf.aspx (accessed on 1 June 2017).
- Hutchings, J.B.; Lillford, P.J. The perception of food texture—The philosophy of the breakdown path. J. Texture Stud. 1988, 19, 103–115. [Google Scholar] [CrossRef] [Scilit]
- Viskaal-van Dongen, M.; Van den Berg, M.C.; Vink, N.; Kok, F.J.; De Graaf, C. Taste-nutrient relationships in commonly consumed foods. Br. J. Nutr. 2012, 108, 140–147. [Google Scholar] [CrossRef] [Scilit] [PubMed]
- Devezeaux de Lavergne, M.; Derks, J.A.M.; Ketel, E.C.; de Wijk, R.A.; Stieger, M. Eating behaviour explains differences between individuals in dynamic texture perception of sausages. Food Qual. Prefer. 2015, 41, 189–200. [Google Scholar] [CrossRef] [Scilit]
- McCrickerd, K.; Forde, C.G. Consistency of eating rate, oral processing behaviours and energy intake across meals. Nutrients 2017, 9, 981. [Google Scholar] [CrossRef] [Scilit] [PubMed]
- Gracia, A.; Albisu, L.M. Food consumption in the European Union: Main determinants and country differences. Agribusiness 2001, 17, 469–488. [Google Scholar] [CrossRef] [Scilit]
- The Netherlands Nutrition Centre. Richtlijnen Schijf van Vijf, 4th ed.; The Netherlands Nutrition Centre: The Hague, The Netherlands, 2016. [Google Scholar]
- van Lee, L.; Geelen, A.; Van Huysduynen, E.J.C.H.; De Vries, J.H.M.; Van’t Veer, P.; Feskens, E.J.M. The Dutch Healthy Diet index (DHD-index): An instrument to measure adherence to the Dutch Guidelines for a healthy diet. Nutr. J. 2012, 11, 49. [Google Scholar] [CrossRef] [Scilit] [PubMed]
- Campbell, C.L.; Wagoner, T.B.; Foegeding, E.A. Designing foods for satiety: The roles of food structure and oral processing in satiation and satiety. Food Struct. 2016, 13, 1–12. [Google Scholar] [CrossRef] [Scilit]

| Eating Rate (g/min) | Energy Intake Rate (kJ/min) | |||||||
|---|---|---|---|---|---|---|---|---|
| Including Liquids 1 | Excluding Liquids 2 | Including Liquids 1 | Excluding Liquids 2 | |||||
| r | p | r | p | r | p | r | p | |
| Food Composition | ||||||||
| Energy (kJ/100 g) | −0.45 | <0.0001 | −0.57 | <0.0001 | 0.08 | 0.19 | 0.43 | <0.0001 |
| Protein (g/100 g) | −0.31 | <0.0001 | −0.27 | <0.0001 | −0.002 | 0.97 | 0.19 | <0.01 |
| Fat (g/100 g) | −0.29 | <0.0001 | −0.31 | <0.0001 | 0.16 | 0.01 | 0.47 | <0.0001 |
| Carbohydrate (g/100 g) | −0.33 | <0.0001 | −0.48 | <0.0001 | −0.02 | 0.75 | 0.12 | 0.07 |
| Mono- and disaccharides (g/100 g) | −0.05 | 0.47 | 0.01 | 0.89 | 0.001 | 0.98 | 0.02 | 0.78 |
| Polysaccharides (g/100 g) | −0.34 | <0.0001 | −0.47 | <0.0001 | −0.13 | <0.05 | −0.02 | 0.82 |
| Fiber (g/100 g) | −0.33 | <0.0001 | −0.33 | <0.0001 | −0.20 | <0.01 | −0.16 | 0.02 |
| Water (g/100 g) | 0.46 | <0.0001 | 0.61 | <0.0001 | −0.03 | 0.63 | −0.33 | <0.0001 |
| Sodium (mg/100 g) | −00.31 | <0.0001 | −0.30 | <0.0001 | −0.07 | 0.25 | 0.11 | 0.10 |
| Taste Intensities | ||||||||
| Sweet | 0.11 | 0.09 | −0.02 | 0.83 | 0.35 | <0.0001 | 0.41 | <0.0001 |
| Sour | 0.34 | <0.0001 | 0.48 | <0.0001 | 0.15 | 0.03 | −0.10 | 0.18 |
| Bitter | 0.08 | 0.21 | −0.01 | 0.92 | −0.06 | 0.38 | −0.08 | 0.26 |
| Umami | −0.17 | 0.01 | −0.00 | >0.99 | −0.12 | 0.08 | 0.05 | 0.47 |
| Salt | −0.27 | <0.001 | −0.19 | <0.01 | −0.06 | 0.39 | 0.19 | <0.01 |
| Fat | −0.21 | <0.01 | −0.01 | 0.84 | 0.28 | <0.0001 | 0.61 | <0.0001 |
| Eating Rate (g/min) | p2 | Energy Intake Rate (kJ/min) 1 | p 2 | |||||||
|---|---|---|---|---|---|---|---|---|---|---|
| Quartile 1 | Quartile 2 | Quartile 3 | Quartile 4 | Quartile 1 | Quartile 2 | Quartile 3 | Quartile 4 | |||
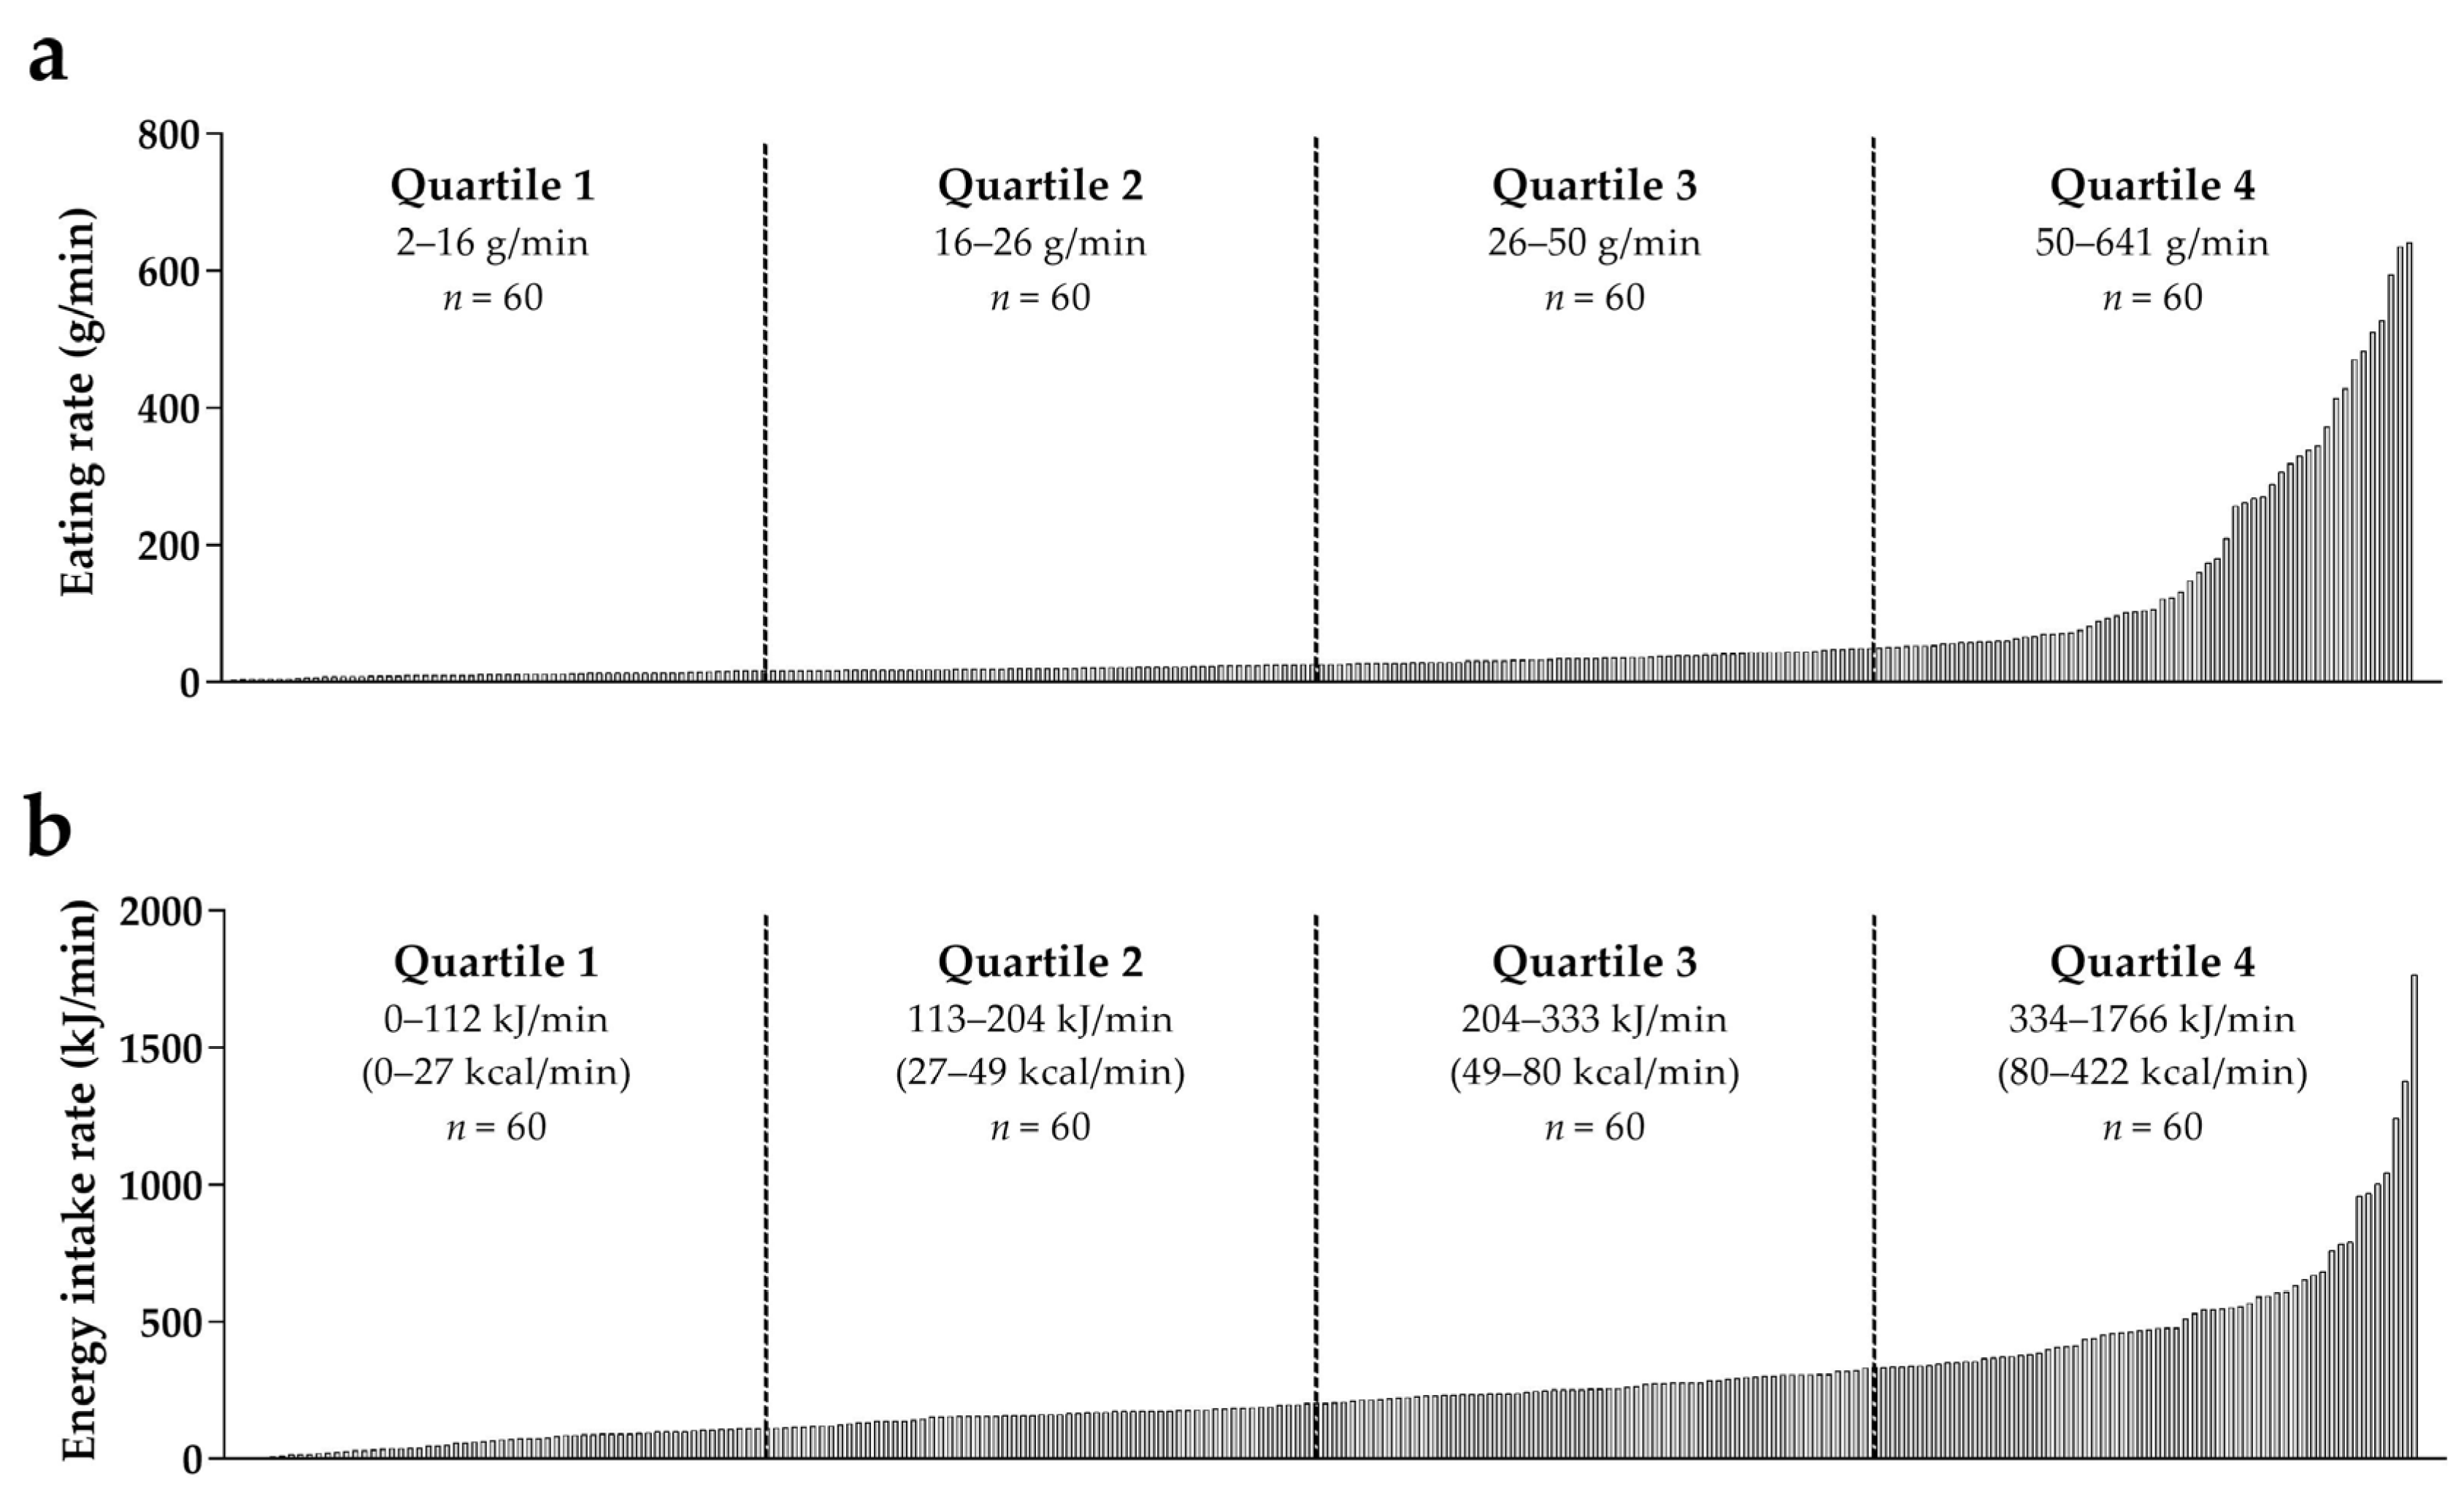
| 2–16 g/min (n = 60) | 16–26 g/min (n = 60) | 26–50 g/min (n = 60) | 50–641 g/min (n = 60) | 0–112 kJ/min (n = 60) | 113–204 kJ/min (n = 60) | 204–333 kJ/min (n = 60) | 334–1766 kJ/min (n = 60) | |||
| Food Texture | <0.0001 | 0.0001 | ||||||||
| Liquids | 0 (0.0) | 0 (0.0) | 1 (1.7) | 29 (48.3) | 10 (16.7) | 2 (3.3) | 0 (0.0) | 18 (30.0) | ||
| Semi-solids | 3 (5.0) | 3 (5.0) | 6 (10.0) | 15 (25.0) | 5 (8.3) | 8 (13.3) | 7 (11.7) | 7 (11.7) | ||
| Soft solids | 18 (30.0) | 37 (61.7) | 40 (66.7) | 12 (20.0) | 24 (40.0) | 29 (48.3) | 34 (56.7) | 20 (33.3) | ||
| Hard solids | 39 (65.0) | 20 (33.3) | 13 (21.7) | 4 (6.7) | 21 (35.0) | 21 (35.0) | 19 (31.7) | 15 (25.0) | ||
| Dutch Dietary Guidelines | >0.05 | <0.0001 | ||||||||
| Recommended | 14 (23.3) | 14 (23.3) | 26 (43.3) | 20 (33.3) | 35 (58.3) | 21 (35.0) | 12 (20.0) | 6 (10.0) | ||
| Not recommended | 46 (76.7) | 46 (76.7) | 34 (56.7) | 40 (66.7) | 25 (41.7) | 39 (65.0) | 48 (80.0) | 54 (90.0) | ||
| Food Group | Energy Intake Rate (kJ/min) Relative to Food Group | ||
|---|---|---|---|
| Low | Medium | High | |
| Potatoes (n = 6) | |||
| Description | Boiled potatoes 2 (n = 2) | Mashed and (deep-)fried potatoes (n = 4) | |
| Energy intake rate | 76 (64–87) kJ/min | 248 (183–308) kJ/min | |
| Eating rate | 23 (18–28) g/min | 32 (22–52) g/min | |
| Energy density | 332 (311–352) kJ/100 g | 917 (349–1300) kJ/100 g | |
| Vegetables (n = 24) | |||
| Description | Raw vegetables 2 (n = 5) | Boiled 2 and pickled vegetables (n = 17) | Vegetables with added energy (n = 2) |
| Energy intake rate | 28 (10–73) kJ/min | 46 (10–119) kJ/min | 131 (108–153) kJ/min |
| Eating rate | 36 (12–76) g/min | 37 (13–89) g/min | 48 (44–51) g/min |
| Energy density | 81 (52–139) kJ/100 g | 121 (70–291) kJ/100 g | 275 (247–303) kJ/100 g |
| Legumes (n = 2) | |||
| Description | Tinned brown beans 2 (n = 1) | Tinned beans in tomato sauce (n = 1) | |
| Energy intake rate | 129 kJ/min | 176 kJ/min | |
| Eating rate | 28 g/min | 45 g/min | |
| Energy density | 460 kJ/100 g | 393 kJ/100 g | |
| Fruits, nuts and olives (n = 20) | |||
| Description | Fruit (excluding soft fruit) 2 (n = 8) | Olives, conserved fruit and soft fruit 2 (n = 7) | Nuts 3, apple sauce (n = 5) |
| Energy intake rate | 111 (60–176) kJ/min | 164 (99–278) kJ/min | 349 (206–479) kJ/min |
| Eating rate | 46 (26–73) g/min | 52 (12–97) g/min | 39 (8–147) g/min |
| Energy density | 243 (193–331) kJ/100 g | 487 (123–1382) kJ/100 g | 2053 (325–2586) kJ/100 g |
| Dairy products (n = 26) | |||
| Description | Plain yoghurt and fromage frais 3, cheese 2 (n = 8) | Deserts other than plain yoghurt or fromage frais (n = 8) | Dairy drinks 3 (n = 10) |
| Energy intake rate | 225 (146–319) kJ/min | 412 (231–546) kJ/min | 749 (200–1766) kJ/min |
| Eating rate | 58 (12–132) g/min | 80 (33–122) g/min | 322 (71–527) g/min |
| Energy density | 776 (156–1529) kJ/100 g | 643 (300–1453) kJ/100 g | 232 (122–375) kJ/100 g |
| Cereals and cereal products (n = 56) | |||
| Description | Hard and dry products 3, plain bread slices 3 (n = 23) | Other (e.g., bread with topping, buns, pasta, rice) 3 (n = 33) | |
| Energy intake rate | 137 (37–258) kJ/min | 241 (106–549) kJ/min | |
| Eating rate | 9 (2–13) g/min | 24 (10–54) g/min | |
| Energy density | 1639 (990–2261) kJ/100 g | 1069 (555–1481) kJ/100 g | |
| Meat and meat products (n = 18) | |||
| Description | Fresh meat (excluding minced meat) 3 (n = 2) | Minced meat 3 and processed meat (n = 16) | |
| Energy intake rate | 176 (117–234) kJ/min | 300 (71–654) kJ/min | |
| Eating rate | 27 (18–35) g/min | 29 (13–58) g/min | |
| Energy density | 664 (661–667) kJ/100 g | 1039 (520–1804) kJ/100 g | |
| Fish and shellfish (n = 6) | |||
| Description | Fish and fish products 2 (n = 6) | ||
| Energy intake rate | 234 (123–372) kJ/min | ||
| Eating rate | 31 (24–48) g/min | ||
| Energy density | 761 (414–918) kJ/100 g | ||
| Eggs and egg products (n = 1) | |||
| Description | Boiled egg 2 (n = 1) | ||
| Energy intake rate | 173 kJ/min | ||
| Eating rate | 32 g/min | ||
| Energy density | 535 kJ/100 g | ||
| Sugar and confectionery (n = 19) | |||
| Description | Hard confectionary (non-chocolate), ice cream (n = 5) | Soft confectionary (non-chocolate) (n = 6) | Chocolate, candy bars, fruit drink (n = 8) |
| Energy intake rate | 100 (63–156) kJ/min | 210 (140–278) kJ/min | 369 (185–610) kJ/min |
| Eating rate | 9 (4–16) g/min | 14 (9–19) g/min | 47 (8–268) g/min |
| Energy density | 1357 (856–1676) kJ/100 g | 1513 (1358–1796) kJ/100 g | 1898 (227–2342) kJ/100 g |
| Cakes (n = 26) | |||
| Description | Dry cakes, biscuits (n = 15) | Cakes, pies, pastries, puddings (non-milk-based) (n = 11) | |
| Energy intake rate | 317 (166–685) kJ/min | 436 (239–636) kJ/min | |
| Eating rate | 17 (9–35) g/min | 33 (18–58) g/min | |
| Energy density | 1861 (1314–2205) kJ/100 g | 1409 (826–1868) kJ/100 g | |
| Non-alcoholic beverages (n = 15) | |||
| Description | Non- and very low caloric beverages 3 (n = 5) | Caloric beverages (n = 10) | |
| Energy intake rate | 1 (0–3) kJ/min | 673 (92–1379) kJ/min | |
| Eating rate | 334 (56–635) g/min | 365 (59–641) g/min | |
| Energy density | 1 (0–5) kJ/100 g | 173 (68–232) kJ/100 g | |
| Alcoholic beverages (n = 1) | |||
| Description | Pilsner beer (n = 1) | ||
| Energy intake rate | 198 kJ/min | ||
| Eating rate | 106 g/min | ||
| Energy density | 187 kJ/100 g | ||
| Condiments and sauces (n = 7) | |||
| Description | Tomato sauces (n = 3) | Mayonnaises and similar (n = 4) | |
| Energy intake rate | 93 (78–111) kJ/min | 262 (207–321) kJ/min | |
| Eating rate | 28 (17–44) g/min | 20 (11–31) g/min | |
| Energy density | 375 (253–546) kJ/100 g | 1493 (975–2733) kJ/100 g | |
| Soups, bouillon (n = 7) | |||
| Description | Soup from cube or package (n = 3) | Soup with more (semi-) solid components (n = 4) | |
| Energy intake rate | 50 (38–74) kJ/min | 137 (104–199) kJ/min | |
| Eating rate | 89 (41–174) g/min | 66 (59–70) g/min | |
| Energy density | 86 (22–140) kJ/100 g | 214 (148–337) kJ/100 g | |
| Snacks (n = 6) | |||
| Description | Spring roll fried (n = 1) | Other warm savory snacks (n = 5) | |
| Energy intake rate | 204 kJ/min | 494 (401–761) kJ/min | |
| Eating rate | 27 g/min | 36 (27–51) g/min | |
| Energy density | 757 kJ/100 g | 1366 (1139–1596) kJ/100 g | |
© 2017 by the authors. Licensee MDPI, Basel, Switzerland. This article is an open access article distributed under the terms and conditions of the Creative Commons Attribution (CC BY) license (http://creativecommons.org/licenses/by/4.0/).
Share and Cite
Van den Boer, J.; Werts, M.; Siebelink, E.; De Graaf, C.; Mars, M. The Availability of Slow and Fast Calories in the Dutch Diet: The Current Situation and Opportunities for Interventions. Foods 2017, 6, 87. https://doi.org/10.3390/foods6100087
Van den Boer J, Werts M, Siebelink E, De Graaf C, Mars M. The Availability of Slow and Fast Calories in the Dutch Diet: The Current Situation and Opportunities for Interventions. Foods. 2017; 6(10):87. https://doi.org/10.3390/foods6100087
Chicago/Turabian StyleVan den Boer, Janet, Melanie Werts, Els Siebelink, Cees De Graaf, and Monica Mars. 2017. "The Availability of Slow and Fast Calories in the Dutch Diet: The Current Situation and Opportunities for Interventions" Foods 6, no. 10: 87. https://doi.org/10.3390/foods6100087
APA StyleVan den Boer, J., Werts, M., Siebelink, E., De Graaf, C., & Mars, M. (2017). The Availability of Slow and Fast Calories in the Dutch Diet: The Current Situation and Opportunities for Interventions. Foods, 6(10), 87. https://doi.org/10.3390/foods6100087

