Metabolomics Analysis of the Deterioration Mechanism and Storage Time Limit of Tender Coconut Water during Storage


College of Food Science and Engineering, Hainan University, Haikou 57022, China
*
Author to whom correspondence should be addressed.
Foods 2020, 9(1), 46; https://doi.org/10.3390/foods9010046
Submission received: 5 November 2019
/
Revised: 23 December 2019
/
Accepted: 1 January 2020
/
Published: 3 January 2020
(This article belongs to the Section Food Quality and Safety)
Abstract
:Tender coconut water tastes sweet and is enjoyed by consumers, but its commercial development is restricted by an extremely short shelf life, which cannot be explained by existing research. UPLC-MS/MS-based metabolomics methods were used to identify and statistically analyze metabolites in coconut water under refrigerated storage. A multivariate statistical analysis method was used to analyze the UPLC-MS/MS datasets from 35 tender coconut water samples stored for 0–6 weeks. In addition, we identified other differentially expressed metabolites by selecting p-values and fold changes. Hierarchical cluster analysis and association analysis were performed with the differentially expressed metabolites. Metabolic pathways were analyzed using the KEGG database and the MetPA module of MetaboAnalyst. A total of 72 differentially expressed metabolites were identified in all groups. The OPLS-DA score chart showed that all samples were well grouped. Thirty-one metabolic pathways were enriched in the week 0–1 samples. The results showed that after a tender coconut is peeled, the maximum storage time at 4 °C is 1 week. Analysis of metabolic pathways related to coconut water storage using the KEGG and MetPA databases revealed that amino acid metabolism is one of the main causes of coconut water quality deterioration.
1. Introduction
The coconut (Cocos nucifera L.) originates from Palmae Cocos. Originally cultivated in Vietnam, Thailand, Myanmar, Malaysia, and the Philippines [1], coconuts are now also planted in Southern China, including Taiwan, Southern Yunnan, and other tropical areas. The fruit of the coconut is nearly round. A coconut has three layers of peel: Exocarp, mesocarp, and endocarp. The outermost layer, which is typically smooth with a greenish color, is called the exocarp. The next layer is the fibrous husk, or mesocarp, which ultimately surrounds the hard woody layer called the endocarp. Inside the endocarp are the solid endosperm (coconut meat) and liquid endosperm (coconut water). A tender coconut is one with a maturity of 6–9 months, and its water is directly consumed or processed into a variety of beverages. For half a century, extensive research has been conducted on the nutrition of coconut water, which contains 17 amino acids required by the human body [2]. The essential amino acids in coconut water are complete and nutrient-rich, and some are even more nutrient-dense than those in milk [3]. Moreover, coconut water has numerous medicinal properties, such as detoxification, antibacterial, anti-inflammatory, rejuvenation, digestion, and diuretic properties. Coconut water also has a therapeutic effect on gastric dysfunction, dysentery and child malnutrition and offers some control over hypertension, kidney stones, and urethral stones [4,5,6]. Moreover, coconut water affords protection against the induction of myocardial infarctions [7]. As a natural drink with high nutritional value, coconut water can replenish lost body fluids and alleviate electrolyte imbalance; in emergencies, coconut water can be injected intravenously into patients for hydration [8]. In addition, coconut water can be used as a plant tissue culture medium [9,10,11] because it has a variety of amino acids, cytokinins, auxin, and other nutrients [12].
For a large number of coconut farmers, the growing popularity of coconut water as a healthy drink may be very positive. However, research shows that tender coconuts can be stored for less than a month only under refrigerated conditions [13]. Fresh coconut water is sterile, so there are other reasons for its deterioration. Flavor compounds in tender coconut water may be formed from the degradation of fatty acids, which is probably caused by oxidative metabolism involving mechanisms such as p-oxidation and lipoxygenase (LOX) pathways [14]. During storage, the levels of nonanal and octanal, which could indicate the generation of an off-flavor, increase significantly in coconut water from commercially trimmed tender coconut. Furthermore, tender coconut stored at normal temperature exhibits obvious exocarp shriveling [15], continually increasing weight loss and the beginnings of exocarp browning and discoloration [16]. The high transportation costs and extremely short storage periods have restricted the development of tender coconut as a commercial product.
Tender coconut water undergoes a series of biological and chemical changes during harvesting. To date, research that uses metabolomics to study the changes in tender coconut water has been rare. Metabolomics is a research method similar to genomics and proteomics and is widely used to analyze changes in the quality of plants. Plant metabolomics mainly concerns metabolic analysis and metabolite fingerprinting of single plants, in which the metabolites in plant organs and tissues are qualitatively and quantitatively analyzed. In addition, metabolomics is used to compare and identify plants of the same species but different genotypes and to study the interaction between plants and herbivores, including the effects of plant defense metabolites on herbivore genotypes and resistance [17,18,19,20,21,22,23,24,25,26]. In this work, metabolomics was used to analyze the quality and metabolic changes in tender coconut during storage after harvest, and the important reasons for the deterioration of coconut were revealed, thus providing a theoretical basis for the preservation of fresh coconut after harvest.
2. Materials and Methods
2.1. Chemicals and Reagents
LC-MS-grade methanol was obtained from WOKAI. LC-MS-grade acetonitrile, 2-chlorophenylalanine, formic acid, and ammonium formate were obtained from Aladdin. Double-distilled water (ddH2O) was used.
2.2. Sample Collection
Hainan-native high-growing coconut was used as an example to study the growth characteristics of tender coconut. All coconuts were grown to 8 months old and had uniform color, with no surface damage or insect-borne infections. After the exocarp and mesocarp were removed, the coconuts were stored in a refrigerator at 4 °C. To eliminate any biological differences in the samples, the coconut water of 15 coconuts was taken every week, and the coconut water of every three coconuts was mixed into one sample, totaling 5 parallel samples. The coconut water samples were stored for 0 to 6 weeks, collected (coconut water collected in weeks 0–6 was the first to seventh groups of samples), packed in aluminum foil bags, frozen in liquid nitrogen and immediately placed in a freezer at −79 °C.
2.3. Determination of Physical and Chemical Indexes
The electroconductibility of tender coconut water was measured by an m-t-fe30 LCD-D instrument, the sugar content was measured by a Pal-2 hand-held saccharimeter, and the acidity and alkalinity were measured by an m-t-fe20 acidity-alkalinity meter.
2.4. Preparing Samples for UPLC-MS/MS Analysis
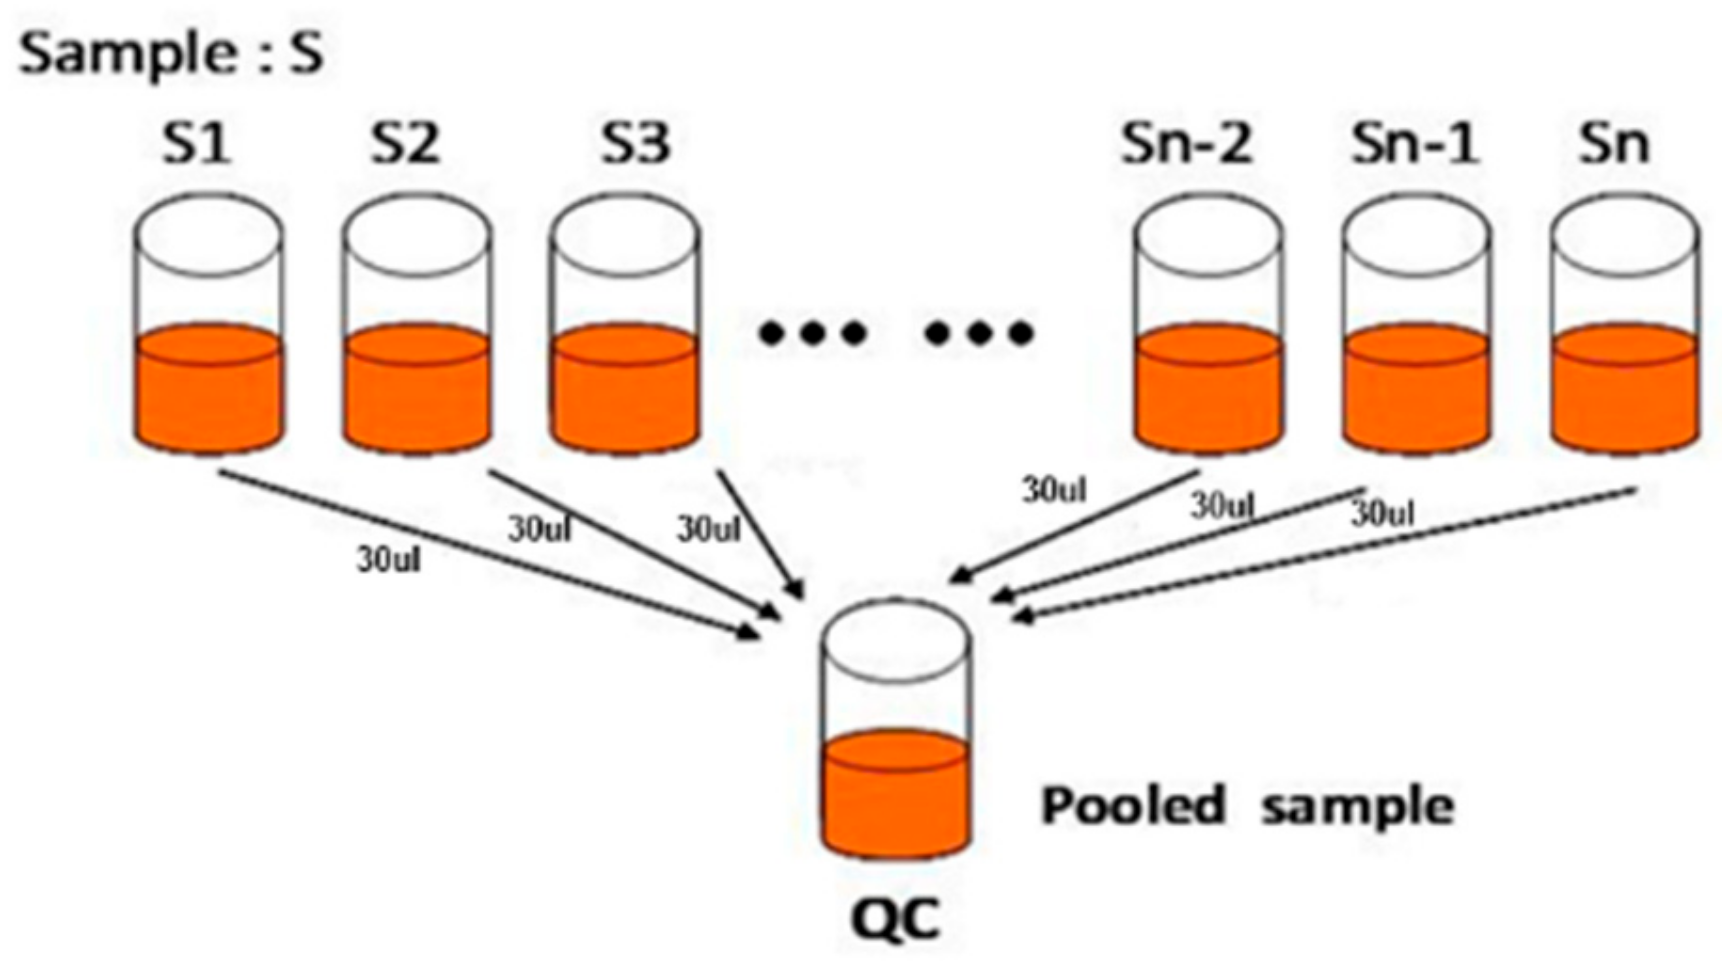
All samples were thawed at 4 °C. Next, 100 mg of the sample was transferred to a 2 mL centrifuge tube containing 0.3 mL of ethanol, ultrasonicated for 30 min at 25 °C and centrifuged at 12,000 rpm for 10 min. The supernatant was filtered through a 0.22 µm membrane, and the obtained filtrate was analyzed by UPLC-MS/MS. Thirty microliters of filtrate was obtained from each supernatant and mixed to make the QC sample (Figure 1). Quality control samples were used to monitor the deviation in the analysis results of pooled sample mixtures and to compare this deviation with the error caused by the analyzer itself. The remaining samples were tested by UPLC-MS/MS [27,28].
2.5. Metabolomics Analysis Based on UPLC-MS/MS
A Thermo Ultimate 3000 system was used with an ACQUITY UPLC HSS T3 (2.1 × 150 mm, 1.7 µm) column and the following parameters: autosampler temperature of 8 °C, flow rate of 250 μL/min, column oven temperature of 38 °C, and sample size of 2 μL. Gradient elution was performed in positive ion mode with a mobile phase consisting of 0.1% formic acid in water (A) and 0.1% formic acid in acetonitrile (B) and in negative ion mode with a mobile phase consisting of 5 mM ammonium formate in water (C) and acetonitrile (D). The gradient elution procedure was as follows: 0–1 min, 2% B/D; 1–9 min, 2%–48% B/D; 9–12 min, 48%–98% B/D; 12–13.5 min, 98% B/D; 13.5–14 min, 98%–2% B/D; and 14–17 min, 2% B/D [29].
MS analysis was performed on a Thermo Q Exactive Focus with electrospray ionization (ESI) system with a positive ion spray voltage of 3.80 kV and a negative ion spray voltage of 2.50 kV. The capillary temperature was 325 °C, the resolution was 70,000, and the scanning range was 81–1000. Data dependent acquisition (DDA) MS/MS experiments were performed with HCD scan. The collision voltage was 30 eV. Dynamic exclusion was used to remove unnecessary MS/MS information [29].
2.6. Data Handling and Multivariate Statistical Analysis
The raw data (Supplementary Materials) obtained were translated into mzXML format by ProteoWizard [30]. Peak recognition, peak filtering, and peak alignment were performed using the edited R XCMS package [30,31]. The data were exported to Excel tables for calculation. Because data of different orders of magnitude were to be compared, the data were subjected to batch normalization of the peak area.
Due to the multidimensional nature of metabolomic data and the high correlation between certain variables, traditional univariate analysis could not be run quickly, fully and accurately to mine potentially useful information from the data. Therefore, when analyzing metabolomic data, it is important to use chemometrics and multivariate statistics for dimension reduction and classification of the collected multidimensional data to extract the most useful information. In this experiment, the data were subjected to autoscaling and mean-centering and were scaled to unit variance (UV) before multivariate statistical analysis to obtain more reliable and intuitive results. The multivariate statistical analysis (R language ropes package [32]) methods used were PCA, PLS-DA, and OPLS-DA.
3. Results
3.1. Physical and Chemical Indicators of Change
The physical and chemical indicators corresponding to the storage time are shown in Figure 2. During weeks 0–1, the conductivity of the samples changed significantly (Figure 2a). However, there was no significant change in the conductivity of the samples from the first week of storage to the end (week 6). The °Brix of the samples decreased from 5.74 to 5.56 in weeks 0–1 but increased to 6.48 from the first week until the end (Figure 2b), reflecting drastic fluctuations during storage. The decrease in °Brix in weeks 0–1 may be due to high metabolism, while the continuous increase in °Brix in weeks 1–6 may be due to the decrease in metabolic activity and evaporation of coconut water during storage (a coconut loses approximately 10 g of water a week). In weeks 0–1, the pH of the samples quickly rose from 5.25 to 6.05. However, there was no significant change in sample pH from the first week to the sixth week of storage (Figure 2c). The increase in pH may have been due to organic acid consumption processes, such as the tricarboxylic acid cycle, gluconeogenesis, zymosis and amino acid interconversion [33]. This section is divided by subheadings and provides a concise and precise description of the experimental results, their interpretation and the experimental conclusions that can be drawn.
The ratio of sugar to acid (Figure 2d) is an important indicator that can affect the taste, quality and shelf life of food. The sugar-to-acid ratio of the samples dropped rapidly from 1.09 to 0.91 in, corresponding to the significant changes in pH and °Brix. However, from the first week to the end of storage (6 weeks), the pH of the samples increased slowly and steadily, while the °Brix increased steadily towards the end. From the first to the sixth week, the ratio of sugar to acid increased slowly, mainly because of the increase in °Brix. According to the sugar-to-acid ratio data, the flavor of tender coconut water changed significantly after one week of storage, which indicates that the storage period of the tender coconut water may not exceed one week.
3.2. Metabolic Profile Analysis of Tender Coconut Water during Storage
Positive ion mode (NT-pos) and negative ion mode (NT-neg) are two scanning modes of MS. After the sample is ionized by the ESI source, there will be ions with a positive charge (M + H, M + NH4, M + Na, etc.) and negative charge (M-H, M + Cl, M + CH3COO, etc.) at the same time. According to the differences in the physical and chemical properties of the substances, some metabolites will be positively charged, and some will be negatively charged. To obtain comprehensive metabonomics information, two modes are used simultaneously.
As shown in Figure 3, under the conditions of NT-pos and NT-neg, QC samples are intensively distributed with good repeatability, indicating that the system is stable.
Metabolites are the products of metabolism in animals or plants. The up-regulated or down-regulated metabolites between the experimental group and the control group are called differentially expressed metabolites, which can identify abnormal metabolic changes and can also be discussed in combination with pathways related to differentially expressed metabolites. The differentially expressed metabolites are displayed in Figure 4a,b. In this study, metabolites were screened for differential expression, and the relevant conditions are as follows:
p-value: Student’s t test, p-value ≤ 0.05 indicates a statistically significant difference. VIP: Variable Importance in the Projection; indicates the importance of variables to the model. One-way ANOVA p-value: Comparison of the mean of single factors and multiple independent samples. Student’s t test was used between two groups, and one-way ANOVA was used between multiple groups.
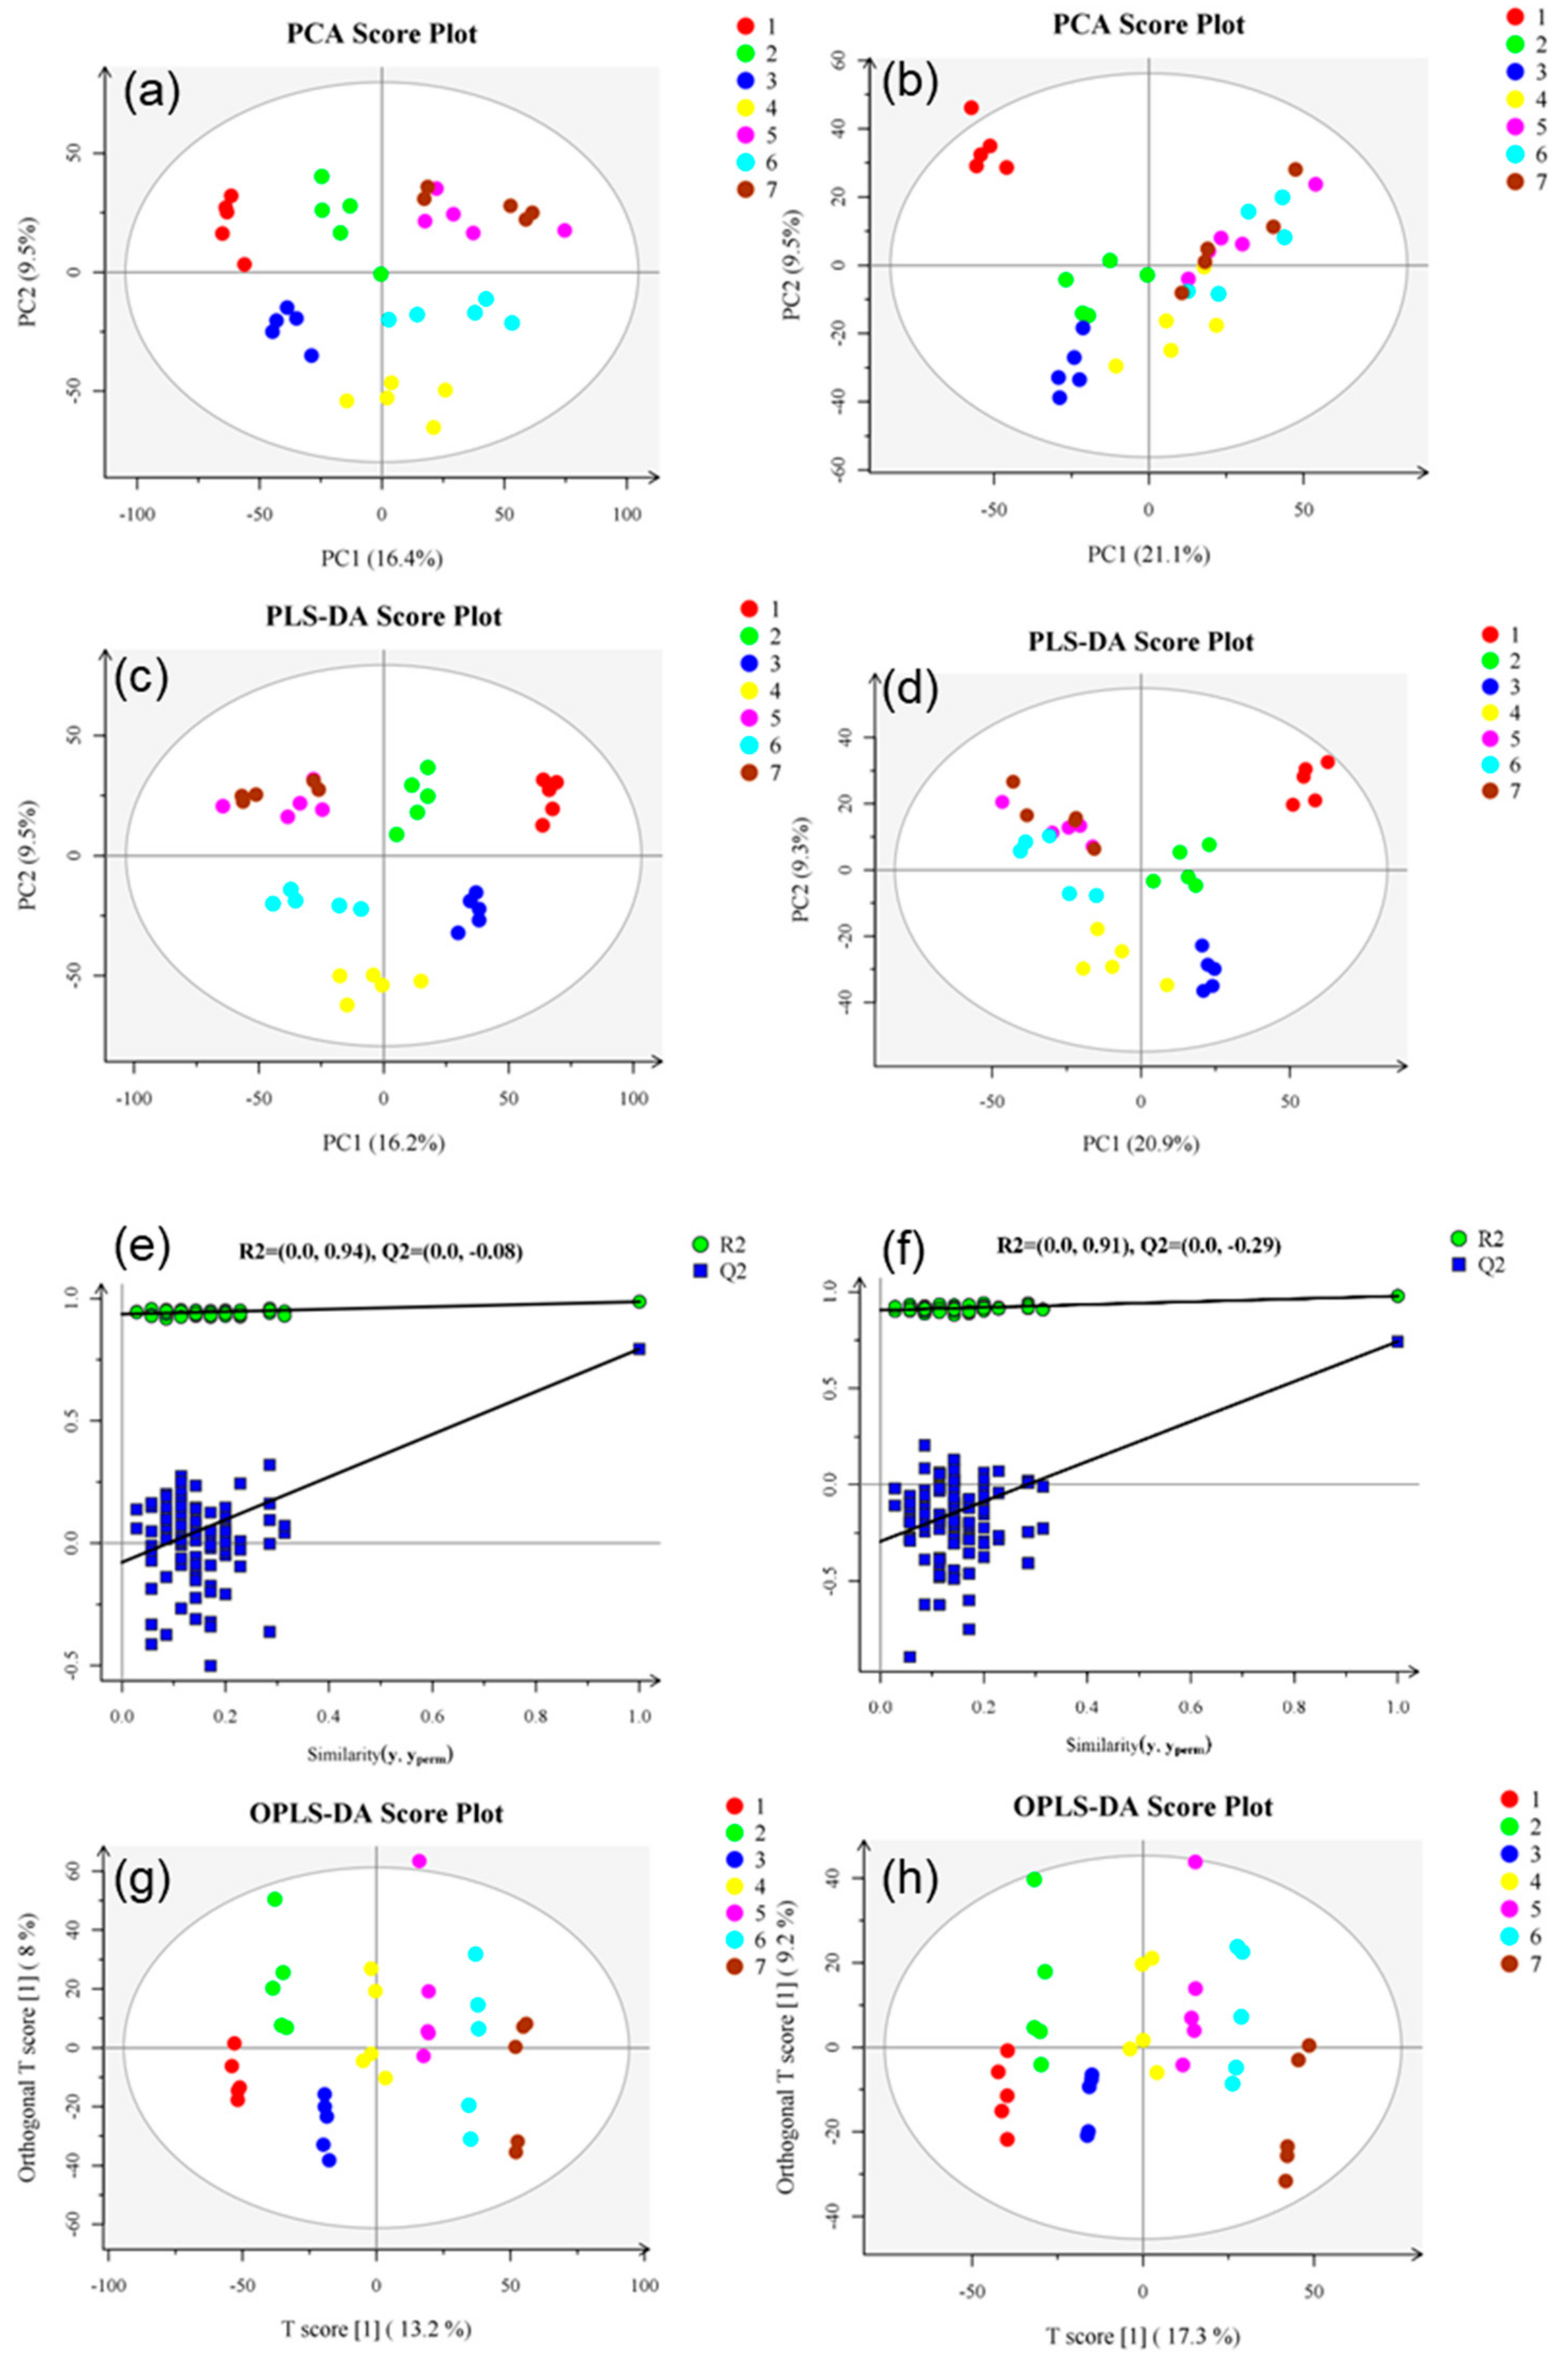
In this study, condition 1 + 2 was used for metabolite screening, Student’s t test was used between two groups, and one-way ANOVA was used between multiple groups. FDR was used to correct the p-value and control the final analysis results using the Benjamin–Hochberg (BH) [36] method. Positive ion mode was used to obtain 2923 differentially expressed metabolites, and negative ion mode was used to obtain 1695 differentially expressed metabolites. Figure 2 shows the statistical results of differentially expressed metabolites to be identified. PCA, PLS-DA, and OPLS-DA were analyzed in all groups, and a PCA score chart was drawn (Figure 5a,b). Under NT-pos conditions, the samples were all in the 95% confidence interval, the number of separation weeks was not enough, and the samples in groups 5 and 7 had a small overlap. Under NT-neg conditions, the number of separation weeks was very poor, most of the samples had 95% confidence intervals, except for one dot in group 1. PLS-DA showed some improvement (Figure 5c,d). Under NT-pos conditions, all samples were well differentiated, while under NT-neg conditions, the samples of groups 5, 6, and 7 overlapped. The OPLS-DA score showed that all samples were well differentiated under NT-pos and NT-neg conditions (Figure 5g,h). Permutation plots (Figure 5e,f) were used for effectively assessing whether the current PLS-DA model was over-fitting. Any one of the following criteria needed to be satisfied: (1) All Q2 points were lower than the rightmost original Q2 point; (2) the regression line of the Q2 point was less than or equal to 0 at the intersection of the ordinate. As shown, all blue Q2 points under NT-pos and NT-neg conditions were below the rightmost original blue Q2 point. Furthermore, the OPLS-DA score chart shows that all samples were well grouped. Compared with PLS-DA, OPLS-DA can effectively reduce the complexity of the model and enhance the interpretation ability of the model without reducing the prediction ability of the model to check the differences between groups to the greatest extent.
3.3. Metabolomics Analysis of Tender Coconut Water
To identify the metabolites, their exact molecular weight was confirmed (molecular weight error < 20 ppm). The fragment information (including the mass nuclear ratio, retention time and peak area of the identified metabolite) obtained according to the MS/MS mode was matched in the Human Metabolome Database (HMDB) (Metlin, MassBank, Lipid Maps, mzclound) and a self-built standards database to obtain accurate metabolite information. Finally, a total of 112 differentially expressed metabolites were matched (Table A1). Then, hierarchical clustering analysis was performed on each group of differentially expressed metabolites (Figure 6). At the bottom of the tree, each cluster extends a vertical line and then is aggregated by a horizontal line; each horizontal line is a category. The horizontal lines continue to aggregate from the bottom to the top. The more horizontal lines aggregate, the more concentrated the categories are. The top horizontal line of the tree divides the samples into two categories. When the distribution pattern of the two categories was observed, all samples in the first group (all of week 0) were distributed in the first category, while all others (week 1–6) were distributed in the second category. This finding indicates that the first and second groups of samples have the largest difference in metabonomics.
Z-score is calculated based on the relative content of metabolites [37,38], which is used to measure the relative content of metabolites at the same level, and the formula is:
where x represents a specific fraction. μ represents average, while σ represents standard deviation.
z = (x − μ)/σ
The statistical analysis of z-score is as shown in Figure 7. The z-score of the second group was calculated, while taking the first group as the control group. The metabolite is downregulated when the z-score is negative, and the metabolite is upregulated when the z-score is positive. The z-score chart shows that there are 52 upregulated differentially expressed metabolites and 14 downregulated differentially expressed metabolites in the first and second group. Yohimbic acid was thus identified as the most influential upregulated metabolite and vinpocetine was the most influential downregulated metabolite between groups 1 and 2.
Differentially expressed metabolite correlation analysis was used to study the consistency of the trends among metabolites [39,40]. The correlations between individual metabolites were analyzed by calculating the Pearson correlation coefficients or the Spearman rank correlation coefficients for all metabolite pairs. Metabolite correlation often reveals the synergy of changes between metabolites: Positive correlation reflects the same trend for metabolites, and negative correlation reflects a different trend. This analysis was used to investigate the relationship between 56 major differentially expressed metabolites (Table A2) in all samples of the first and second groups. The correlation matrices of the differentially expressed metabolites are shown in Figure 8. In the figure, the blue dot indicates a negative correlation, and the red dot indicates a positive correlation. The correlation coefficient is between −1 and 1, and the different color depths are used to represent different correlations. When there is a strong linear relationship between two metabolites, the correlation coefficient is either 1 or −1, reflecting either a positive or negative correlation, respectively. In addition, the cor.test () function in R was used for statistical analysis of the metabolite association results, and a p-value ≤ 0.05 was considered significant. As shown in Figure 8, there are more than 20 connections between 12 types of amino acids and other metabolites, among which L-lysine is connected with all the other 55 metabolites. L-threonine is connected with 51 metabolites, and L-methionine is connected with 45 metabolites. It has also been confirmed that amino acids play an important role in metabolism.
MetPA (www.metaboanalyst.ca) [41] is based mainly on the KEGG metabolic pathway. The MetPA database identifies metabolic pathways that may be disturbed by organisms through metabolic pathway concentration and topological analysis and is used to analyze the metabolic pathways of metabolites. The data analysis algorithm used is a hypergeometric test, and the topological structure of the pathway is relative betweenness centrality. Based on the metabolic pathway analysis performed using the KEGG pathway and MetPA database (Figure 9), the metabolic pathways enriched in 56 differentially expressed metabolites in the first and second groups were analyzed in this study. Thirty-one metabolic pathways were found, each represented by a dot. The larger the abscissa is, the larger the dot is, indicating that this metabolic pathway is more important to the metabolism of the sample. The larger the ordinate is, the darker the dot color is, indicating that this metabolic pathway is more enriched.
The main metabolic pathways are as follows. (1) In the metabolism of cysteine and methionine, cysteine is converted from serine (via acetylserine) by transfer of hydrogen sulfide and metabolized to pyruvate via multiple routes, and methionine is synthesized from aspartate [42,43]. (2) The metabolism of glycine, serine, and threonine results in 3-phospho-D-glycerate, which is an intermediate in glycolysis, produces serine and glycine, and reduces aspartate acid, which produces threonine in plants and bacteria [44]. (3) In the metabolism of arginine and proline, arginine is used to synthesize putrescine by arginase and ornithine decarboxylase, and glutamic acid is used to synthesize proline by delta-1-pyrroline-5-carboxylate synthetase, pyrroline-5-carboxylate reduce, glutamate 5-kinase and glutamate-5-semialdehydehydrogenase [45,46]. (4) Aminoacyl-tRNA biosynthesis increases amino acids [47,48]. (5) Valine, leucine and isoleucine biosynthesis increases amino acids through transamination of 3-phospho-D-glycerate and pyruvate consumption [44,49]. (6) Pantothenate and CoA biosynthesis produces 4’-phosphopantethein, which promotes the TCA cycle, β-oxidation, and fatty acid and polyketide biosynthesis pathways as an auxiliary factor.
The three most important metabolic pathways are amino acid pathways: (1) Glycine, serine and threonine metabolism; (2) arginine and proline metabolism; and (3) cysteine and methionine metabolism. Pyruvate, l-serine, 2-oxobutyric acid, l-leucine, putrescine, l-histidine, l-asparagine, l-threonine, pantothenic acid, O-acetyl-l-serine, l-lysine, l-arginine and l-methionine participate in at least two pathways, indicating that these substances are at the nodes of complex network pathways. Pyruvate is involved in 12 pathways, and serine is involved in 7 pathways, indicating that pyruvate and serine are the junction of each pathway. Moreover, pyruvate is closely related to amino acid metabolism. In previous studies, the changes in the quality of tender coconut water were attributed to aldehydes and lipids. In this study, amino acid metabolism was found to be another main cause of deterioration of tender coconut water. During the storage of tender coconut water, a variety of proteases play a key role in the metabolism of amino acids.
4. Conclusions
Samples taken at various time points during the storage of coconut water could be clearly divided into two categories by hierarchical clustering analysis: week 0 and weeks 1, 2, 3, 4, 5, and 6. The physical and chemical indicators showed significant metabolic differences between samples at week 0 and week 1. Thus, on the basis of metabolomics analysis, after tender coconut is peeled, the maximum storage time at 4 °C is week.
Metabonomics provides a direction for the study of physiological and biochemical deterioration of tender coconut during storage. After differentially expressed metabolites produced during coconut water storage were screened, KEGG and MetPA analysis of the metabolic pathways relevant to coconut water storage was performed and revealed that amino acid metabolism is one of the main causes of the deterioration of coconut water quality. These results provide a good theoretical basis for the preservation of tender coconut water.
Supplementary Materials
The following are available online at https://www.mdpi.com/2304-8158/9/1/46/s1.
Author Contributions
Writing—original draft preparation, Y.Z.; validation, W.C.; methodology, W.C.; formal analysis, Y.Y.; investigation, H.C.; resources, W.C.; data curation, Q.Z.; writing—review and editing, Y.Z.; supervision, W.C. All authors have read and agreed to the published version of the manuscript.
Funding
This research was supported by the High-level Talent Project of Hainan Natural Science Foundation(2019RC128), the Natural Science Foundation of Hainan Province of China (ID: 317002), the National Natural Science Foundation of China (IDs: 31640061 and 31801494), and the Hainan University Start-up Scientific Research Projects of China (IDs: kyqd1551 and kyqd1630).
Conflicts of Interest
The authors declare that they have no conflict of interest. This section is not mandatory but may be added if there are patents resulting from the work reported in this manuscript.
Appendix A

Table A1.
Differentially expressed metabolites in all groups.
| Name 1 | m/z 2 | rt 3 | ppm 4 | Exact Mass 5 | Formula | KEGG 6 | Posneg 7 |
|---|---|---|---|---|---|---|---|
| Piperidine | 86.097103 | 130.617 | 8 | 85.1475 | C5H11N | C01746 | pos |
| Pyruvate | 87.007167 | 95.2173 | 19 | 88.06206 | C3H4O3 | C00022 | neg |
| D-Glyceraldehyde | 89.02315 | 23.7384 | 8 | 90.07794 | C3H6O3 | C00577 | neg |
| Acetoin | 89.060419 | 75.4608 | 9 | 88.10512 | C4H8O2 | C00466 | pos |
| Putrescine | 89.107731 | 75.8816 | 10 | 88.1515 | C4H12N2 | C00134 | pos |
| 3-Methyl Pyruvic Acid | 101.02312 | 94.7351 | 13 | 102.0886 | C4H6O3 | C00109 | neg |
| Gamma-Aminobutyric Acid | 104.07055 | 120.134 | 1 | 103.1198 | C4H9NO2 | C00334 | pos |
| Choline | 104.10692 | 90.8299 | 2 | 104.1708 | C5H14NO | C00114 | pos |
| l-Serine | 106.05005 | 87.5235 | 2 | 105.09262 | C3H7NO3 | C00065 | pos |
| Diethanolamine | 106.08649 | 87.4857 | 2 | 105.13568 | C4H11NO2 | C06772 | pos |
| Benzaldehyde | 107.0494 | 353.073 | 3 | 106.1219 | C7H6O | C00193 | pos |
| Uracil | 111.01883 | 122.908 | 11 | 112.08684 | C4H4N2O2 | C00106 | neg |
| l-Proline | 116.07017 | 101.442 | 0 | 115.1305 | C5H9NO2 | C00148 | pos |
| l-Valine | 116.0707 | 112.712 | 9 | 117.14638 | C5H11NO2 | C00183 | neg |
| Glycine Betaine | 118.08633 | 94.5577 | 2 | 117.14638 | C5H11NO2 | C00719 | pos |
| l-Erythrulose | 119.03418 | 94.3132 | 7 | 120.10392 | C4H8O4 | C02045 | neg |
| l-Threonine | 120.0656 | 92.1067 | 2 | 119.1192 | C4H9NO3 | C00188 | pos |
| 4-Hydroxybenzaldehyde | 121.02785 | 536.412 | 14 | 122.12134 | C7H6O2 | C00633 | neg |
| Nicotinic acid | 122.02354 | 121.987 | 4 | 123.10944 | C6H5NO2 | C00253 | neg |
| Nicotinamide | 123.05547 | 116.543 | 0 | 122.12472 | C6H6N2O | C00153 | pos |
| Imidazoleacetic Acid | 127.05018 | 101.293 | 0 | 126.114 | C5H6N2O2 | C02835 | pos |
| 4-Hydroxy-l-Proline | 129.97455 | 135.595 | 16 | 131.1299 | C5H9NO3 | C01015 | neg |
| 5-Oxo-l-Proline | 130.04944 | 195.121 | 2 | 129.114 | C5H7NO3 | C01879 | pos |
| l-Pipecolic Acid | 130.086 | 80.1096 | 1 | 129.157 | C6H11NO2 | C00408 | pos |
| l-Leucine | 130.08668 | 196.186 | 14 | 131.17296 | C6H13NO2 | C00123 | neg |
| Glutaric Acid | 131.03365 | 78.4799 | 13 | 132.11462 | C5H8O4 | C00489 | neg |
| l-Asparagine | 131.04501 | 88.3785 | 9 | 132.118 | C4H8N2O3 | C00152 | neg |
| Agmatine | 131.12911 | 79.1293 | 0 | 130.19162 | C5H14N4 | C00179 | pos |
| l-Isoleucine | 132.10067 | 271.563 | 7 | 131.17296 | C6H13NO2 | C00407 | pos |
| Adenine | 134.04598 | 219.269 | 9 | 135.1269 | C5H5N5 | C00147 | neg |
| Threonate | 135.02871 | 84.5419 | 9 | 136.10332 | C4H8O5 | C01620 | neg |
| p-Salicylic acid | 137.02327 | 115.089 | 8 | 138.12074 | C7H6O3 | C00156 | neg |
| Salicylate | 139.11118 | 706.72 | 4 | 138.122 | C7H6O3 | C00805 | pos |
| 4-Guanidinobutanoic Acid | 146.09205 | 121.961 | 0 | 145.1597 | C5H11N3O2 | C01035 | pos |
| l-Glutamine | 147.07625 | 90.527 | 2 | 146.14458 | C5H10N2O3 | C00064 | pos |
| l-Lysine | 147.11259 | 80.1761 | 1 | 146.18764 | C6H14N2O2 | C00047 | pos |
| O-Acetyl-L-Serine | 148.06013 | 93.1268 | 6 | 147.1293 | C5H9NO4 | C00979 | pos |
| l-Glutamic Acid | 148.06014 | 102.515 | 3 | 147.1293 | C5H9NO4 | C00025 | pos |
| l-Methionine | 150.05874 | 144.366 | 0 | 149.21238 | C5H11NO2S | C00073 | pos |
| 3-Methyladenine | 150.07725 | 120 | 6 | 149.15348 | C6H7N5 | C00913 | pos |
| 9H-Xanthine | 151.02495 | 204.337 | 9 | 152.11102 | C5H4N4O2 | C00385 | neg |
| 3,4-Dimethylbenzoic acid | 151.07466 | 356.095 | 5 | 150.1745 | C9H10O2 | pos | |
| Guanine | 152.05492 | 121.98 | 12 | 151.126 | C5H5N5O | C00242 | pos |
| l-Histidine | 156.07667 | 86.0491 | 2 | 155.15468 | C6H9N3O2 | C00135 | pos |
| 1-Benzylimidazole | 159.09162 | 405.939 | 1 | 158.084398 | C10H10N2 | pos | |
| (R)-2-Hydroxycaprylic Acid | 159.10166 | 390.322 | 7 | 160.2108 | C8H16O3 | neg | |
| l-Phenylalanine | 164.07031 | 330.364 | 12 | 165.18918 | C9H11NO2 | C00079 | neg |
| Capric Acid | 171.13816 | 806.583 | 5 | 172.265 | C10H20O2 | C01571 | neg |
| Dehydroascorbic Acid | 173.00812 | 112.035 | 6 | 174.10824 | C6H6O6 | C05422 | neg |
| Shikimic Acid | 173.04464 | 84.3461 | 5 | 174.1513 | C7H10O5 | C00493 | neg |
| l-Arginine | 173.10357 | 96.2243 | 9 | 174.201 | C6H14N4O2 | C00062 | neg |
| Muscarine | 174.14873 | 335.354 | 1 | 173.141579 | C9H19NO2 | pos | |
| Citrulline | 176.1028 | 94.1013 | 1 | 175.18584 | C6H13N3O3 | C00327 | pos |
| l-Tyrosine | 180.06494 | 122.902 | 9 | 181.18858 | C9H11NO3 | C00082 | neg |
| Keto-D-Fructose | 180.08643 | 96.8 | 7 | 180.15588 | C6H12O6 | C10906 | pos |
| 2-Methylthio-1,3-Benzothiazole | 182.00909 | 815.127 | 1 | 181.278 | C8H7NS2 | C10910 | pos |
| Triethyl Phosphate | 183.07879 | 612.399 | 4 | 182.15466 | C6H15O4P | pos | |
| D-Glucitol | 183.08768 | 93.504 | 8 | 182.17176 | C6H14O6 | C00794 | pos |
| Nonanedioic Acid | 187.09744 | 302.361 | 1 | 188.22094 | C9H16O4 | C08261 | neg |
| 3-Hydroxycapric Acid | 187.13294 | 586.019 | 6 | 188.264 | C10H20O3 | neg | |
| Deethylatrazine | 188.07031 | 405.939 | 3 | 187.0625 | C6H10ClN5 | C06559 | pos |
| Quinic Acid | 191.05511 | 84.3797 | 5 | 192.16658 | C7H12O6 | C00296 | neg |
| N,N-Diethyl-M-Toluamide | 192.13757 | 755.649 | 4 | 191.2695 | C12H17NO | C10935 | pos |
| Butylparaben | 193.08626 | 761.377 | 4 | 194.227 | C11H14O3 | D01420 | neg |
| l-Leucyl-l-Alanine | 201.1237 | 125.201 | 4 | 202.2508 | C9H18N2O3 | neg | |
| Alanyl-DL-Leucine | 203.13918 | 182.305 | 1 | 202.131742 | C9H18N2O3 | pos | |
| ADMA | 203.15006 | 101.974 | 1 | 202.25428 | C8H18N4O2 | C03626 | pos |
| Indolelactic Acid | 206.08104 | 486.255 | 1 | 205.073893 | C11H11NO3 | C02043 | pos |
| 7-Oxo-11-Dodecenoic Acid | 211.13328 | 598.679 | 3 | 212.141237 | C12H20O3 | neg | |
| 8-Chlorotheophylline | 213.01457 | 486.288 | 18 | 214.025751 | C7H7ClN4O2 | neg | |
| Diphenylurea | 213.10194 | 713.78 | 1 | 212.248 | C13H12N2O | pos | |
| Octhilinone | 214.12574 | 808.599 | 1 | 213.34 | C11H19NOS | C18752 | pos |
| Tetradecylamine | 214.25247 | 777.08 | 2 | 213.245649 | C14H31N | pos | |
| 12-Hydroxydodecanoic Acid | 215.16486 | 616.949 | 2 | 216.3172 | C12H24O3 | C08317 | neg |
| Cymiazole | 219.09484 | 780.674 | 1 | 218.087769 | C12H14N2S | pos | |
| (R)-Pantothenic Acid | 220.11782 | 366.856 | 1 | 219.23502 | C9H17NO5 | C00864 | pos |
| Benzanthrone | 231.08369 | 121.982 | 14 | 230.073165 | C17H10O | pos | |
| Confertifoline | 233.15282 | 691.733 | 8 | 234.335 | C15H22O2 | C09376 | neg |
| Dropropizine | 237.15702 | 504.911 | 12 | 236.311 | C13H20N2O2 | pos | |
| l-Cystine | 239.12849 | 758.968 | 3 | 240.30256 | C6H12N2O4S2 | C00491 | neg |
| Uridine | 243.06232 | 123.067 | 0 | 244.20146 | C9H12N2O6 | C00299 | neg |
| Cytidine | 244.09223 | 121.485 | 1 | 243.21674 | C9H13N3O5 | C00475 | pos |
| N,N-Diisopropyl-3-Nitrobenzamide | 251.13594 | 144.97 | 12 | 250.131743 | C13H18N2O3 | pos | |
| Glycerophosphocholine | 258.10912 | 92.1093 | 4 | 257.2213 | C8H20NO6P | C00670 | pos |
| Gamma-Glu-Leu | 261.14469 | 317.015 | 1 | 260.2869 | C11H20N2O5 | pos | |
| l-Phenylalanyl-l-Proline | 263.13858 | 444.483 | 2 | 262.3043 | C14H18N2O3 | pos | |
| 12-oxo-2,3-Dinor-10,15-Phytodienoic Acid | 263.16518 | 831.168 | 0 | 264.36 | C16H24O3 | neg | |
| Adenosine | 268.10341 | 309.894 | 0 | 267.24152 | C10H13N5O4 | C00212 | pos |
| 16-Hydroxy Hexadecanoic Acid | 271.22753 | 833.483 | 1 | 272.4235 | C16H32O3 | C18218 | neg |
| Triethylcitrate | 277.12763 | 716.368 | 2 | 276.283 | C12H20O7 | D06228 | pos |
| Dibutyl Phthalate | 279.16034 | 797.891 | 4 | 278.3435 | C16H22O4 | C14214 | pos |
| Guanosine | 284.0984 | 316.055 | 4 | 283.24092 | C10H13N5O5 | C00387 | pos |
| Epicatechin | 289.0712 | 462.296 | 2 | 290.2681 | C15H14O6 | C09727 | neg |
| Catechin | 291.08533 | 462.105 | 5 | 290.2681 | C15H14O6 | C06562 | pos |
| Terbinafine | 292.21163 | 650.276 | 19 | 291.4299 | C21H25N | C08079 | pos |
| 5-S-Methyl-5-Thioadenosine | 298.09601 | 392.891 | 0 | 297.3347 | C11H15N5O3S | C00170 | pos |
| TMS | 301.14395 | 420.822 | 2 | 300.136159 | C18H20O4 | pos | |
| Dicyclomine | 310.27177 | 755.879 | 8 | 309.4867 | C19H35NO2 | C06951 | pos |
| Triptophenolide | 311.16832 | 790.124 | 10 | 312.172545 | C20H24O3 | neg | |
| 13(S)-HpODE | 311.22274 | 743.286 | 0 | 312.4443 | C18H32O4 | C04717 | neg |
| 9(S)-HpODE | 311.22294 | 775.306 | 0 | 312.4443 | C18H32O4 | C14827 | neg |
| 9,10-DiHOME | 313.23891 | 724.13 | 2 | 314.4602 | C18H34O4 | C14828 | neg |
| Acitretin | 325.18414 | 810.001 | 10 | 326.42934 | C21H26O3 | D02754 | neg |
| Quinine | 325.191 | 652.018 | 0 | 324.4168 | C20H24N2O2 | C06526 | pos |
| Yohimbic Acid | 339.1648 | 831.469 | 19 | 340.41624 | C20H24N2O3 | neg | |
| Vinpocetine | 351.21345 | 714.679 | 19 | 350.455 | C22H26N2O2 | pos | |
| Estradiol Valerate | 355.22845 | 599.118 | 2 | 356.499 | C23H32O3 | C12859 | neg |
| Sinapaldehyde Glucoside | 369.11997 | 96.3153 | 2 | 370.126376 | C17H22O9 | neg | |
| Methyl Arachidonyl Fluorophosphonate | 371.24766 | 763.893 | 9 | 370.243695 | C21H36FO2P | pos | |
| Gentian Violet | 372.24226 | 790.875 | 3 | 371.236135 | C25H30N3 | pos | |
| Tamsulosin | 409.18158 | 464.483 | 6 | 408.512 | C20H28N2O5S | C07124 | pos |
| Procyanidin B2 | 579.1489 | 407.114 | 1 | 578.5202 | C30H26O12 | C17639 | pos |
1 Name: identification results; 2 m/z: mass nuclear ratio; 3 rt: retention time, s; 4 ppm: error between molecular weight and theoretical molecular weight, ppm; 5 exact mass: accurate molecular weight; 6 KEGG: KEGG compound number; 7 posneg: ionization mode, where pos is positive ion mode and neg is negative ion mode.
Table A2.
Differentially expressed metabolites in all samples of the first and second groups.
| Name 1 | 1 vs. 2_VIP 2 | Fold Change_2/1 | Log2(FC_2/1) 3 | p-Value 4 | FDR 5 |
|---|---|---|---|---|---|
| Vinpocetine | 1.869946 | 0.3202 | −1.6429 | 0.0000013 | 0.000254 |
| Glycerophosphocholine | 1.856177 | 42.044 | 5.3938 | 0.0000037 | 0.000517 |
| Choline | 1.855588 | 6.291 | 2.6533 | 0.0000039 | 0.000531 |
| l-Threonine | 1.813788 | 1.6411 | 0.71469 | 0.0000320 | 0.002047 |
| ADMA | 1.808401 | 4.7429 | 2.2458 | 0.0000392 | 0.002287 |
| l-Serine | 1.790296 | 3.2158 | 1.6852 | 0.0000727 | 0.003252 |
| Keto-D-Fructose | 1.77673 | 0.20739 | −2.2696 | 0.0001089 | 0.00426 |
| l-Histidine | 1.740644 | 2.6231 | 1.3913 | 0.0002689 | 0.007746 |
| l-Lysine | 1.739258 | 2.5496 | 1.3503 | 0.0002773 | 0.007874 |
| l-Methionine | 1.734536 | 4.0561 | 2.0201 | 0.0003074 | 0.00837 |
| Nicotinamide | 1.727199 | 5.4063 | 2.4346 | 0.0003589 | 0.009191 |
| Salicylate | 1.721537 | 1.1119 | 0.15298 | 0.0004026 | 0.010029 |
| l-Pipecolic acid | 1.648997 | 2.1215 | 1.0851 | 0.0013724 | 0.020324 |
| Agmatine | 1.629025 | 0.097098 | −3.3644 | 0.0018093 | 0.02423 |
| Guanine | 1.62376 | 2.0952 | 1.0671 | 0.0019395 | 0.025193 |
| Indolelactic acid | 1.621818 | 4.6738 | 2.2246 | 0.0019892 | 0.025604 |
| N,N-Diisopropyl-3-Nitrobenzamide | 1.614857 | 2.2462 | 1.1675 | 0.0021749 | 0.027391 |
| Dropropizine | 1.576419 | 0.89283 | −0.16354 | 0.0034327 | 0.035944 |
| 3-Methyladenine | 1.569726 | 2.1357 | 1.0947 | 0.0036958 | 0.037589 |
| l-Phenylalanyl-L-Proline | 1.54751 | 2.9302 | 1.551 | 0.0046725 | 0.04372 |
| O-Acetyl-l-Serine | 1.534309 | 2.9405 | 1.5561 | 0.0053332 | 0.048166 |
| Glycine Betaine | 1.526096 | 4.1876 | 2.0661 | 0.0057765 | 0.050485 |
| Putrescine | 1.49701 | 0.56468 | −0.8245 | 0.0075577 | 0.058673 |
| Adenosine | 1.492166 | 7.3509 | 2.8779 | 0.0078881 | 0.060157 |
| Citrulline | 1.484936 | 1.6943 | 0.76068 | 0.0084002 | 0.062645 |
| Imidazoleacetic acid | 1.414003 | 1.6133 | 0.69005 | 0.0147345 | 0.087407 |
| 4-Guanidinobutanoic acid | 1.390837 | 12.812 | 3.6794 | 0.0173733 | 0.096289 |
| 5-S-Methyl-5-Thioadenosine | 1.368643 | 4.2794 | 2.0974 | 0.0201933 | 0.105666 |
| Dibutyl Phthalate | 1.363868 | 3.1017 | 1.6331 | 0.0208389 | 0.107572 |
| Muscarine | 1.316996 | 3.677 | 1.8785 | 0.0279490 | 0.12836 |
| Piperidine | 1.275156 | 1.9234 | 0.94366 | 0.0355599 | 0.148035 |
| Tamsulosin | 1.271617 | 4.6915 | 2.23 | 0.0362616 | 0.149595 |
| (R)-Pantothenic acid | 1.224623 | 1.732 | 0.7924 | 0.0464829 | 0.171966 |
| 3,4-Dimethylbenzoic acid | 1.222463 | 0.18966 | −2.3985 | 0.0469943 | 0.173234 |
| Quinic acid | 1.780892 | 4.5158 | 2.175 | 0.0000016 | 0.000236 |
| l-Erythrulose | 1.739383 | 0.32058 | −1.6412 | 0.0000213 | 0.001223 |
| Pyruvate | 1.736553 | 0.354 | −1.4982 | 0.0000241 | 0.0013 |
| 3-Methyl Pyruvic acid | 1.728988 | 0.32725 | −1.6115 | 0.0000332 | 0.001502 |
| Threonate | 1.712791 | 3.4506 | 1.7868 | 0.0000607 | 0.002173 |
| Sinapaldehyde Glucoside | 1.701181 | 3.2492 | 1.7001 | 0.0000889 | 0.002691 |
| 8-Chlorotheophylline | 1.700766 | 0.39072 | −1.3558 | 0.0000901 | 0.0027 |
| l-Asparagine | 1.657314 | 5.2423 | 2.3902 | 0.0002870 | 0.006038 |
| Adenine | 1.585462 | 1.975 | 0.98184 | 0.0011264 | 0.015959 |
| 9(S)-HpODE | 1.504033 | 2.4481 | 1.2917 | 0.0034110 | 0.032279 |
| 9H-Xanthine | 1.489229 | 0.42715 | −1.2272 | 0.0040398 | 0.03549 |
| Glutaric acid | 1.472775 | 3.4595 | 1.7906 | 0.0048316 | 0.039341 |
| D-Glyceraldehyde | 1.457553 | 0.20576 | −2.281 | 0.0056575 | 0.042594 |
| Yohimbic acid | 1.447777 | 37.215 | 5.2178 | 0.0062382 | 0.045236 |
| l-Arginine | 1.428014 | 3.3292 | 1.7352 | 0.0075394 | 0.050283 |
| l-Leucine | 1.378902 | 2.4788 | 1.3096 | 0.0115875 | 0.063966 |
| 12-oxo-2,3-Dinor-10,15-Phytodienoic acid | 1.360253 | 2.2232 | 1.1527 | 0.0134607 | 0.070293 |
| Confertifoline | 1.346373 | 0.28192 | −1.8266 | 0.0149854 | 0.075265 |
| Uridine | 1.327309 | 3.6455 | 1.8661 | 0.0172704 | 0.082697 |
| Nonanedioic acid | 1.311257 | 9.5381 | 3.2537 | 0.0193733 | 0.088133 |
| 4-Hydroxy-l-Proline | 1.256131 | 0.52658 | −0.92528 | 0.0279380 | 0.109387 |
| 4-Hydroxybenzaldehyde | 1.161319 | 2.5676 | 1.3604 | 0.0481468 | 0.151292 |
1 Name: identification results; 2 VIP: Variable Importance in the Projection; 3 log2 (FC): log2 value of fold change; 4 p-value: Student’s t test; 5 FDR: False Discovery Rate.
References
- Xiao, Y.; Xu, P.W.; Fan, H.K.; Baudouin, L.; Xia, W.; Bocs, S.; Xu, J.Y.; Li, Q.; Guo, A.P.; Zhou, L.X.; et al. The genome draft of coconut (Cocos nucifera). GigaScience 2017, 6, 11. [Google Scholar] [CrossRef]
- Yong, J.W.H.; Ge, L.Y.; Ng, Y.F.; Tan, S.N. The Chemical Composition and Biological Properties of Coconut (Cocos nucifera L.) Water. Molecules 2009, 14, 5144–5164. [Google Scholar] [CrossRef] [Green Version]
- Kuberski, T.; Roberts, A.; Linehan, B.; Bryden, R.N.; Teburae, M. Coconut water as a rehydration fluid. N. Z. Med. J. 1979, 90, 98–100. [Google Scholar] [CrossRef]
- DebMandal, M.; Mandal, S. Coconut (Cocos nucifera L.:Arecaceae):In health promotion and disease prevention. Asian Pac. J. Trop. Med. 2011, 4, 241–247. [Google Scholar] [CrossRef] [Green Version]
- Alleyne, T.; Roache, S.; Thomas, C.; Shirley, A. The control of hypertension by use of coconut water and mauby: Two tropical food drinks. West Indian Med. J. 2005, 54, 3–8. [Google Scholar] [CrossRef]
- Patel, R.; Asplin, J.; Granja, I.; Jiang, P.; Osann, K.; Landman, J.; Clayman, R. PD17-03 CAN COCONUT WATER CONSUMPTION POTENTIALLY PREVENT KIDNEY STONES? J. Urol. 2018. [Google Scholar] [CrossRef] [Green Version]
- Anurag, P.; Rajamohan, T. Cardioprotective effect of tender coconut water in experimental myocardial infarction. Plant Foods Hum. Nutr. 2003, 58, 1–12. [Google Scholar] [CrossRef]
- Campbellfalck, D.; Thomas, T.; Falck, T.M.; Tutuo, N.; Clem, K. The intravenous use of coconut water. Am. J. Emerg. Med. 2000, 18, 108–111. [Google Scholar] [CrossRef]
- Overbeek, J.V.; Conklin, M.E.; Blakeslee, A.F. Factors in Coconut Milk Essential for Growth and Development of Very Young Datura Embryos. Science 1941, 94, 350–351. [Google Scholar] [CrossRef]
- Verdeil, J.L.; Hocher, V. Digestion and absorption of food in plants: A plant stomach. Trends Plant Sci. 2002, 7, 280–281. [Google Scholar] [CrossRef]
- Ang, S.L.P.; Yong, J.W.H. A protocol for in vitro germination and sustainable growth of two tropical mistletoes. Plant Cell Tissue Organ Cult. 2005, 80, 221–228. [Google Scholar] [CrossRef]
- Schmauder, H.P.; George, E.F.; Sherrington, P.D. Plant Propagation by Tissue Culture—Handbook and Directory of Commercial Laboratories. VIII + 709 S., 12 Abb., 40 Tab. Eversley, Basingstoke 1984. Exegetics Limited. £ 65.00. ISBN: 0-9509325-0-7. J. Basic Microbiol. 2010, 25, 475. [Google Scholar] [CrossRef]
- Haseena, M.; Bai, K.V.K.; Padmanabhan, S. Post-harvest quality and shelf-life of tender coconut. J. Food Sci. Technol. 2010, 47, 686–689. [Google Scholar] [CrossRef] [Green Version]
- Jirapong, C.; Wongs-Aree, C.; Noichinda, S.; Uthairatanakij, A.; Kanlayanarat, S. Assessment of volatile and non-volatile organic compounds in the liquid endosperm of young ‘Nam Hom’ coconut (Cocos nucifera L.) at two stages of maturity. J. Pomol. Hortic. Sci. 2015, 90, 477–482. [Google Scholar] [CrossRef]
- Lin, F.M.; Wilkens, W.F. Volatile flavor components of coconut meat. J. Food Sci. 2010, 35, 538–539. [Google Scholar] [CrossRef]
- Jirapong, C.; Changprasert, S.; Kanlayanarat, S.; Uthairatanakij, A.; Bodhipadma, K.; Noichinda, S.; Wongs-Aree, C. Characterization of the liquid endosperm attributes in young coconut fruit during storage. Int. Food Res. J. 2018, 25, 2650–2656. Available online: http://www.ifrj.upm.edu.my/ifrj-2018-25-issue-6.html (accessed on 14 August 2019).
- Kang, J.; Zhu, L.; Lu, J.; Zhang, X. Application of metabolomics in autoimmune diseases: Insight into biomarkers and pathology. J. Neuroimmunol. 2015, 279, 25–32. [Google Scholar] [CrossRef]
- Fiehn, O. Metabolomics–the link between genotypes and phenotypes. Plant Mol. Biol. 2002, 48, 155–171. [Google Scholar] [CrossRef]
- Jones, O.A.H.; Cheung, V.L. An introduction to metabolomics and its potential application in veterinary science. Comp. Med. 2007, 57, 436–442. [Google Scholar] [CrossRef]
- Fiehn, O.; Kopka, J.; Trethewey, R.N.; Willmitzer, L. Identification of uncommon plant metabolites based on calculation of elemental compositions using gas chromatography and quadrupole mass spectrometry. Anal. Chem. 2000, 72, 3573–3580. [Google Scholar] [CrossRef]
- Fiehn, O.; Kopka, J.; Dörmann, P.; Altmann, T.; Trethewey, R.N.; Willmitzer, L. Metabolite profiling for plant functional genomics. Nat. Biotechnol. 2000, 18, 1157–1161. [Google Scholar] [CrossRef]
- Miller, S.B.; Heuberger, A.L.; Broeckling, C.D.; Jahn, C.E. Non-Targeted Metabolomics Reveals Sorghum Rhizosphere-Associated Exudates are Influenced by the Belowground Interaction of Substrate and Sorghum Genotype. Int. J. Mol. Sci. 2019, 20, 431. [Google Scholar] [CrossRef] [Green Version]
- Sun, J.; Beger, R.D.; Schnackenberg, L.K. Metabolomics as a tool for personalizing medicine: 2012 update. Pers. Med. 2013, 10, 149–161. [Google Scholar] [CrossRef]
- Field, K.J.; Lake, J.A. Environmental metabolomics links genotype to phenotype and predicts genotype abundance in wild plant populations. Physiol. Plant. 2011, 142, 352–360. [Google Scholar] [CrossRef]
- Longnecker, K.; Futrelle, J.; Coburn, E.; Soule, M.C.K.; Kujawinski, E.B. Environmental metabolomics: Databases and tools for data analysis. Mar. Chem. 2015, 177, 366–373. [Google Scholar] [CrossRef]
- Bundy, J.G.; Davey, M.P.; Viant, M.R. Environmental metabolomics: A critical review and future perspectives. Metabolomics 2009, 5, 3. [Google Scholar] [CrossRef]
- Dunn, W.B.; David, B.; Paul, B.; Eva, Z.; Sue, F.M.; Nadine, A.; Marie, B.; Knowles, J.D.; Antony, H.; Haselden, J.N. Procedures for large-scale metabolic profiling of serum and plasma using gas chromatography and liquid chromatography coupled to mass spectrometry. Nat. Protoc. 2011, 6, 1060–1083. [Google Scholar] [CrossRef]
- Eva, Z.; Dunn, W.B.; David, B.; Sue, F.M.; Carroll, K.M.; Paul, B.; Steve, O.H.; Knowles, J.D.; Antony, H.; Wilson, I.D. Development of a robust and repeatable UPLC-MS method for the long-term metabolomic study of human serum. Anal. Chem. 2009, 81, 1357–1364. [Google Scholar] [CrossRef]
- Timothy, S.; Hilary, M.; Robert, P.; Wilson, A.J.; Wilson, I.D. A pragmatic and readily implemented quality control strategy for HPLC-MS and GC-MS-based metabonomic analysis. Analyst 2006, 131, 1075–1078. [Google Scholar] [CrossRef]
- Smith, C.A.; Want, E.J.; Grace, O.M.; Ruben, A.; Gary, S. XCMS: Processing Mass Spectrometry Data for Metabolite Profiling Using Nonlinear Peak Alignment, Matching, and Identification. Anal. Chem. 2006, 78, 779–787. [Google Scholar] [CrossRef]
- Tautenhahn, R.; Patti, G.J.; Rinehart, D.; Siuzdak, G. XCMS Online: A Web-Based Platform to Process Untargeted Metabolomic Data. Anal. Chem. 2012, 84, 5035–5039. [Google Scholar] [CrossRef] [PubMed] [Green Version]
- Thévenot, E.A.; Aurélie, R.; Ying, X.; Eric, E.; Christophe, J. Analysis of the Human Adult Urinary Metabolome Variations with Age, Body Mass Index, and Gender by Implementing a Comprehensive Workflow for Univariate and OPLS Statistical Analyses. J. Proteome Res. 2015, 14, 3322–3335. [Google Scholar] [CrossRef] [PubMed]
- Famiani, F.; Cultrera, N.A.; Casulli, V.; Proietti, P.; Standardi, A.; Chen, Z.H.; Leegood, R.C.; Walker, R.P. Phosphoenolpyruvate carboxykinase and its potential role in the catabolism of organic acids in the flesh of soft fruit during ripening. J. Exp. Bot. 2005, 56, 2959–2969. [Google Scholar] [CrossRef] [PubMed] [Green Version]
- Trygg, J.; Wold, S. Orthogonal projections to latent structures (O-PLS). J. Chemom. 2002, 16, 119–128. [Google Scholar] [CrossRef]
- Wang, J.B.; Pu, S.B.; Sun, Y.; Li, Z.F.; Niu, M.; Yan, X.Z.; Zhao, Y.L.; Wang, L.F.; Qin, X.M.; Ma, Z.J. Metabolomic Profiling of Autoimmune Hepatitis: The Diagnostic Utility of Nuclear Magnetic Resonance Spectroscopy. J. Proteome Res. 2014, 13, 3792–3801. [Google Scholar] [CrossRef]
- Benjamini, Y.; Hochberg, Y. Controlling the False Discovery Rate: A Practical and Powerful Approach to Multiple Testing. J. R. Stat. Soc. 1995, 57, 289–300. [Google Scholar] [CrossRef]
- Xi, C.; Xie, C.; Sun, L.; Ding, J.; Cai, H.; Singh, P.K. Longitudinal Metabolomics Profiling of Parkinson’s Disease-Related α-Synuclein A53T Transgenic Mice. PLoS ONE 2015, 10, e0136612. [Google Scholar] [CrossRef]
- Z-Score. 2009. Available online: http://www.doc88.com/p-3377640156606.html (accessed on 12 August 2019). [CrossRef]
- Gary, D.; Tom, S.; Verrall, S.R.; Sean, C.; McNicol, J.W.; Gavin, R.; Shepherd, L.V.T.; Davies, H.V.; Derek, S. Phytochemical diversity in tubers of potato cultivars and landraces using a GC-MS metabolomics approach. J. Agric. Food Chem. 2008, 56, 10280–10291. [Google Scholar] [CrossRef]
- Rao, G.; Sui, J.; Zhang, J. Metabolomics reveals significant variations in metabolites and correlations regarding the maturation of walnuts (Juglans regia L.). Biol. Open 2016, 5, 829–836. [Google Scholar] [CrossRef] [Green Version]
- Xia, J.; Wishart, D.S. MetPA: A web-based metabolomics tool for pathway analysis and visualization. Bioinformatics 2010, 26, 2342–2344. [Google Scholar] [CrossRef] [Green Version]
- Sekowska, A.; Danchin, A. The methionine salvage pathway in Bacillus subtilis. BMC Microbiol. 2002, 2, 8. [Google Scholar] [CrossRef] [PubMed]
- Sekowska, A.; Dénervaud, V.; Ashida, H.; Michoud, K.; Haas, D.; Yokota, A.; Danchin, A. Bacterial variations on the methionine salvage pathway. BMC Microbiol. 2004, 4, 1–17. [Google Scholar] [CrossRef] [PubMed] [Green Version]
- Ogata, H.; Goto, S.; Sato, K.; Fujibuchi, W.; Bono, H.; Kanehisa, M. KEGG: Kyoto Encyclopedia of Genes and Genomes. Nucleic Acids Res. 2000, 27, 29–34. [Google Scholar] [CrossRef] [PubMed] [Green Version]
- Kurihara, S.; Oda, S.; Kumagai, H.; Suzuki, H. γ-Glutamyl-γ-aminobutyrate hydrolase in the putrescine utilization pathway of Escherichia coli K-12. FEMS Microbiol. Lett. 2006, 256, 318–323. [Google Scholar] [CrossRef]
- Kurihara, S.; Oda, S.; Kato, K.; Kim, H.G.; Koyanagi, T.; Kumagai, H.; Suzuki, H. A Novel Putrescine Utilization Pathway Involves γ-Glutamylated Intermediates of Escherichia coli K-12. J. Biol. Chem. 2005, 280, 4602–4608. [Google Scholar] [CrossRef] [Green Version]
- Kelly, S.; Jing, Y.; Hohn, M.J.; Brian, J.; Devine, K.M.; Dieter, S.L. From one amino acid to another: tRNA-dependent amino acid biosynthesis. Nucleic Acids Res. 2008, 36, 1813–1825. [Google Scholar] [CrossRef] [Green Version]
- Carla, P.; Alexandre, A.; Amélie, B.; Winbush, S.A.M.; McCloskey, J.A.; Crain, P.F.; Wood, J.L.; Dieter, S.L. An aminoacyl-tRNA synthetase that specifically activates pyrrolysine. Proc. Natl. Acad. Sci. USA 2004, 101, 12450–12454. [Google Scholar] [CrossRef] [Green Version]
- Hai, X.; Yuzhen, Z.; Xiaokui, G.; Shuangxi, R.; Staempfli, A.A.; Juishen, C.; Weihong, J.; Guoping, Z. Isoleucine biosynthesis in Leptospira interrogans serotype lai strain 56601 proceeds via a threonine-independent pathway. J. Bacteriol. 2004, 186, 5400–5409. [Google Scholar] [CrossRef] [Green Version]
Figure 1.
Preparation of the QC sample. Note: S1, S2, Sn-1, Sn, sample; QC, pooled samples for quality control.
Figure 1.
Preparation of the QC sample. Note: S1, S2, Sn-1, Sn, sample; QC, pooled samples for quality control.

Figure 2.
Changes in the conductivity (a), °Brix (b), pH (c) and sugar-to-acid ratio (d) of tender coconut water during storage.
Figure 2.
Changes in the conductivity (a), °Brix (b), pH (c) and sugar-to-acid ratio (d) of tender coconut water during storage.

Figure 3.
PCA score chart of QC samples under positive ion mode (NT-pos) (a) and negative ion mode (NT-neg) (b).
Figure 3.
PCA score chart of QC samples under positive ion mode (NT-pos) (a) and negative ion mode (NT-neg) (b).

Figure 4.
Up-regulated and down-regulated differentially expressed metabolites based on NT-pos (a) and NT-neg (b). The red color indicates up-regulated differentially expressed metabolites, and the blue color indicates down-regulated differentially expressed metabolites.
Figure 4.
Up-regulated and down-regulated differentially expressed metabolites based on NT-pos (a) and NT-neg (b). The red color indicates up-regulated differentially expressed metabolites, and the blue color indicates down-regulated differentially expressed metabolites.

Figure 5.
PCA score charts based on NT-pos (a) and NT-neg (b), PLS-DA score charts based on NT-pos (c) and NT-neg (d), PLS-DA permutation plot based on NT-pos (e) and NT-neg (f), and OPLS-DA score charts based on NT-pos (g) and NT-neg (h). R2, the interpretability of the model; Q2, the predictability of the model. Samples from 7 different groups are represented by 7 different colors, and each group has 5 biological replicates.

Figure 6.
Heat map for the differentially expressed metabolites. The relative content in the figure is displayed by the color difference, where the columns represent the samples and the rows represent the metabolites. Samples from 7 different groups are represented by 7 different colors, and each group has 5 biological replicates.

Figure 7.
z-score chart of differentially expressed metabolites in the first and second group.

Figure 8.
Correlation matrices of the first and second groups of samples of differentially expressed metabolites. The red color represents positive correlation, and the blue color represents negative correlation.
Figure 8.
Correlation matrices of the first and second groups of samples of differentially expressed metabolites. The red color represents positive correlation, and the blue color represents negative correlation.

Figure 9.
Analysis of metabolic pathways of the first and second groups of samples of differentially expressed metabolites. Each dot represents a metabolic pathway.
Figure 9.
Analysis of metabolic pathways of the first and second groups of samples of differentially expressed metabolites. Each dot represents a metabolic pathway.

© 2020 by the authors. Licensee MDPI, Basel, Switzerland. This article is an open access article distributed under the terms and conditions of the Creative Commons Attribution (CC BY) license (http://creativecommons.org/licenses/by/4.0/).
Share and Cite
MDPI and ACS Style
Zhang, Y.; Chen, W.; Chen, H.; Zhong, Q.; Yun, Y.; Chen, W. Metabolomics Analysis of the Deterioration Mechanism and Storage Time Limit of Tender Coconut Water during Storage. Foods 2020, 9, 46. https://doi.org/10.3390/foods9010046
AMA Style
Zhang Y, Chen W, Chen H, Zhong Q, Yun Y, Chen W. Metabolomics Analysis of the Deterioration Mechanism and Storage Time Limit of Tender Coconut Water during Storage. Foods. 2020; 9(1):46. https://doi.org/10.3390/foods9010046
Chicago/Turabian StyleZhang, Yunwu, Wenxue Chen, Haiming Chen, Qiuping Zhong, Yonghuan Yun, and Weijun Chen. 2020. "Metabolomics Analysis of the Deterioration Mechanism and Storage Time Limit of Tender Coconut Water during Storage" Foods 9, no. 1: 46. https://doi.org/10.3390/foods9010046
Note that from the first issue of 2016, this journal uses article numbers instead of page numbers. See further details here.