Effect of Individual Skills and Performance on Humanitarian Organisations: A Structural Equation Model


1
Dalian Maritime University, No: 1 Linghai Rd, Ganjingzi, Dalian 116026, Liaoning, China
2
Department of Agribusiness Management, Faculty of Agricultural Sciences, Sabaragamuwa University of Sri Lanka, Belihuloya 70140, Sri Lanka
3
Henley Business School, Greenlands Campus, University of Reading, Henley-on-Thames, Reading RG6 6UD, UK
*
Author to whom correspondence should be addressed.
Logistics 2017, 1(1), 7; https://doi.org/10.3390/logistics1010007
Submission received: 9 July 2017
/
Revised: 15 August 2017
/
Accepted: 21 August 2017
/
Published: 25 August 2017
(This article belongs to the Section Humanitarian and Healthcare Logistics)
Abstract
:The significance of Humanitarian Logistics (HL) skills as basic requirements for employment and career development within the HL field has been demonstrated in previous research by the authors. This research showed a strong relationship between recognised HL skills, individual performance and the HL supply chain. With the increasing number of humanitarian disasters globally, it is essential to determine the correlation between individual performance and humanitarian organisational performance. As with previous research, this paper focuses on HL in the Sri Lankan context. Some limited research has already been undertaken on the subject. However, there were a number of major issues identified during this early research that need to be addressed regarding the effective and efficient operation of humanitarian supply chains. These issues include selecting the right personnel for the job, assessing their performance and building and maintaining measurement indicators to evaluate the performance of the humanitarian organisations. A conceptual model based on a Structural Equation Analysis was deduced from an extensive literature survey and was employed to answer these three interconnected issues. The resultant Structural Equation Model (SEM) was used to analyse the conceptual framework with data being gathered from HL practitioners across Sri Lanka by questionnaire. The existence of a relationship between individual skills and HL performance has been demonstrated previously, but not all skills contribute to individual or organisational performance. This research helps prove earlier theories by other researchers regarding the significance of specific skills for performance. The paper also suggests possible areas of future research.
1. Introduction
The recent increase in interest and growing understanding of the importance of humanitarian operations has resulted in logistics focussing much more closely on humanitarian areas [1]. HL includes a number of activities, from initial procurement to the distribution of aid to recipients. However, inadequate planning, ineffective operations and lack of cooperation between teams are all important issues that have directly and negatively affected HL operations [2]. According to Van Wassenhove [3], 80% of the costs of humanitarian operations cover logistics, which clearly demonstrates the importance of having effective and efficient logistics for successful humanitarian operations. The HL sector faces many challenges [1], perhaps most importantly the lack of professional logisticians. Although there has been an increase in HL publications in recent times [4] there have only been a limited number of studies conducted in the field of skills identification and performance improvement [5].
In the Sri Lankan context, the humanitarian aid supply chain differs with each phase and stage of a disaster. For instance, aid distribution can be initiated by NGOs or the private sector at provincial level in a small scale disaster There can also be state involvement through ‘Grama Niladaries’ (village headmen) and the Sri Lankan Disaster Management Centre (DMC) has its own modus operandi, where food and immediate necessities can be bought from the cooperative system as an immediate response to a sudden disaster. Here, the ‘Grama Niladaries’ act as village representatives who conduct the initial needs assessment with the assistance of the district coordinators. For larger disasters, the National Disaster Relief Service Centre (NDRSC) distributes aid that has been channelled through central government. The UN, Sri Lanka Red Cross and other NGOs also have their own relief distribution programmes. Many private sector organisations and media also conduct relief distribution programmes, dependent on their capacity, with little or no coordination from government agencies [6] This multitude of relief distribution processes increases co-ordination issues whenever disasters occur in Sri Lanka1 [2]. When looked at as a whole, it is apparent that there is a need to select the right personnel and train them in supply chain distribution processes in order to achieve a robust distribution system. This means that all personnel, whether in government, private or NGO sector supply chains, must have the necessary skills and competencies to improve the performance of their organisations [7,8].
This paper develops and analyses a SEM approach to simulate the effect of individual skills on HL performance. A variety of statistical software was used for measurement and structural modelling, as well as before and after checks on the models. The data for the research were obtained through a comprehensive questionnaire survey distributed to Sri Lankan HL practitioners working across a number of governmental and non-governmental organisations. The results support the proposed SEM. Individual skills and performance were found to correlate with the performance of humanitarian organisations’ performance. Based on these findings, a clearer picture of the benefits of improving skills to improve the organisation’s performance emerges. It is noteworthy that most respondents agreed that individual skills do affect organisational performance. Paradoxically, HL is still not regarded as a specialist area to develop as a key component of Sri Lankan Disaster Management. This paper outlines the existing literature on the subject, the research methodology used and an analysis of the proposed model. Finally, the implications and limitations of this research at strategic and managerial level are discussed, as well as recommendations for future research. Although, this research focuses on the Sri Lankan HL context, the analysis can equally be applied to other global regions where HL is practised. Further, this model could be used with additional modifications for commercial supply chains where skills and individual performance also affect organisational performance.
2. Literature Survey
2.1. HL Skills
The number of HL-related publications has increased significantly in recent years [9]. However, there are few studies addressing HL skills identification and performance improvement [5,9]. Of these, one study by Kovács and Tatham [10] highlighted the importance of logistics skills on effective management, career development and knowledge. There has also been limited research about HL skills themselves, but a common theme of the few studies that do exist is the prominence given to the area of practitioners’ skills and the effect of these skills on organisational performance efficiency. Very little research work has been carried out on the correlation of HL practitioner skills and performance [10,11].
HL skills can be considered a material input for both resource configuration and the sustainable growth of an organisation [12]. For this reason, individuals who are trained in the basic HL skills should develop an absorbent capacity to increase their capabilities [13]. Logistics skills also have a strategic value that contributes directly to competitive advantage [9]. This is because they cannot be easily copied or acquired [14].
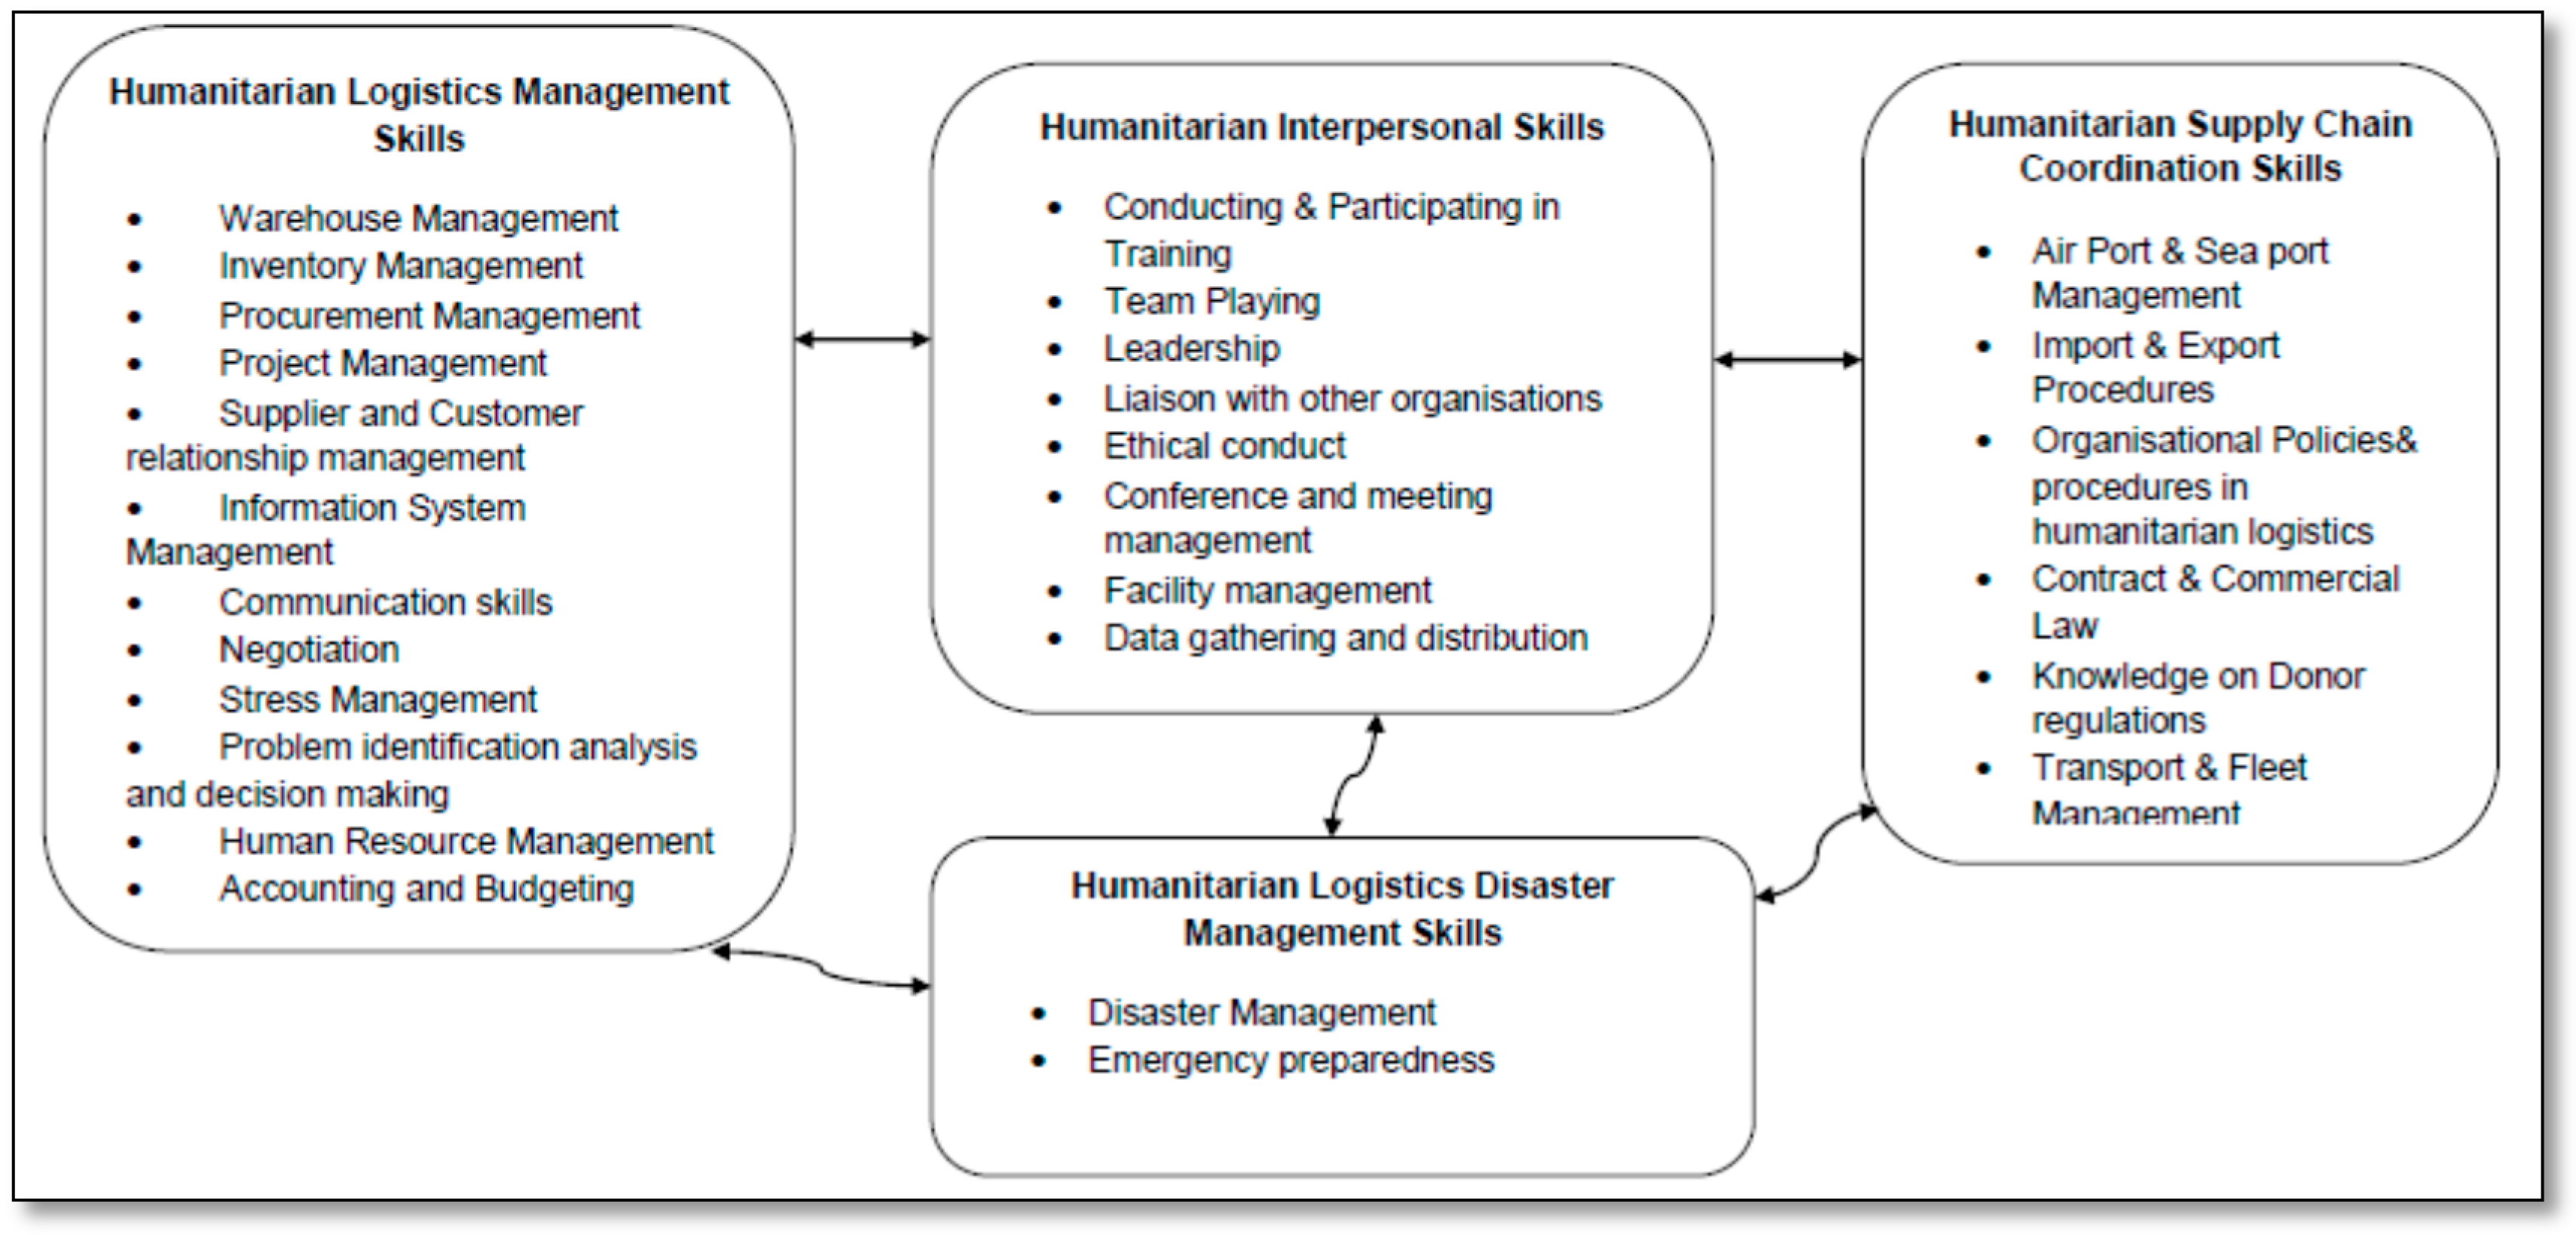
There have been a number of studies that define the different skills required by logisticians based on context that [15,16]. The context depends on geographical location [8,17], gender [18] ethnicity [19], student vs. practitioners [16] position and type of organisation [16] and business vs. HL [5]. Mangan & Christopher [20] state that it is important to become a “manager first and a logistician second” [20]. However, the most significant and discussed skill groups were elaborated by Mangan & Christopher [20], who proposed a T-shaped skill profile that highlights the differences between “breadth versus depth of knowledge, skills, and competencies for the different areas” [20] in the SCM profession. In the latest research to find the skills required by HL practitioners in Sri Lanka [8], the authors determined a number of HL skill components listed in Figure 1.
2.2. HL Practitioner Performance Measurements
A number of authors have discussed the importance of performance appraisals for career development, promotion, training and development [22,23,24,25]. This encourages competency building, facilitates feedback and measures the effectiveness of an organisation’s workforce. It is also a method of highlighting grievances and improving the communication between management and employees. With this increasing importance, however, there are a number of challenges that need to be addressed. One of the major challenges is the assessment of self-managed teams. Since humanitarian teams work mostly autonomously, there are usually no managerial or supervisory structures in place and this makes it difficult to assess their performance. Teams are usually small and managed by empowered workers with minimal or no supervision, therefore creating an increasing challenge for performance measurement. However, despite the unique nature of HL, the employee performance measurement handbook [26] does propose tools for assessing the performance of individuals using practical methodology. These measurement tools include goal cascading and converting expected accomplishment into elements of performance [27]. This methodology is supported by the studies carried out by Kim, T. & Holzer [28], Mostafa & Gould-Williams [29], and Yadav & Dabhade [30]. Kim, T. & Holzer [28] shows that the immediate, intermediate and ultimate criteria of a job can be determined using the handbook criteria. General productivity measures, including quality, quantity, timeliness and cost-effectiveness, allow the Handbook to be used to assess the time taken for each achievement as well as define the dependability of individual practitioner performance for measuring overall performance, attainability and the ability to meet required standards and understanding targets [4].
2.3. Humanitarian Organisational Performance
Performance improvement is addressed by some studies. However, very little is relevant in the HL context [13,16,31]. The difficulty of measuring humanitarian supply chain performance is a key challenge for HL. This is compounded by the difficulty in obtaining accurate data, limited information technology, a chaotic environment, lesser motivation, potentially negative media exposure, human resource issues, general reluctance, the conflict between long term and short term goals and a lack of internal recognition of the supply chain [32]. Haavisto [33] indicated that performance measurements can be based on the Balanced Score Card (BSC) method of Kaplan & Norton [34]. Other methods being used for HL organisation performance measurement [31] include ISO: 9001:2015 performance measurement techniques, Six-Sigma methodology and the Supply Chain Operational Reference (SCOR).
Additionally, Abidi et al. [32], state that efficiency and effectiveness are embedded in all of these concepts. Beamon & Balcik [13], identified the most common denominator for HL as financial performance. However, prior to developing any performance measures, organisations should consider characteristics such as the stage (Preparedness, response, reconstruction and mitigation) of the disaster management activity, the organisation’s objectives (long-term or short-term), understanding the effect of performance measures on staff and the contextual complexity (Emergency relief or development aid) [35]. Table 1 is a list of publications addressing key performance objectives.
2.4. Application of SEM for Humanitarian Research
SEM is a methodology that can be employed to analyse the structural relationship between measured variables and latent constructs using factor and multiple regression methods [39]. During the past decade SEM has become a popular tool for academic research [39] including SCM and Human Resource Management (HRM). There are numerous articles in SCM and HRM specialist journals that have used SEM [40,41,42]. Of note, Aragón et al. [43] identified a relationship between training, organisational learning and performance through a SEM model; they concluded that learning oriented training improves individual performance. There are also numerous SEM applications for training and performance [4], leadership and performance, SCM strategies and organisational performance [44] and the relationship between strategy and performance [45]. However, there has been hardly any research on the application of SEM for HL and its related subjects. Previous research has suggested that it is vital to understand the relationship between individual skills and organisational performance with regards to HL [14,21] in order to minimise the suffering of disaster victims [15].
There are alternative statistical methods to SEM that could be used in this context. These include Confirmatory Factor Analysis (CFA), multiple regression, and other covariance analysis. These methods have to be used separately in independent analyses. However, SEM is a much more robust and inclusive method than the others. In addition, it has the following advantages;
- It is the best method for identifying multiple observed variables. Most other statistical methods can only identify a limited number of variables.
- Greater recognition is given to the validity and reliability of observed scores from the observed variables. Measurement errors are considered in analysing all the observed variables.
- It is possible to analyse more sophisticated theoretical models using SEM.
- As SEM software becomes increasingly user-friendly, it will become easier to use in the sort of research discussed in this paper.
3. Research Methodology
3.1. Proposed Model and Hypotheses
Since logistics and logisticians play a prominent role in HL [3], it is important to explore the skills and competencies required at the selection stage [14,21]. Conducted in the Sri Lankan context, this research selected a representative sample of HL practitioners from different humanitarian organisations. The proposed conceptual model of the independent, intervening and dependent variables is shown in Figure 2. In order to confirm the network of association between variables, two hypotheses were formulated.
The variables were derived directly from the literature survey. Previous research [21] has shown that skills have four components in HL. Furthermore, constructing the latent variables to measure individual performance was greatly influenced by a number of researchers [28,30,46] as well as the model presented in the Management Handbook [26]. Latent variables used in the measurement of humanitarian organisations performance are also mainly derived from the literature survey. Although there may be other latent measures that can measure these constructs, it is more reliable to use tried and tested measures rather than new indicators.
3.2. Reliability and Validity of Questionnaire
A focus group of six logistics professionals, including academics, was selected to measure the efficacy of the Individual Content Validity Index (ICVI) for each measurement indicator identified in the literature survey. They marked each question on a scale from 1 to 4 to show the relevance that they attached to each item (Not Relevant—1, Somewhat Relevant—2, Quite Relevant—3, Highly Relevant—4). The items were also judged for clarity and simplicity.
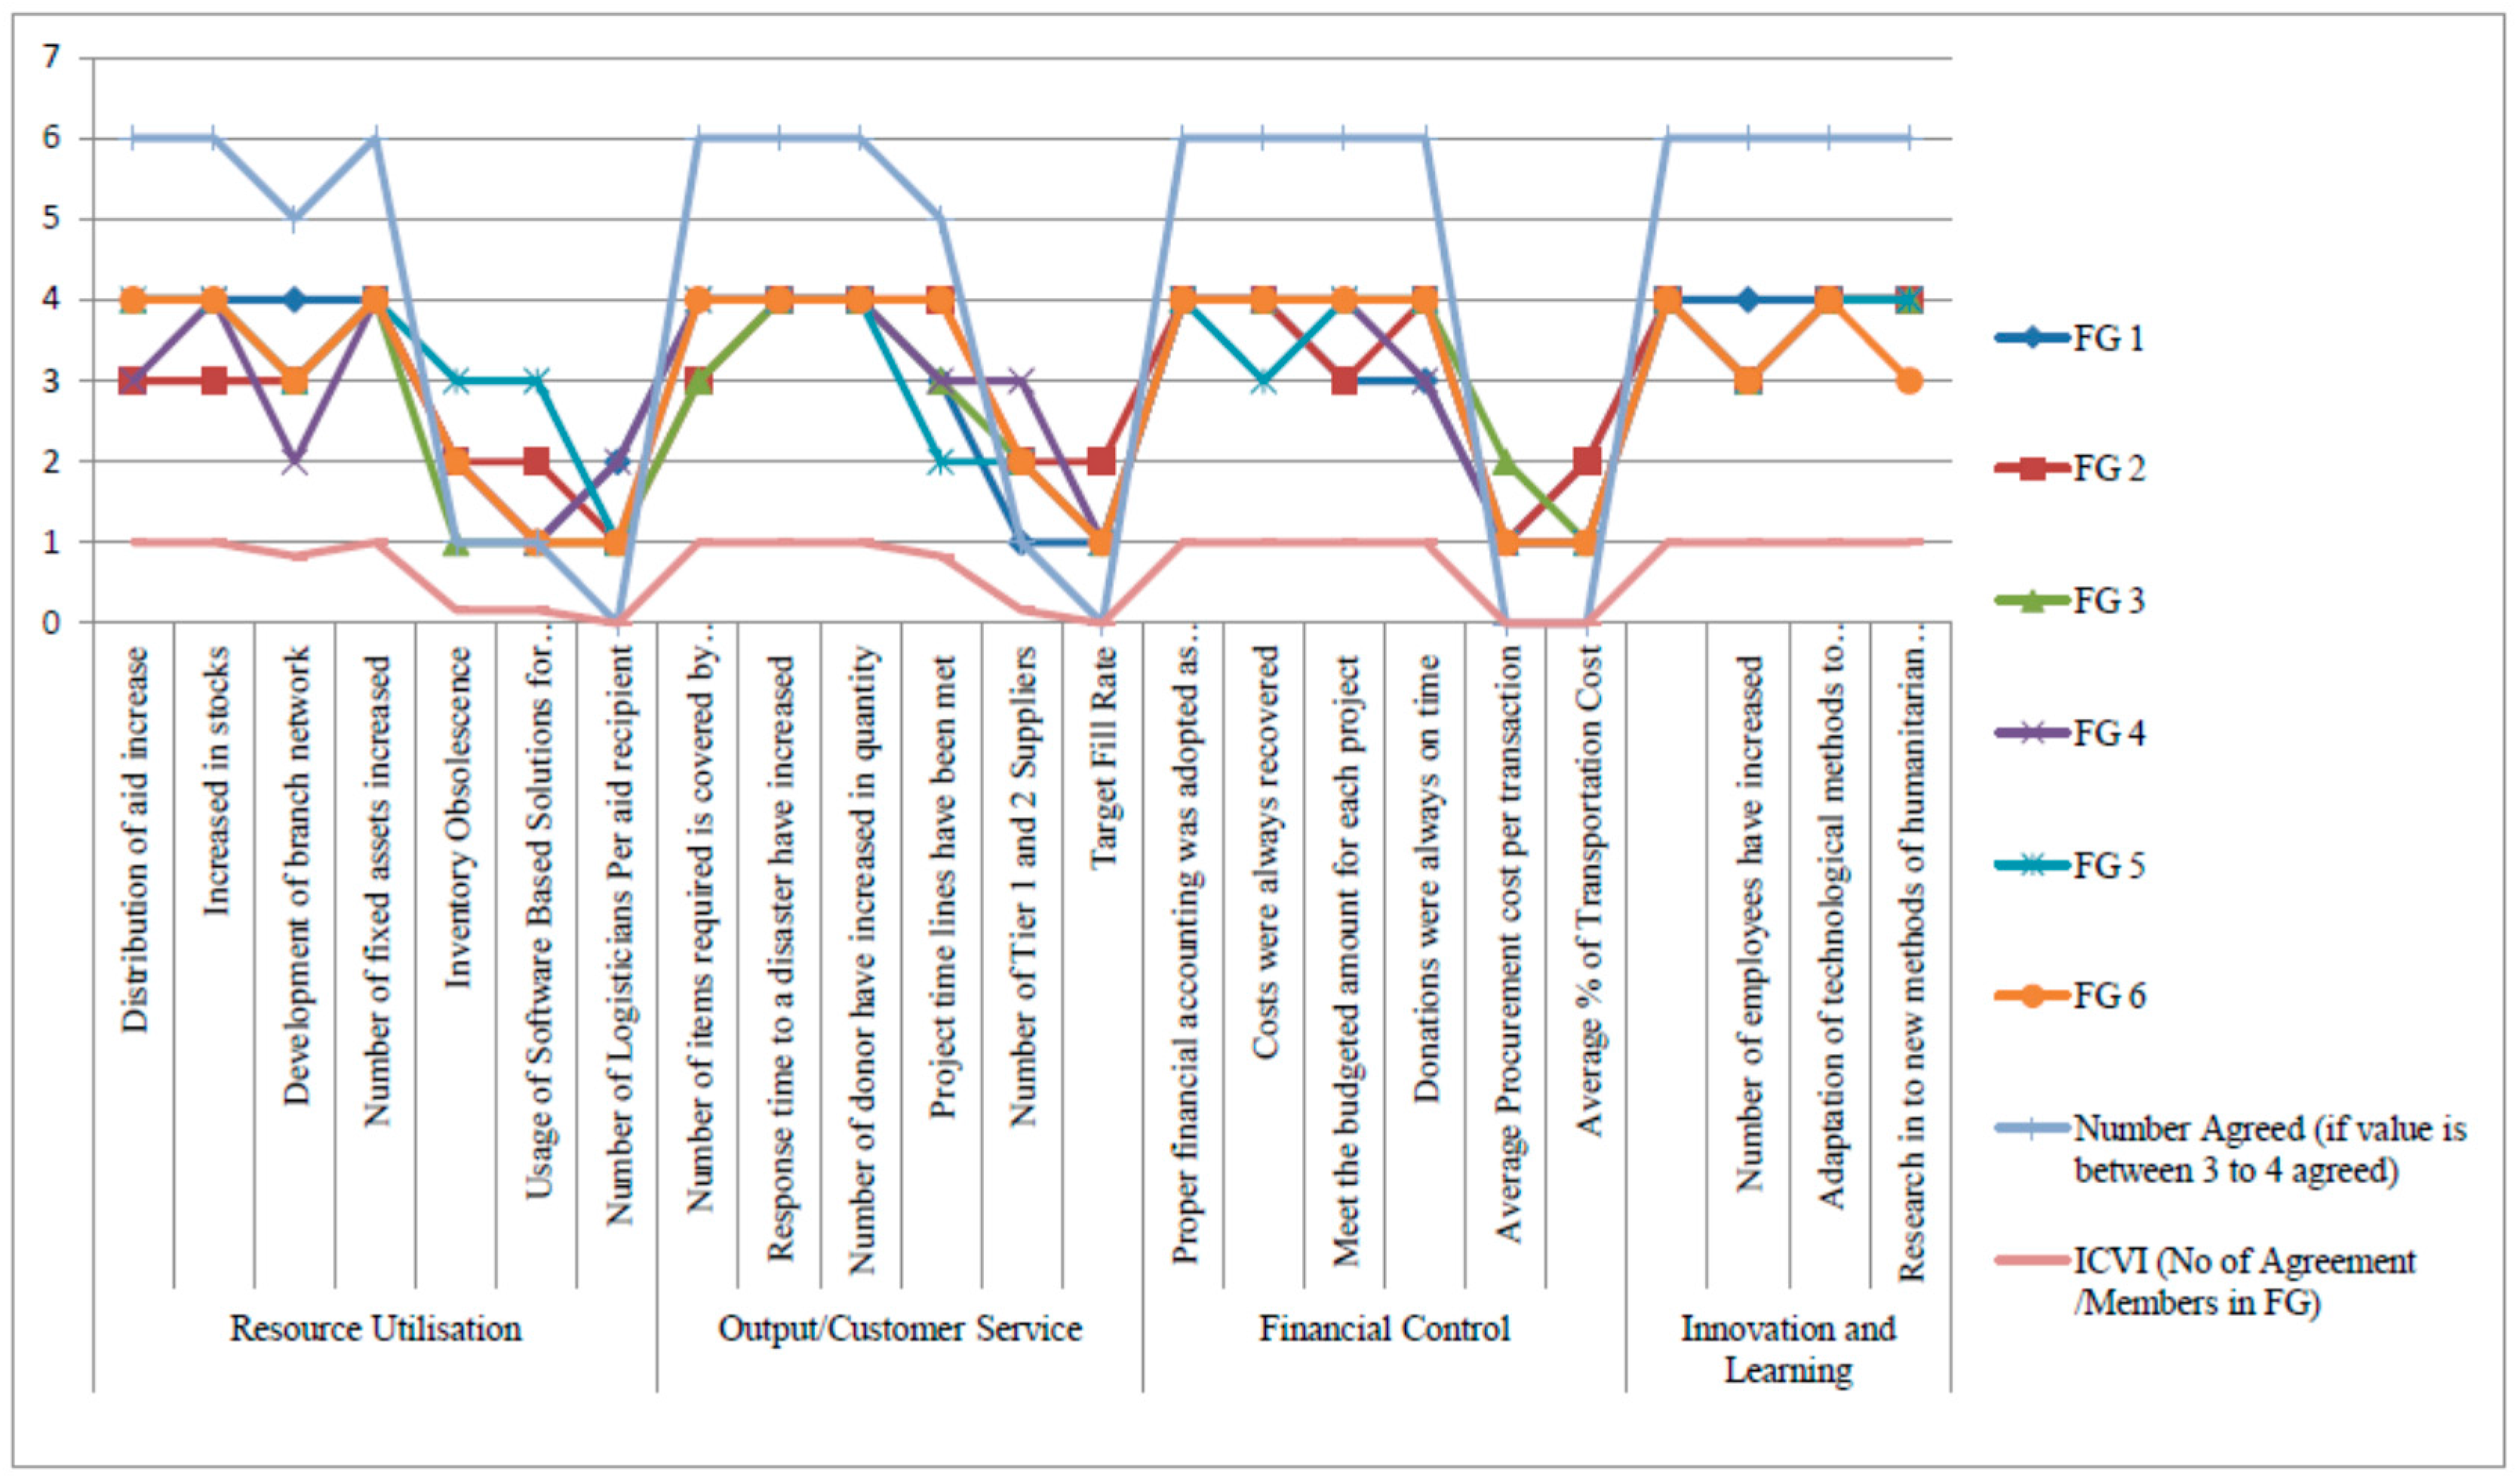
Details of the content validity calculations for ‘Skills of HL Practitioners’ are given in Figure 3. Analysis of the ‘Performance of HL Practitioners’ results revealed that the ICVI values for all items were more than the 0.78 threshold. This meant that all the Questionnaire items could be retained (Figure 4). However, analysis of the ‘Humanitarian Organisational Performances’ results revealed that the ICVI average was less than the 0.78 threshold. By removing the items with less than 0.78 individual scores, the ICVI average was raised above the threshold. The new value after omitting the low ICVI items was 0.979 and the SCVI value after omitted items was 0.875. This is shown in Figure 5.
The results were then tested for internal consistency to ensure the consistency and the stability of the remaining items in the scale [47]. To do this, a sample of 50 Sri Lankan HL practitioners was selected to carry out a pilot study. The value of Cronbach’s Alpha was 0.899 (Values of Cronbach’s Alpha value between 0.8 and 0.9 show good correlation), demonstrating good correlation and strong scale reliability between the variables. Finally, the questionnaire was also tested for reliability by applying the ‘test-retest’ method. To obtain the results, two pilot tests were conducted over a five-week period using the same group of HL field and HQ level practitioners. Analysis of these results produced a correlation coefficient of 0.968 for the first questionnaire and 0.981 for the second questionnaire. This close to unity result for both questionnaires further confirmed the reliability of the results.
3.3. Data Collection and Sampling Procedure
The research population used for this study was drawn from HL staff employed in all Sri Lankan state, private and international non-profit HL organisations. To be specific, all personnel engaged in logistics, procurement, storage, distribution or SCM activities and who are carrying out humanitarian work were considered to be part of the population for this research. Since managers are effectively the predictors of an organisation’s performance, the population also included any other managerial positions that engaged in HL [46]. The Sri Lankan Ministry of Social Affairs and Disaster Management (MDM) states that there are 218 organisations listed as non-profit organisations. Of these, it was found that there are 23 organisations engaged in humanitarian activities. This includes the United Nations and its agencies as well as local and regional Red Cross organisations. In addition, Head Office personnel employed by the MDM, the NDRSC and other HL agencies were also considered. Due to the large number of organisations, it was challenging to obtain the personal details of suitable personnel to take part in the survey. It was therefore necessary to rely on convenience sampling methodology to obtain data. Although every effort has been made to obtain a sample that represents the population, this was a non-probable sampling method, so an element of bias was introduced. The bias was minimised by distributing the questionnaires through different methods to a large number of respondent. Accordingly, 500 questionnaires were distributed to respondents across all 25 districts. Table 2 shows the various methods used to distribute the questionnaires.
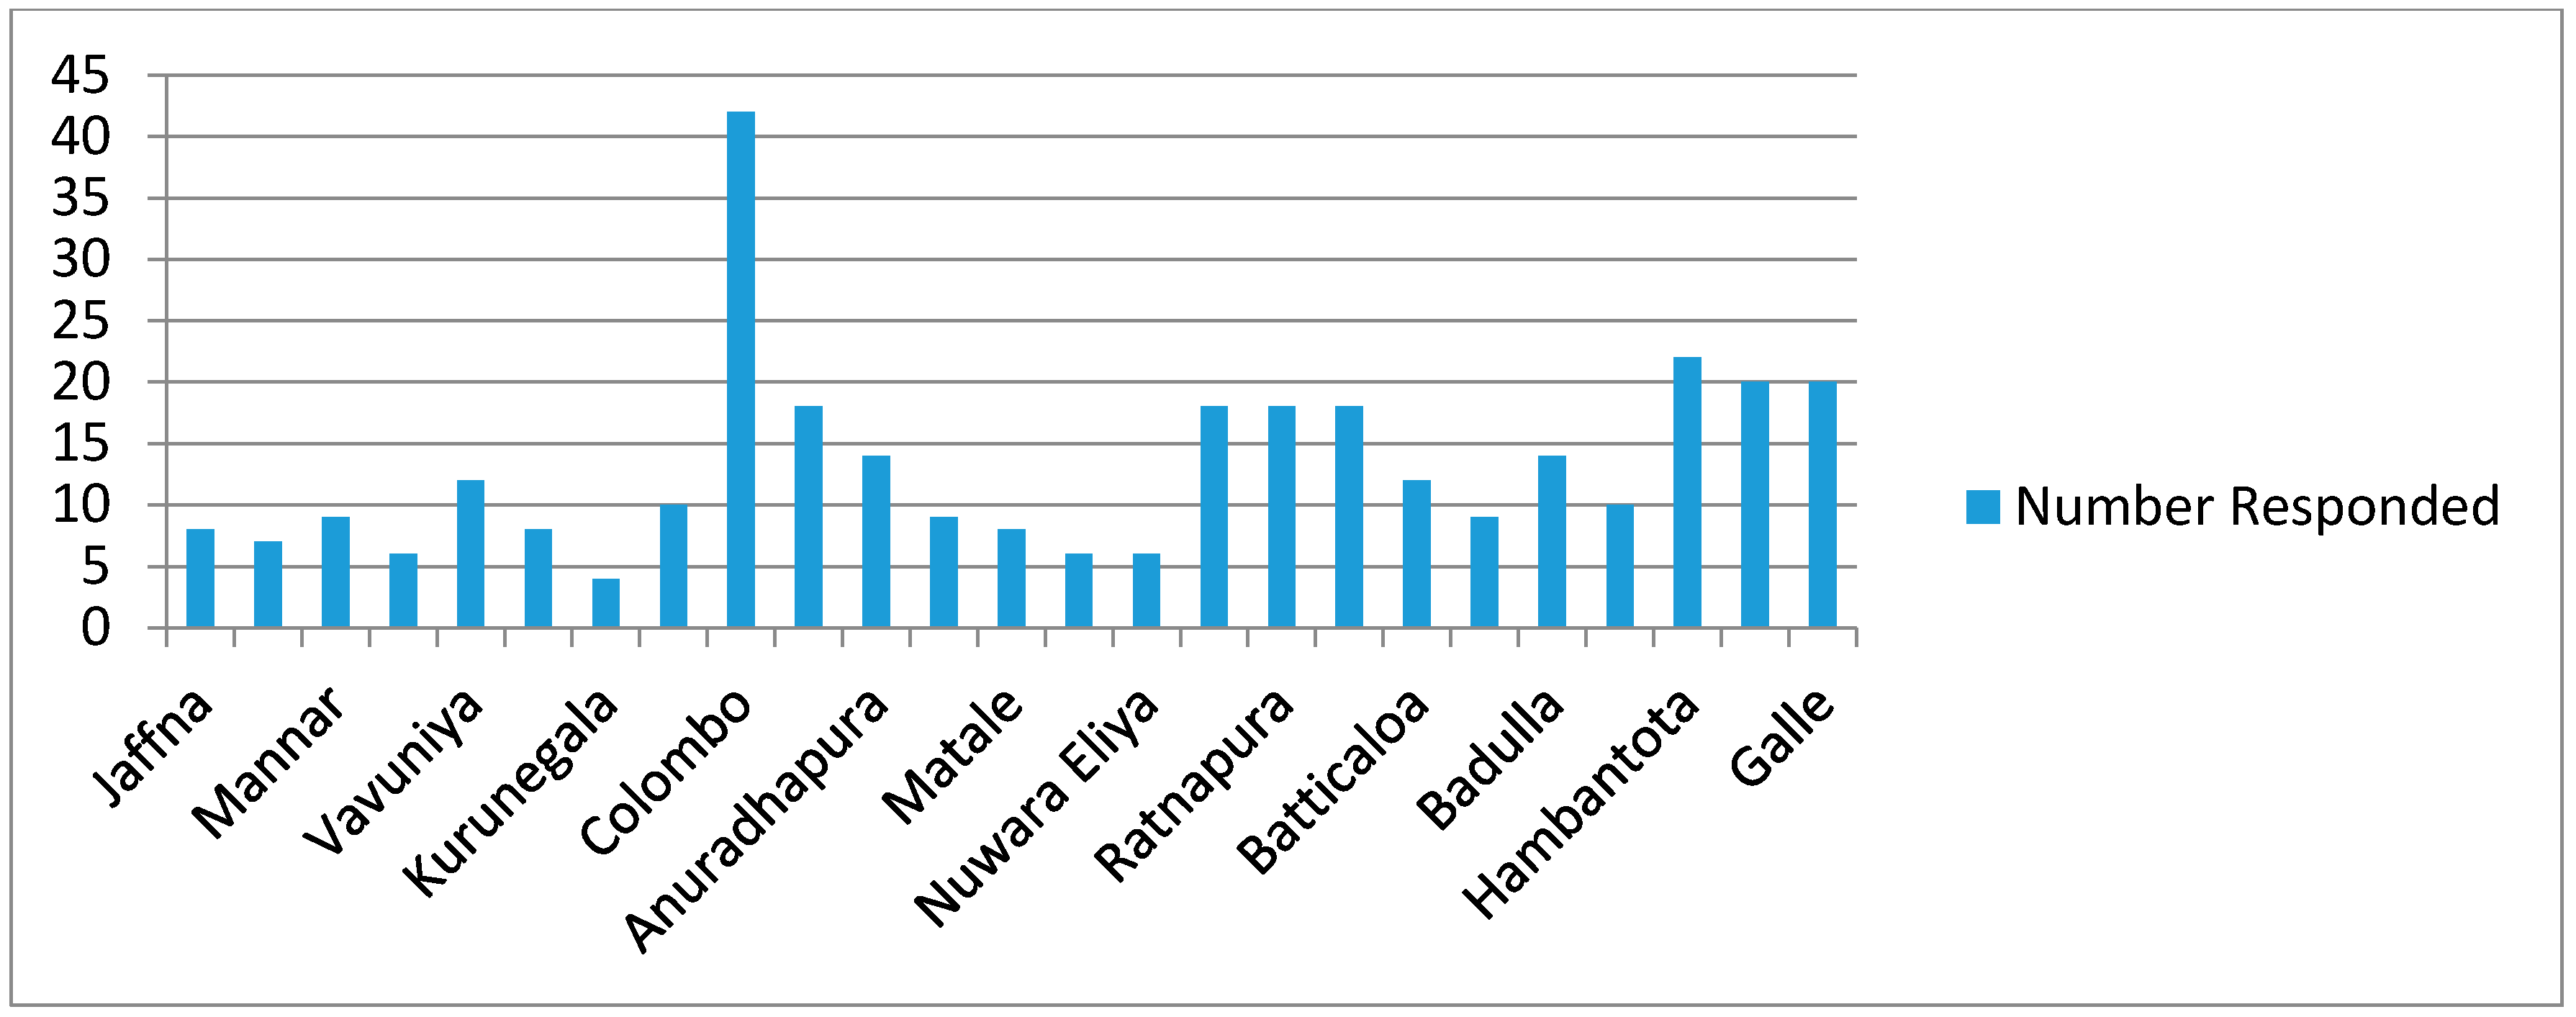
The number of responses by district is shown in Figure 6. It is of note that some districts had a higher response due to the number of international agencies and regional offices included in them (for example: Colombo, Trincomalee and Galle).
Of the 500 questionnaires, 328 completed questionnaires were returned; representing a response rate of 65.5%.This is a good completion rate for social research [48]. Allison, [49], states that the best way to avoid missing data is not to have any missing data. However, when collating the questionnaire data, 13 questionnaires were found to be missing data [50]. This figure includes five questionnaires that were rejected due to unreliability (two with excessive missing data and three at the extreme ends of the Likert scale).
The remaining eight questionnaires were handled using the ‘hot deck imputation method’ [50]. Overall, 323 responses were acceptable for data analysis, with a questionnaire rejection rate of 1.5%.
4. Analysis of Data
4.1. Verifying the Assumptions Prior to SEM
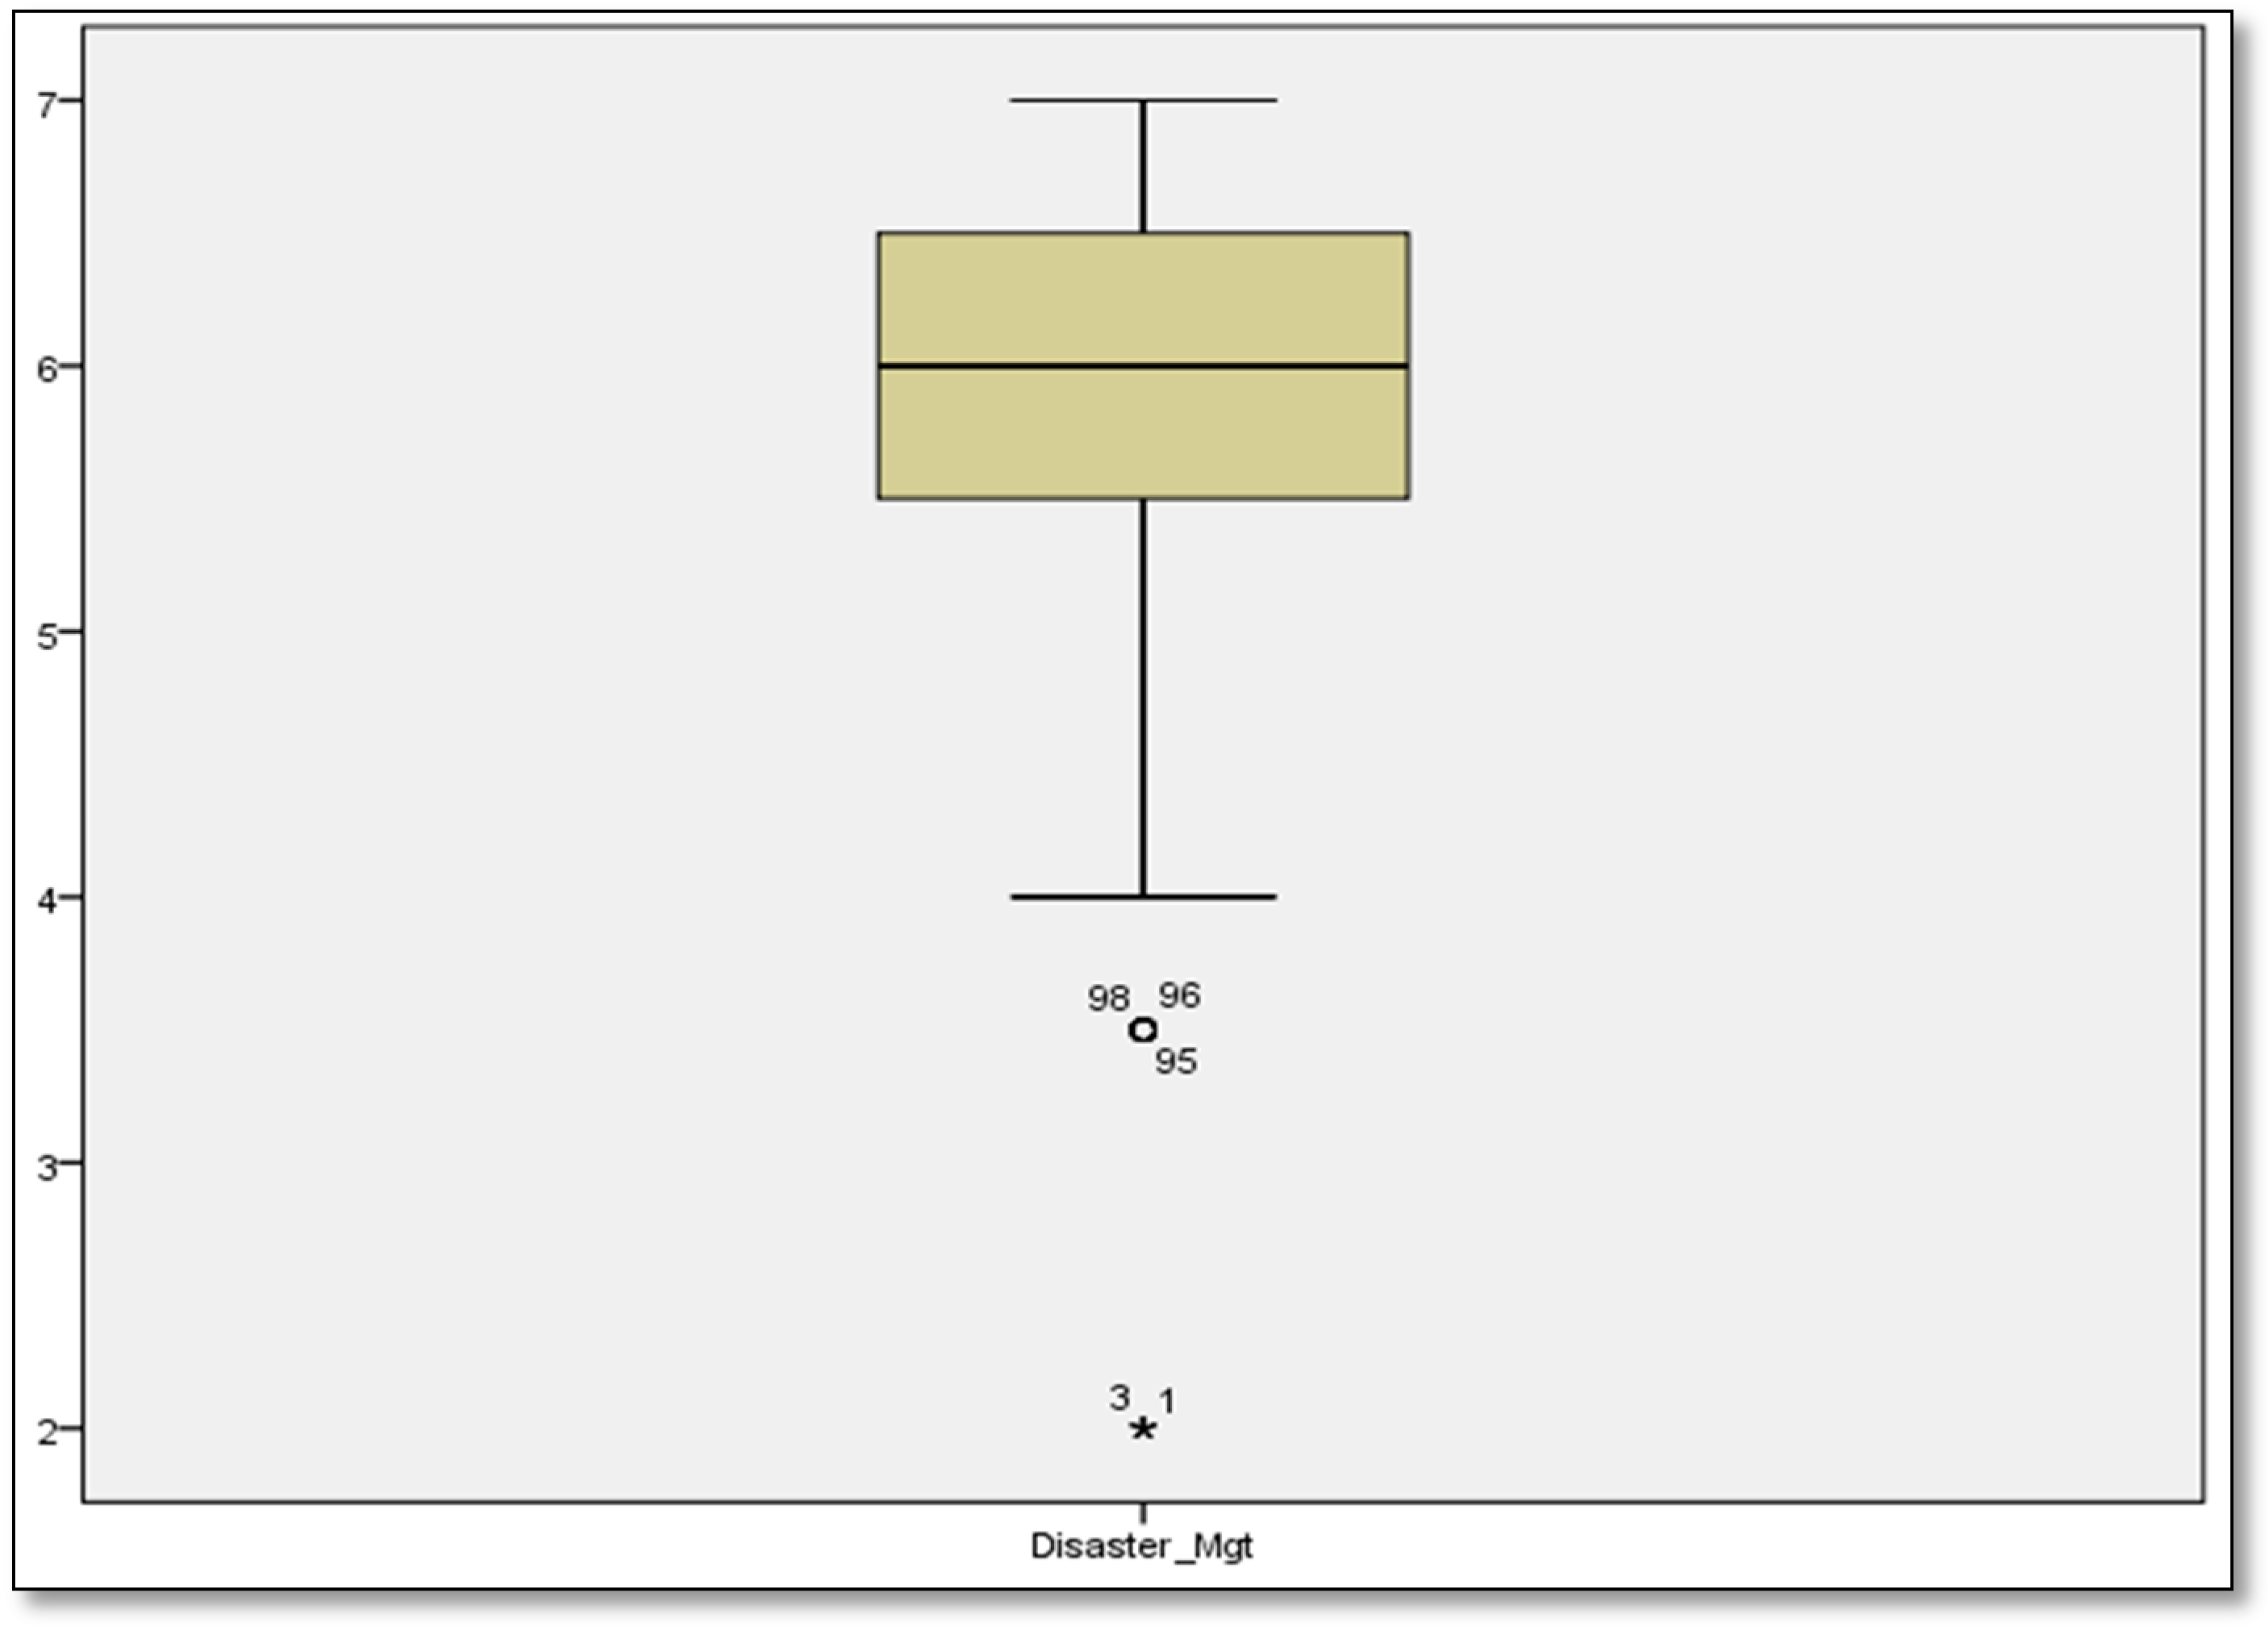
4.1.1. Multivariate Normality
Multivariate Normality was checked using a ‘box plot’ that highlighted five outliers (respondents: 1, 3, 95, 96, and 98). These outliers were then removed and further analysis confirmed that no other data fell outside the norm. The Mahalanobis distance was also measured and this correlated with the previous results. The Box Plot for outliers is shown in Figure 7.
4.1.2. Multicollinearity
Multicollinearity was checked using collinearity diagnostics, where the tolerance value should be greater than 0.01 and the Variance Inflation Factor (VIF) should be less than 10. The conditions were met by all the measured variables, proving that there is no multicollinearity as indicated in Table 3.
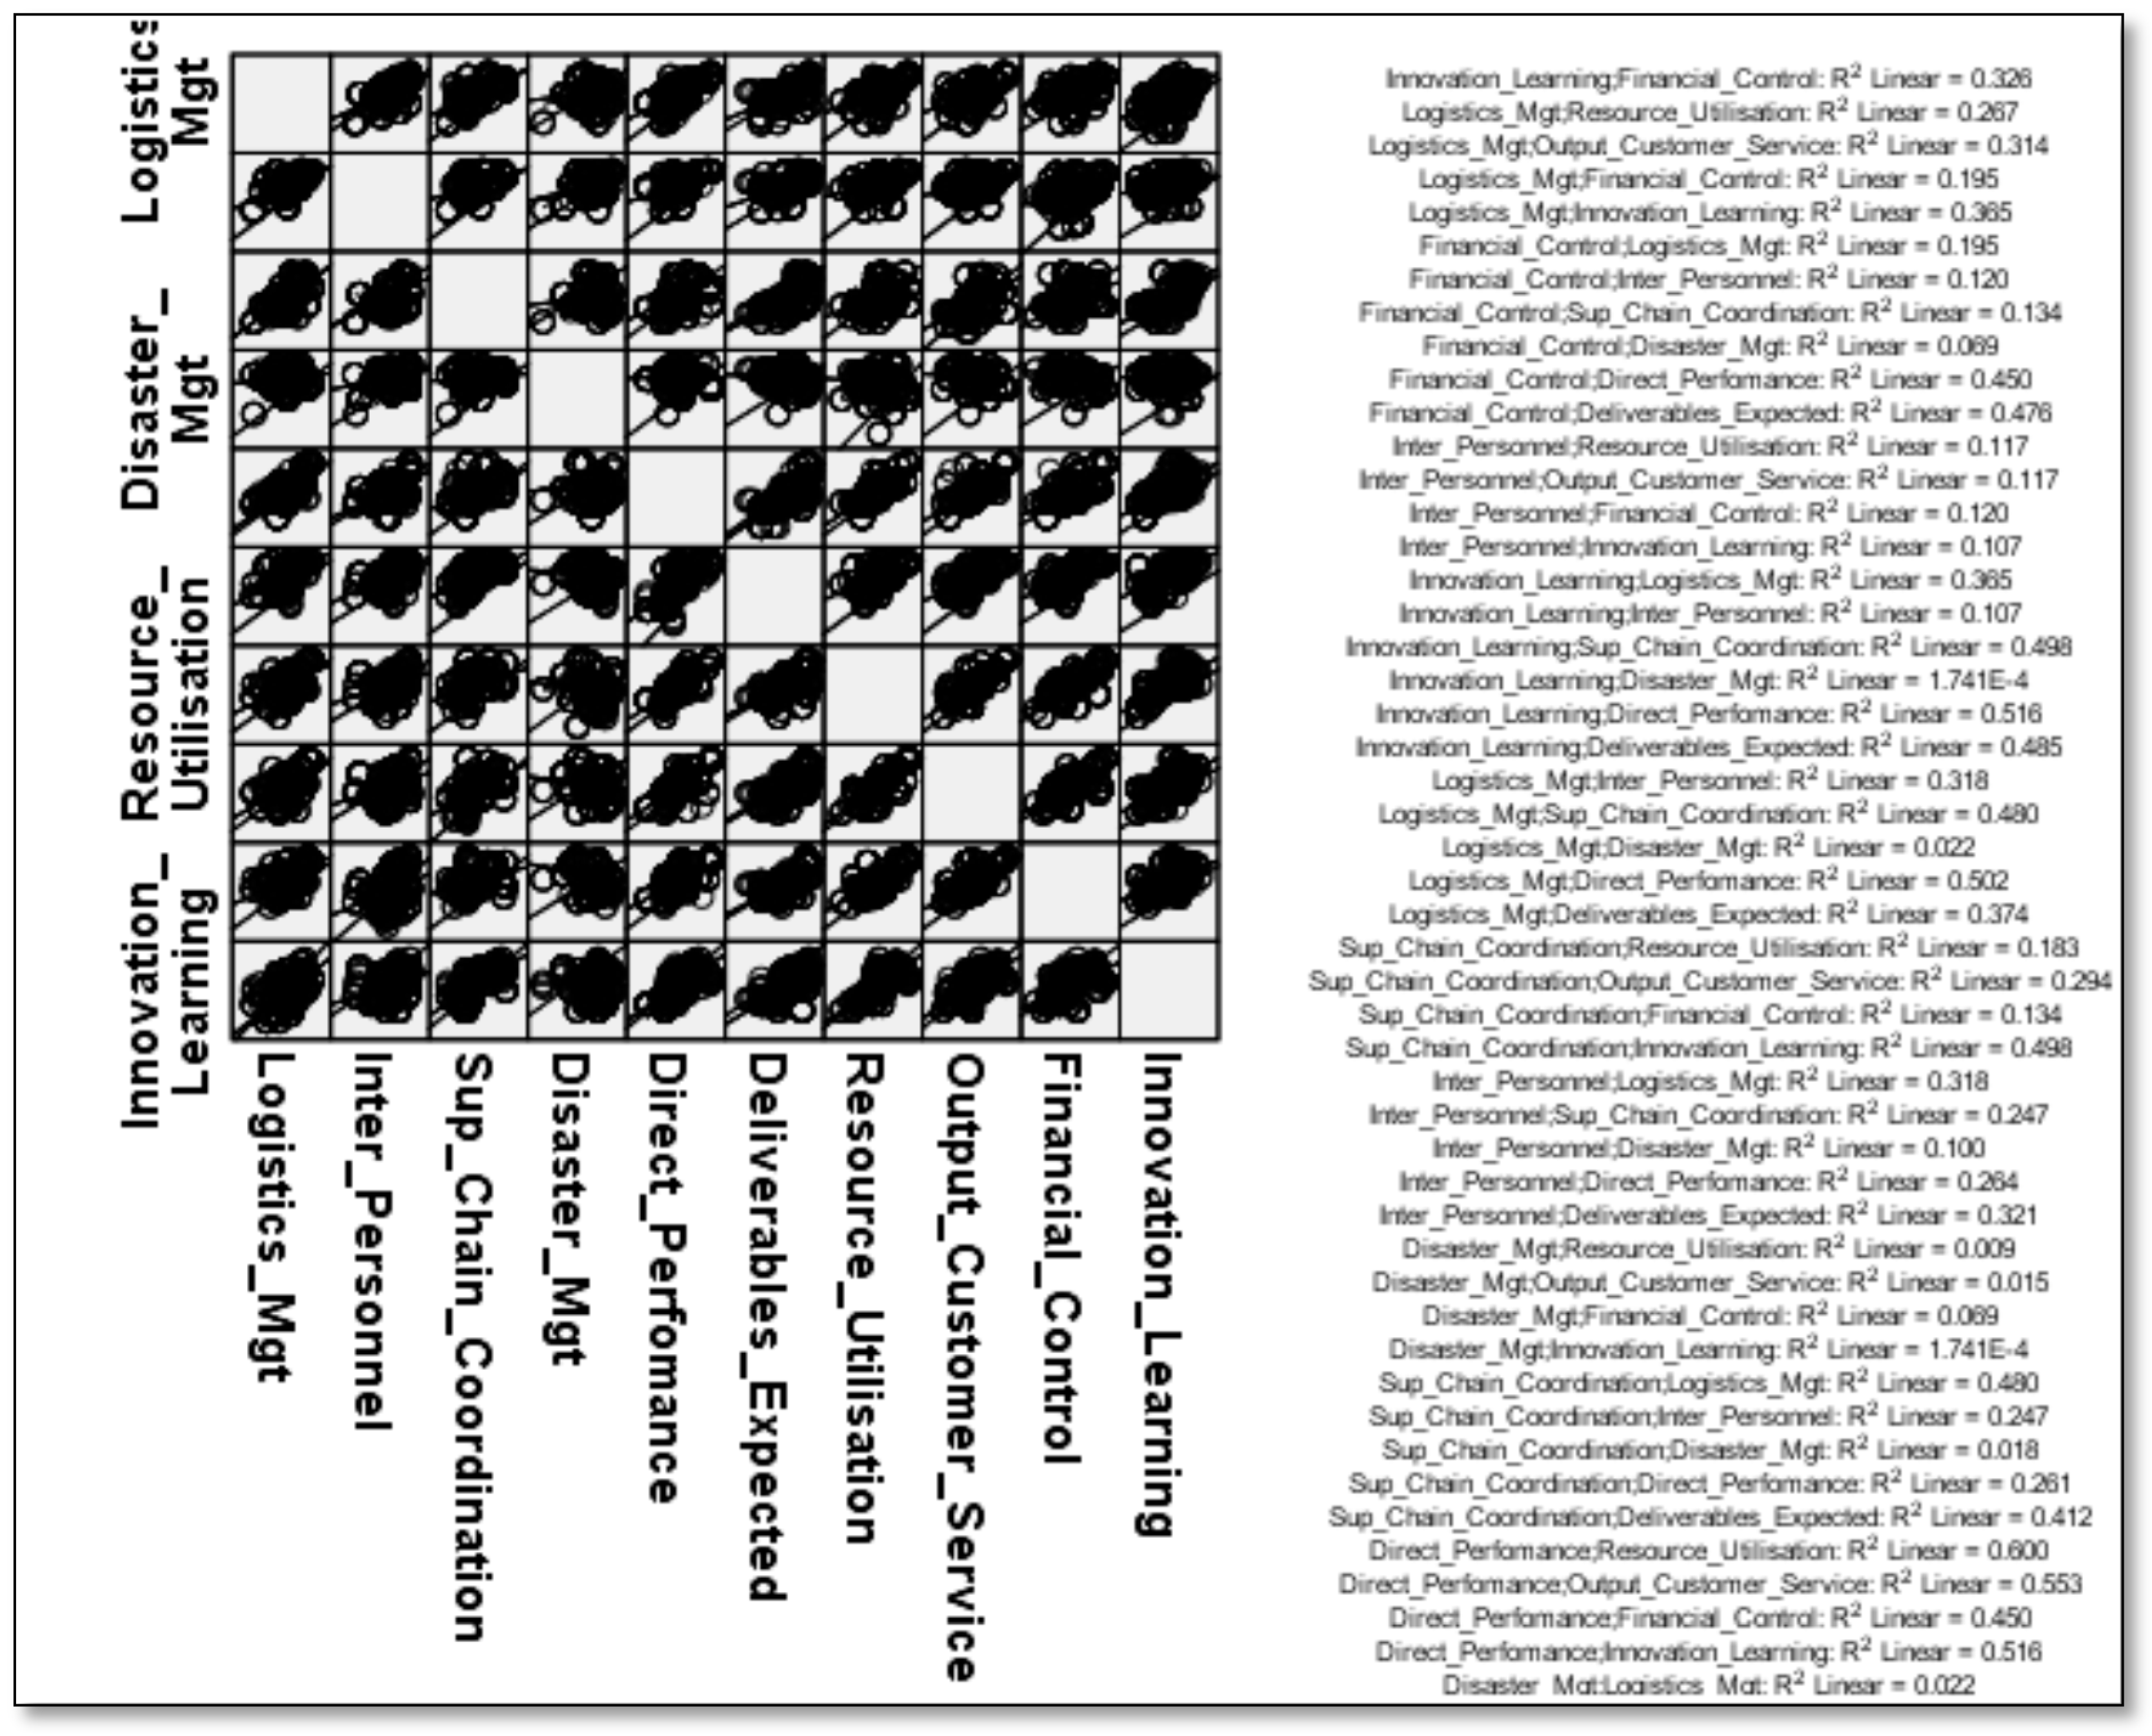
4.1.3. Linearity
The linearity of the data was then checked by looking at the linearity of the scatter plots. The scatter plots met this requirement. This is shown in Figure 8.
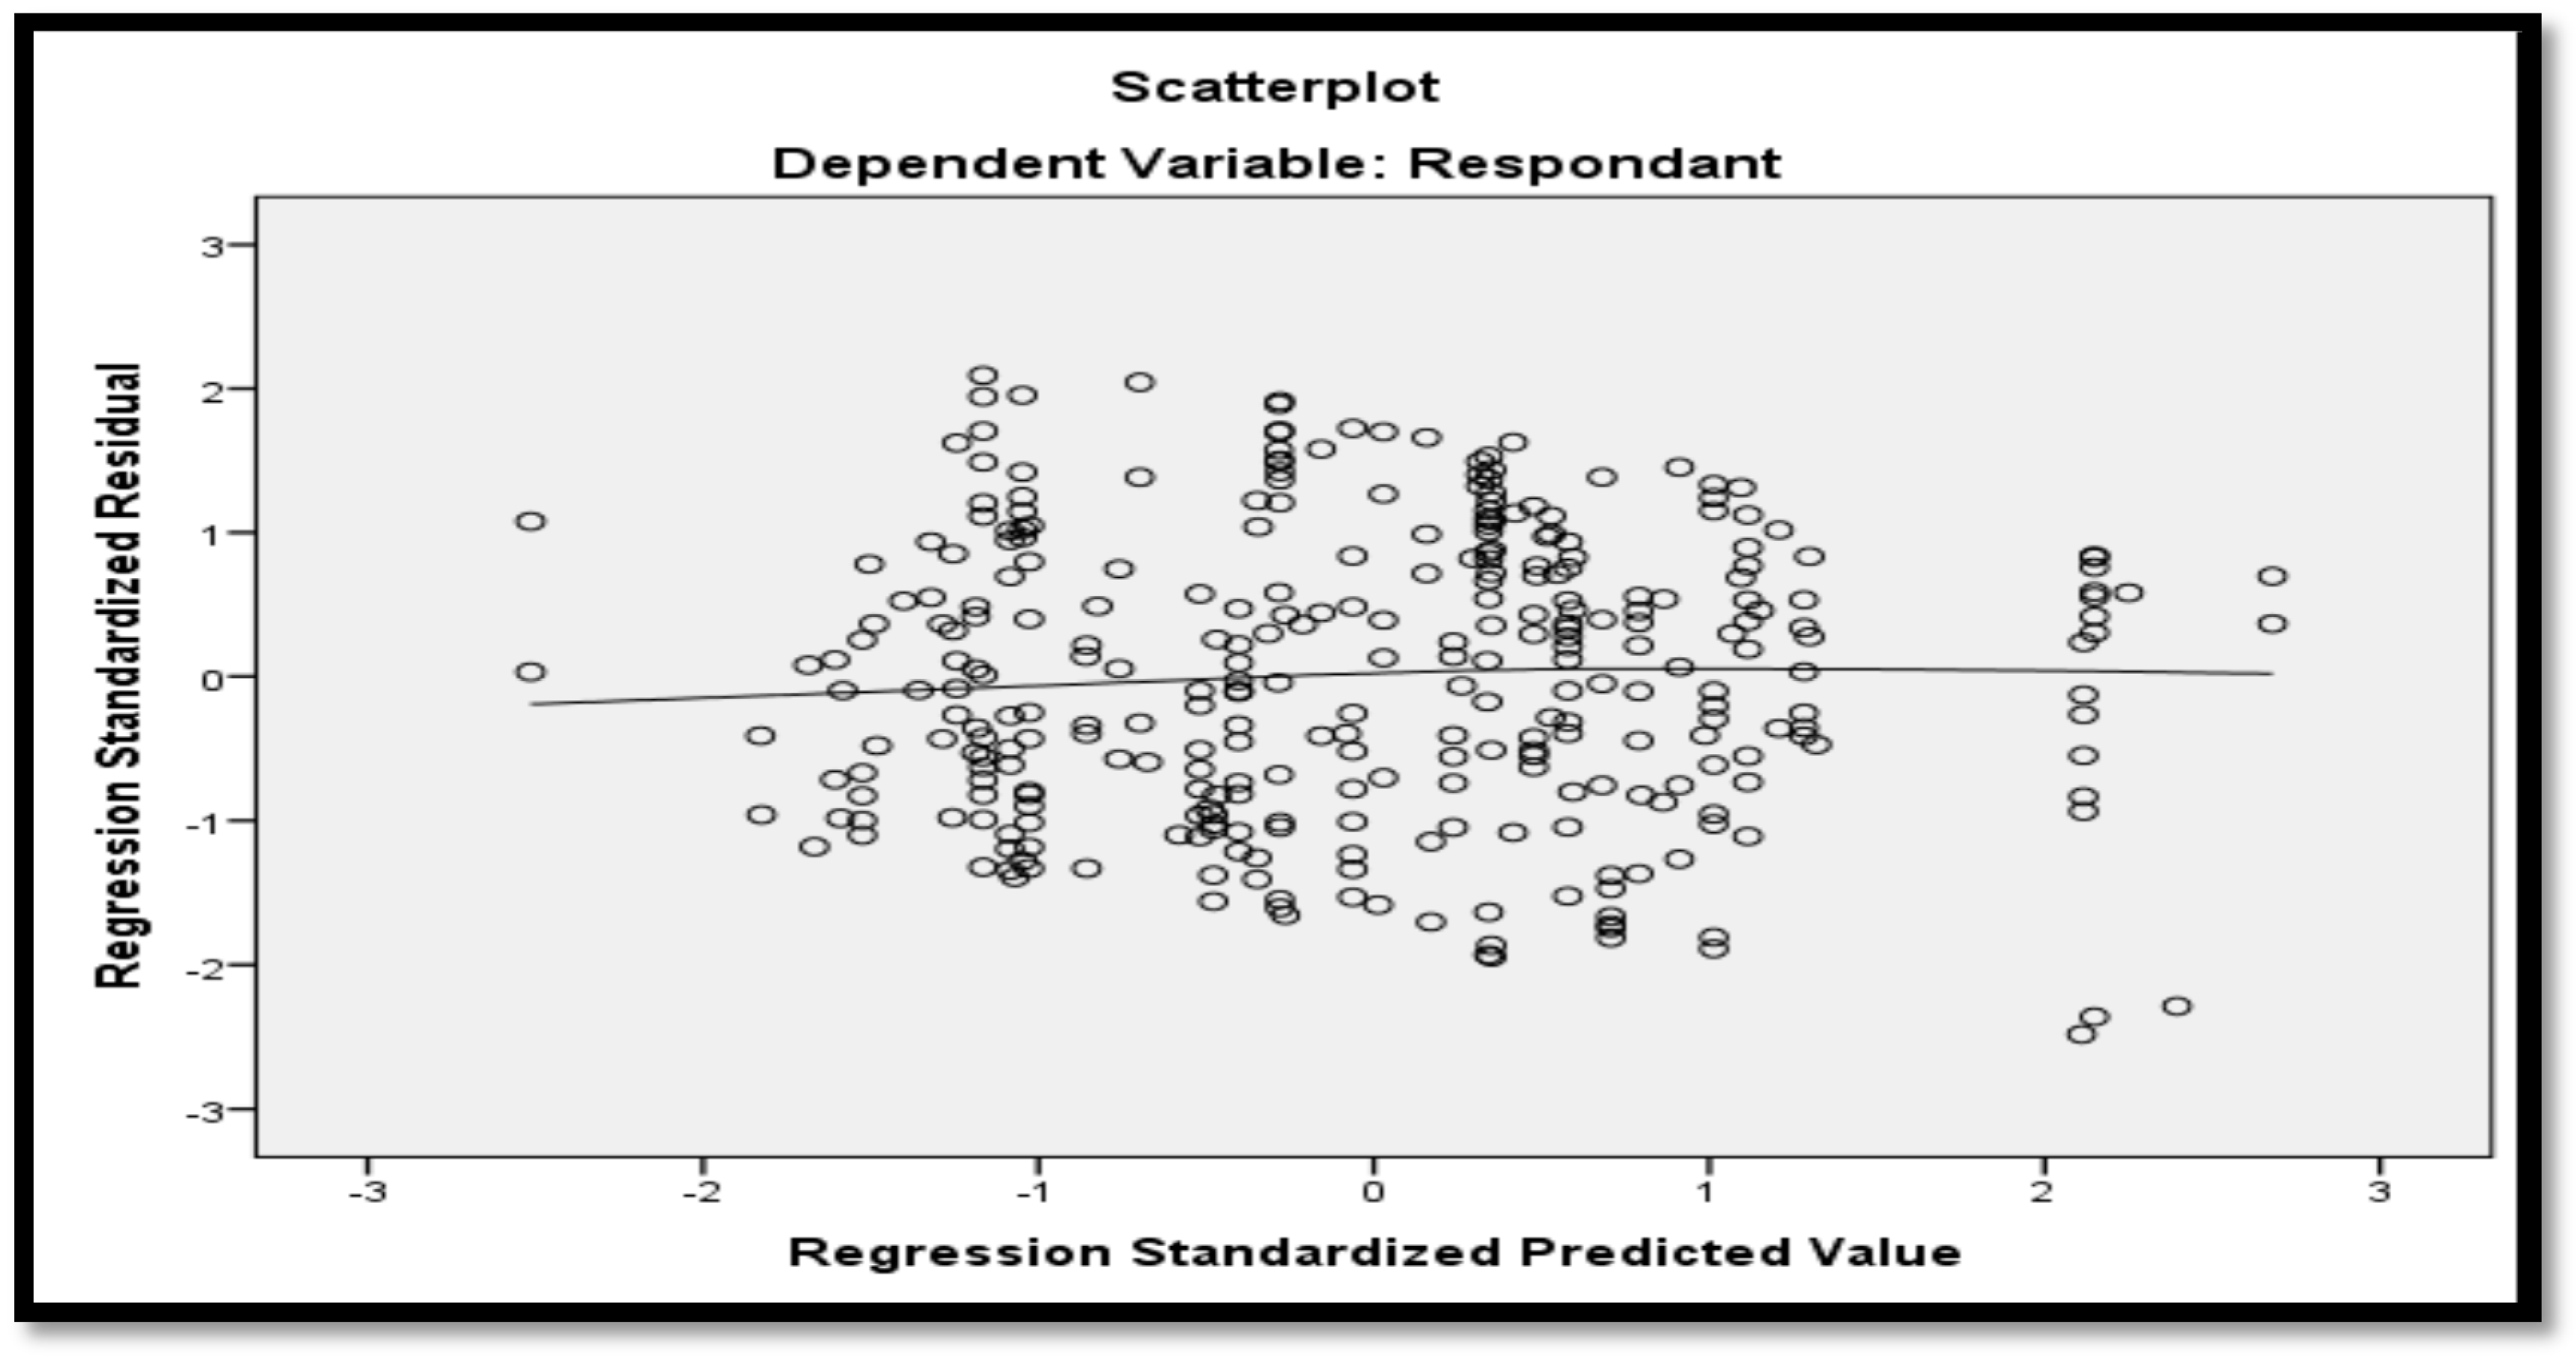
4.1.4. Homoscedasticity
The Rule of Homoscedasticity was also validated using the scatter-plot technique. It was observed that the data were distributed in a ‘bird’s nest’ formation and the ‘loess line’ was almost straight with no sharp turns. This is shown graphically in Figure 9.
4.1.5. Variance Values
In this test, the variance values were analysed to check whether any single measured variable had a variance value more than 10 times that of any other measured variable. It was observed that all variance values satisfied the requirement, having the same value. However, disaster management was a little lower than others. Please refer to Table 4.
4.1.6. Sample Size Adequacy
4.2. Measure Refinement and Validation
The scales were purified during the pilot study, but it was still necessary to ensure that the data were valid and reliable before proceeding to the inferential statistics stage. This is a prerequisite to ensure that the data is adequate for use in the structural model [52,53].
4.2.1. Reliability
Hair et al. [39], state that reliability is a measure of the degree to which a set of indicators of a latent construct is internally consistent in its measurement based on the degree to which the indicators are interrelated. Cronbach’s Alpha is normally used to measure this internal consistency or reliability (A scale is considered reliable when Cronbach’s alpha is greater than 0.7.).
4.2.2. Cronbach’s Alpha Reliability
Cronbach’s Alpha for each variable was calculated in order to reach the threshold. The variable “Disaster Management” had a lower correlation of 0.223. If the variable was deleted, the Alpha value became 0.802. This weakness was also observed in earlier research [21] However, the total value was 0.729, so we considered all four items as HL skills for further analysis. HL practitioners’ Individual Performances produced a Cronbach’s Alpha value of 0.856 and there were no lower values for the individual item correlations. This showed that the scale was acceptable for further multivariate analysis. Humanitarian Organisational Performance was considered next and this produced the highest Cronbach’s Alpha value of 0.907. It was therefore proven that all four scales were sufficiently reliable for further analysis. The Cronbach’s Alpha value for each variable is in Table 6.
4.2.3. Validity
The following three types of validity were calculated to establish the overall validity of the data [39]:
- Convergent Validity.
- Discriminant Validity.
- Nomological Validity.
For that reason, we conducted two validity tests and the third validity was automatically established since the other two were established.
Convergent Validity
Convergent validity is a measure of the degree to which measures of constructs are theoretically and factually related [52]. The Average Variance Extracted (AVE) and Composite Reliability (CR) were calculated through the AVE/CR Calculator [54]. Through this, the Convergent Validity was established for all three variables. Please refer to Table 7.
Discriminant Validity
Discriminant Validity is a measure of whether concepts or measurements are in fact related when they should not be [53]. This is calculated by comparing the AVE values and squaring the correlations. AVE should be greater than the squared correlation. So, Discriminant Validity was also confirmed for each construct in Table 8.
Nomological Validity
4.2.4. Goodness of Fit (GOF) and Other Indices for Measurement Models
Hair et al. [39], stated that a measurement model can be evaluated using GOF and that this can be identified under the following three categories:
- Absolute Measures that indicate how well the deduced theory fits the observed data.
- Incremental Measures that explains how well a specified model fits relative to some alternative baseline or null model.
- Parsimony Measures that are conceptually similar to R2 as the measure relates model fit to model complexity.
Hair et al. [39], suggest that the GOF indices include at least one of each measure. They further suggest that χ2 may be a less useful GOF measure for complex models with a large sample size. This is because χ2 may be insignificant in these models. Table 9 gives the GOF thresholds. Additionally, prior to consideration of the GOF indices, the following three values should also be calculated to determine the magnitude and direction of the parameters [53]:
- R2 Value. This measures how close the data fits the regression line. It should have a value higher than 0.25.
- Standardized Value (λ). This provides an indication of the strength of the relationship between variables. Values should be higher than 0.5 if there is a strong relationship.
- ‘T’ Value. This measures the size of the difference relative to the variation in sample data. An acceptable value should be greater than 1.96.
These values were also analysed to approve the Measurement Model.
Measurement Model
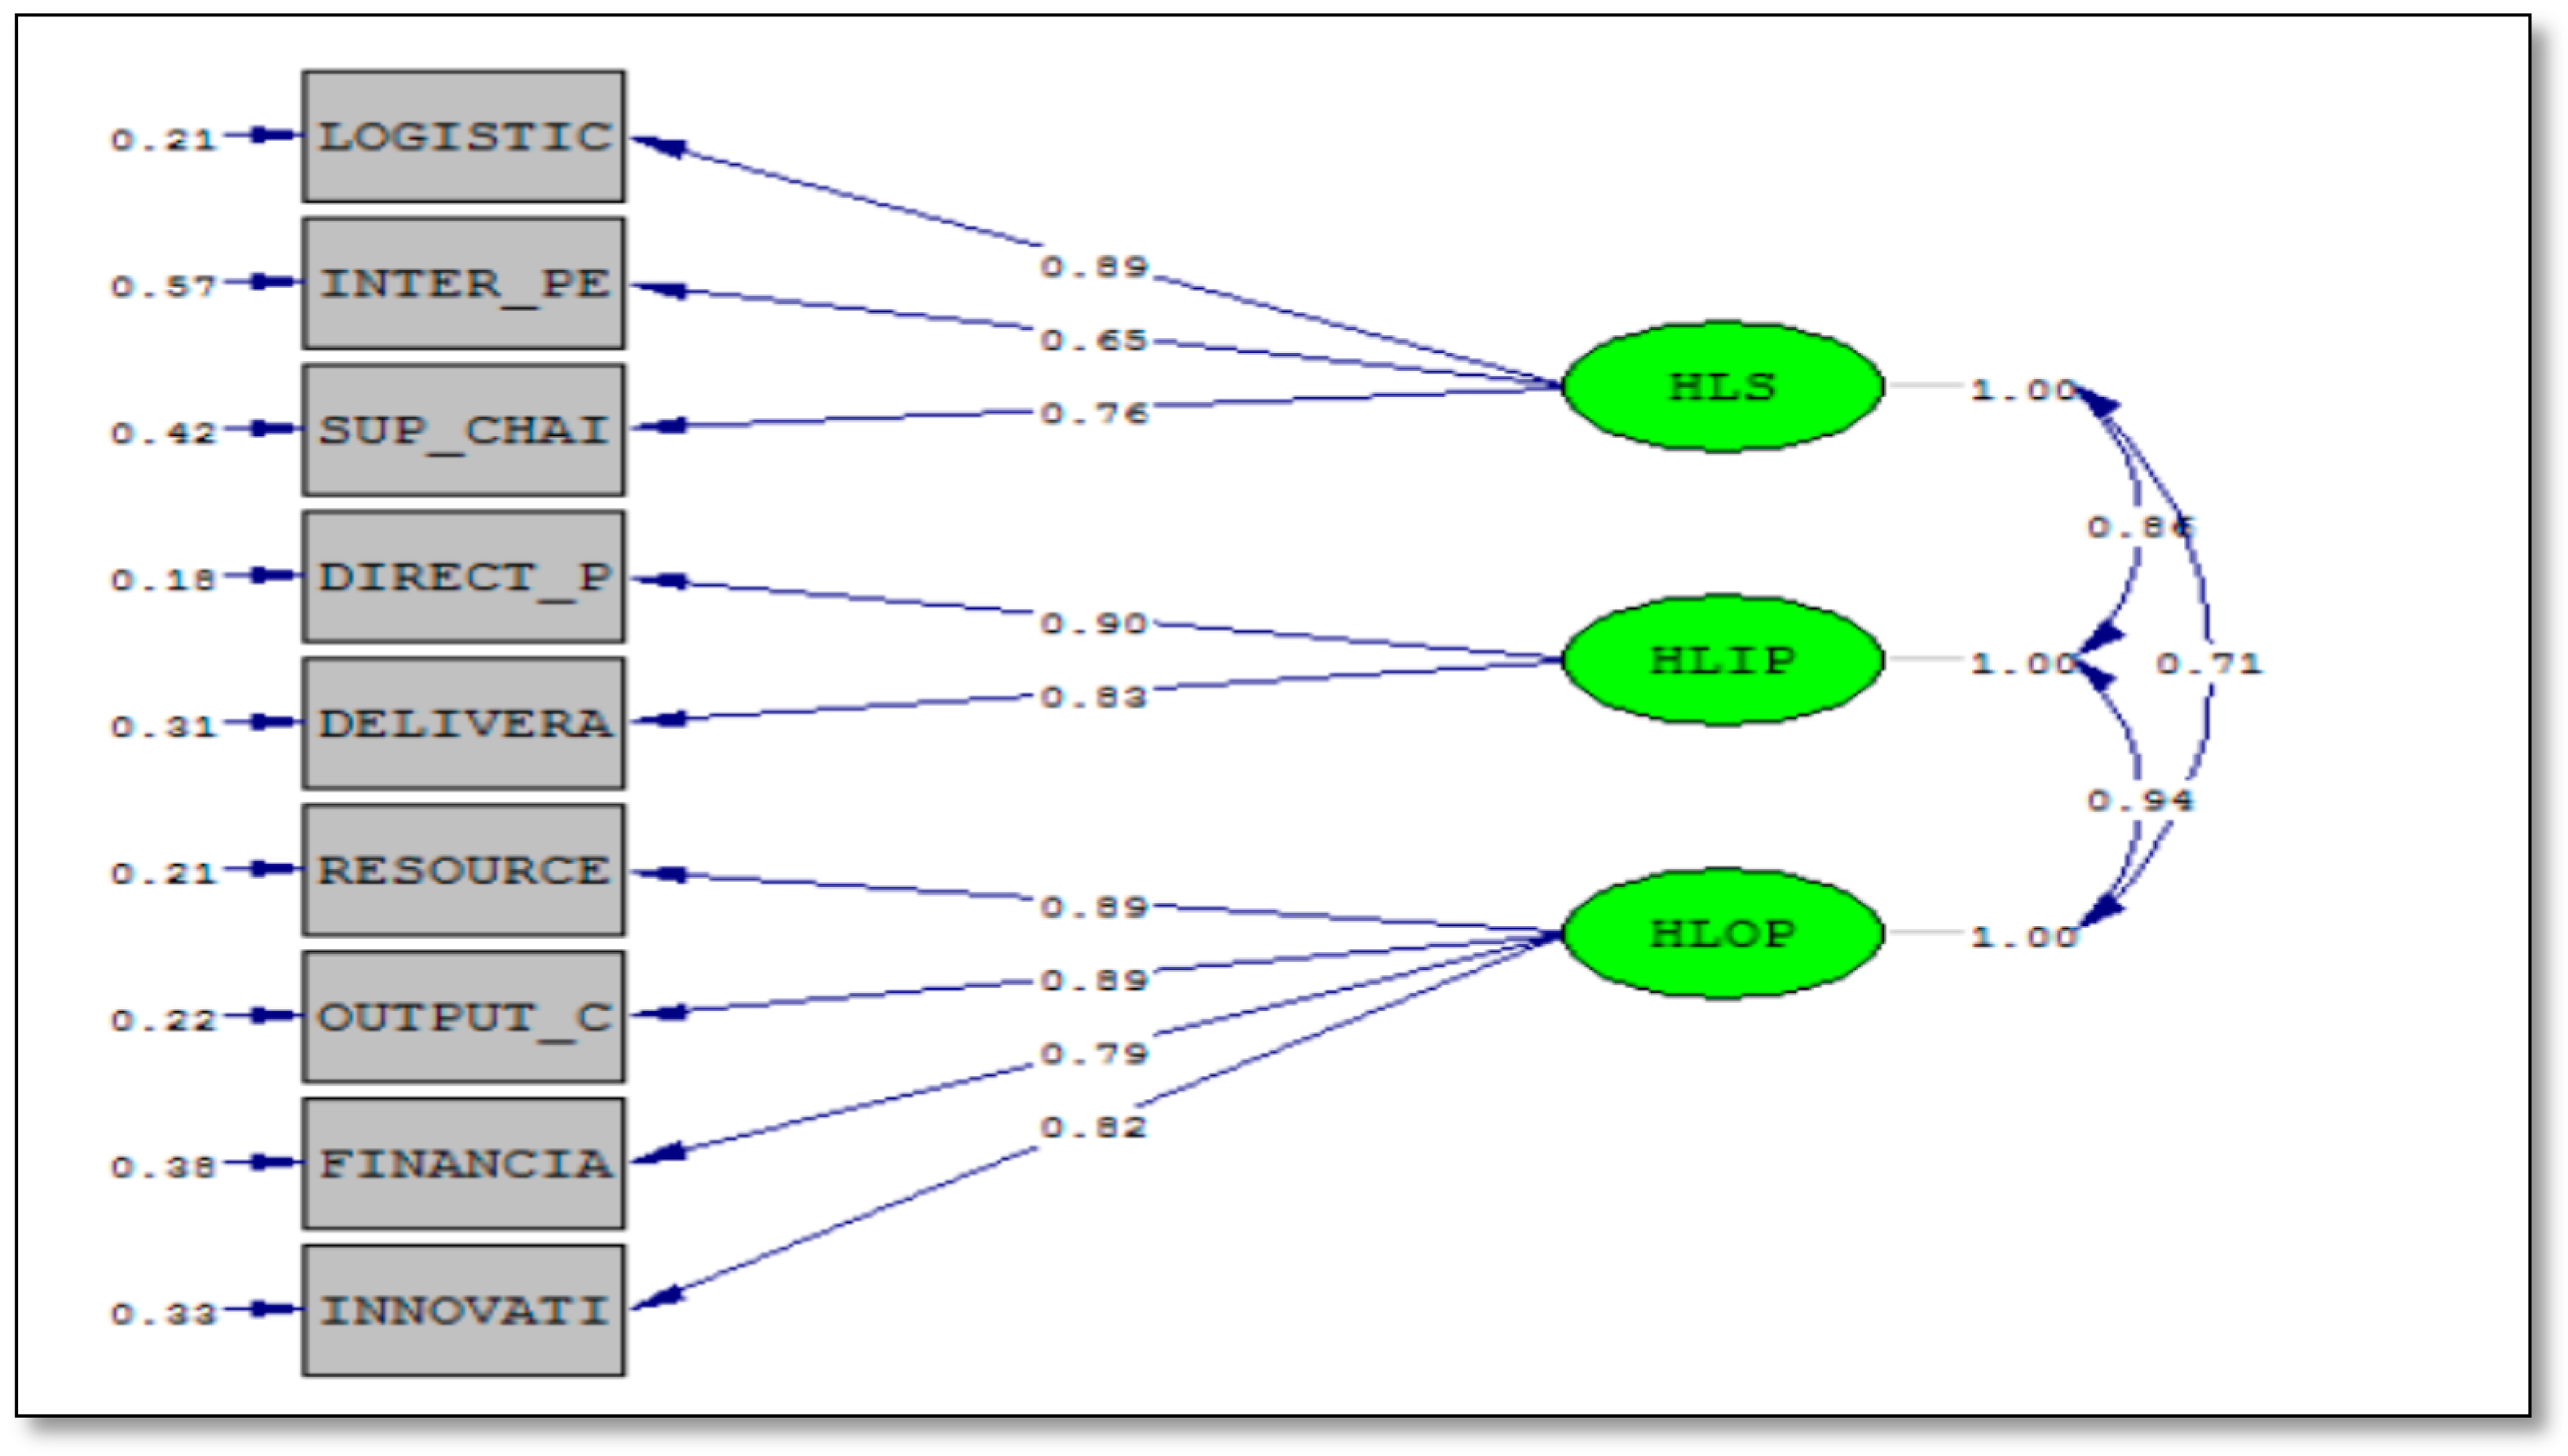
The Measurement Model will determine the suitability of the data for the structural model. It is constructed and tested to conduct the Confirmatory Factor Analysis (CFA) as an important component of the Structural Model. Hair et al. [39], explain how the Measurement Model indicates the error terms and ensures the validity and uni-dimensionality of the construct. The theoretical model consisted of three variables that are used in the final Measurement Model in Figure 10.
The Measurement Model comprises nine items intended to measure their corresponding variables. Table 10 shows the values of each item along with its level of significance. This was conducted to determine the magnitude and direction of the parameters.
4.2.5. GOF Measures for the Measurement Model
It can be seen from Table 11 that the GFI, RMSEA and AGFI are well within the qualified thresholds. In addition, all incremental and parsimony indices are greater than 0.5. Both these indicate a good model fit. Hair et al. (2010) state that it is unrealistic to achieve 0.9 cut-offs for more complicated models that consist of a number of observed and unobserved variables. As χ2 and GOF indices are a function of the sample size, smaller samples may not fit the model with 0.9 thresholds for GOF. Therefore, the observed data, by inference, support the absolute GOF. From this, the model fit of the Measurement Model is confirmed.
4.3. Structural Model and Hypothesis Testing
The structural model analysis must be determined to examine the causal relationships between the variables or predictions where relationships among exogenous and endogenous variables are recognised23. For this reason, the conceptual framework of the study proposed the following two hypotheses:
- Hypothesis 1 H1: HL Skills (HLS) influence the performance of HL practitioners (HLIP).
- Hypothesis 2 H2: Well performed HL practitioners’ contribute to increase Humanitarian Organisational Performance (HOP).
These hypotheses had to be tested and the basic structural model shown in Figure 11 was developed to do this.
4.3.1. Parameter Fit of the Structural Model
Schumacker and Lomax [53], indicated that the interpretation of parameter estimates in any model analysis is essential prior to conducting a GOF analysis. Therefore, the following steps were carried out:
- Step 1. Examine the parameter estimates to determine whether they have the correct sign (positive or negative). In this study all values do have positive signs. This supports the expectation that there is a positive relationship between each independent and dependent variable.
- Step 2. Examine the Parameter Estimates (Standardized Coefficients) to determine whether they are out of bounds or exceed the expected range of values. When considering the values of each proposition, it was proven that this condition was fulfilled. These are shown in Table 12.
- Step 3. Examine the Parameter Estimates for statistical significance (T or Z-values = parameter estimate divided by standard error of parameter estimate). Tests were carried out on the statistical values generated by the two structural equations of the LISREL output from the Structural Model. The Z values were shown to be equal to the Parameter Estimate divided by the Standard Error of the Parameter Estimates. This is shown in Table 13.
The Structural Model therefore passed the Parameter Fit tests.
4.3.2. GOF of the Structural Model
The Structural Model in Figure 11 shows relationships between the measurement indicators and the independent, intermediate and dependent variables. The GOF values are summarized in Table 14. All absolute, incremental, and parsimony measures indicate a perfect fit, so it is concluded that the Measurement Model supports the propositions and both the hypotheses were proven.
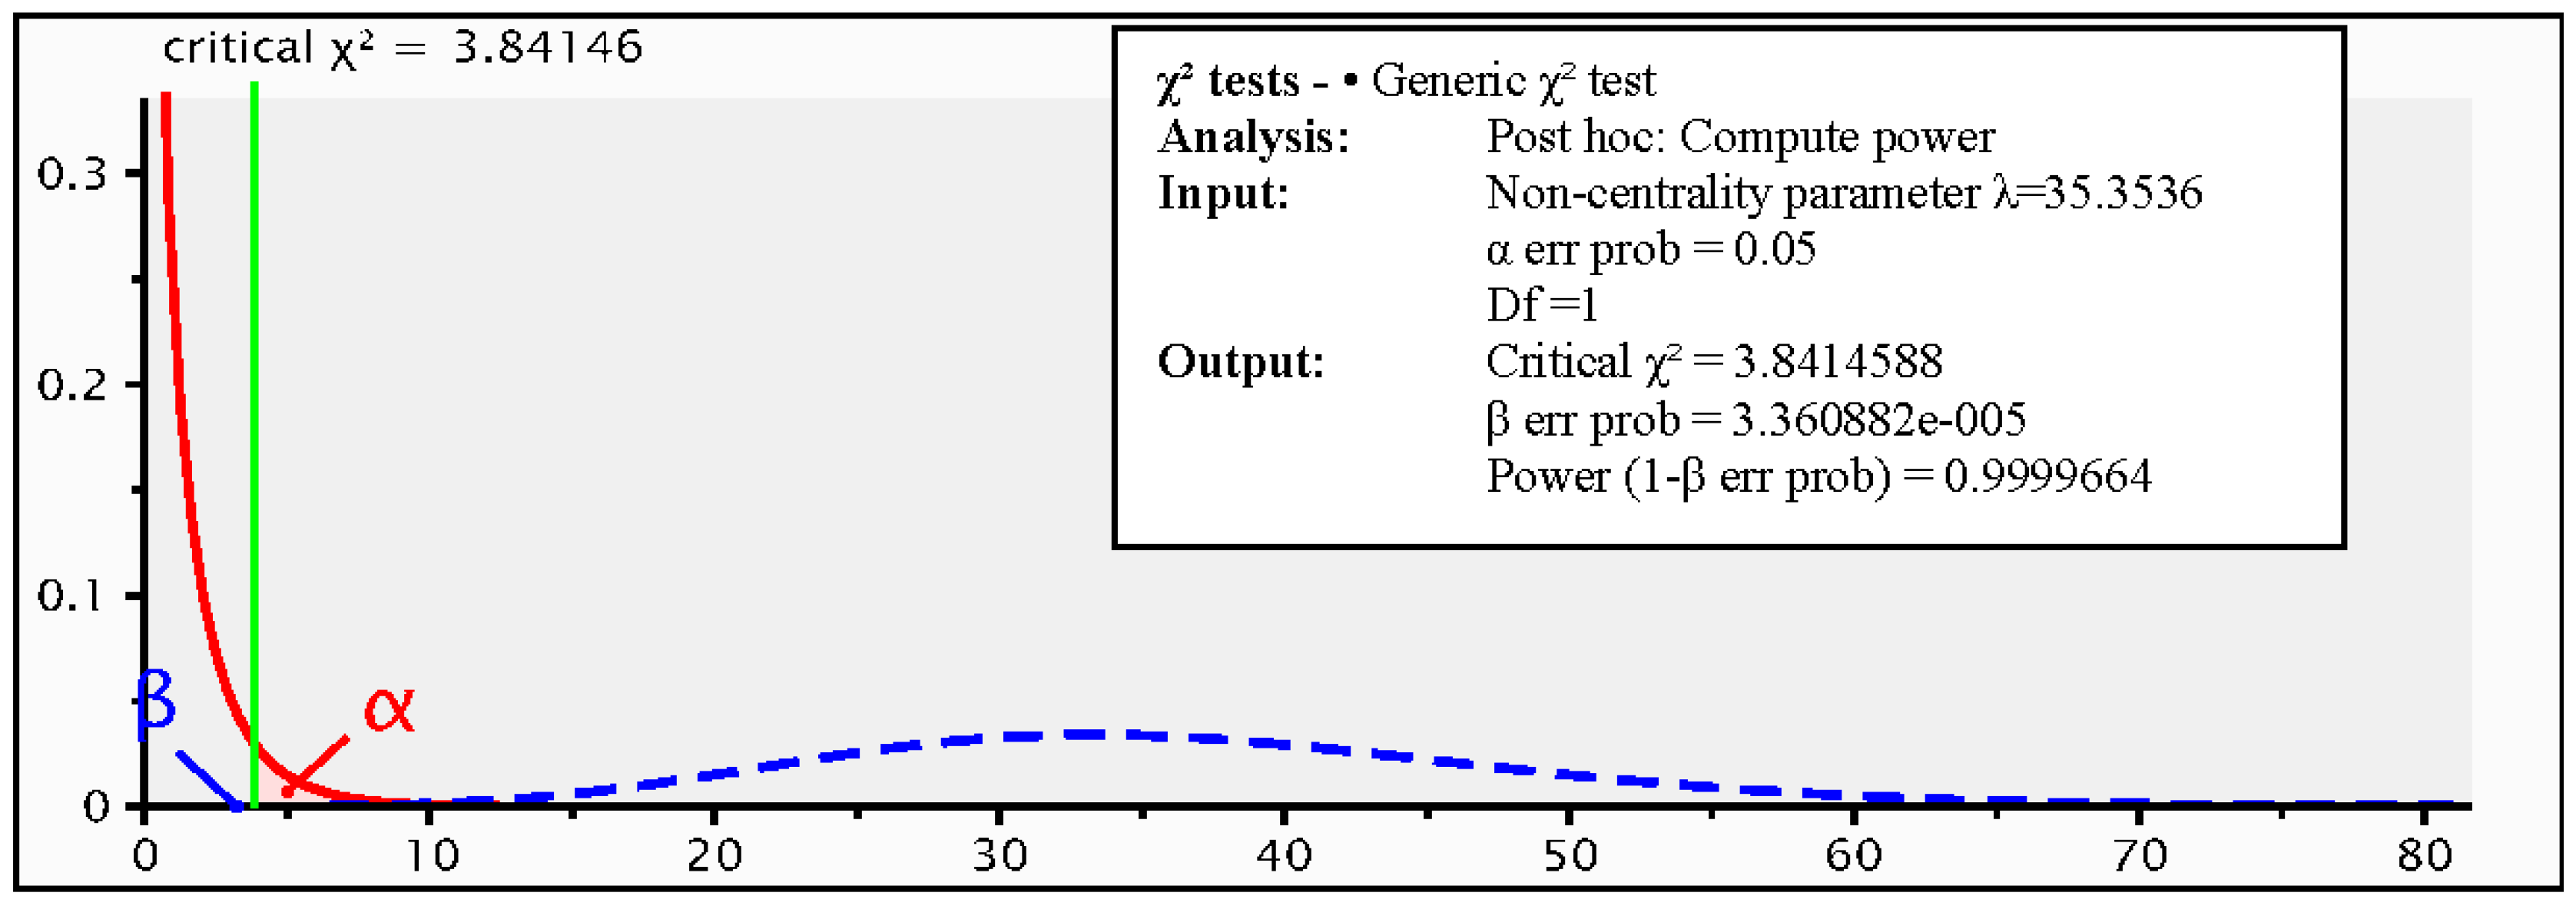
4.4. Power Analysis
Saris and Satorra (1993) proposed a model to show the percentage of null hypotheses that are correctly rejected, assuming that the null hypotheses (H0) are actually false. The method provides an easy approach to calculate the power of a theoretical model by using the Non-Centrality Parameter (NCP). The Power Analysis was performed using G*Power 3.1.9.2 [55] where a “Post-hoc: Compute power given a, and non-centrality parameter” was conducted. The NCP value of 35.35 was entered from the LISREL output. The results indicated that the model has a 99% chance of rejecting the null hypothesis at the 0.05 level of significance. This is well within the accepted level of 80%, so the Power Analysis was also acceptable See Figure 12.
5. Results and Discussion
The purpose of this paper was to show the relationship between HL Skills and Organisational Performance. A conceptual model was used with individual performance as an intervening variable. Earlier research [21] (Rajakaruna, Wijeratne, Mann, & Yan, 2017) indicated that the HL discipline has four components divided into 28 skills. Some of these skills do not make any contribution to performance at the level of individual HL practitioners. In this study, a SEM analysis was carried out to test the Conceptual Model and the two hypotheses derived from it. The methodology explained throughout Section 4 was used to test the SEM process and confirm the hypotheses. As a result, the following hypotheses were confirmed.
| H1 | - HL Skills Influence the Performance of HL practitioners. |
| H2 | - Performance of HL practitioners Increases the Performance of Humanitarian Organisations. |
The research analysis proved that there is a positive relationship between HL practitioners’ skills and performance. It also showed the existence of a positive relationship between Individual and Organisational Performance. Perhaps surprisingly, the HL Disaster Management skills of Disaster Management and Emergency Preparedness are not contributors to the performance of HL practitioners.
Identifying specific skills will enable the recruitment, training, and retention of the right personnel, thereby supporting HR development [18]. It will also assist with the training, development, teambuilding and empowerment of HL practitioners in challenging disasters. There were a number of relationships identified between the variables that can help to reduce the suffering of disaster victims by enabling organisations to employ and train HL practitioners with appropriate and useful skills. Training institutions should be able to benefit from this research as future training can now be aligned to the Measurement Model. The relationship between each of the variables can also be used as the basis for future learning. Finally, this model will also act as an aid for humanitarian organisation leadership to reduce the high turnover of HL practitioners [8].
6. Conclusions
This paper is intended to fill a research gap identified by previous studies into the relationship between skills and performance [5,6,13,14,21,33]. It was proven that high-performing (A concept within organisation development referring to teams, organisations, or virtual groups that are highly focused on their goals and that achieve superior results.) teams of HL practitioners contribute to the performance of humanitarian organisations. The research has been limited to the Sri Lankan humanitarian context, but the significance of these relationships may differ from country or region, and with the type of humanitarian disaster [33]. Although a deliberate effort was taken to minimize the sample bias in convenience sampling, it is recommended that future research use more robust sampling methods to reduce the variance (albeit acceptable) in these results. Due to the relatively small participation of women in Sri Lankan HL, it was not possible to analyse gender’s influence on the results. It is suggested that future research explore the effect of gender on the relationship between skills and performance [11]. It is also recommended that further research be conducted into finding other manifested variables that may contribute to the latent variables discussed in this research. Finally, it is recommended that this model be used in commercial logistics sectors to identify the relationships between specialist logistics skills and performance in different contexts.
Acknowledgments
The authors would like to thank the respondents of the field survey and the Ministry of Disaster Management of Sri Lanka.
Author Contributions
Shanaka Rajakaruna and Alge Wijeratne conceived and designed the experiments; filed survey carried out by Shanaka Rajakaruna; Chen Yan contributed analysis tools; Shanaka Rajakaruna and Tim Mann wrote the paper.
Conflicts of Interest
The authors declare no conflict of interest.
References
- Kovács, G.; Spens, K. Identifying challenges in humanitarian logistics. J. Phys. Distrib. Logist. Manag. 2009, 39, 506–528. [Google Scholar] [CrossRef]
- Schulz, S.F.; Heigh, I. Logistics performance management in action within a humanitarian organization. Manag. Res. News 2009, 32, 1038–1049. [Google Scholar] [CrossRef]
- Van Wassenhove, L.N. Humanitarian Aid Logistics: Supply Chain Management in High Gear. J. Oper. Res. Soc. 2006, 57, 475–589. [Google Scholar] [CrossRef]
- Kozlowski, S.; Gully, S.; Brown, F.; Salas, E. Effects of training goals and goal orientation traits on multidimensional training outcomes and performance adaptability. Organ. Behav. Hum. Decis. Process. 2001, 85, 1–31. [Google Scholar] [CrossRef] [PubMed]
- Kovács, G.; Spens, K. Humanitarian Logistics and Supply Chain Management: The start of a new journal. J. Humanit. Logist. Supply Chain Manag. 2011, 1, 5–14. [Google Scholar] [CrossRef]
- De Leeuw, S. Towards a Reference Mission Map for Performance Measurement in Humanitarian Supply Chains; IFIP International Federation for Information Processing: Laxenburg, Austria, 2010. [Google Scholar]
- Fernando, R.; Lalitha, S.; Abeykoon, K. An Analysis of the Effectiveness of Implementing Public Awareness, Education and Training Programmes as a Risk Reduction Strategy in Disaster Management in Sri Lanka. In Strategic Disaster Risk Management in Asia; Springer: New Delhi, India, 2015; pp. 69–86. [Google Scholar]
- Perry, M. Humanitarian Relief Challenges in the Wake of the South Asian Tsunami Disaster; Monash University: Melbourne, Australia, 2006. [Google Scholar]
- Rajakaruna, S.; Wijeratne, A.; Yan, C. Humanitarian Logistics Training Needs: A Systematic Review in Relation to Sri Lankan Humanitarian Sector. In Proceedings of the 13th International Conference in Business Management, University of Sri Jayawardanapura, Colombo, Sri Lanka, 8 December 2016. [Google Scholar]
- Kovács, G.; Tatham, P.H. What is Special About a Humanitarian Logistician? A Survey of Logistic Skills and Performance. Supply Chain Forum Int. J. 2010, 11, 32–41. [Google Scholar]
- Cooper, M.C.; Santosa, J.; Hurst, D.C.; Sander, N.R. Career Patterns of Women in Logistics. 2010. Available online: http://cscmp.org/career/career-patterns.asp (accessed on 20 August 2014).
- Blecken, A.; Hellingrath, B.; Dangelmeier, W.; Schulz, S.F. A humanitarian supply chain process reference model. Int. J. Serv. Technol. Manag. 2009, 12, 391–413. [Google Scholar] [CrossRef]
- Beamon, B.; Balcik, B. Performance measurement in humanitarian relief chains. Int. J. Publ. Sect. Manag. 2008, 21, 4–25. [Google Scholar] [CrossRef]
- Kovács, G.; Tatham, P.; Larson, P.D. What Skills Are Needed to be a Humanitarian Logistician? J. Bus. Logist. 2012, 33, 245–258. [Google Scholar] [CrossRef]
- Fritz. Logistics and the Effective Delivery of Humanitarian Relief; Frtiz Institute: San Francisco, CA, USA, 2005. [Google Scholar]
- Gammelgaard, B.; Larson, P.D. Logistics Skills and Competencies for Supply Chain Management. J. Bus. Logist. 2001, 22, 27–50. [Google Scholar] [CrossRef]
- Gibson, B.J.; Cook, R.L. Hiring Practices in US Third Party Logistics Firms. Int. J. Phys. Distrib. Logist. Manag. 2001, 31, 714–732. [Google Scholar] [CrossRef]
- Collis, D.J.; Montgomery, C.A. Competing on Resources. Harv. Bus. Rev. 1995, 73, 118–128. [Google Scholar]
- André, R. Leading Diverse Management Teams in Logistics. J. Bus. Logist. 1995, 16, 65–84. [Google Scholar]
- Mangan, J.; Christopher, M. Management Development and the Supply Chain Manager of the Future. Int. J. Logist. Manag. 2005, 16, 178–191. [Google Scholar] [CrossRef] [Green Version]
- Rajakaruna, S.; Wijeratne, A.; Mann, T.; Yan, C. Identifying key skill sets in humanitarian logistics: Developing a model for Sri Lanka. Int. J. Disaster Risk Reduct. 2017, 24, 58–65. [Google Scholar] [CrossRef]
- Ellinger, A.E.; Musgrove, C.C.F.; Ellinger, A.D.; Bachrach, D.G.; Baş, A.B.E.; Wang, Y.L. Influences of organisational investments in social capital on service employee commitment and performance. J. Bus. Res. 2013, 66, 1124–1133. [Google Scholar] [CrossRef]
- Barber, A. Recruiting Employees: Individual and Organisational Perspectives; Sage: Thousand Oaks, CA, USA, 1998. [Google Scholar]
- Borman, W.C.; Hanson, M.A.; Oppler, S.H.; Pulakos, E.D.; White, L.A. Role of early supervisory experience in supervisor performance. J. Appl. Psychol. 1993, 78, 443–449. [Google Scholar] [CrossRef]
- Dusterhoff, C.; Cunningham, J.; MacGregor, J. The Effects of Performance Rating, Leader—Member Exchange, Perceived Utility, and Organisational Justice on Performance Appraisal Satisfaction: Applying a Moral Judgment Perspective. J. Bus. Ethics 2014, 119, 265–273. [Google Scholar] [CrossRef]
- A Handbook for Measuring Employee Performance. 2011. Available online: https://www.opm.gov/policy-data-oversight/performance-management/measuring/employee_performance_handbook.pdf (accessed on 12 October 2015).
- Chockalingam, W. Assessment of Individual Job Performance: A Review of the Past Century and a Look Ahead. In Handbook of Industrial, Work and Organisational Psychology; SAGE Publications Ltd.: Thousand Oaks, CA, USA, 2001; Volume 1, pp. 110–126. [Google Scholar]
- Kim, T.; Holzer, M. Public Employees and Performance Appraisal: A Study of Antecedents to Employees’ Perception of the Process. Rev. Public Pers. Adm. 2014, 36, 31–56. [Google Scholar] [CrossRef]
- Mostafa, A.; Gould-Williams, J. Testing the mediation effect of person—Organisation fit on the relationship between high performance HR practices and employee outcomes in the Egyptian public sector. Int. J. Hum. Resour. Manag. 2014, 25, 276–292. [Google Scholar] [CrossRef]
- Yadav, R.; Dabhade, N. Performance management system in Maharatna Companies (a leading public sector undertaking) of India—A case study of B.H.E.L.; Bhopal (M.P.). Int. Lett. Soc. Humanist. Sci. 2013, 4, 49–69. [Google Scholar] [CrossRef]
- Davidson, A. Key Performance Indicators in Humanitarian Logistics. 2006. Available online: http://www.fritzinstitute.org/pdfs/findings/xs_davidson_anne.pdf (accessed on 26 December 2013).
- Abidi, H.; Klumpp, M.; de Leeuw, S. Humanitarian supply chain performance management: A systematic literature review. Supply Chain Manag. Int. J. 2014, 19, 214–221. [Google Scholar] [CrossRef]
- Haavvisto, I. Performance in Humanitarian Supply Chains. Ph.D. Thesis, Hanken School of Economics, Helsinki, Finland, 2014. [Google Scholar]
- Kaplan, R.; Norton, D. The balanced scorecard—Measures that drive performance. Harv. Bus. Rev. 1992, 71–79. [Google Scholar]
- Kunz, N.; Reiner, G. A meta-analysis of humanitarian logistics research. J. Humanit. Logist. Supply Chain Manag. 2012, 2, 116–147. [Google Scholar] [CrossRef]
- Lu, Q.; Goh, M.; De Souza, R. A SCOR framework to measure logistics performance of humanitarian organizations. J. Humanit. Logist. Supply Chain Manag. 2016, 6, 222–239. [Google Scholar] [CrossRef]
- Van der Lan, E.; De Brito, M.; Vergunst, D. Performance measurement in humanitarian supply chains. Int. J. Risk Assess. Manag. 2009, 13, 22–45. [Google Scholar]
- Tatham, P.; Hughes, K. Humanitarian Logistics Metrics: Where We Are, and How We Might Improve. In Humanitarian Logistics: Meeting the Challenge of Preparing for and Responding to Disasters; Christopher, M., Tatham, P., Eds.; Kogan Page: London, UK, 2011; pp. 65–84. [Google Scholar]
- Hair, J.; Barry, W.; Rolph, B. Multivariate Data Analysis; Prentice Hall: New York, NY, USA, 2010. [Google Scholar]
- Afzalur, R.M.; Antonioni, D.; Psenicka, C. A structural equations model of leader power, subordinates’styles of handling conflict, and job performance. Int. J. Confl. Manag. 2001, 12, 191–211. [Google Scholar] [CrossRef]
- Hazen, B.; Overstreet, R.; Boone, C. Suggested reporting guidelines for structural equation modeling in supply chain management research. Int. J. Logist. Manag. 2015, 26, 627–641. [Google Scholar] [CrossRef]
- Medsker, J.; Williams, J. A Review of Current Practices for Evaluating Causal Models in Organisational Behavior and Human Resources Management Research. J. Manag. 1994, 20, 439–464. [Google Scholar]
- Aragón, M.; Jiménez, D.; Valle, R. Training and performance: The mediating role of organisational learning. BRQ Bus. Res. Q. 2014, 17, 161–173. [Google Scholar] [CrossRef]
- Wisner, J. A structural equation model of supply chain management strategies and firm performance. J. Bus. Logist. 2003, 24, 1–26. [Google Scholar] [CrossRef]
- Venkatraman, N.; Ramanujam, V. Measurement of Business Performance in Strategy Research: A Comparison of Approaches. Acad. Manag. Rev. 1986, 11, 801–814. [Google Scholar]
- Morris, S.; Daisley, R.; Wheeler, M.; Boyer, P. A meta-analysis of the relationship between individual assessments and job performance. J. Appl. Psychol. 2015, 100, 5. [Google Scholar] [CrossRef] [PubMed]
- Sekaran, U. Research Methods for Business; John Wiley & Sons Inc.: New Delihi, India, 2007. [Google Scholar]
- Moser, C.; Kalton, G. Survey Methods in Social Investigation, 2nd ed.; Gower Publishing Company Limited: Aldershot, UK, 1979. [Google Scholar]
- Allison, P. Missing Data; University of Pennsylvania; Sage: Thousand Oaks, CA, USA, 2001. [Google Scholar]
- Marina, S. Dealing with Missing Data: Key Assumptions and Methods for Applied Analysis; Boston Unversity: Boston, MA, USA, 2013. [Google Scholar]
- Soper, D. A-priori Sample Size for Structural Equation Models. 2016. Available online: http://www.danielsoper.com/statcalc/calculator.aspx?id=89 (accessed on 22 June 2017).
- Anderson, J.; Gerbing, D. Structural equation modeling in practice: A review and recommended two-step approach. Psychol. Bull. 1988, 103, 411–423. [Google Scholar] [CrossRef]
- Schumacker, R.; Lomax, R. A Beginner’s Guide to Structural Equation Modeling, 3rd ed.; Routledge: London, UK, 2010. [Google Scholar]
- Korchia, M. AVE CR Calculator. 2010. Available online: http://www.watoowatoo.net/sem/sem.html (accessed on 24 June 2017).
- Saris, W.; Satorra, A. Power evaluation in structural equation models. In Testing Structural Equation Models; Bollen, K.A., Long, J.S., Eds.; Sage: Newbury Park, CA, USA, 1993; pp. 181–204. [Google Scholar]
Figure 1.
Skills and competencies profile for Sri Lankan HL practitioners [21].
Figure 1.
Skills and competencies profile for Sri Lankan HL practitioners [21].

Figure 2.
Conceptual model. H1: HL skills influence the performance of HL practitioners; H2: Performance of HL practitioners increases the performance of humanitarian organisations.
Figure 2.
Conceptual model. H1: HL skills influence the performance of HL practitioners; H2: Performance of HL practitioners increases the performance of humanitarian organisations.
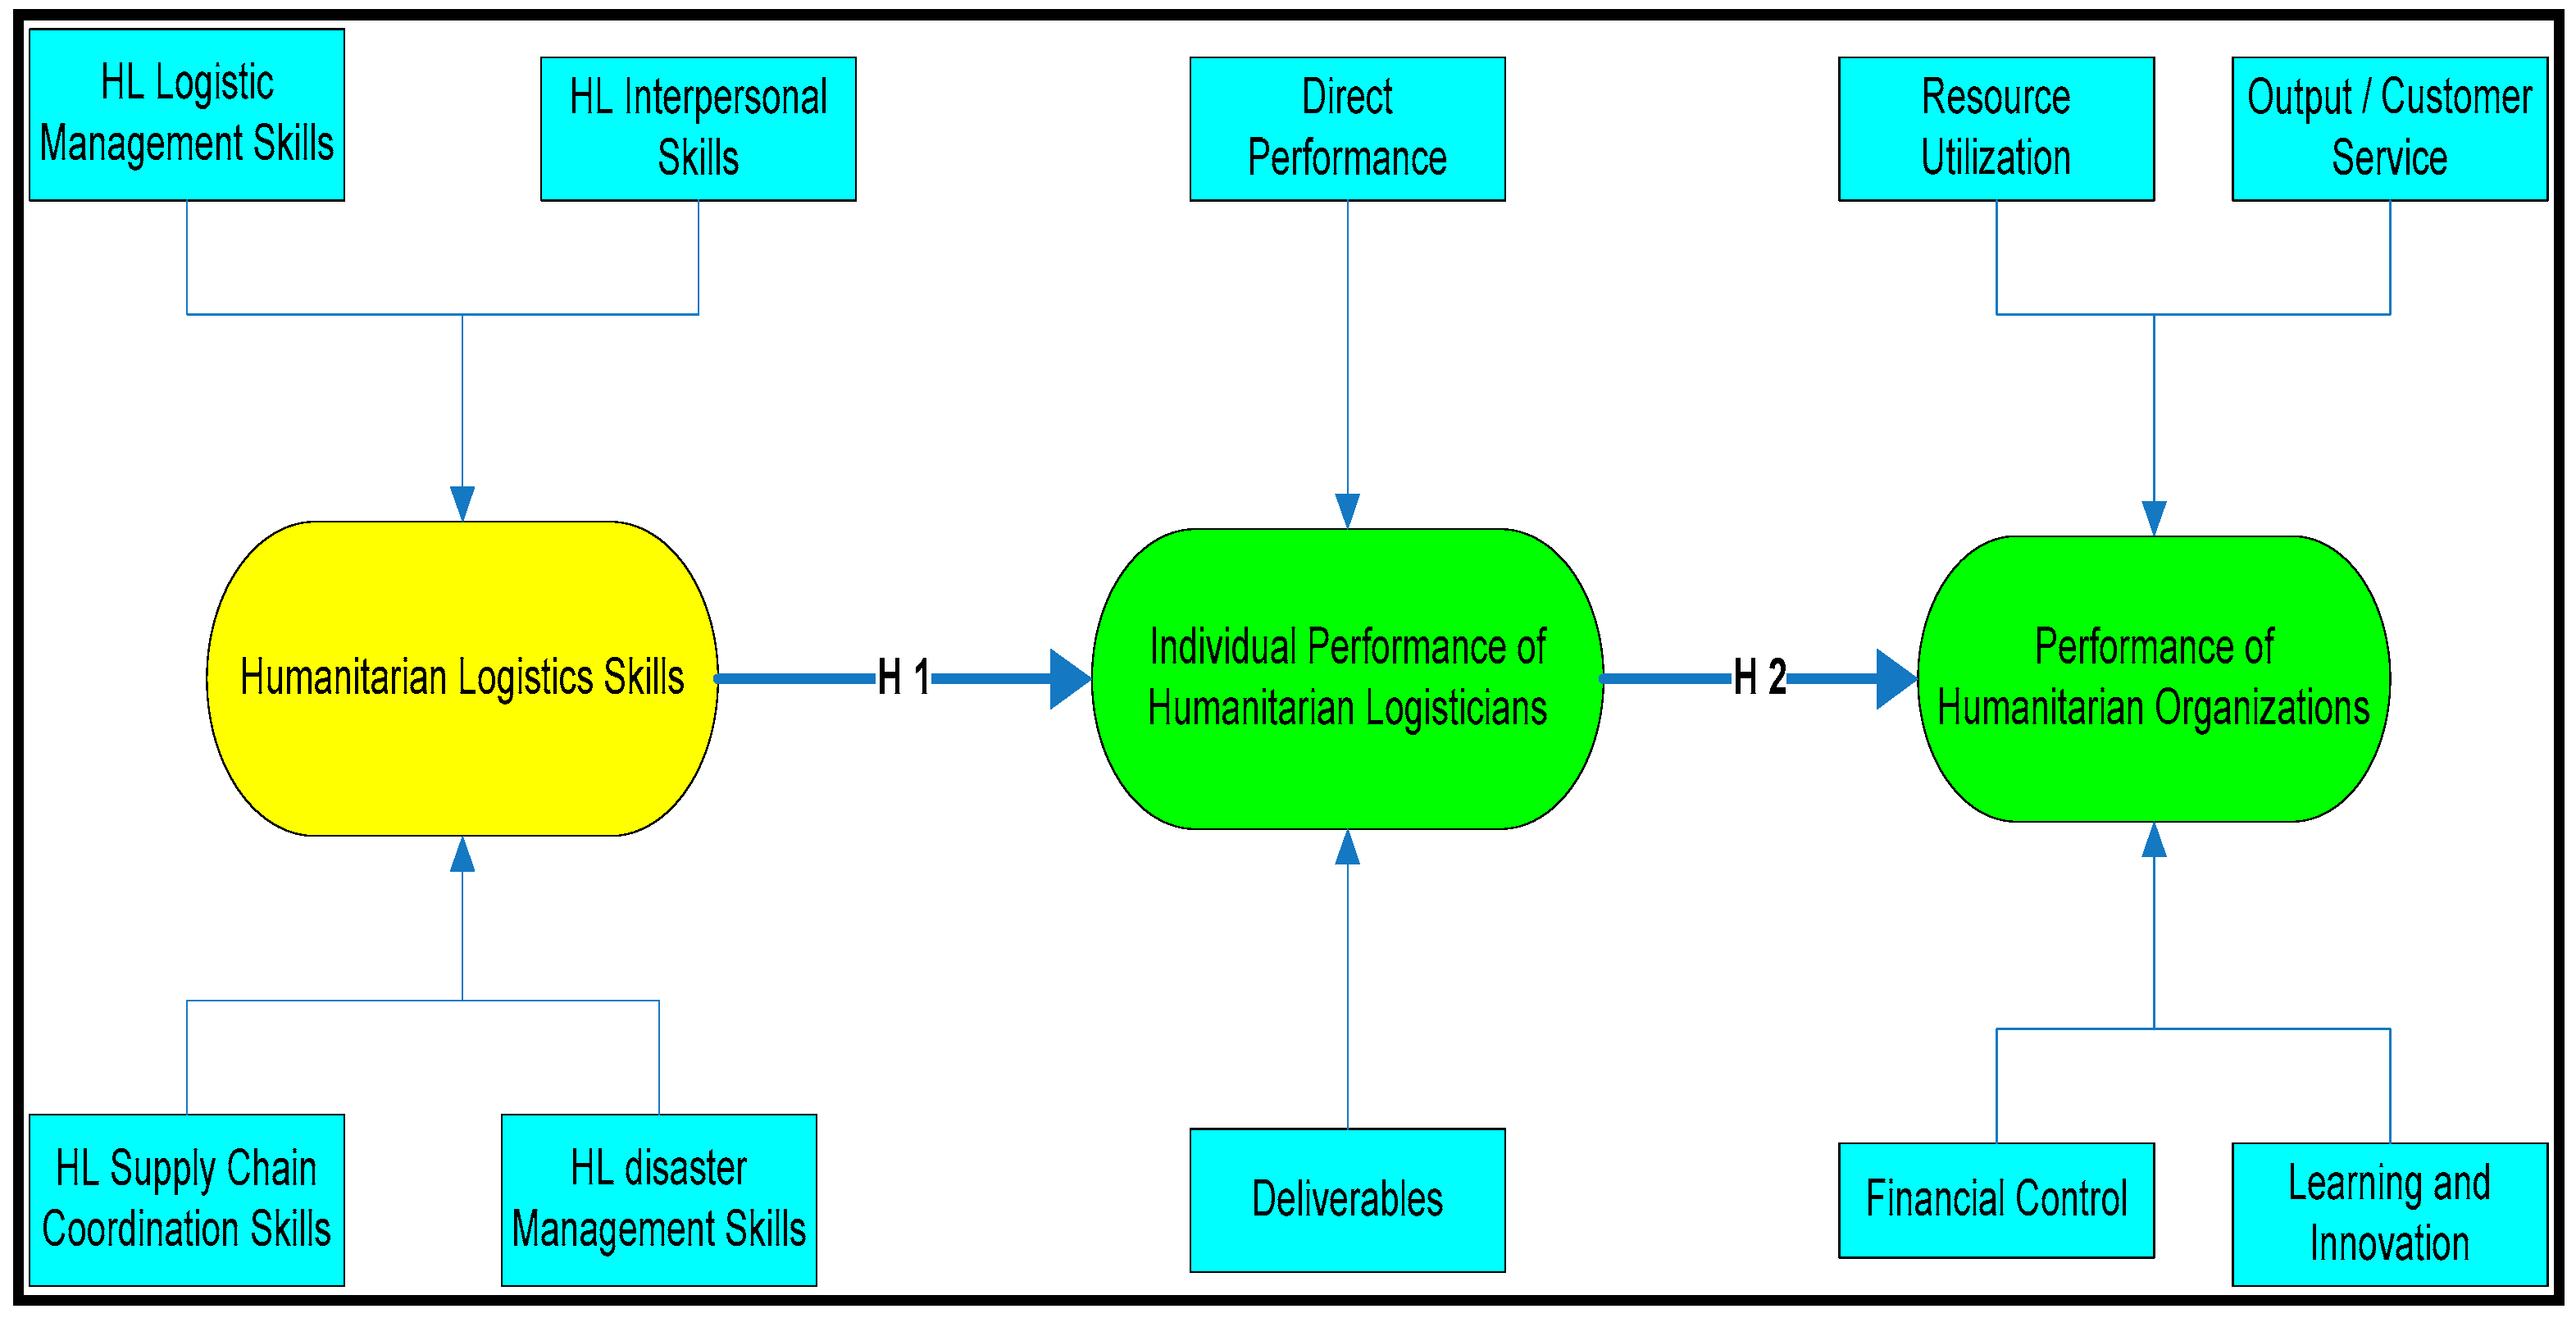
Figure 3.
Content validity. (All items that have ICVI values more than 0.78 were considered for the questionnaire. SCVI value was not considered since ICVI values were more than 0.78) Calculations of HL skills (Source: Survey data).
Figure 3.
Content validity. (All items that have ICVI values more than 0.78 were considered for the questionnaire. SCVI value was not considered since ICVI values were more than 0.78) Calculations of HL skills (Source: Survey data).
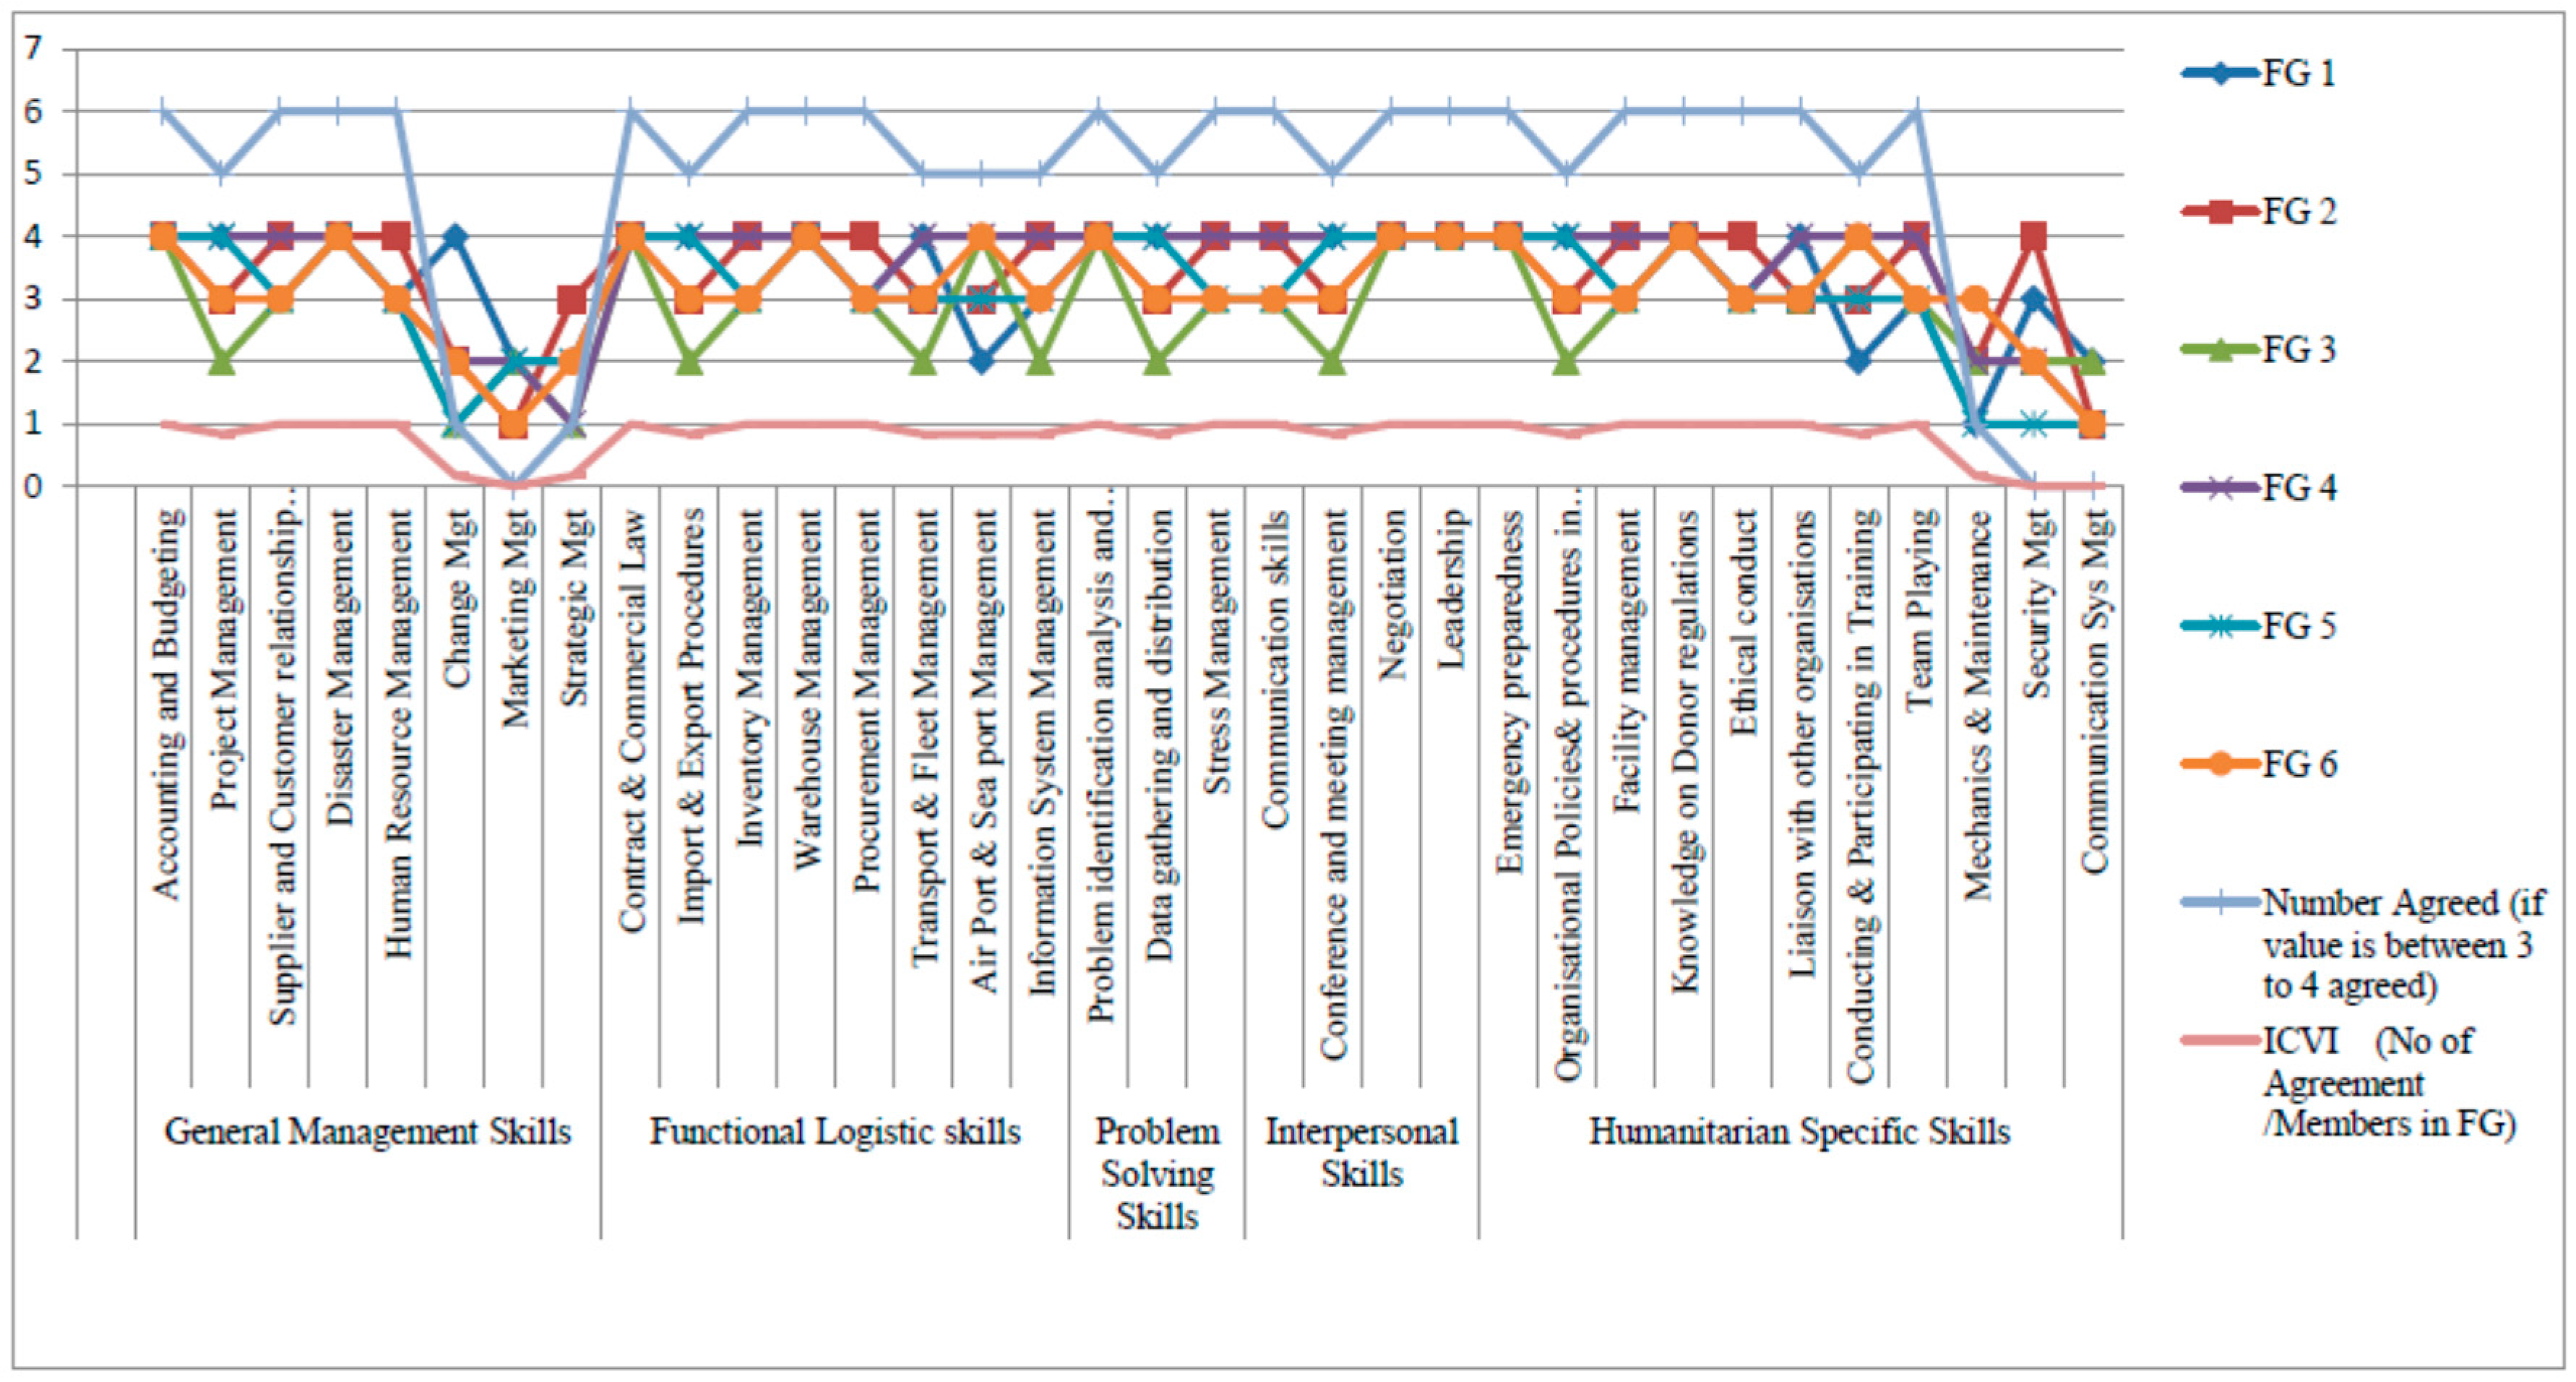
Figure 4.
Individual Item Content Validity (ICVI) (All items that have ICVI values more than 0.78 were considered for the questionnaire) calculations of performance of HL practitioners (Source: Survey data).
Figure 4.
Individual Item Content Validity (ICVI) (All items that have ICVI values more than 0.78 were considered for the questionnaire) calculations of performance of HL practitioners (Source: Survey data).
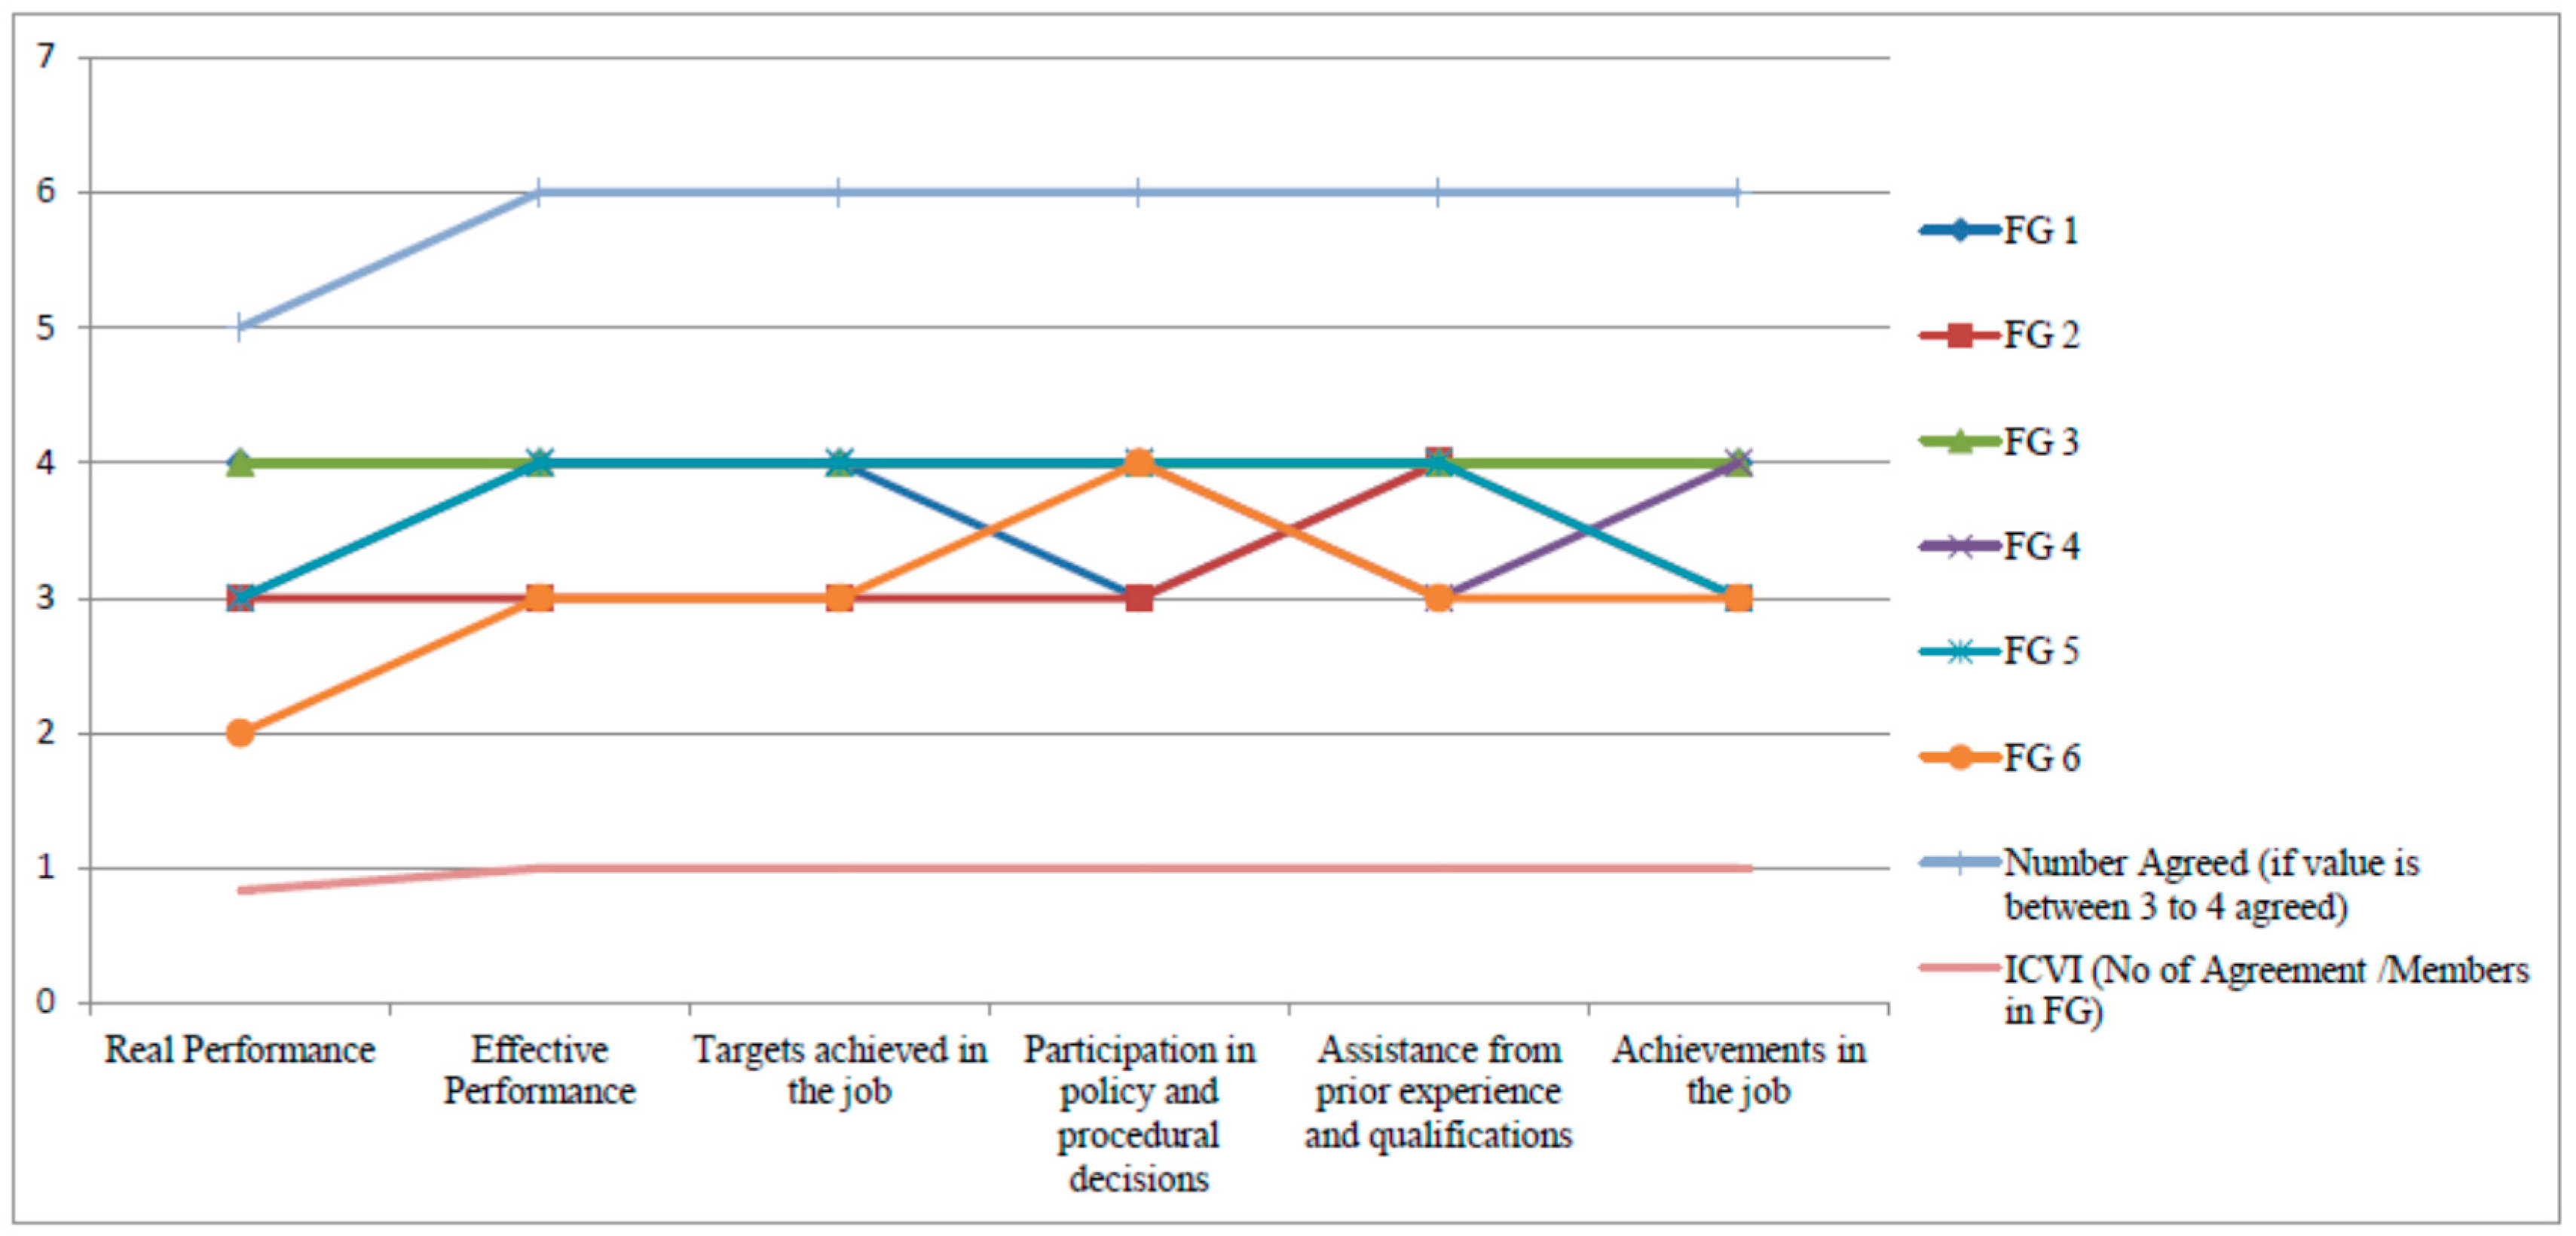
Figure 5.
Individual Item Content Validity (ICVI) calculations of humanitarian organisations’ performance (Source: Survey data).
Figure 5.
Individual Item Content Validity (ICVI) calculations of humanitarian organisations’ performance (Source: Survey data).

Figure 6.
Number of responses to questionnaire (Source: Survey data).

Figure 7.
Box plot for outliers (Source: Sample data).

Figure 8.
Linearity of each item used in the survey (Source: Survey data).

Figure 9.
Homoscedasticity of the sample (Source: Sample data complied through SPSS).

Figure 10.
Measurement model (Source: LISREL output).

Figure 11.
Structural model (Source: LISREL output).
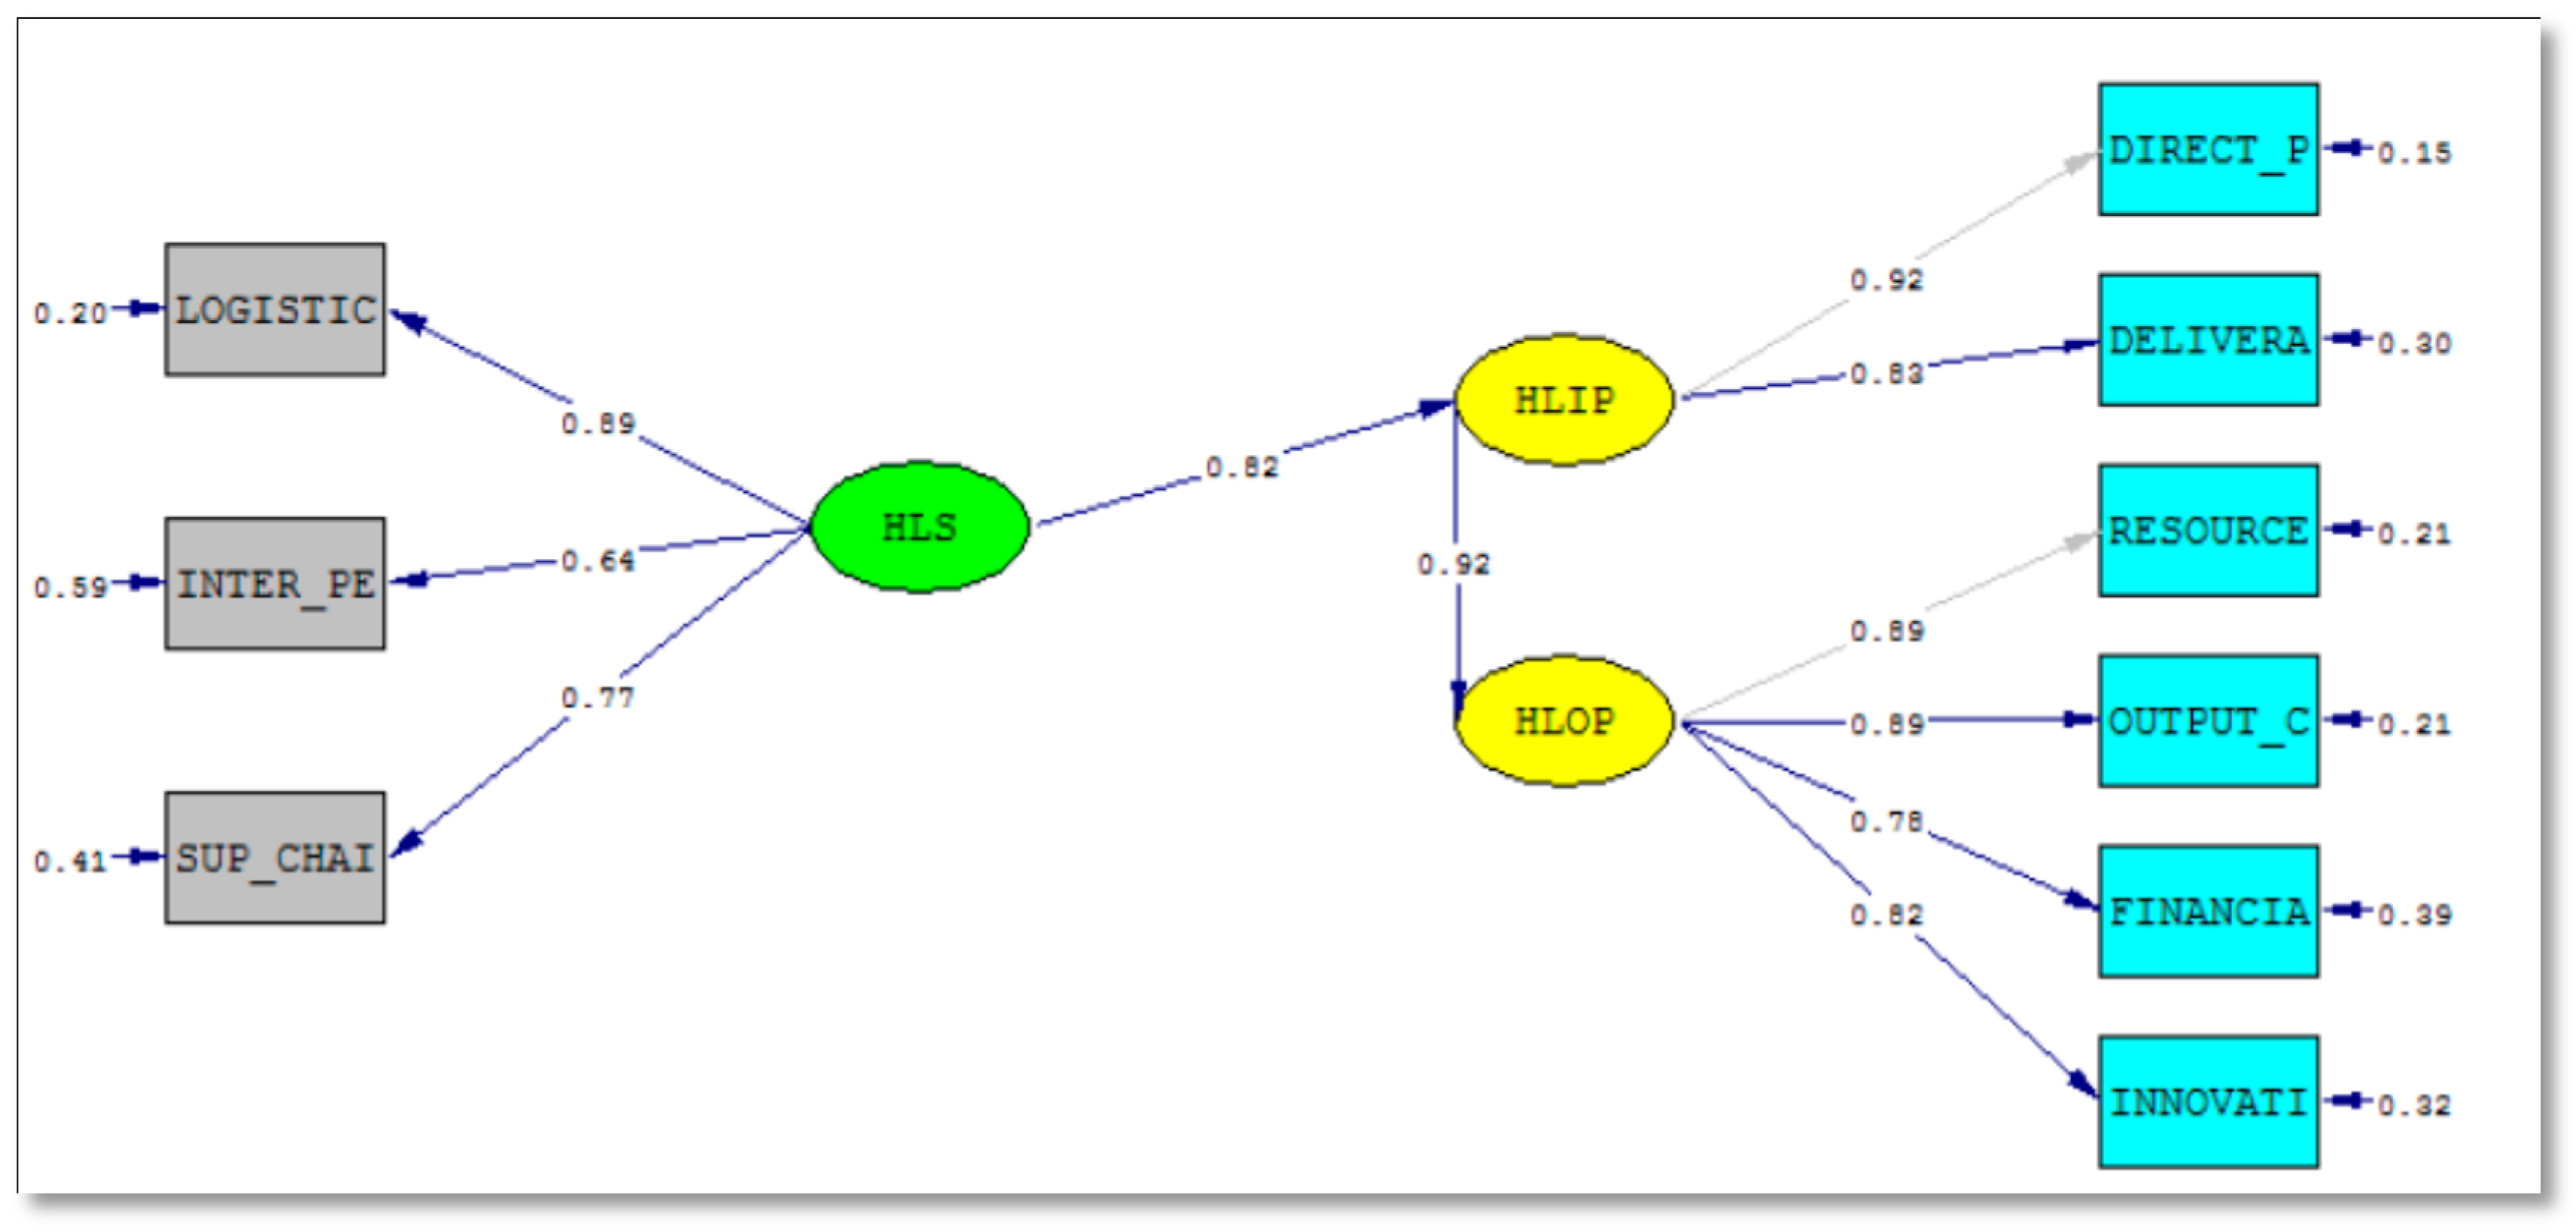
Figure 12.
Power analysis (Source: G* Power output [55]).
Figure 12.
Power analysis (Source: G* Power output [55]).

Table 1.
Performance objectives of humanitarian supply chains.
| Performance Objective | Author |
|---|---|
| Flexibility | Beamon and Balcik [13]; Lu et al. [36] |
| Cost | Blecken et al. [12]; Lu et al. [36] |
| Resource efficiency | Beamon and Balcik [13]; Blecken et al. [12] ; Lu et al. [36] |
| Output | Beamon and Balcik [13]; Blecken et al. [12] |
| Service level of customer/beneficiary/donor | Schulz and Heigh [2]; van der Laan et al. [37] ; de Leeuw [6] |
| Financial control and efficiency | Davidson [31]; Schulz and Heigh [2]; de Leeuw [6]; Lu et al. [36] |
| Coverage and equity | Davidson [31]; Lu et al. [36] |
| Innovation and learning | Schulz and Heigh [2]; de Leeuw [6] |
| Utilisation | Blecken et al. [12] |
| Quality of life and well-being of Aid recipients | Tatham and Hughes [38] |
| Process adherence | Schulz and Heigh [2]; Lu et al. [36] |
| Donation to delivery time | Davidson [31]; Blecken et al. [12]; Lu et al. [36] |
Source: Haavisto [33].
Table 2.
Questionnaire distribution (Source: Survey data).
| Questionnaire Distribution | |
|---|---|
| E-mailed | 212 |
| Hand-delivered | 80 |
| Posted/Faxed | 120 |
| Through Survey Monkey website | 88 |
| Total | 500 |
Table 3.
Multicollinearity Statistics (Source: Survey data).
| Model | Collinearity Statistics | |
|---|---|---|
| Tolerance | VIF | |
| Logistics Mgt | 0.324 | 3.091 |
| Inter Personnel | 0.440 | 2.275 |
| Sup Chain Coordination | 0.278 | 3.598 |
| Disaster Mgt | 0.696 | 1.438 |
| Direct Performance | 0.190 | 5.252 |
| Deliverables Expected | 0.227 | 4.410 |
| Resource Utilisation | 0.202 | 4.946 |
| Output Customer Service | 0.257 | 3.887 |
| Financial Control | 0.328 | 3.047 |
| Innovation Learning | 0.215 | 4.649 |
Table 4.
Variance values (Source: Survey data).
| Measured Variable | N | Variance |
|---|---|---|
| Logistics Mgt | 318 | 1.273 |
| Inter Personnel | 318 | 1.017 |
| Sup Chain Coordination | 318 | 1.914 |
| Disaster Mgt | 317 | 0.795 |
| Direct Performance | 318 | 1.707 |
| Deliverables Expected | 318 | 1.362 |
| Resource Utilisation | 318 | 1.693 |
| Output Customer Service | 318 | 1.870 |
| Financial Control | 318 | 1.518 |
| Innovation Learning | 318 | 1.504 |
Table 5.
Sample size calculation (Source: Sample Data).
| Item | Value |
|---|---|
| Effect size | 0.03 |
| Desired Statistical Power level | 0.8 |
| Number of Latent Variables | 3 |
| Number of Observed Variables | 10 |
| Probability Level | 0.05 |
| Therefore, the sample size is, | |
| Minimum sample size to detect effect | 119 |
| Minimum sample size for model structure | 156 |
| Recommended minimum sample size | 156 |
| Observed Sample size | 318 |
Table 6.
Cronbach’s alpha reliability of latent variables (Source: Survey data).
| Variable | Items | Corrected Item Total Correlation | Cronbach’s Alpha if Item Deleted | Cronbach’s Alpha |
|---|---|---|---|---|
| HL Skills | Logistics Management Skills | 0.677 | 0.570 | 0.729 |
| Interpersonal Skills | 0.617 | 0.618 | ||
| Supply Chain Coordination Skills | 0.613 | 0.616 | ||
| Disaster Management Skills | 0.223 | 0.802 | ||
| HL practitioners’ Individual Performance | Direct Performance | 0.754 | 0.614 | 0.856 |
| Deliverables | 0.758 | 0.624 | ||
| Humanitarian Organisational Performance | Resource Utilisation | 0.854 | 0.856 | 0.907 |
| Output and Customer Service | 0.835 | 0.863 | ||
| Financial Control | 0.729 | 0.900 | ||
| Innovation & Learning | 0.745 | 0.895 |
Table 7.
Convergent validity calculation.
| Valuator | HLS | HLIP | HLOP |
|---|---|---|---|
| AVE (Value > 0.5) | 0.597 | 0.749 | 0.720 |
| CR (Value > 0.7) | 0.814 | 0.857 | 0.911 |
| Convergent Validity | Established | Established | Established |
Source: LISREL and AVE, CR Calculator.
Table 8.
Discriminant validity.
| Construct | Correlation | Squared Correlation | AVE > Squared Correlation | Discriminant Validity |
|---|---|---|---|---|
| HLS-Logistics | 0.794 | 0.630 | 0.792 | Established |
| HLS-Inter Personal | 0.429 | 0.184 | 0.423 | Established |
| HLS-Supply Chain | 0.583 | 0.339 | 0.578 | Established |
| HLIP-Direct Per | 0.819 | 0.670 | 0.810 | Established |
| HLIP-Deliverables | 0.694 | 0.481 | 0.689 | Established |
| HLOP-Resource | 0.792 | 0.627 | 0.792 | Established |
| HLOP-Output | 0.784 | 0.614 | 0.792 | Established |
| HLOP-Finance | 0.622 | 0.386 | 0.624 | Established |
| HLOP-Innovation | 0.669 | 0.447 | 0.672 | Established |
(Source: LISREL and AVE, CR Calculator [54]).
Table 9.
GOF measures used for the analysis.
| Categories | Model Fit Criteria | Acceptable Level |
|---|---|---|
| Absolute measures | Chi-square | Tabled χ2 value |
| Goodness-of-fit index (GFI) | 0 (no fit) to 1 (perfect fit) | |
| Root-mean-square error of approximation (RMSEA) | Value of 0.05 to 0.08 indicate close fit | |
| Adjusted GFI (AGFI) | 0 (no fit) to 1 (perfect fit) | |
| Incremental measures | Normed fit index (NFI) | 0 (no fit) to 1 (perfect fit) |
| Non-Normed fit index (NNFI) | 0 (no fit) to 1 (perfect fit) | |
| Comparative Fit Index (CFI) | 0 (no fit) to 1 (perfect fit) | |
| Parsimony measures | Parsimony Normed fit index (PNFI) | 0 (no fit) to 1 (perfect fit) |
| Parsimony Goodness of fit index (PGFI) | 0 (no fit) to 1 (perfect fit) |
Table 10.
Parameter estimates (standardized coefficients) on Factor Analysis.
| Relationships | Threshold Values for Parameter Estimates | |||
|---|---|---|---|---|
| Standardized Values (λ) | t-Statistic | R2 | p | |
| Requirement | Greater Than (>) 0.5 | Greater Than (>) 1.96 | Greater Than (>) 0.25 | Less Than (<) 0.05 |
| HLS-Logistics | 0.890 | 19.02 | 0.794 | 0.000 |
| HLS-Inter Personal | 0.650 | 12.46 | 0.429 | 0.000 |
| HLS-Supply Chain | 0.760 | 15.29 | 0.583 | 0.000 |
| HLIP-Direct Performance | 0.900 | 20.37 | 0.819 | 0.000 |
| HLIP-Deliverables | 0.830 | 17.95 | 0.694 | 0.000 |
| HLOP-Resource | 0.890 | 19.99 | 0.792 | 0.000 |
| HLOP-Output | 0.890 | 19.83 | 0.784 | 0.000 |
| HLOP-Finance | 0.790 | 16.53 | 0.622 | 0.000 |
| HLOP-Innovation | 0.820 | 17.47 | 0.669 | 0.000 |
(Source: Compiled from LISREL output.)
Table 11.
GOF for measurement model.
| Absolute Measures | Incremental Measures | Parsimony Measures | |||||
|---|---|---|---|---|---|---|---|
| GFI | RMSEA | AGFI | NFI | NNFI | CFI | PNFI | PGFI |
| 0.827 | 0.052 | 0.676 | 0.852 | 0.790 | 0.860 | 0.568 | 0.441 |
(Source: Compiled based on LISEREL Output.)
Table 12.
Parameter estimates (standardized coefficients) on Factor Analysis.
| Relationship | Threshold Values for Parameter Estimates | |||
|---|---|---|---|---|
| Standardized Values (λ) | t-Statistic | R2 | p | |
| Greater than (>) 0.5 | Greater than (>) 1.96 | Greater than (>) 0.25. | Less than (<) 0.05 | |
| HLS-HLIP | 0.82 | 15.31 | 0.676 | 0.000 |
| HLIP-HLOP | 0.92 | 20.05 | 0.841 | 0.000 |
(Source: Compiled from LISREL output).
Table 13.
Parameter estimates for statistical significance (Source: LISREL output).
| Relationships | Parameter Estimate | Standard Error | Parameter Estimate/Standard Error | Z Value | p Value | Statistical Significance |
|---|---|---|---|---|---|---|
| HLS-HLIP | 0.822 | 0.0537 | 15.30726 | 15.308 | 0.000 | Established |
| HLIP-HLOP | 0.917 | 0.0457 | 20.05364 | 20.053 | 0.000 | Established |
Table 14.
GOF measures for the structural model (Source: LISREL output).
| Absolute Measures | Incremental Measures | Parsimony Measures | |||||
|---|---|---|---|---|---|---|---|
| GFI | RMSEA | AGFI | NFI | NNFI | CFI | PNFI | PGFI |
| 0.817 | 0.052 | 0.671 | 0.847 | 0.791 | 0.855 | 0.588 | 0.454 |
© 2017 by the authors. Licensee MDPI, Basel, Switzerland. This article is an open access article distributed under the terms and conditions of the Creative Commons Attribution (CC BY) license (http://creativecommons.org/licenses/by/4.0/).
Share and Cite
MDPI and ACS Style
Rajakaruna, S.; Wijeratne, A.W.; Mann, T.; Yan, C. Effect of Individual Skills and Performance on Humanitarian Organisations: A Structural Equation Model. Logistics 2017, 1, 7. https://doi.org/10.3390/logistics1010007
AMA Style
Rajakaruna S, Wijeratne AW, Mann T, Yan C. Effect of Individual Skills and Performance on Humanitarian Organisations: A Structural Equation Model. Logistics. 2017; 1(1):7. https://doi.org/10.3390/logistics1010007
Chicago/Turabian StyleRajakaruna, Shanaka, Alge Wattage Wijeratne, Tim Mann, and Chen Yan. 2017. "Effect of Individual Skills and Performance on Humanitarian Organisations: A Structural Equation Model" Logistics 1, no. 1: 7. https://doi.org/10.3390/logistics1010007