Impacts of Additive Manufacturing on Supply Chain Flow: A Simulation Approach in Healthcare Industry

1
Department of Industrial Engineering, Gaziantep University, Gaziantep 27300, Turkey
2
Department of International Trade and Logistics, Erciyes University, Kayseri 38039, Turkey
3
Dijitalis Software and Consultancy, İstanbul 34742, Turkey
*
Author to whom correspondence should be addressed.
Logistics 2018, 2(1), 1; https://doi.org/10.3390/logistics2010001
Submission received: 30 October 2017
/
Revised: 21 December 2017
/
Accepted: 27 December 2017
/
Published: 29 December 2017
Abstract
:Additive manufacturing (AM) can lead to innovative solutions in traditional supply chain networks (TSCN), which contains very complicated and -hard to manage- chains. With 3D printing technology, a design file can transform directly to a product, skipping many traditional manufacturing steps. Thus, this new application can affect all logistics and supply chain activities positively. The research problem of this paper is to search and assess supply chain changes associated with 3D printing technology adoption to identify the potential impact of AM. To do so, two different supply chain networks, which are TSCN and 3D printing supply chain network (3DPSCN) for healthcare industry are considered. A simulation model is developed to evaluate the potential impact of 3D printing improvements on the configuration of orthopedic insole supply chains. The main contribution of this paper is proposing a simulation model for a healthcare company to compare its 3DPSCN structure with its TSCN version. The results show the concrete benefits such as lead-time and number of customers that can be achieved by 3DPSCN compared to TSCN.
1. Introduction
3D printing, which is also known as additive manufacturing (AM), turns digital 3D models into objects by building them up in layers. This technology enables small quantities of customized goods to be produced at relatively low costs. 3D printers are used in many sectors such as automotive replacement parts, dental crowns, artificial limbs, aviation industry, clothing and even in foodstuff [1,2]. The method is seen as a disruptive technology for supply chain management because of its characteristics. Holmström et al. [3] highlight the following benefits of AM methods over the conventional manufacturing methods as:
- No need for tooling
- Feasibility of producing small production batches economically
- Possibility for quickly change design
- Product optimization for function
- More economical custom product manufacturing plus the capability to produce complex geometries
- Potential for simpler supply chains with shorter lead times and lower inventories
In addition to above benefits, there is the possibility of reducing material waste by as much as 90% according to a report by Markillie [4] on AM. Traditionally, raw materials or components are supplied from suppliers, assembled in manufacturers and shipped to customers through retailers or distribution centers. On the contrary, 3D printing technology enables organizations to bypass the traditional supply chain and manufacture a product themselves with a digital design (Figure 1).
Nowadays, many firms integrate the 3D printing technology to their supply chains. According to Wohlers Associates -the leading industrial analyst firm of additive manufacturing- direct part production alone represents almost 15% of manufactured parts. According to their analysis the sale of additive manufactured products and services will exceed $3 billion worldwide by 2016, and the industry is expected to surpass the $5 billion mark by 2020. AM is a growing means to produce both prototypes and products. For example Bugatti Veyron automobile dashboards are customized and printed by using AM. By doing so, Bugatti enables the purchaser to customize their low-volume production car while simultaneously reducing assembly time. BMW also offers several 3D printed components in their high-end models [5]. Amazon has filed for patents on a system that would use truck-based 3D printers to quickly deliver customers’ bespoke orders. With the system, they can guarantee to have a product without having to stock in the inventory for especially small equipment [2]. A comparative illustration of traditional and patented 3D printing truck delivery of Amazon is shown in Figure 2. As it can be seen from Figure 2, a customer place an order on Amazon, one of several roving delivery trucks receives said order, fires up the 3D printing machine in the truck, and then proceeds to drop off ordered products (e.g., a toy) inside of a given time window. Amazon explains that the system would help speed up the delivery process even further and help reduce the warehouse space the company needs to hold. As can be seen, very well-known firms are integrating their supply chains with 3D printing technology and it seems to keep on increasing.
In addition, some research papers investigated the effects of 3D printing on supply chains such as; Liu et al. [6] which explores the effects of additive manufacturing technology on the aircraft spare parts supply chain; Khajavi et al. [7] which explores the additive manufacturing in spare parts supply chain lastly Janssen et al. [8] which examines the supply chain of 3D printed orthopedic insoles. Researches presented that AM can be adopted to achieve agile supply chain [9] as well as reduce the cost by up to 75 percent [10] for manufacturing companies. AM allows the direct production of parts without molding, making it especially capable for personalization, which is a market with better profit [11]. Detailed information about these papers is given in literature section.
The 3D supply chains are accepted as less complex and speedy by heart when compared to traditional supply chains. However, generally this theory is not supported with any reasonable comparisons or scientific methods. Thus, in this study, we take 3D and traditional supply chains into account for healthcare industry. We first describe each supply chain for orthopedic insole differently and then we compare them. Therefore, one can evaluate the potential impacts of 3D supply chain improvements on a specific supply chain such as lead-time decrement.
The paper is organized as follows; Section 2 examines the literature for similar studies. Section 3 defines the TSCN and 3DPSCN and handles the differences between them. Section 4 contains two different simulation models while Section 5 examines comparative results. Finally, Section 6 summarizes the study and gives directions for future research.
2. Literature Review
This section first presents a brief review on the most relevant and recent literature on AM and 3D printing supply chain studies, followed by the simulation-based studies. Finally, contributions are summarized.
2.1. Review on Supply Chain Studies with Additive Manufacturing
In today’s competitive market, satisfying the dynamic demands of customers on time has a vital importance without budging form quality and profitability. Today, AM has the potential to become the basis for new solutions in supply chain management [12]. There are several opportunities can be taken with using AM instead of conventional manufacturing such as reduction in lead times, inventories, set up times, safety stocks, number of assemblies, wastes; increment in product qualities and ability of producing complex shaped products. AM can decrease the number of stages in the traditional supply chain because of needing fewer components and it is able to manufacture products near the customers [6]. A review of articles indicates that the formal scientific birth of AM was marked by the formation of agile forum at Iacocca Institute in the year 1991 [9,13,14,15]. Recently, Gardan [16] presented the different AM Technologies and the new trends to get a global overview through the engineering and manufacturing process. Wu et al. [17] and Perkins and Skitmore [18] reviewed the usage of AM technology in the construction industry. Oettmeier and Hoffmann [19] presented potential both supply- and demand-side benefits of AM technology usage. Wagner and Walton [20] aimed to shed light on the current and future states of AM in the aviation industry. To do so, 50 aviation professionals from aircraft original equipment manufacturers, suppliers, maintenance repair overhaul providers, and AM service providers and AM production firms are focused. Niaki and Nonino [21,22] reviewed the literature about AM in eight different categories: technology selection, supply chain, product design and production cost models, environmental aspects, strategic challenges, manufacturing systems, open-source innovation and business models and economics and researched the effectiveness of AM in different environments and industries, business strategies, business models and processes.
Besides the above studies considering AM, there are some studies investigating the effect of AM technology to the supply chain managements. Walter et al. [12] presented supply chain solutions made possible by both the centralized and decentralized applications of AM. They presented an example on aircraft spare parts supply chain. The other studies considering aircraft spare part industry is made by Hasan and Rennie [23] in which authors highlighted the lack of a fully functional AM supply chain as a major obstacle towards increasing the usage of AM technologies and Holmström et al. [3] in which authors tried to highlight the potential impacts of AM methods on spare parts supply chain design. Tuck and Hague [24] and Tuck et al. [25] attempted to outline some of the effects on supply chain methodologies and principles that may occur with the advent of AM and their subsequent impact on the production of mass or fully customized products. Tuck et al. [26] investigated the effect of AM on agile and lean supply chains and mass customization. They presented three examples of automotive and medical industries. Liu et al. [6] investigated the impact of AM in the aircraft spare parts industry, with an emphasis on the use of distributed manufacturing strategy to reduce inventory cost. They defined three SCN configurations for aircraft spare parts and used SCOR model to evaluate the performance of the configurations. Huang et al. [27] reviewed the societal impact of AM from a technical perspective and compared the conventional manufacturing supply chain and AM supply chain in the section entitled as “impact on manufacturing supply chain”. Janssen et al. [8] highlighted the benefits of using AM technologies to the supply chains in terms of SCOR Model main processes namely, make, source, deliver, return, enable, and plan. They proposed a case study dealing additive manufactured orthopedic insoles. Oettmeier and Hofmann [28] presented the effects of AM technology adoption on supply chain management processes and components. They presented two conceptual supply chains for hearing aid sector before and after AM technology usage.
Even though recent studies have identified AM technologies and several potential benefits of AM on supply chains, most of them only identified the contribution of using AM technology on different supply chain methodologies such as agile, lean and legality. There is still a gap in the literature about analyzing the effect of using AM on supply chains systematically in the field of operations management. Furthermore, there seems to be a general lack of case studies considering the 3DPSCN design and optimization. We didn’t encounter a study trying to optimize the 3DPSCN for a generic or special product type except done by Chiu and Lin [10]. In the study of Chiu and Lin [10] authors focused on eliminating the challenges of a lamp manufacturer implementing AM technology. They proposed a simulation-based methodology to solve the design for AM and design for supply chain problems. They also implemented an application programming interface to help customers to facilitate the design their personalized products.
2.2. Review on Supply Chain Studies with Simulation Approach
Simulation is undoubtedly one of the most powerful techniques to apply, as a decision support system, within a supply chain environment [29]. Persson and Olhager [30] presented a supply chain simulation study for a mobile communication industry to evaluate alternative supply chain designs with respect to quality, lead-times and costs and to increase the understanding of the interrelationships among parameters, relevant for the design and operations of a supply chain. Truong and Azadivar [31] developed a hybrid optimization approach to address the SCND problem. They proposed an approach combining simulation, mixed integer programming and genetic algorithm. Reiner and Trca [32] suggested a model that helps enhance the performance of a specific supply chain for food industry. They used simulation to measure and analyze the performance effects of the proposed supply chain configurations. The other study evaluating alternative designs of the supply chain for food industry using simulation is made by van der Vorst [33]. Ding et al. [34] proposed a toolbox to support decision makers for the assessment, design and improvement of SCNs. They presented two case studies from automotive and textile industries and analyzed computational results. Kleijnen [35] searched major tools and techniques for the simulation of supply chains and discussed several methodological issues, including a novel methodology for the robust design of supply chains. Almeder et al. [36] presented a general framework to support the operational decisions for SCNs using a combination of an optimization model and discrete-event simulation. Kawa [37] applied a simulation approach to a dynamic supply chain configuration based on software agents and graph theory. Their main contribution is the simulation of the dynamic configuration of supply chain model in the NetLogo platform as well as the presentation of dependencies and conclusions. Later, Kawa and Golinska [38] investigated the recovery network in computer industry. They proposed a simulation model to solve reverse network of used computers based on graph theory and agent technology that helps to solve this problem by dynamic configuration of supply chains. Jayant et al. [39] presented a reverse logistics network for used inverter batteries collection in north India. They firstly designed a reverse logistics network to establish transfer stations, drop-off points and a disassembly plant. Secondly, they developed a simulation model using the Arena 11.0 simulation package. Salem and Haouari [40] investigated a three-echelon stochastic SCN design problem in which both the supply and the demand are uncertain. They solved the problem using a simulation-optimization approach. Other studies considering simulation in supply chain management can be found in a literature review by Terzi and Cavalieri [29].
Reviewed simulation-based papers above show that simulation is one of the required tools to investigate the behavior of supply chain system rather than to investigate optimal decisions. To do so, simulation-based solution approach is used in this study.
2.3. Contributions of the Study
According to the reviewed literature, it can be concluded that the impact of AM or 3D printing on the manufacturing industry is sufficient. Although AM has numerous advantages mentioned in the previous sections, there are several gaps also indicated by Chiu and Lin [9] need to be solved: (i) lack of personalized product consideration which is the main goal of AM; (ii) lack of designing of supply chains with 3D printing technology and (iii) lack of a comparative analysis between TSCN and 3DPSCN. Therefore, the aims of this paper are to design a new SCN with embedding 3D printing technology; to apply the new system to orthopedic insoles manufacturer and to compare and contrast the proposed system and current traditional system with simulation. The contributions of this paper to the literature are twofold: (i) we design a new SCN considering 3D printing technology for an orthopedic insole manufacturer to reflect the potential benefits on TSCN and (ii) proposing a simulation model and using a real data, we present results of comparative analysis that shed light on the interactions of various performance indicators, primarily measured by lead time, but also the number of customers served.
3. Supply Chain Networks of Orthopedic Insoles
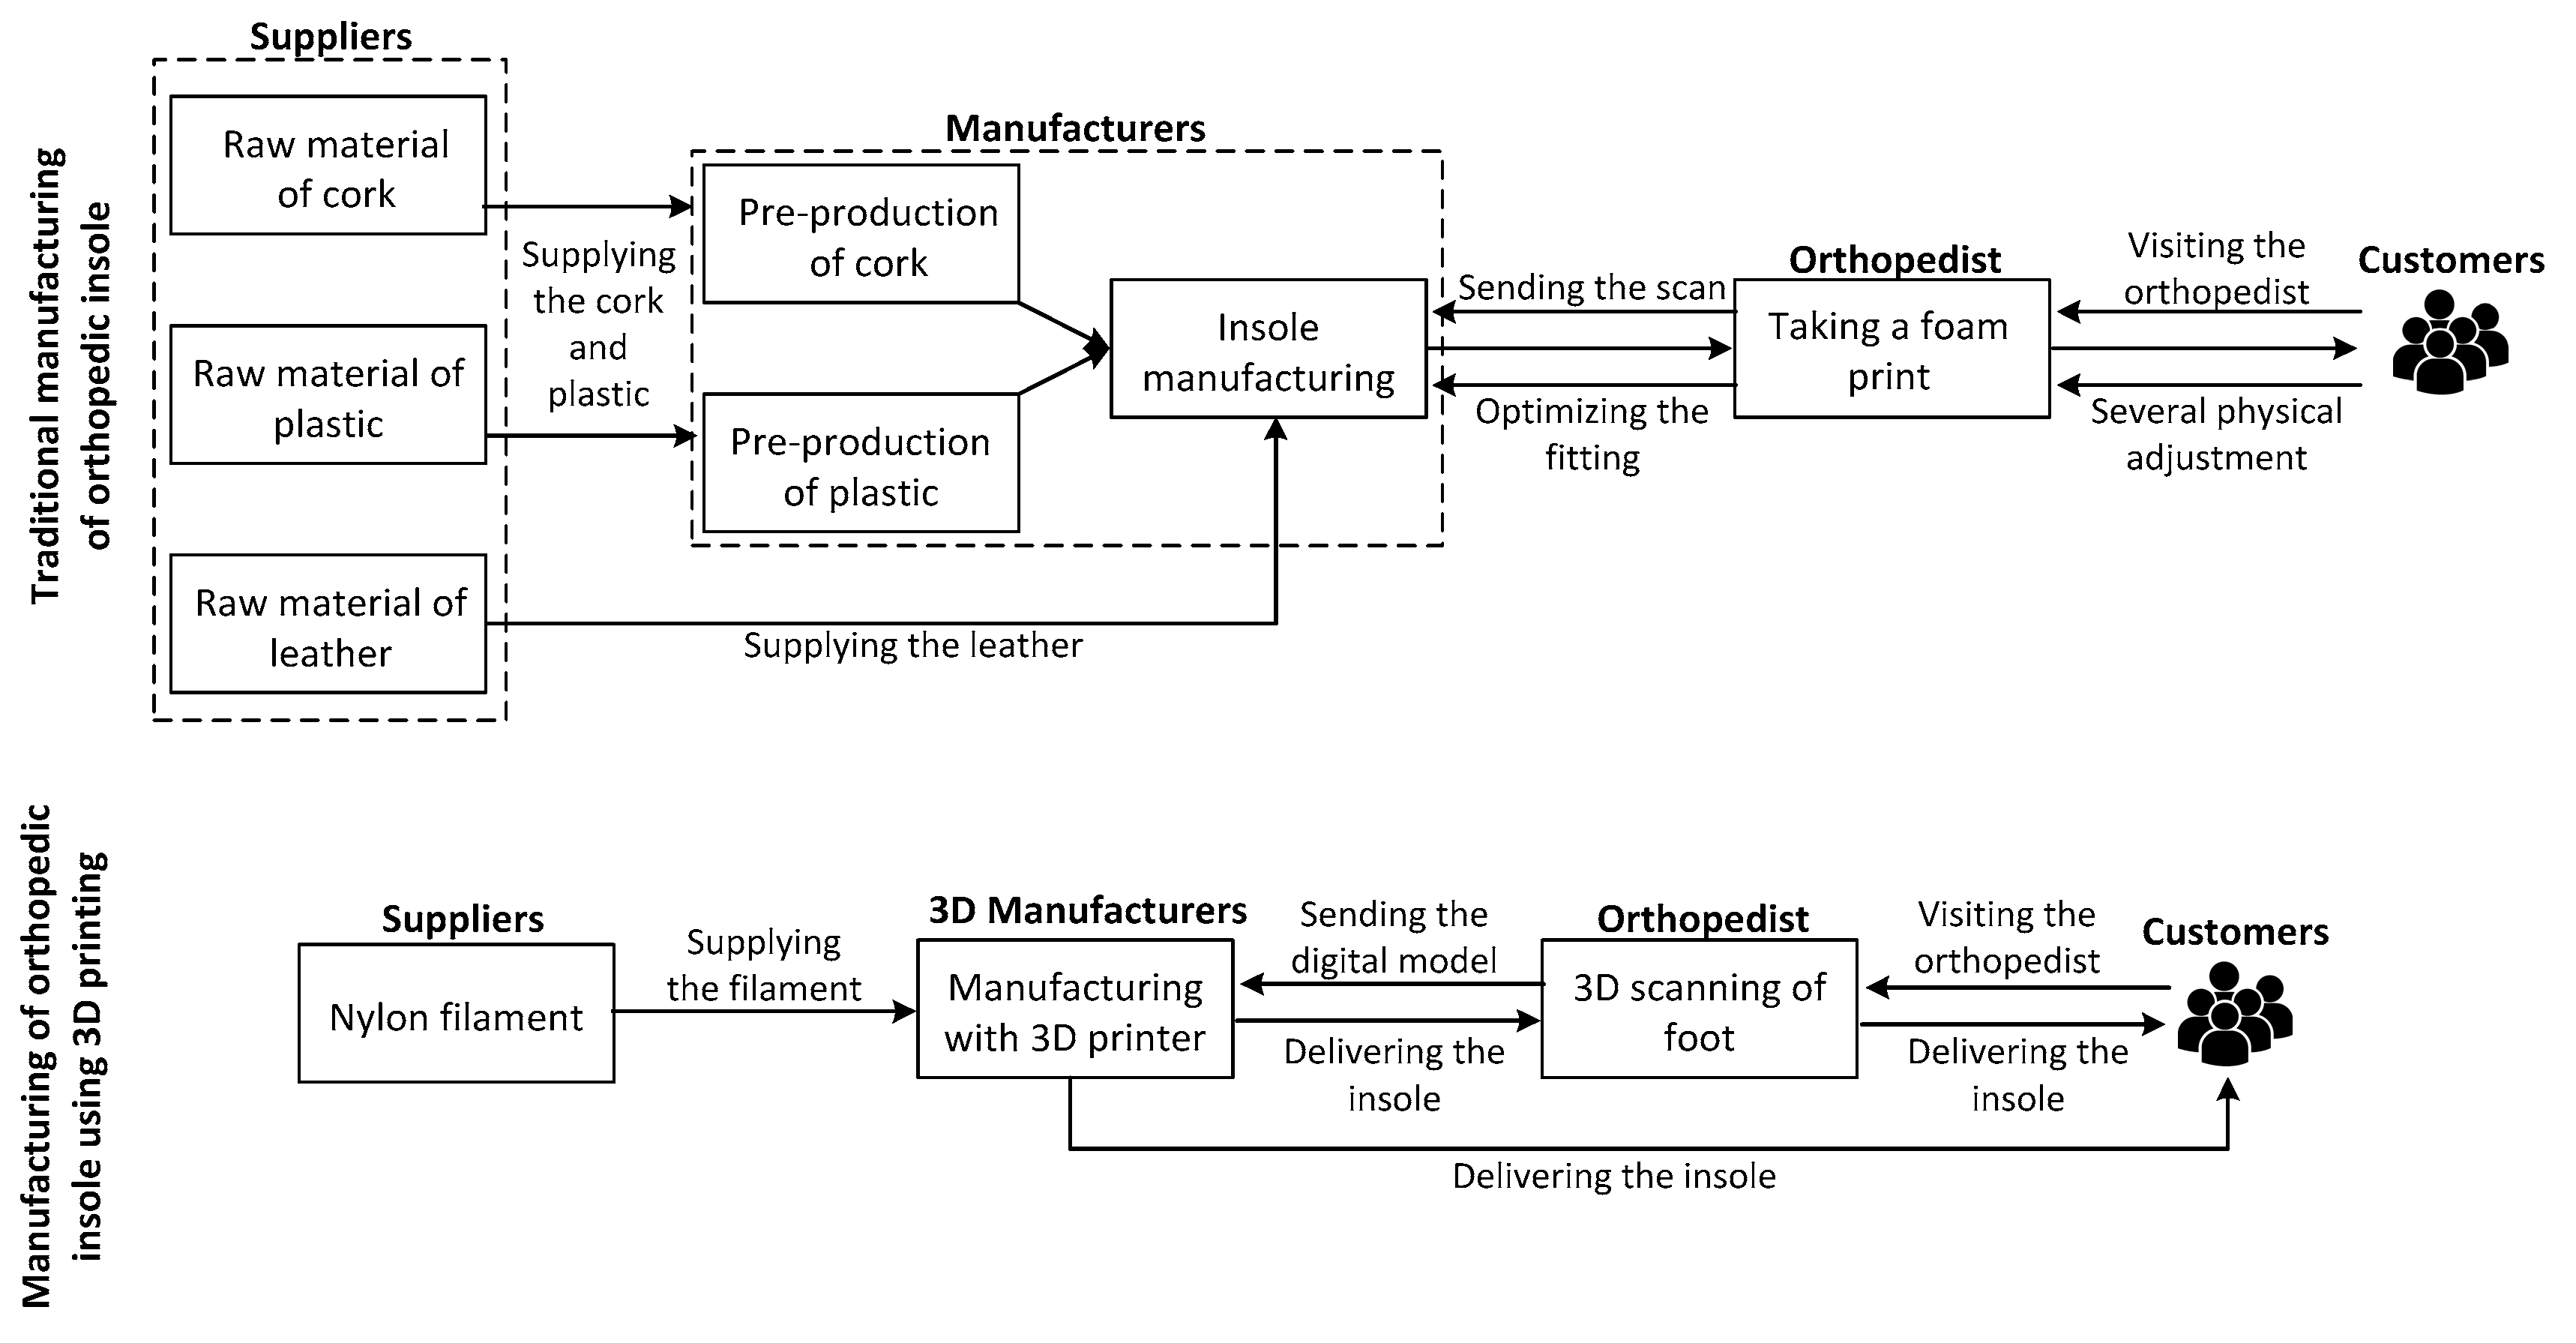
In this section, considered traditional and 3D printing SCNs belonging to orthopedic insoles are explained. Orthopedic insoles are typical products that can be produced using both traditional and 3D printing technologies. Two cases are explained below [8].
In the traditional way, the insole manufacturer holds inventories of cork, plastic and leather, which are the main components for the insole. Cork and plastics are used for the basis of the insole, while a leather top-layer is often assembled at the end of the production process. The cork and plastics cannot be used right away, but need pre-production before they can serve as input materials for the final assembly of the insole. Traditionally, purchase of an orthopedic insole requires frequent contact between the client and an orthopedist, and resultantly the insole manufacturer. This situation is represented by reciprocal arrows in Figure 3.
The orthopedist takes a foam print or plaster cast from the client’s foot and determines which physical adjustment the client needs. Then he sends the scan, along with his notes, to the insole manufacturer. The insole manufacturer receives the customer’s foam scan from the orthopedist, interprets the orthopedist’s notes and it fabricates the sole using CNC manufacturing technology. After the sole is finished, it is send to the orthopedist that will perform the final fitting with the customer. Most client’s, however, are not satisfied with the product the first time around and usually adjustments to the insole are needed. The insole is send back from manufacturer to orthopedist to optimize the fitting, and the customer has to visit the orthopedist every time for fitting.
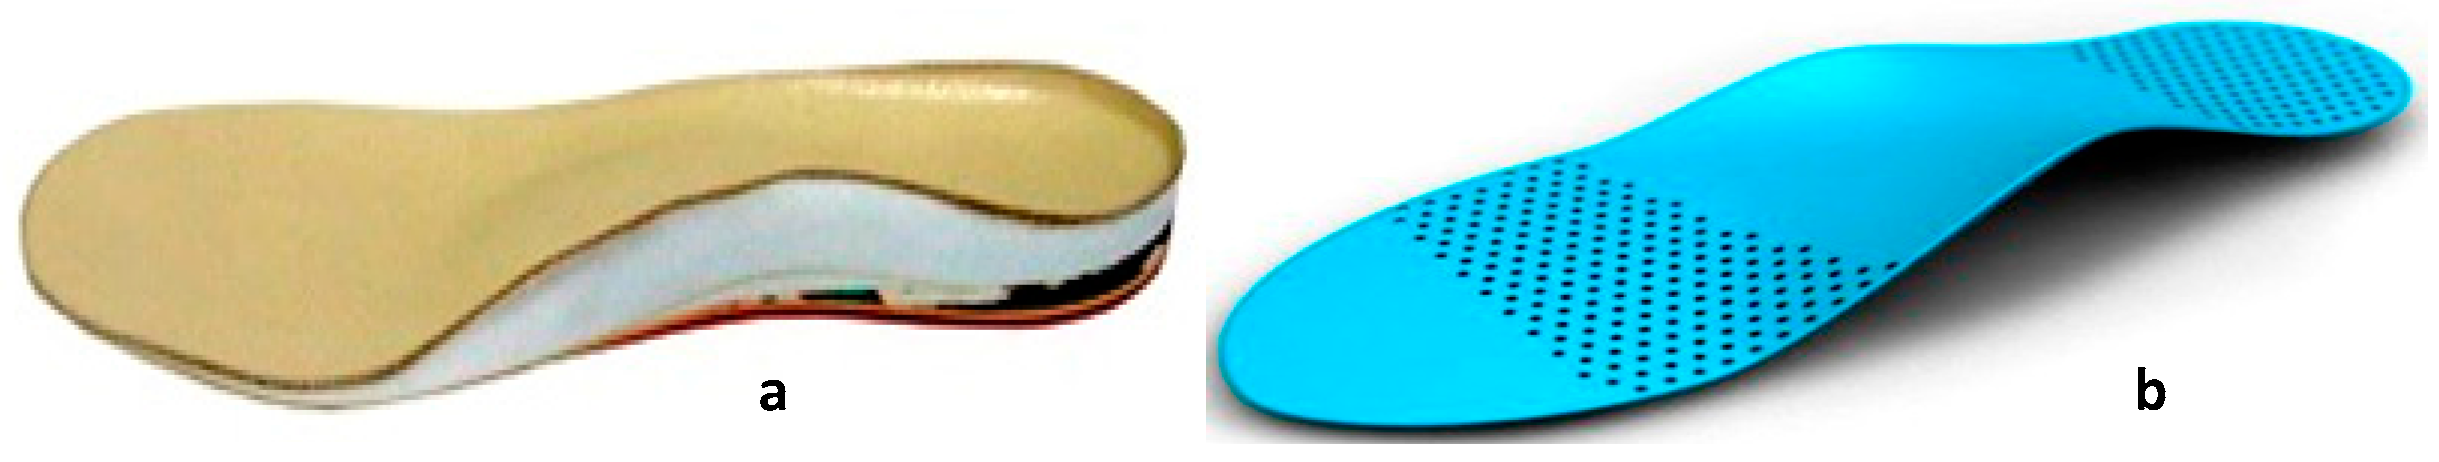
In addition to aforementioned way, orthopedic insoles can also be manufactured using 3D printing technology. The orthopedist take a direct 3D scan from the client’s foot, digitally add the required adjustments and send the digital model to the 3D printing manufacturer. The manufacturer produces the insole straight from the design. The strict integration between 3D scan and 3D printing ensures that a single moment of contact between client and orthopedist should be enough for a correct fitting. The client can even decide to collect the insole at the production location, or to have the final product sent to his home address, omitting the fitting process at the orthopedist at all (Figure 3). For starters, the number of materials used in the insole is reduced. Instead of cork, plastic and leather a filament is used. Orthopedic insoles manufactured by traditional method and 3D printing technology are shown in Figure 4.
Application of 3D printing technology to manufacture orthopedic insoles leads to several alterations. Observed basic differences between two aforementioned supply chains are summarized below [8]:
- Due to higher ‘first time right’ production with 3D printing, total lead-time decreases.
- There is less room for human induced error in the supply chain with 3D printing.
- Supply chain with 3D printing ensures that a single moment of contact between customer and orthopedist should be enough for a correct fitting.
- Lower skilled employees can operate 3D printers rather than traditional machines.
- If orthopedists have a standard 3D scan of the client’s foot, they can outsource the production anywhere they want.
- Direct shipping becomes an option in the supply chain with 3D printing.
- With 3D printing, manufacturers can reduce their dependency on different suppliers.
- Due to producing a unibody insole with 3D printing, they can become thinner but stronger.
- Customization (e.g., color, carved) can move beyond the level of customization offered by traditional methods.
4. Simulation Models for the Case Study
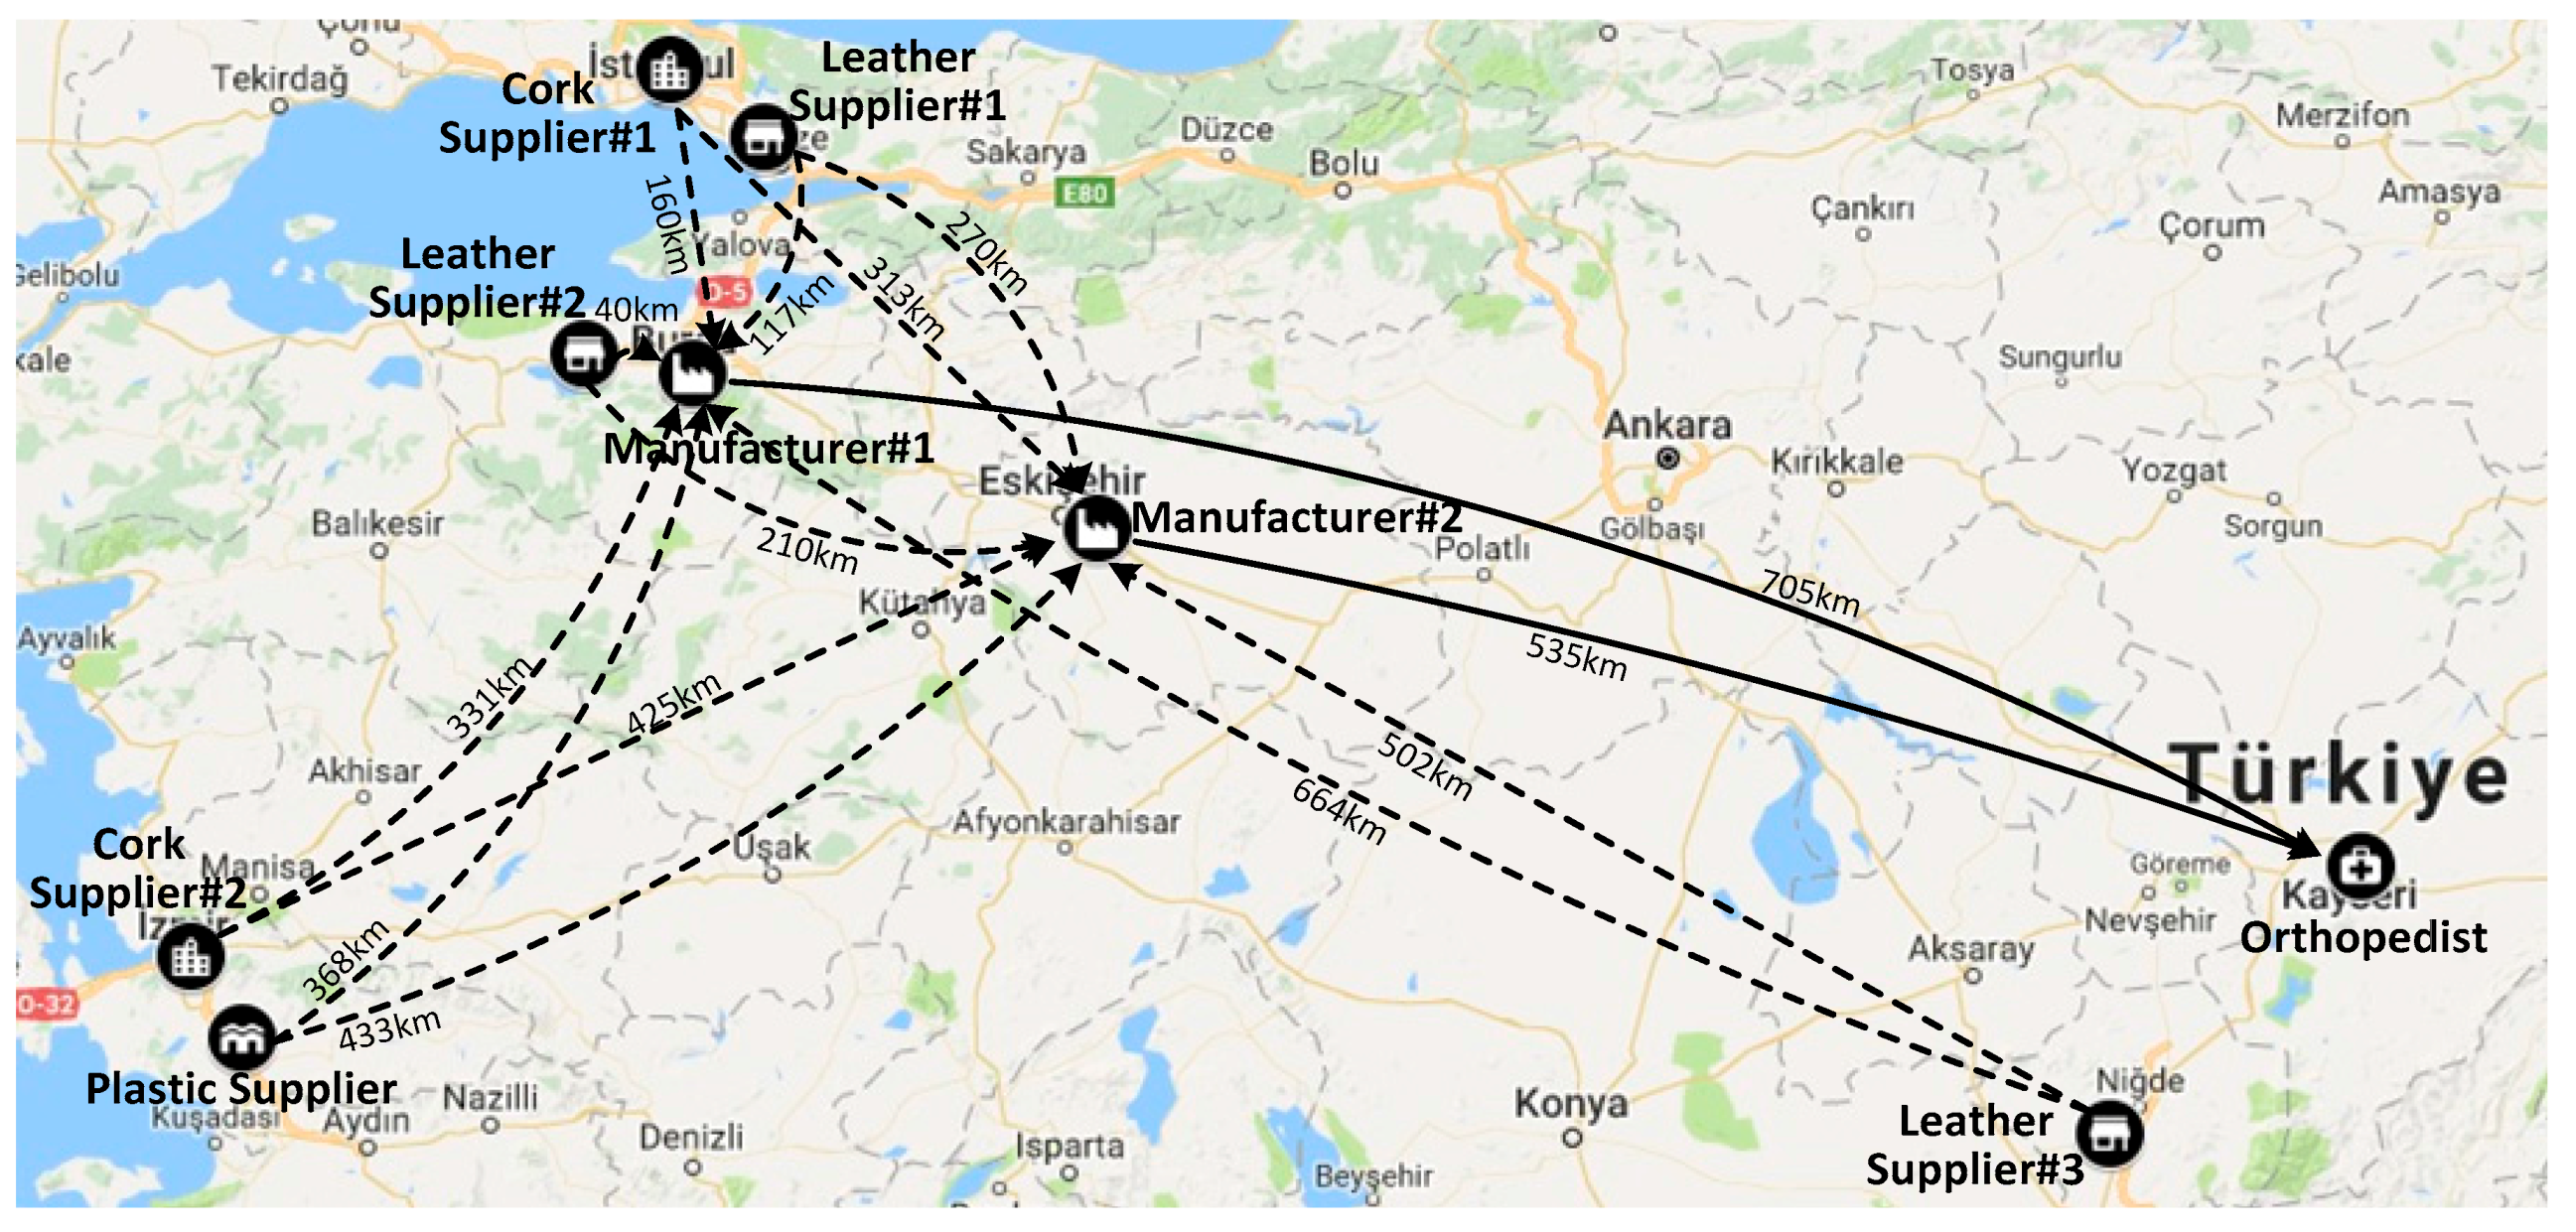
The case organization is an orthopedist located in Kayseri, Turkey. The business coverage of the orthopedist is to measure the foot of customer and have required insole manufactured and sell them. Orthopedist uses a traditional way to manage the process. In the traditional way, there are two cork suppliers, one plastic supplier and three leather suppliers in different cities of Turkey. Two manufacturers with CNC machines, which are located in Eskişehir and Bursa, collect the required raw materials and produced according to directions of orthopedist. First and second manufacturers have two and one CNC machines, respectively. Locations of facilities and product flow in traditional network are illustrated in Figure 5. Figure 5 also indicates the distances (in km) between facilities.
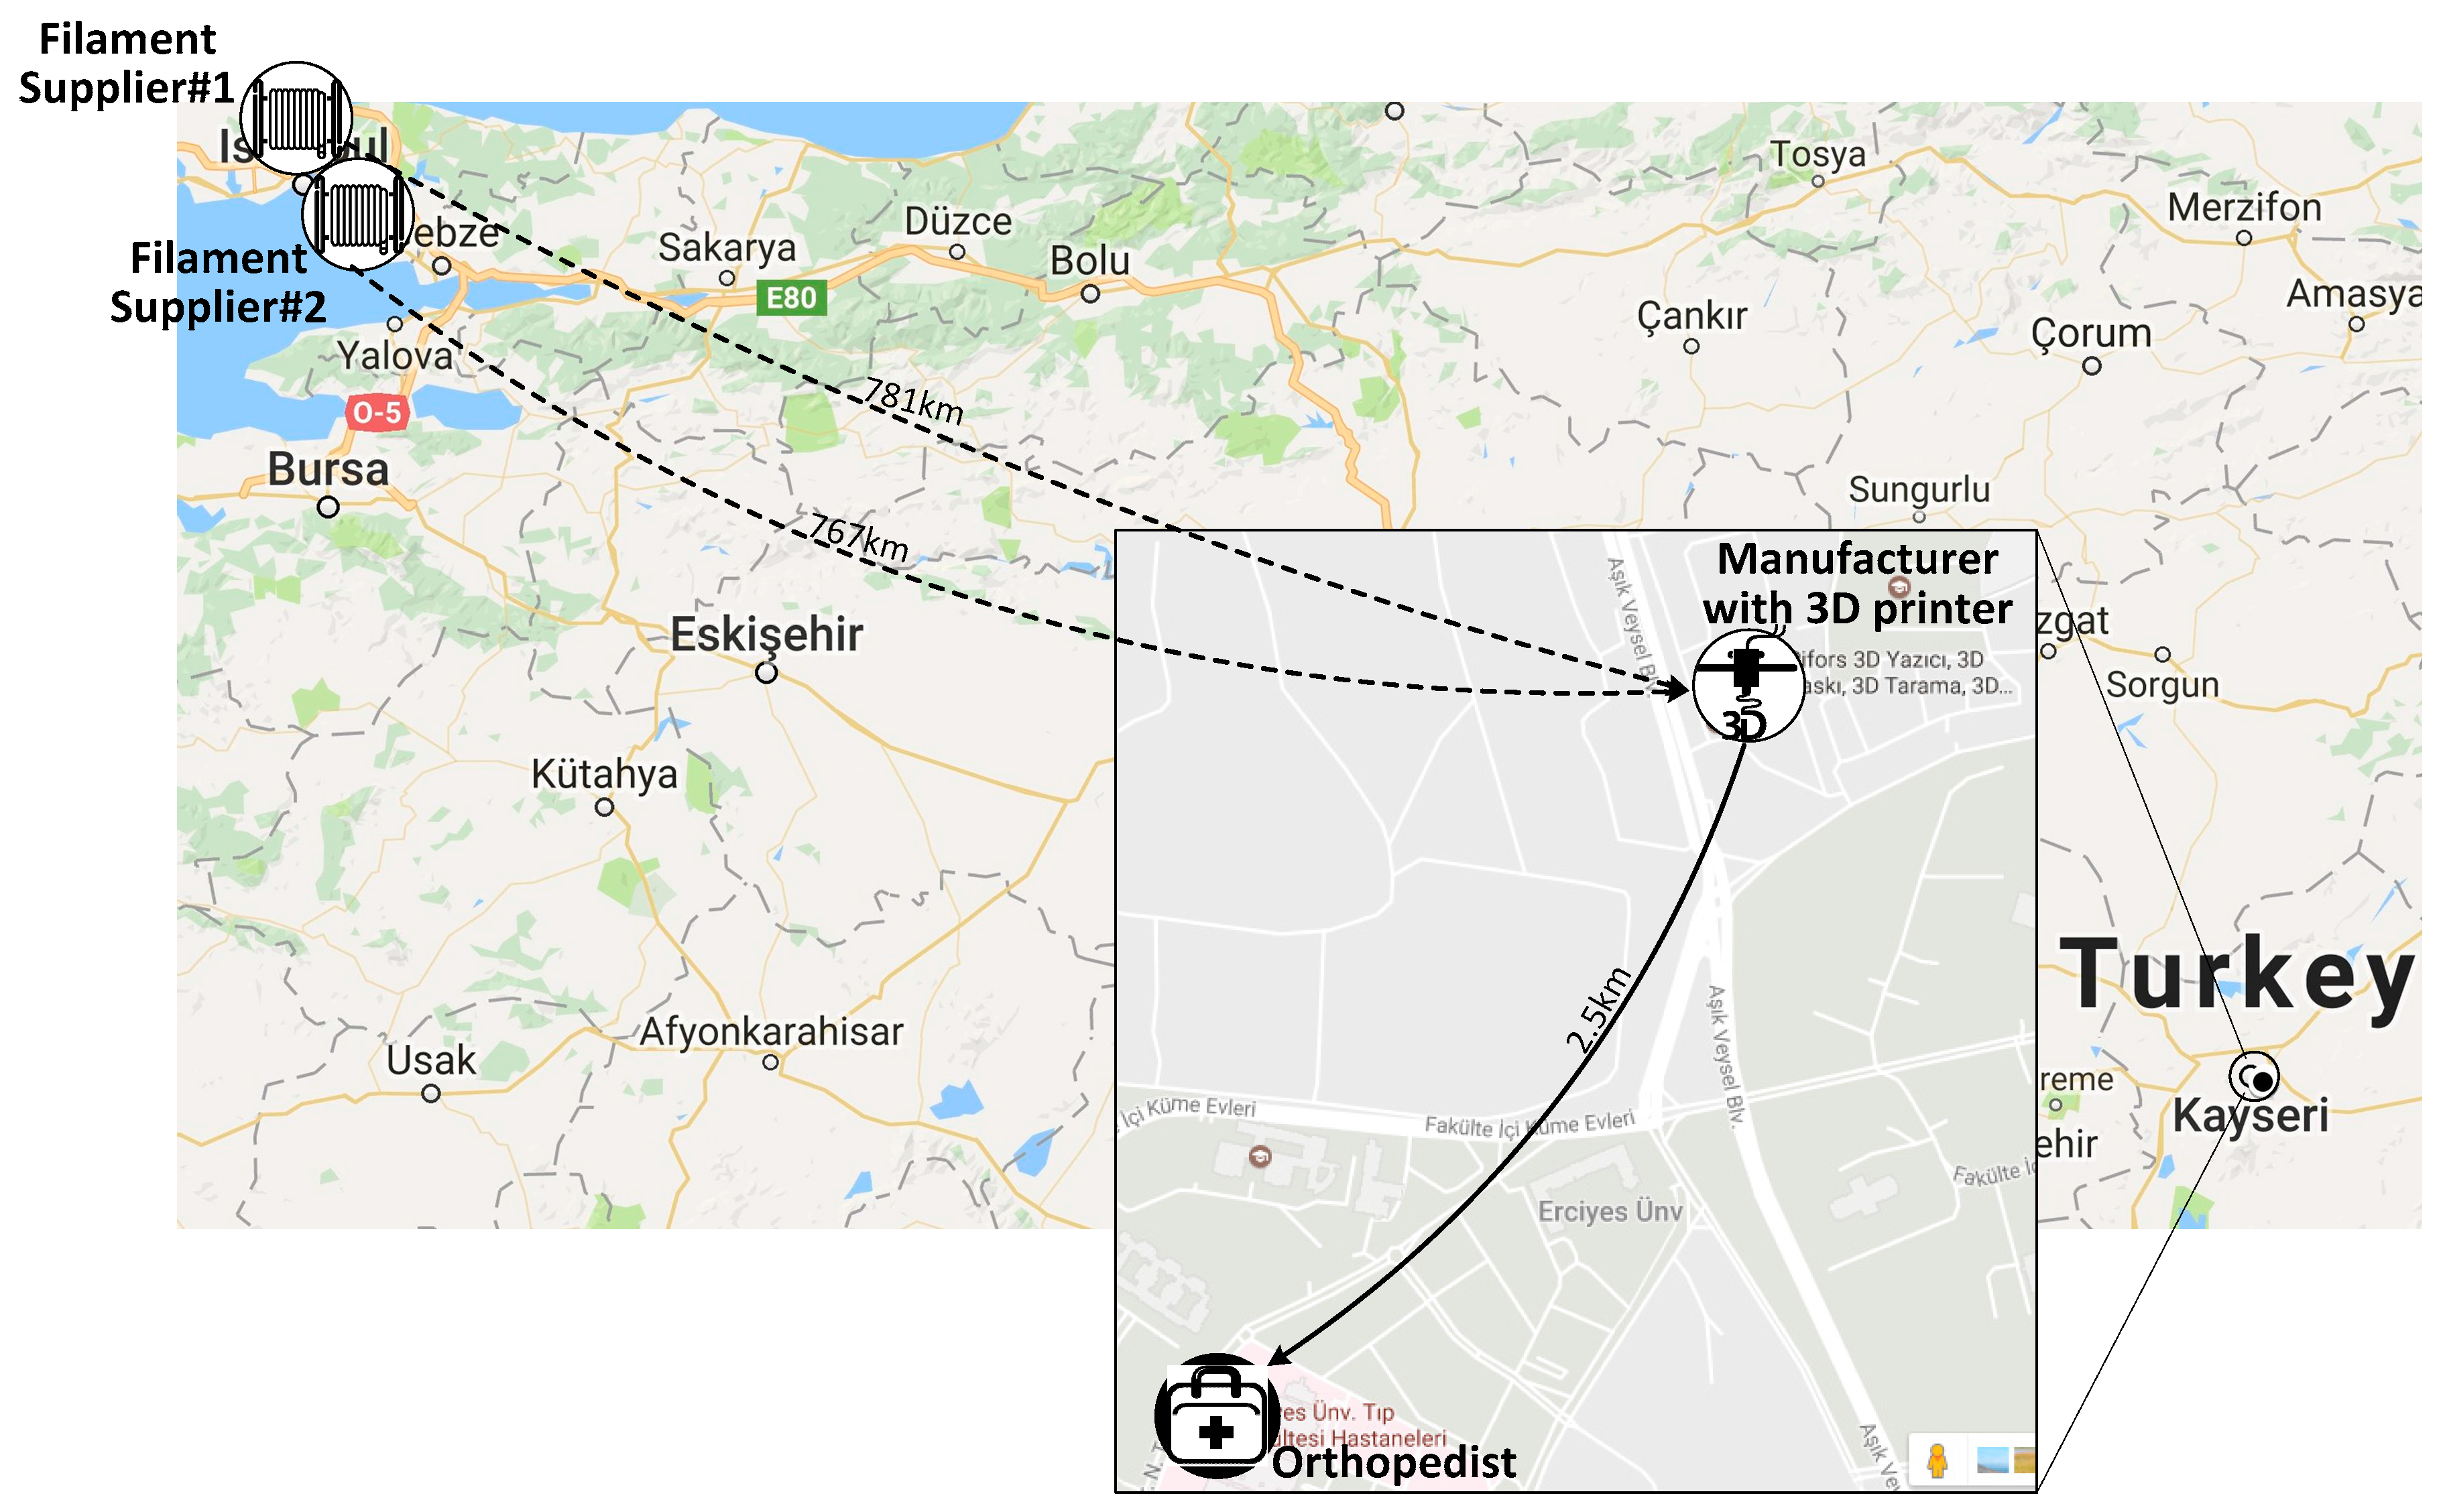
There are two different filament suppliers instead of cork, plastic and leather suppliers in the situation when 3D printing is used. There is also one manufacturer with two 3D printers instead of two manufacturers of traditional network. Orthopedist in TSCN and 3DPSCN is the same. Locations of facilities and product flow in 3DPSCN are illustrated in Figure 6. Distances (in km) between facilities are also shown in Figure 6.
The case company has been concerning to procure 3D printing machines to manufacture the personalized orthopedic insoles or not since the traditional manufacturing process is too time-consuming and cost-consuming. Therefore, to investigate the benefits that can be brought by 3D printing, the research team discussed with the case company to plan a new manufacturing process. The throughput and time performance of new manufacturing process should be confirmed before it is applied. It is noted that both two SCN models are simulated by Arena 14.0 simulation package program (Rockwell Automation, Milwaukee, WI, USA) within the same computer.
Since an orthopedic insole is composed of various different materials and the mechanical limitations exist, this research has following assumptions:
- The yield rate is different for the CNC machine and the 3D printer.
- The quality of finished parts from the CNC machine and the 3D printer are the same.
- The time consumption of a 3D printer made product is determined by the volume of the product.
- Raw materials are infinite.
4.1. Simulation Model of TSCN
As mentioned in the previous section, TSCN consists of one orthopedist, two manufacturers, two cork suppliers, one plastic supplier and three leather suppliers. Explanations and values of used parameters for TSCN simulation model are given in Table 1. It must be noted that although it is case study, past data about customer arrivals is non-available due to data privacy.
Simulation model of TSCN starts with customer arrivals. Customers arrive to the orthopedist with triangular distributed time with lower limit 50, upper limit 70 and mode 60 min. Each customer logged into the system according to first-in first-out rule. After logging, orthopedist measures the foot size of customers and takes a plaster cast based on TRIA (5, 6, 7) min. All measurements are hold until the end of business day. At the end of the day, all scanned casts are sent manufacturers coequally. After transportation of casts to manufacturers, raw material of cork, plastic and leather are ordered. In other words, manufacturers order the required raw materials from supplier after the receiving the casts from the orthopedist. All distributions of transportation time between facilities are given in Table 1. For instance, 50% of leather raw material from third leather supplier is transported to manufacturer#1 and this transportation time follows a uniform distribution between 7 and 7.8 h. It must be noted that plastic and cork raw materials must be pre-processed in manufacturers before assembly operation. Pre-processing operations follow TRIA (25, 30, 35) and TRIA (45, 50, 55) min for plastic and cork raw material, respectively. After pre-processing operations, plastic and cork raw materials are sent to assembly area with leather which takes between 10 and 15 min uniformly. In assembly area, one for each type of raw material is assembled which follows TRIA (20, 30, 40) min. At the end of the day, all assembled insoles are sent to the orthopedist equally from each manufacturer.
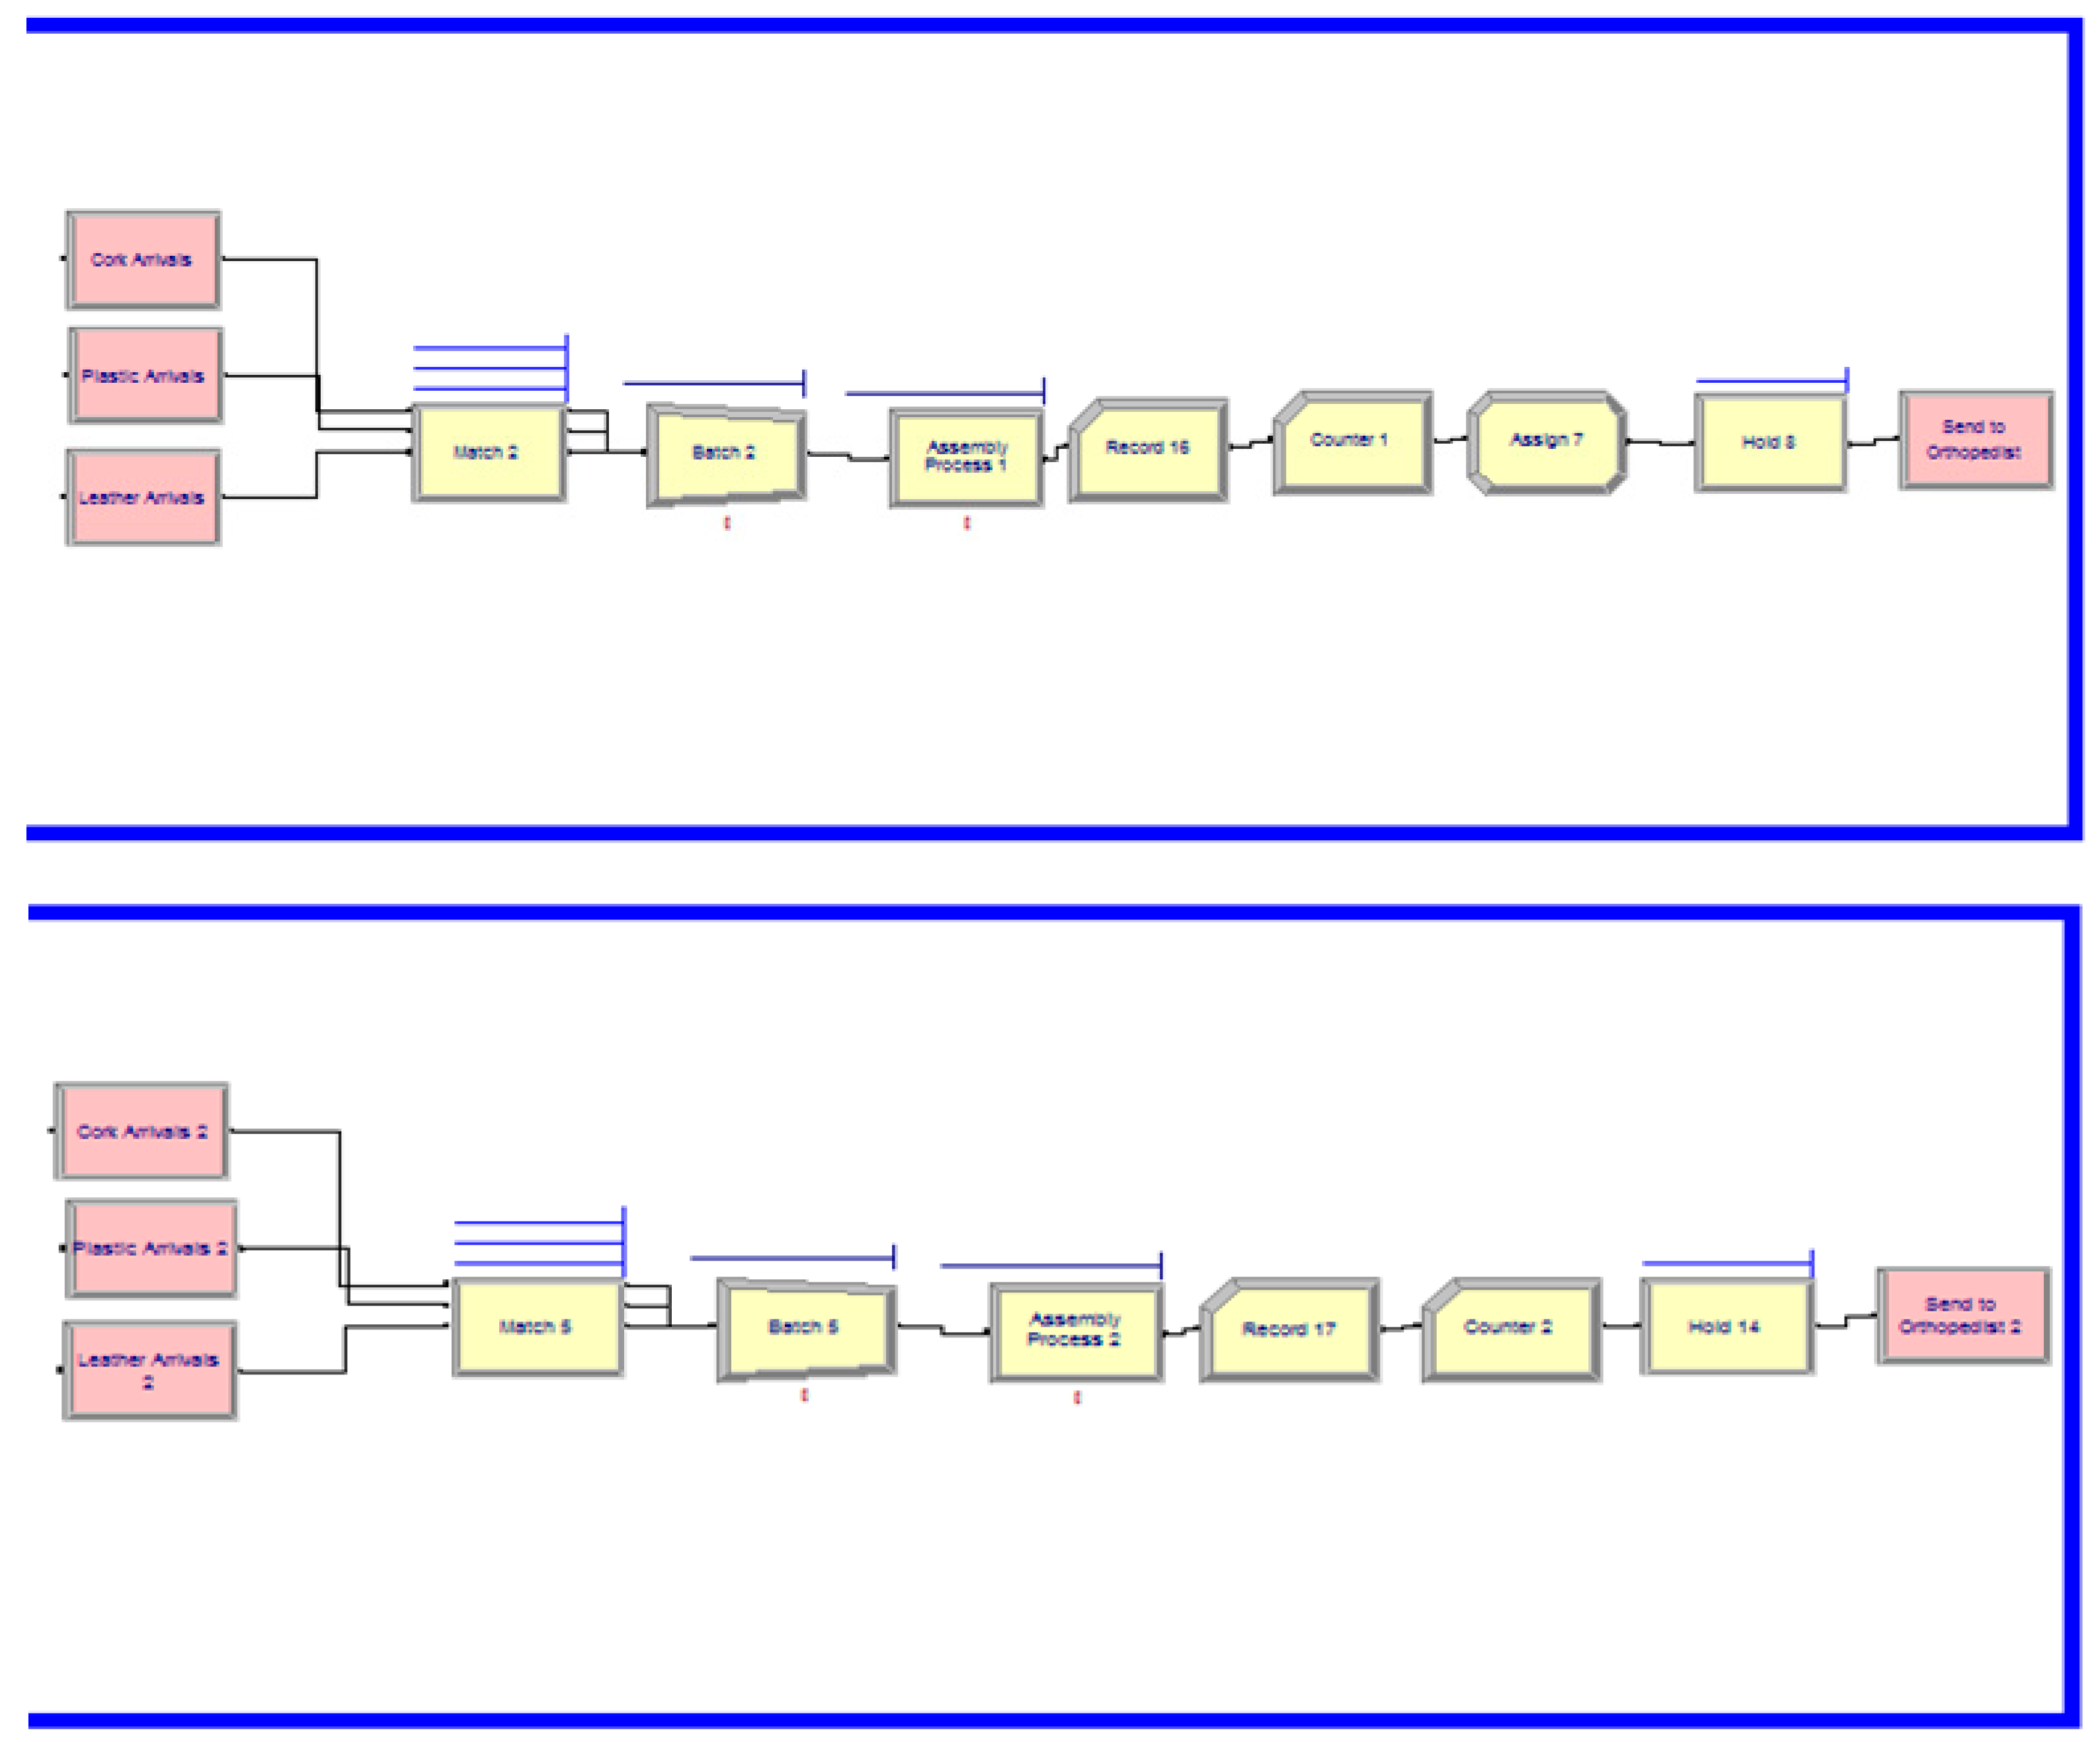
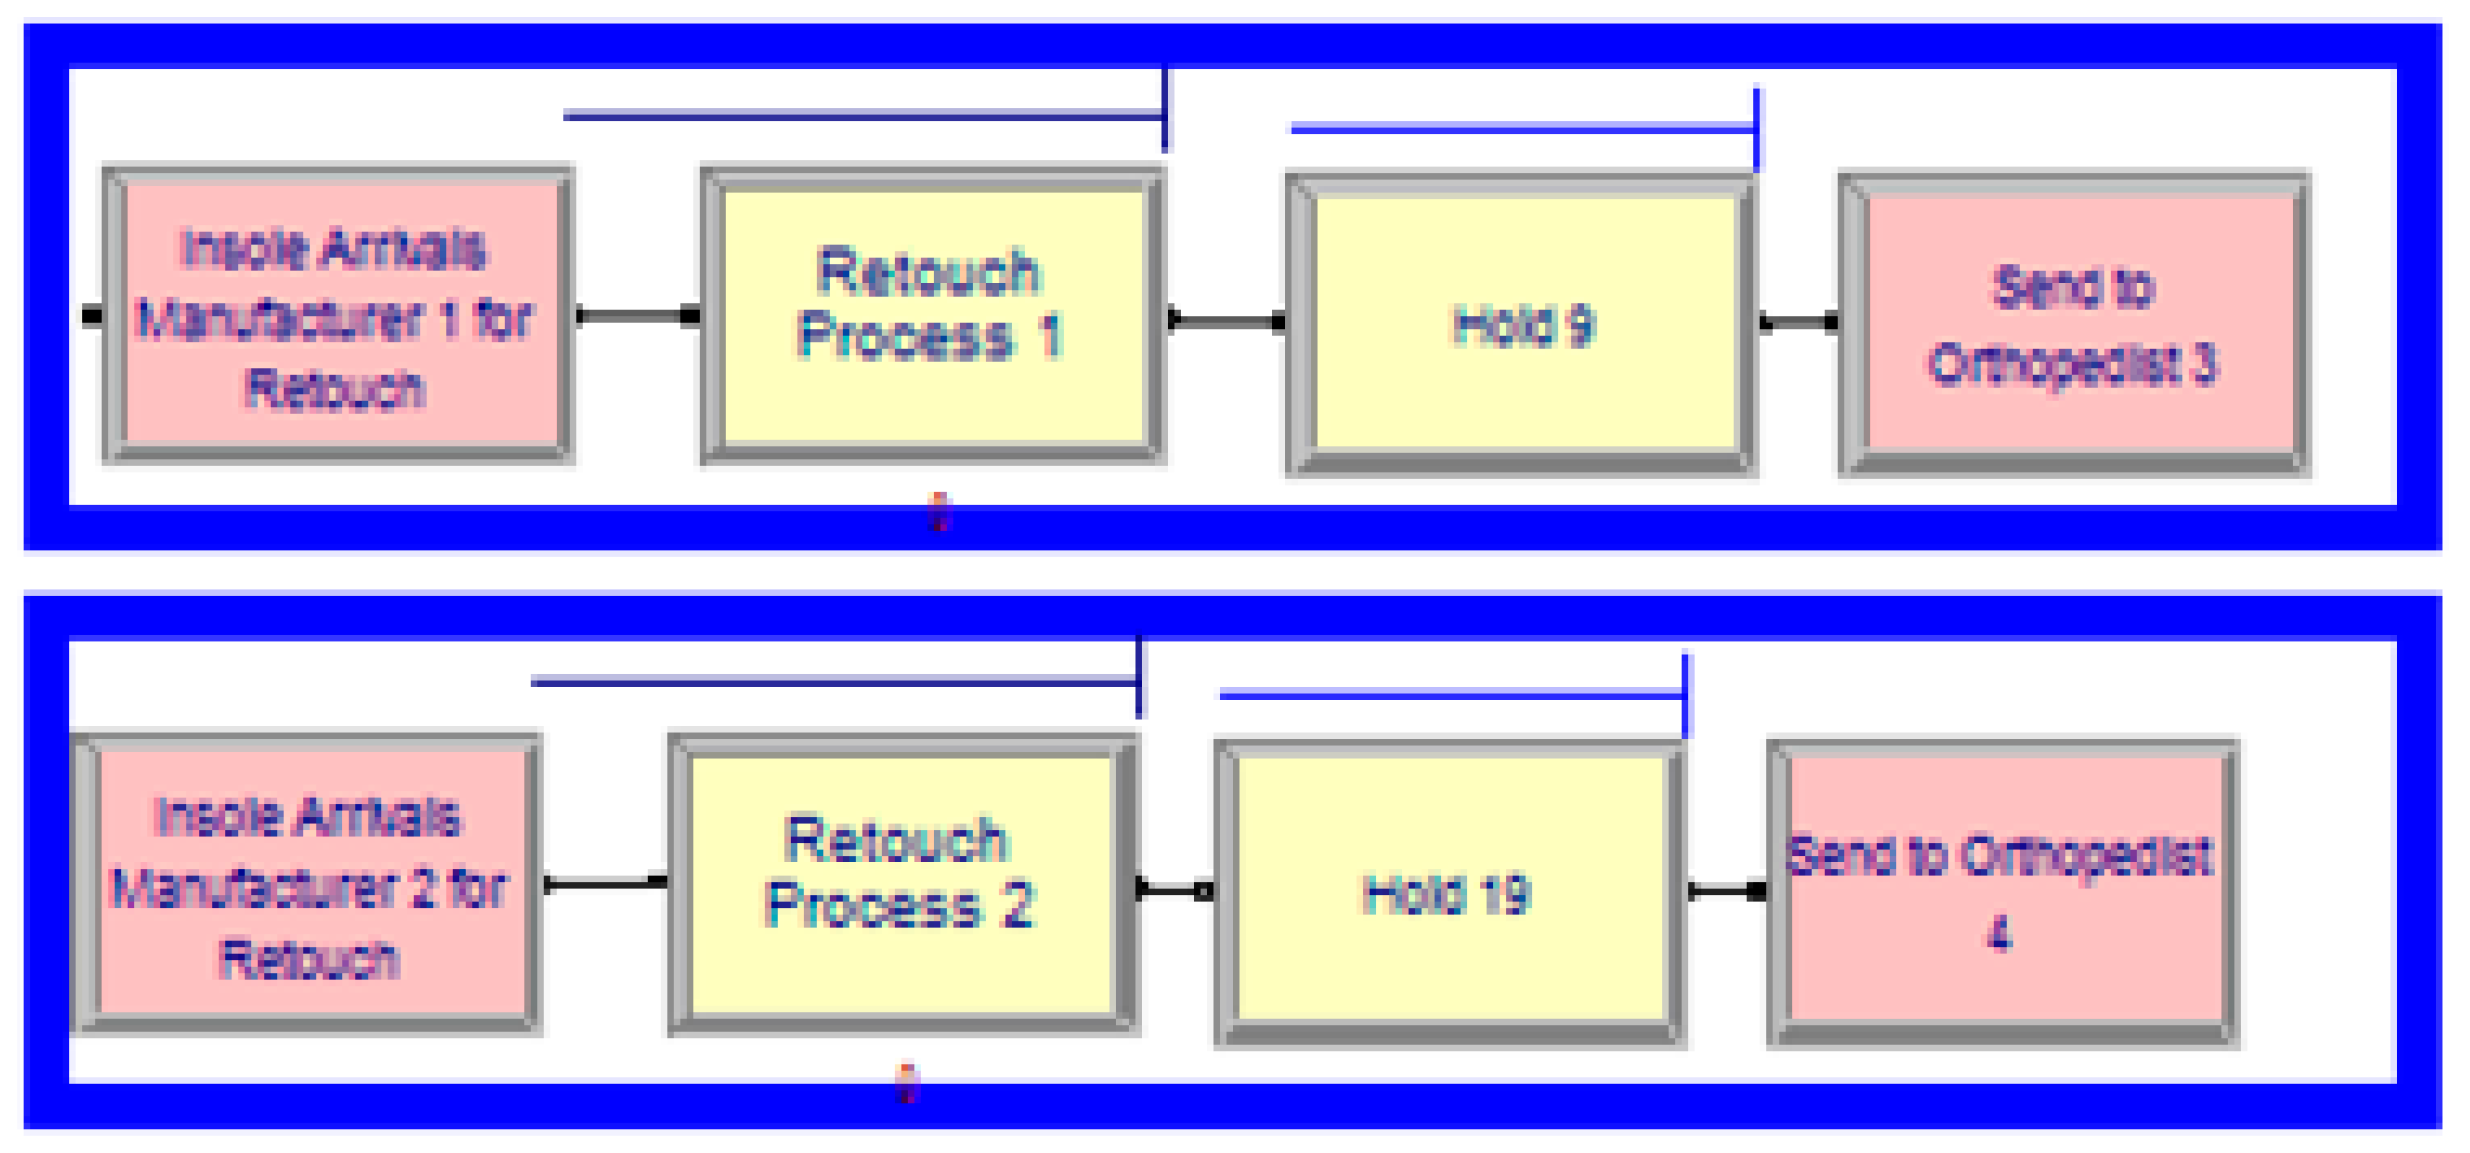
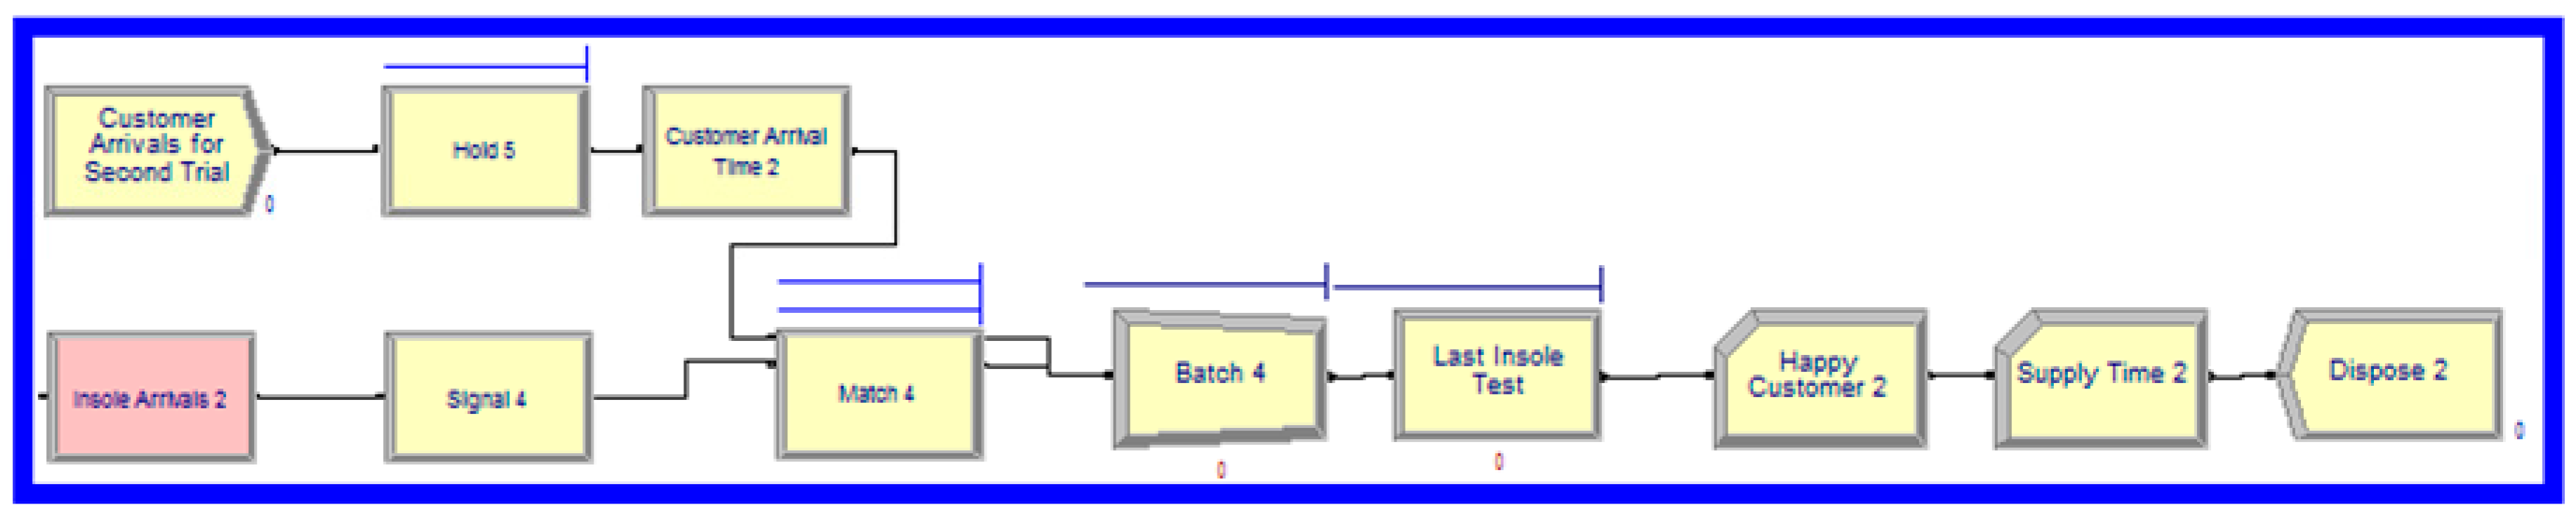
As soon as the insoles arrive to the orthopedist, owners of insoles are called and they come to orthopedist according to triangular distribution (50, 60, 70) min. When the first customer arrives to the orthopedist, he/she tests the insole which requires TRIA (7, 8, 9) min. After testing operation, 70% of insoles are sent back to the manufacturers due to mismatching. This delivery waits the end of the shift. Inappropriate insoles are sent to the manufacturer where it is manufactured firstly. Rest of the insoles (30%) are delivered to customers and removed from the model. Insoles which need for adjustments are re-processed in manufacturers and this operation follows a triangular distribution with (20, 30, 40) min. Then adjusted insoles are sent back to orthopedist at the end of the day as in the previous step. When fixed insoles arrive to the orthopedist, related customers come again to try their insoles. As initial coming, their second visit also takes a triangular distribution (50, 60, 70) min. Customers try their insoles secondly according to distribution of TRIA (7, 8, 9) min and finally adjusted insoles are suit customers’ foot. All insoles and customers which do not need new adjustments are removed from the model. General framework of TSCN simulation model is depicted in Figure 7, Figure 8, Figure 9, Figure 10, Figure 11 and Figure 12. ARENA file of TSCN simulation model can be downloaded from eozceylan.com/tscn/.
4.2. Simulation Model of 3DPSCN
As mentioned before, 3DPSCN consists of one orthopedist (the same orthopedist in TSCN), one manufacturer with one 3D printer and two filament suppliers. Related parameters which are used in 3DPSCN simulation model are given in Table 2.
Simulation model of 3DPSCN starts with customer arrivals likewise as TSCN. The triangular distribution values of customers’ arrivals are 50, 60 and 70 min. Each customer logged into the system according to first-in first-out rule. After logging, orthopedist scans the foot size of customers and the process time follows a UNIF (3, 4) min distribution. All measurements are hold until the end of business day. At the end of the day, all scanned files are sent to the manufacturer electronically which follows a UNIF (1, 2) min distribution.
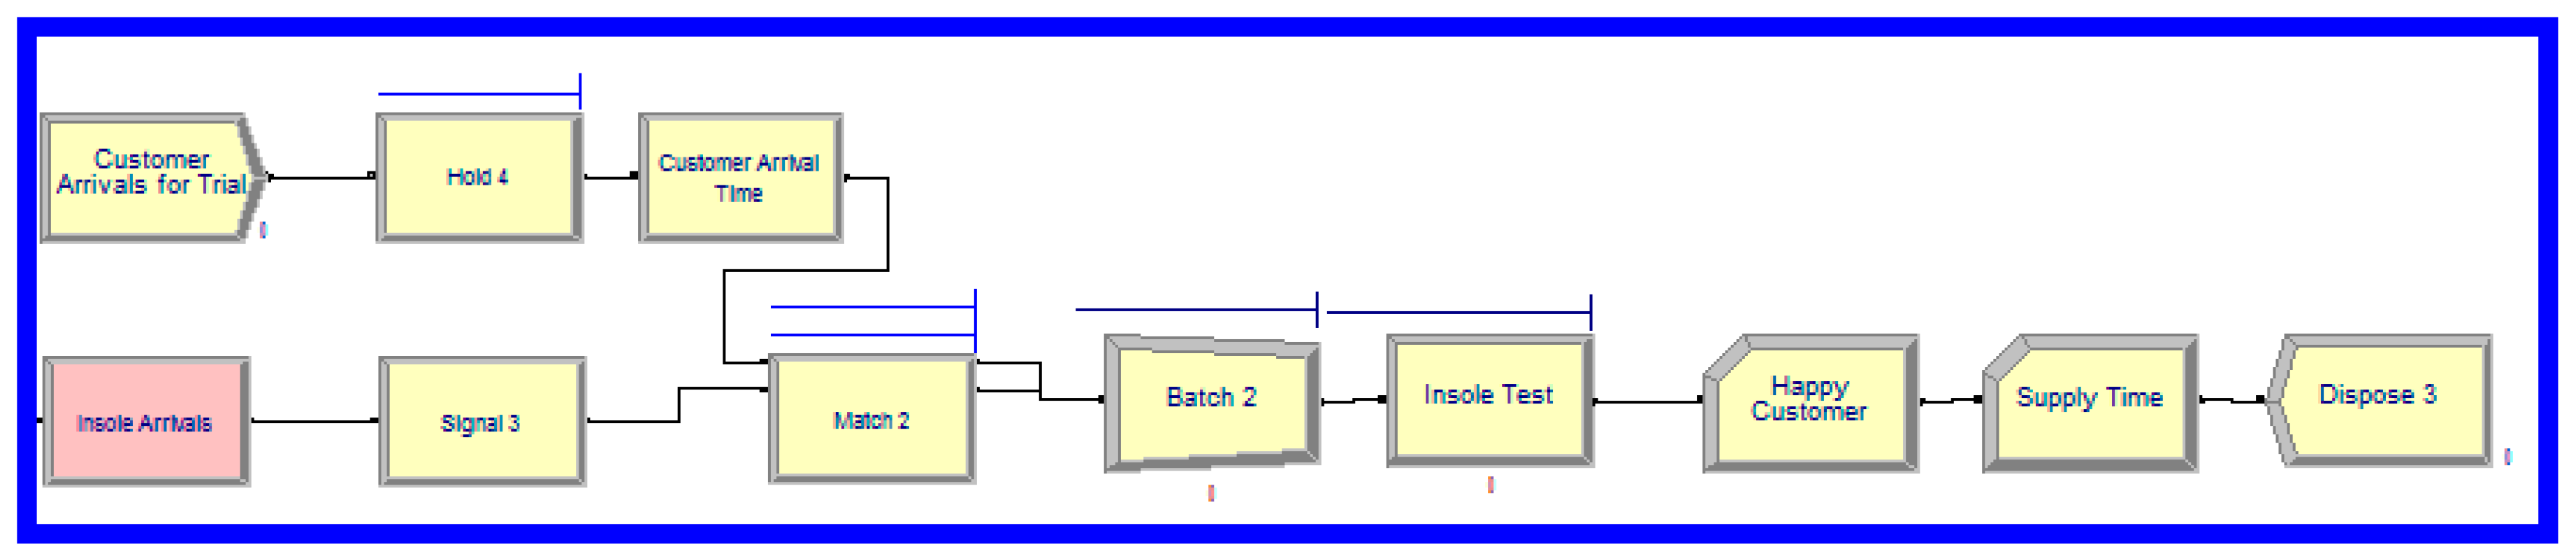
After arrival of scanning files electronically to the manufacturer, required filament amount is ordered from two different suppliers. Their delivery time is given in Table 2. For instance, 50% of filament raw material is transported to the manufacturer from first supplier and it takes a uniform value between 8.5 and 8.9 h. Demanded insoles are printed using required filament and this process follows TRIA (55, 60, 65) min. All printed insoles are kept waiting by the end of the day. Then, printed insoles are sent to the orthopedist with a UNIF (10, 12) min distribution. As soon as insoles arrive to the orthopedist, owners of insoles are invited to take their insoles. Their arrivals take with lower limit 50, upper limit 70 and mode 60 min. When the first customer arrives to the orthopedist, he/she tests the insole which takes TRIA (7, 8, 9) min. After testing operation, all customers are satisfied with their insoles. Because the strict integration between scanning and printing ensures that a single moment of contact between customer and orthopedist is enough for the right insole. All satisfied customers and their insoles are removed from the model. General framework of 3DPSCN simulation model is depicted in Figure 13, Figure 14 and Figure 15. ARENA file of 3DPSCN simulation model can be downloaded from eozceylan.com/3dpscn/.
5. Comparative Results
The developed simulation model is conducted on a PC with an Intel I3 2.3 GHz processor with 4 GB of RAM. The number of replications is determined as 20 and each replication length is 2340 h with a warm-up period which is 60 h. The number of replication is calculated by using the following equation [41]:
where is the sample mean, is the sample standard deviation, is the number of replication, and is the upper critical points from Student’s distribution with degrees of freedom. Using the “lead time of customers who get insole on the first try in TSCN”, for example, this works out for a 95% confidence interval to;
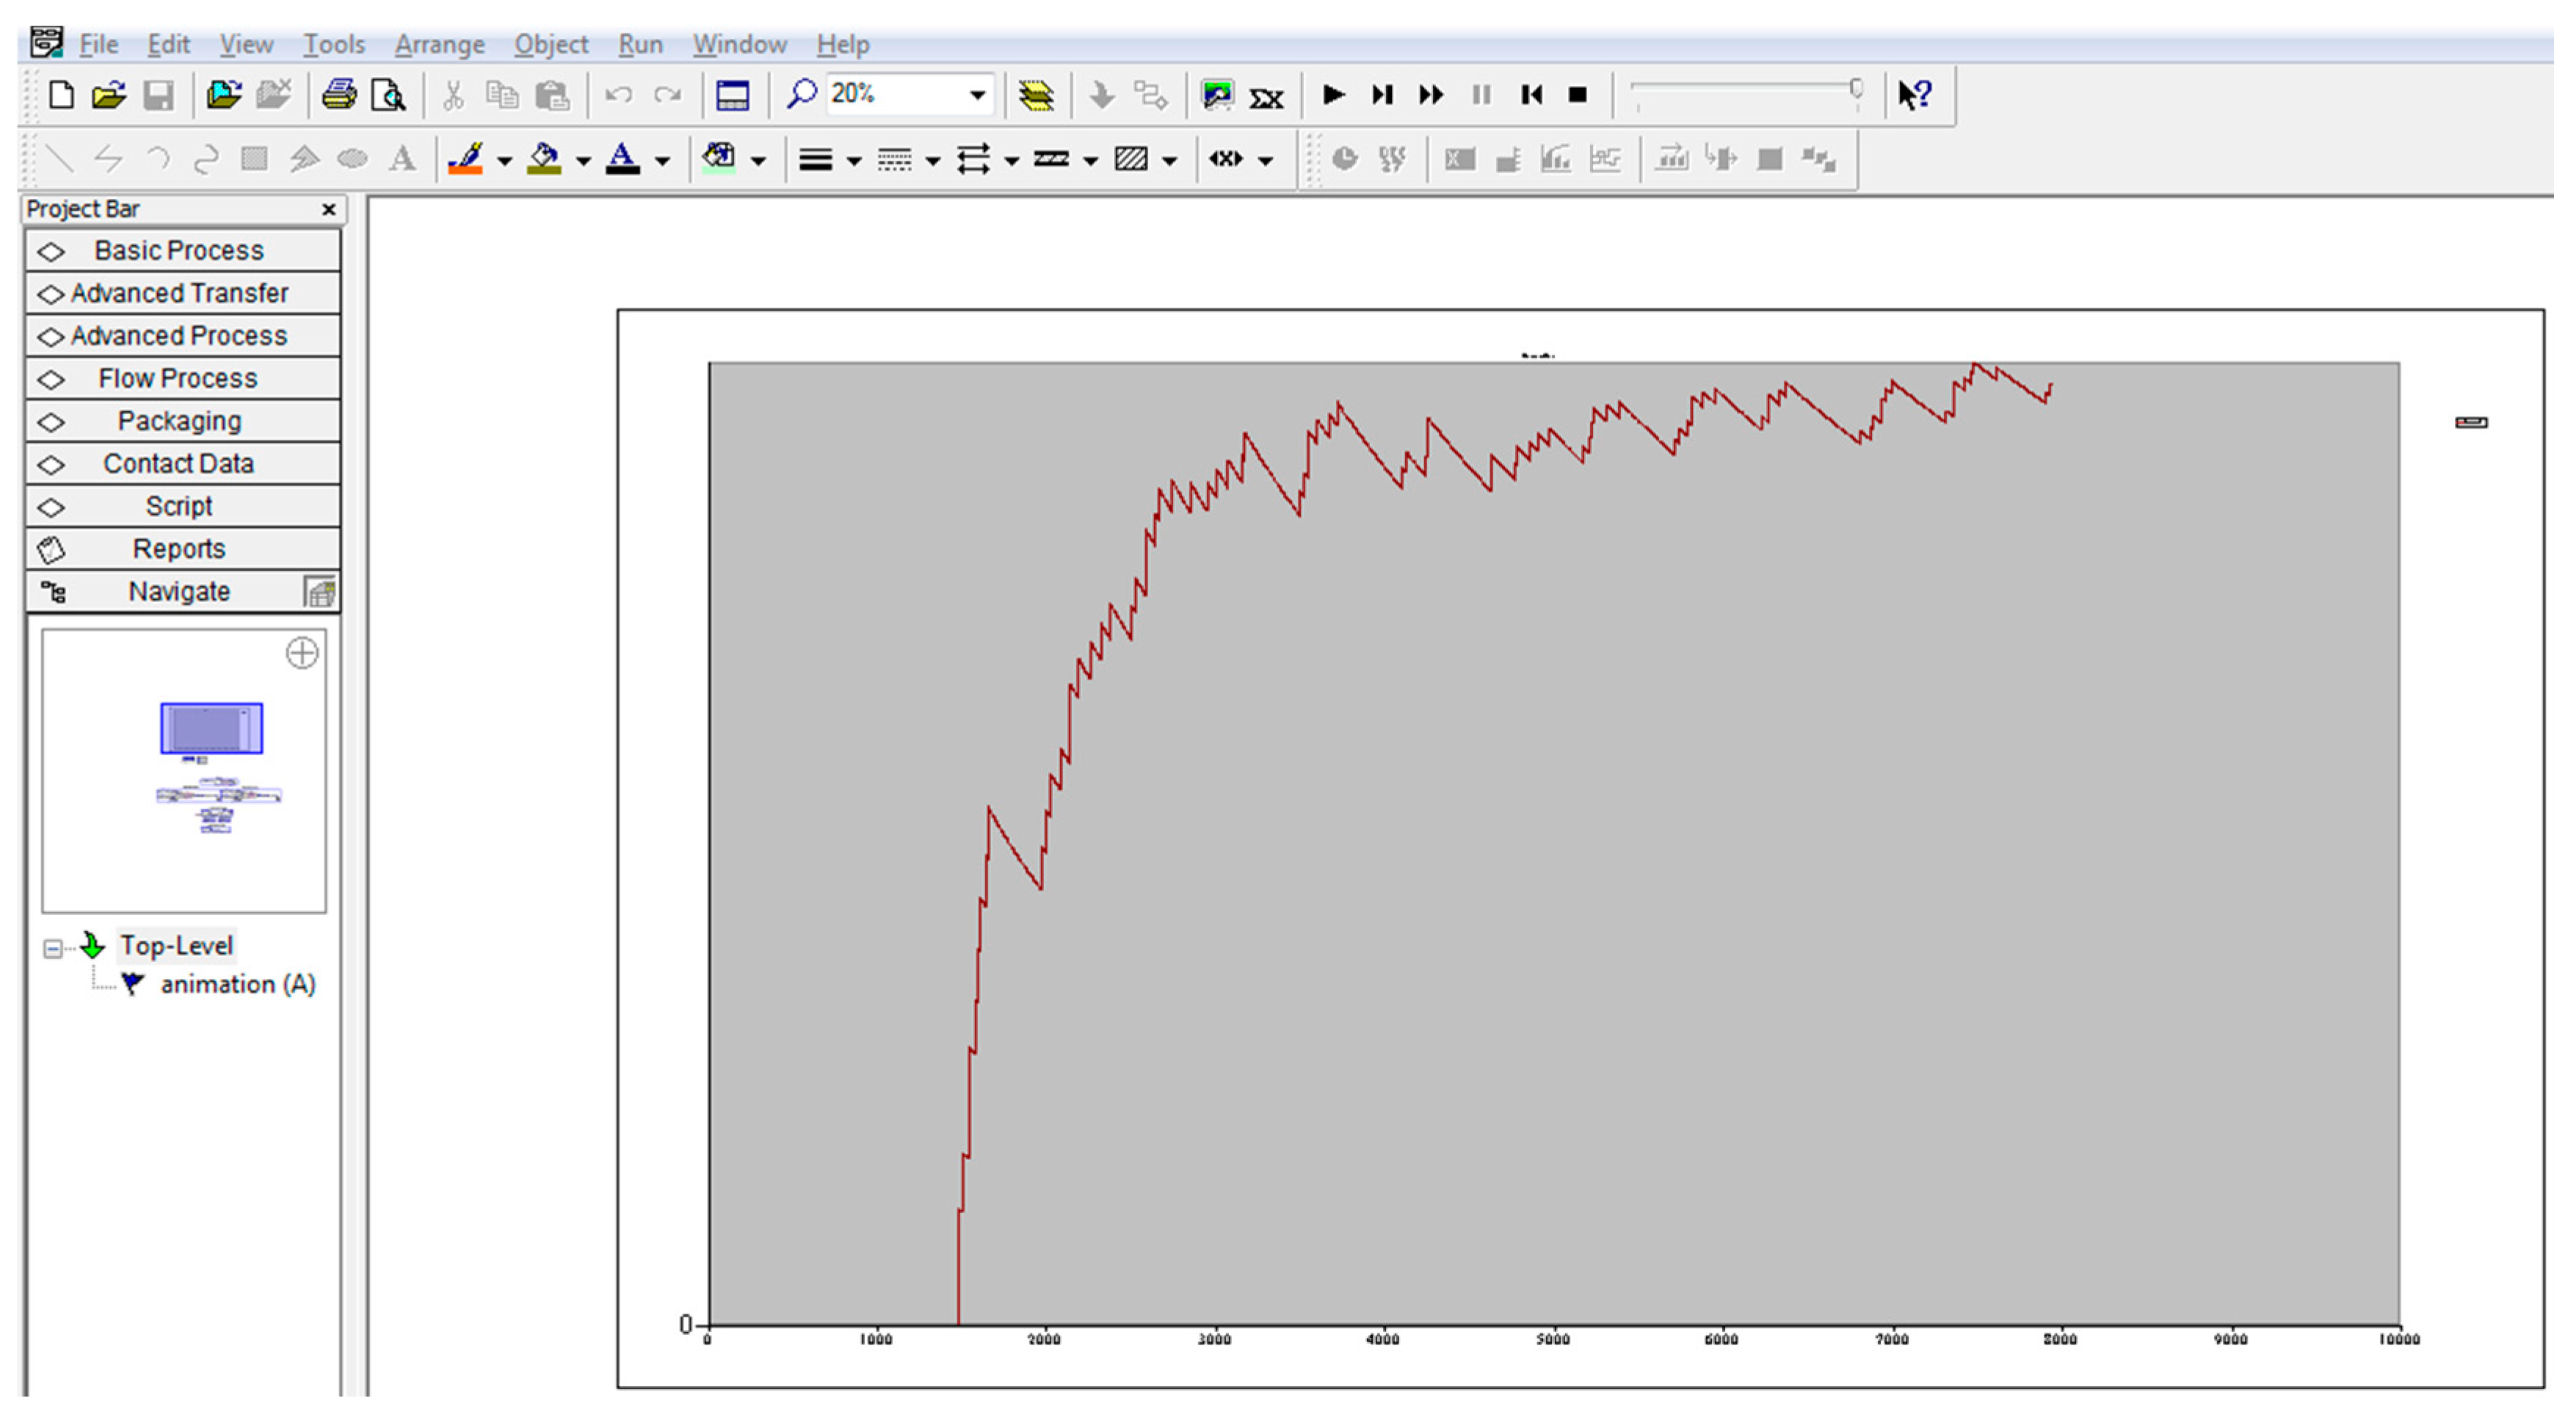
According to this result, 20 simulation replications are enough. 60 h for warm-up period is calculated based on proper initialization approach [41,42]. Plot of daily average entity output to identify the warm-up period is shown in Figure 16. As can be seen from Figure 16, daily output reaches the average after 60 h.
It is noted that there is one shift with 9 h in a day. Therefore, total replication length is 260 work days. The total required computation time for the simulation model takes about 3 min. Table 3 defines the performance indicators of the model. As it can be seen from Table 3, first 8 performance indicators are related with current situation. The statistical values of performance indicators based on the 95% confidence interval are given in Table 4. According to Table 4, obtained results are acceptable statistically. Figure 17 and Figure 18 indicate the results of each replication (first 10 replications for the simplicity) comparatively.
The results in Figure 17 show that 3DPSCN outperform TSCN in terms of lead time and number of customers served. For instance, while a customer has to wait at least 20.32 day for an orthopedic insole in the classical system, the waiting time can be increased to averagely 27.03 day if it fits at the second try. Conversely, average lead time is calculated as 2.55 day with a 0.14 day standard deviation in the proposed system which includes 3D printing technology. According to another indicator which is the number of customers, 3DPSCN serves to almost 2308 customers with a 34% increment than the number of customers in TSCN. It is also clear to see that the number of customers who is happy at first try is around 560 while averagely 1160 pairs of insole fit to foot of people at second try. Therefore, the new system can serve more customers than the current system under the same working duration (260 days).
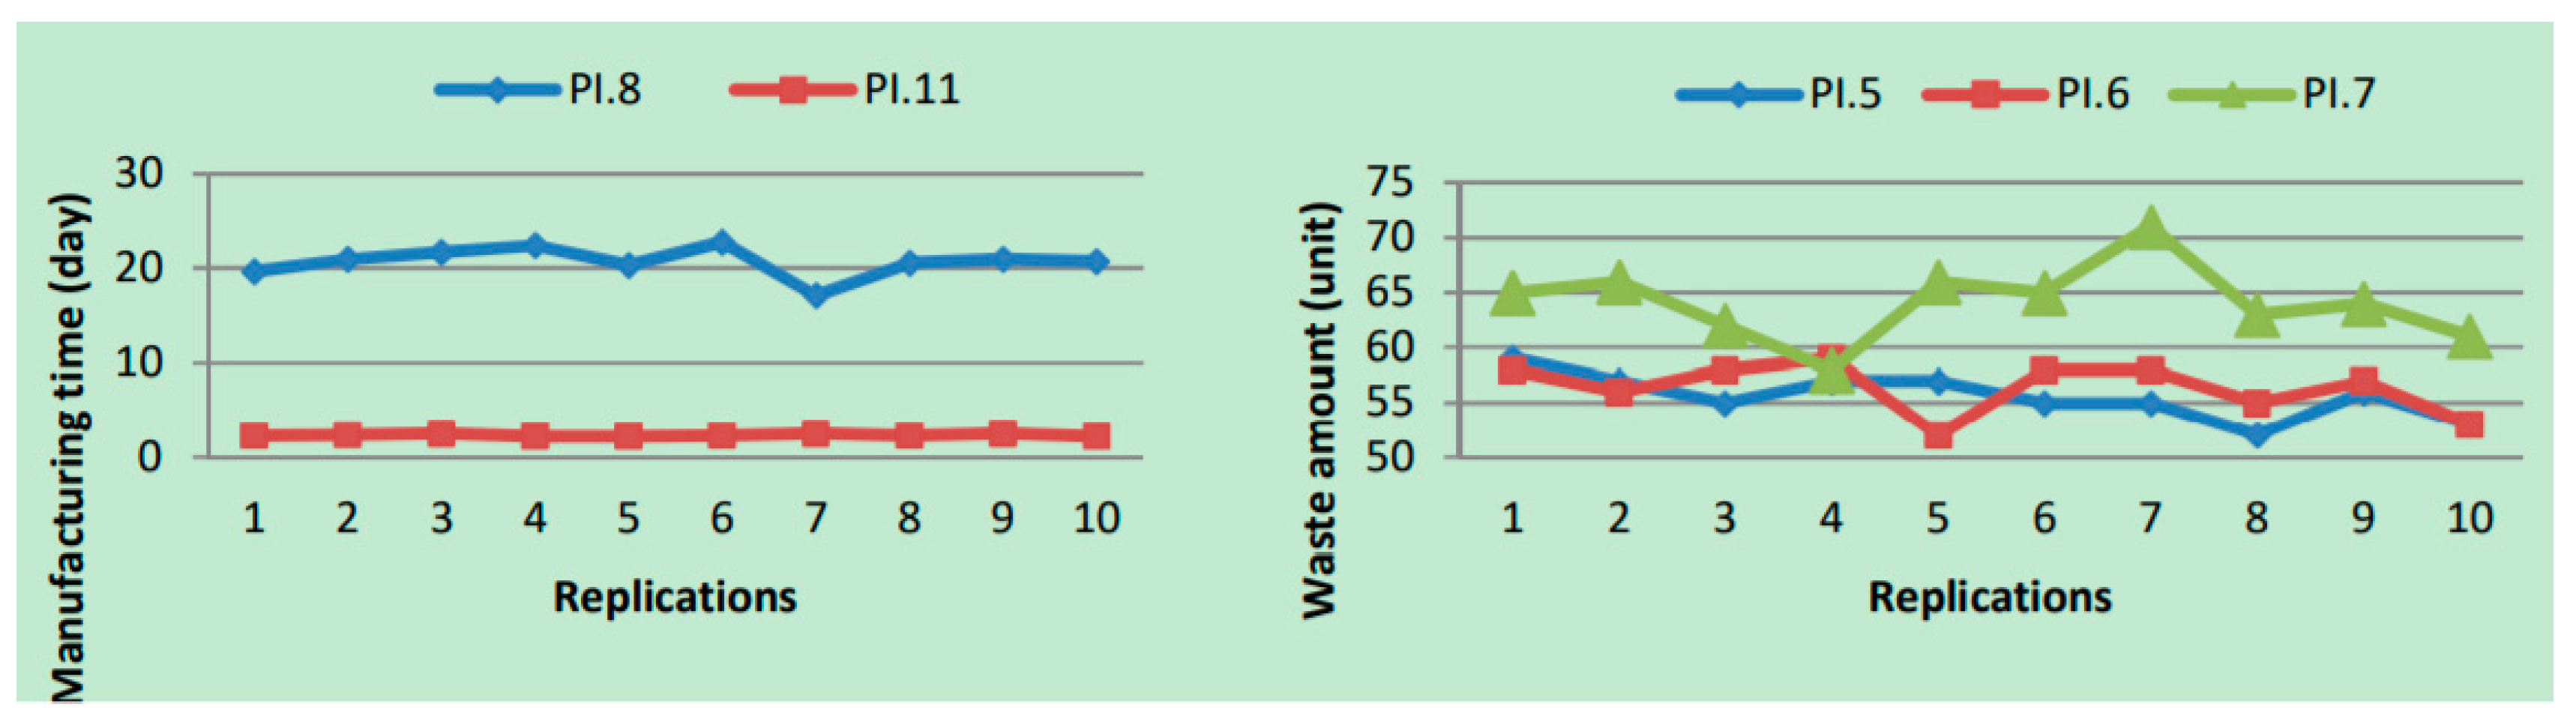
Total manufacturing times in TSCN and 3DPSCN are shown in Figure 18. According to Figure 18, while manufacturing time of TSCN is longer than 3DPSCN, it also fluctuates between 17.10 and 22.77 days. On the other hand, average manufacturing time of 3DPSCN is 2.36 days with a 0.14 day standard deviation. Finally, released waste amount of cork, plastic and assembly operation is shown in the right side of Figure 18. According to the results, while there is no waste in 3D manufacturing, averagely 60 units of cork and plastic raw material and insole are scrapped.
5.1. Scenario Analyses
This section presents the results of additional computational experiments to gain a better sense of the potential and value of the proposed 3DSCN model, and also to see how the changes in the problem parameters, such as number of machines, doctors, acceptance rate of first testing, customer arrivals and breakdowns affect the solution value. Each scenario is based on the initial description of the base simulation model described in the previous section and is solved by Arena 14.0 simulation package program within the same computer.
5.1.1. Sensitivity to Changes in the Number of Machines (Scenario A)
The first analysis considers effect of changing the number of machines in manufacturers. To do so, current number of machines (2 and 1, respectively) in first and second manufacturers in TSCN and number of 3D printer (2) in 3DPSCN is increased by 1. Average, maximum and minimum values of 20 replications are given in Table 5.
According to Table 5, increasing the number of CNC machines in TSCN decreases the lead time dramatically from 20.32 days to 2.44 days for the first try and from 27.03 days to 5.32 days for the second try. Buying two machines for two manufacturers also increase the number of customers who are served by 32% according to initial system. For the 3DPSCN system, purchasing one more 3D printer decreases the lead time by 16% with the increment of seven more customers. It is clear that increasing the number of machines provides more benefits to TSCN than the 3DPSCN in terms of lead time and number of customers.
5.1.2. Sensitivity to Changes in the Acceptance Rate of First Testing (Scenario B)
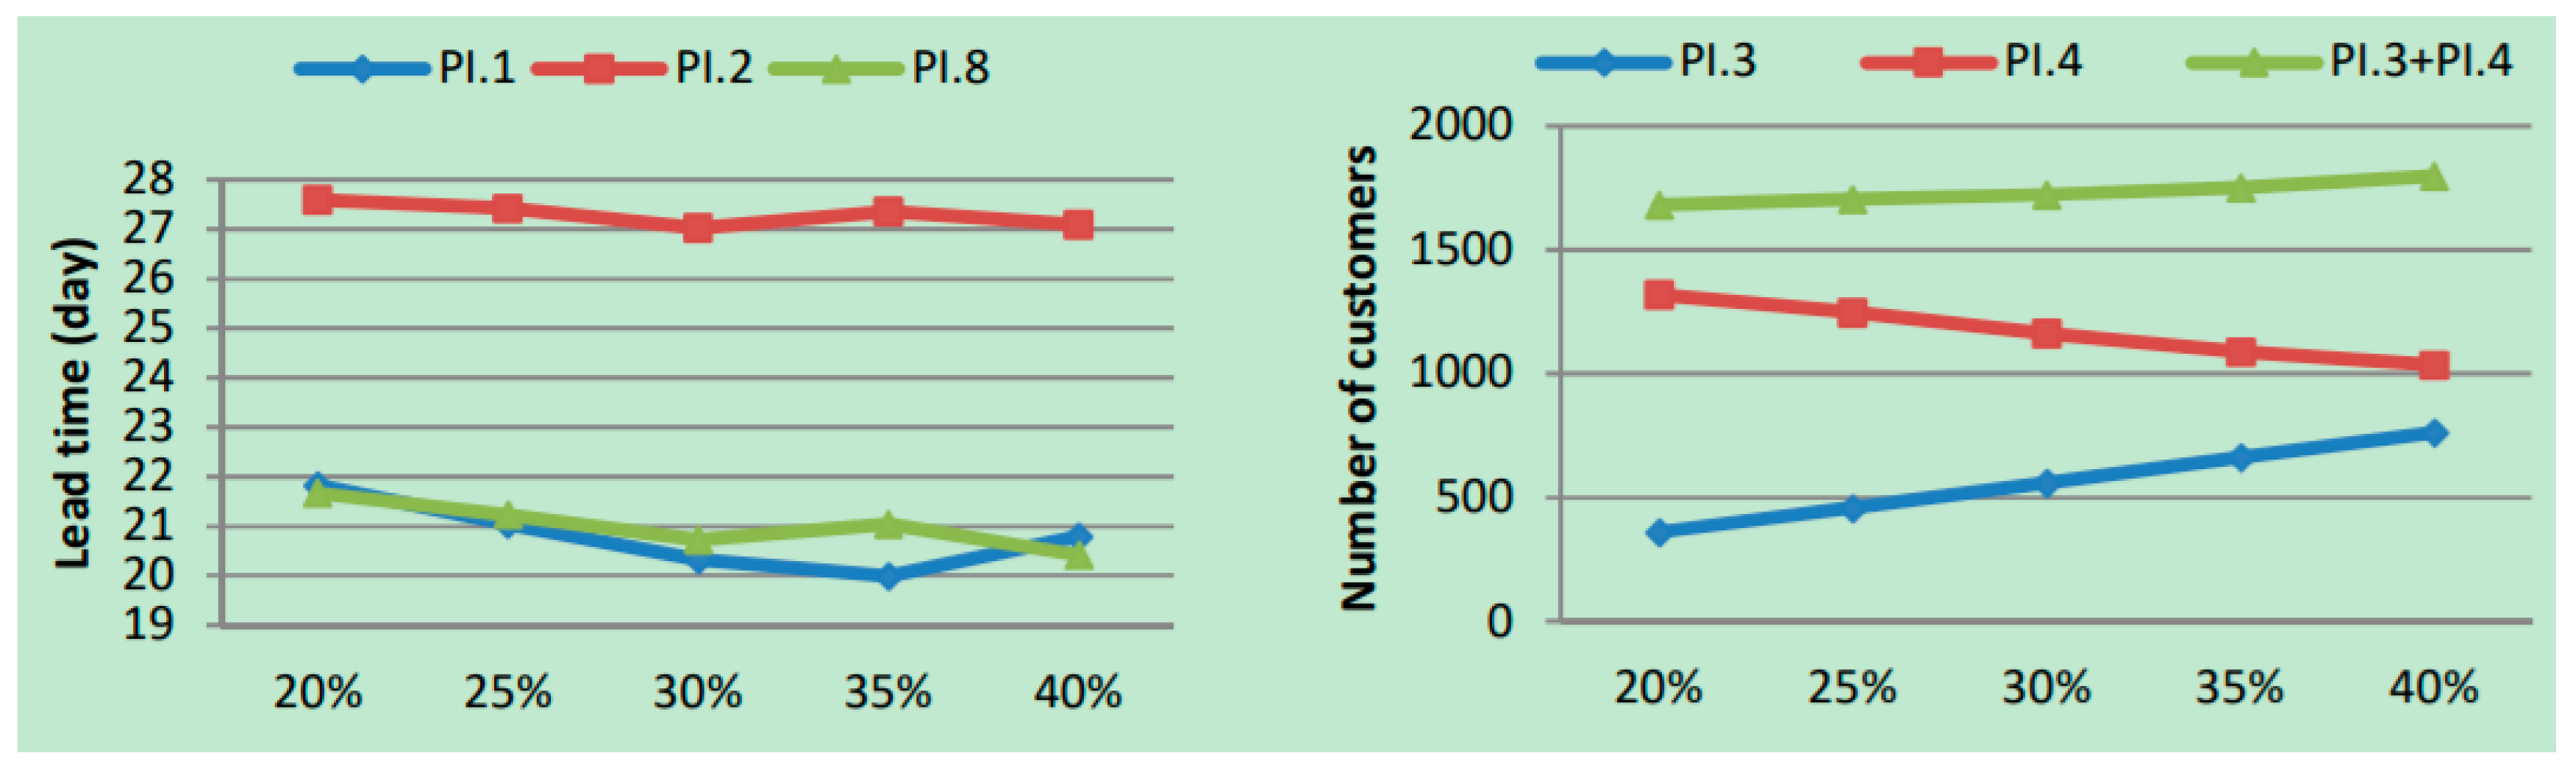
This section analyses the sensitivity of the solutions on the acceptance rate of first testing in TSCN. For the analysis, the current acceptance rate of 30% is changed from 20 to 40% in increments of 5%. Figure 19 indicates the obtained results according to different acceptance rate.
According to right side of Figure 19, increasing the acceptance rate from 20 to 35% decreases the lead time at a level of 10%. While minimum lead time is observed when the acceptance rate is 35%, maximum values of PI.1, PI.2 and PI.8 are obtained when the acceptance rate is 20%. In the framework of number of customers, it is clear to see that increasing the acceptance rate also increases the number of customers who are happy at first try but decreases the number of customers who are satisfied at second try. Due to domination of first group customers on second group customers, total number of customers who are served is also increased. In detail, increasing the acceptance rate from 20 to 40% leads to an increase in total number of customers by 6.9%
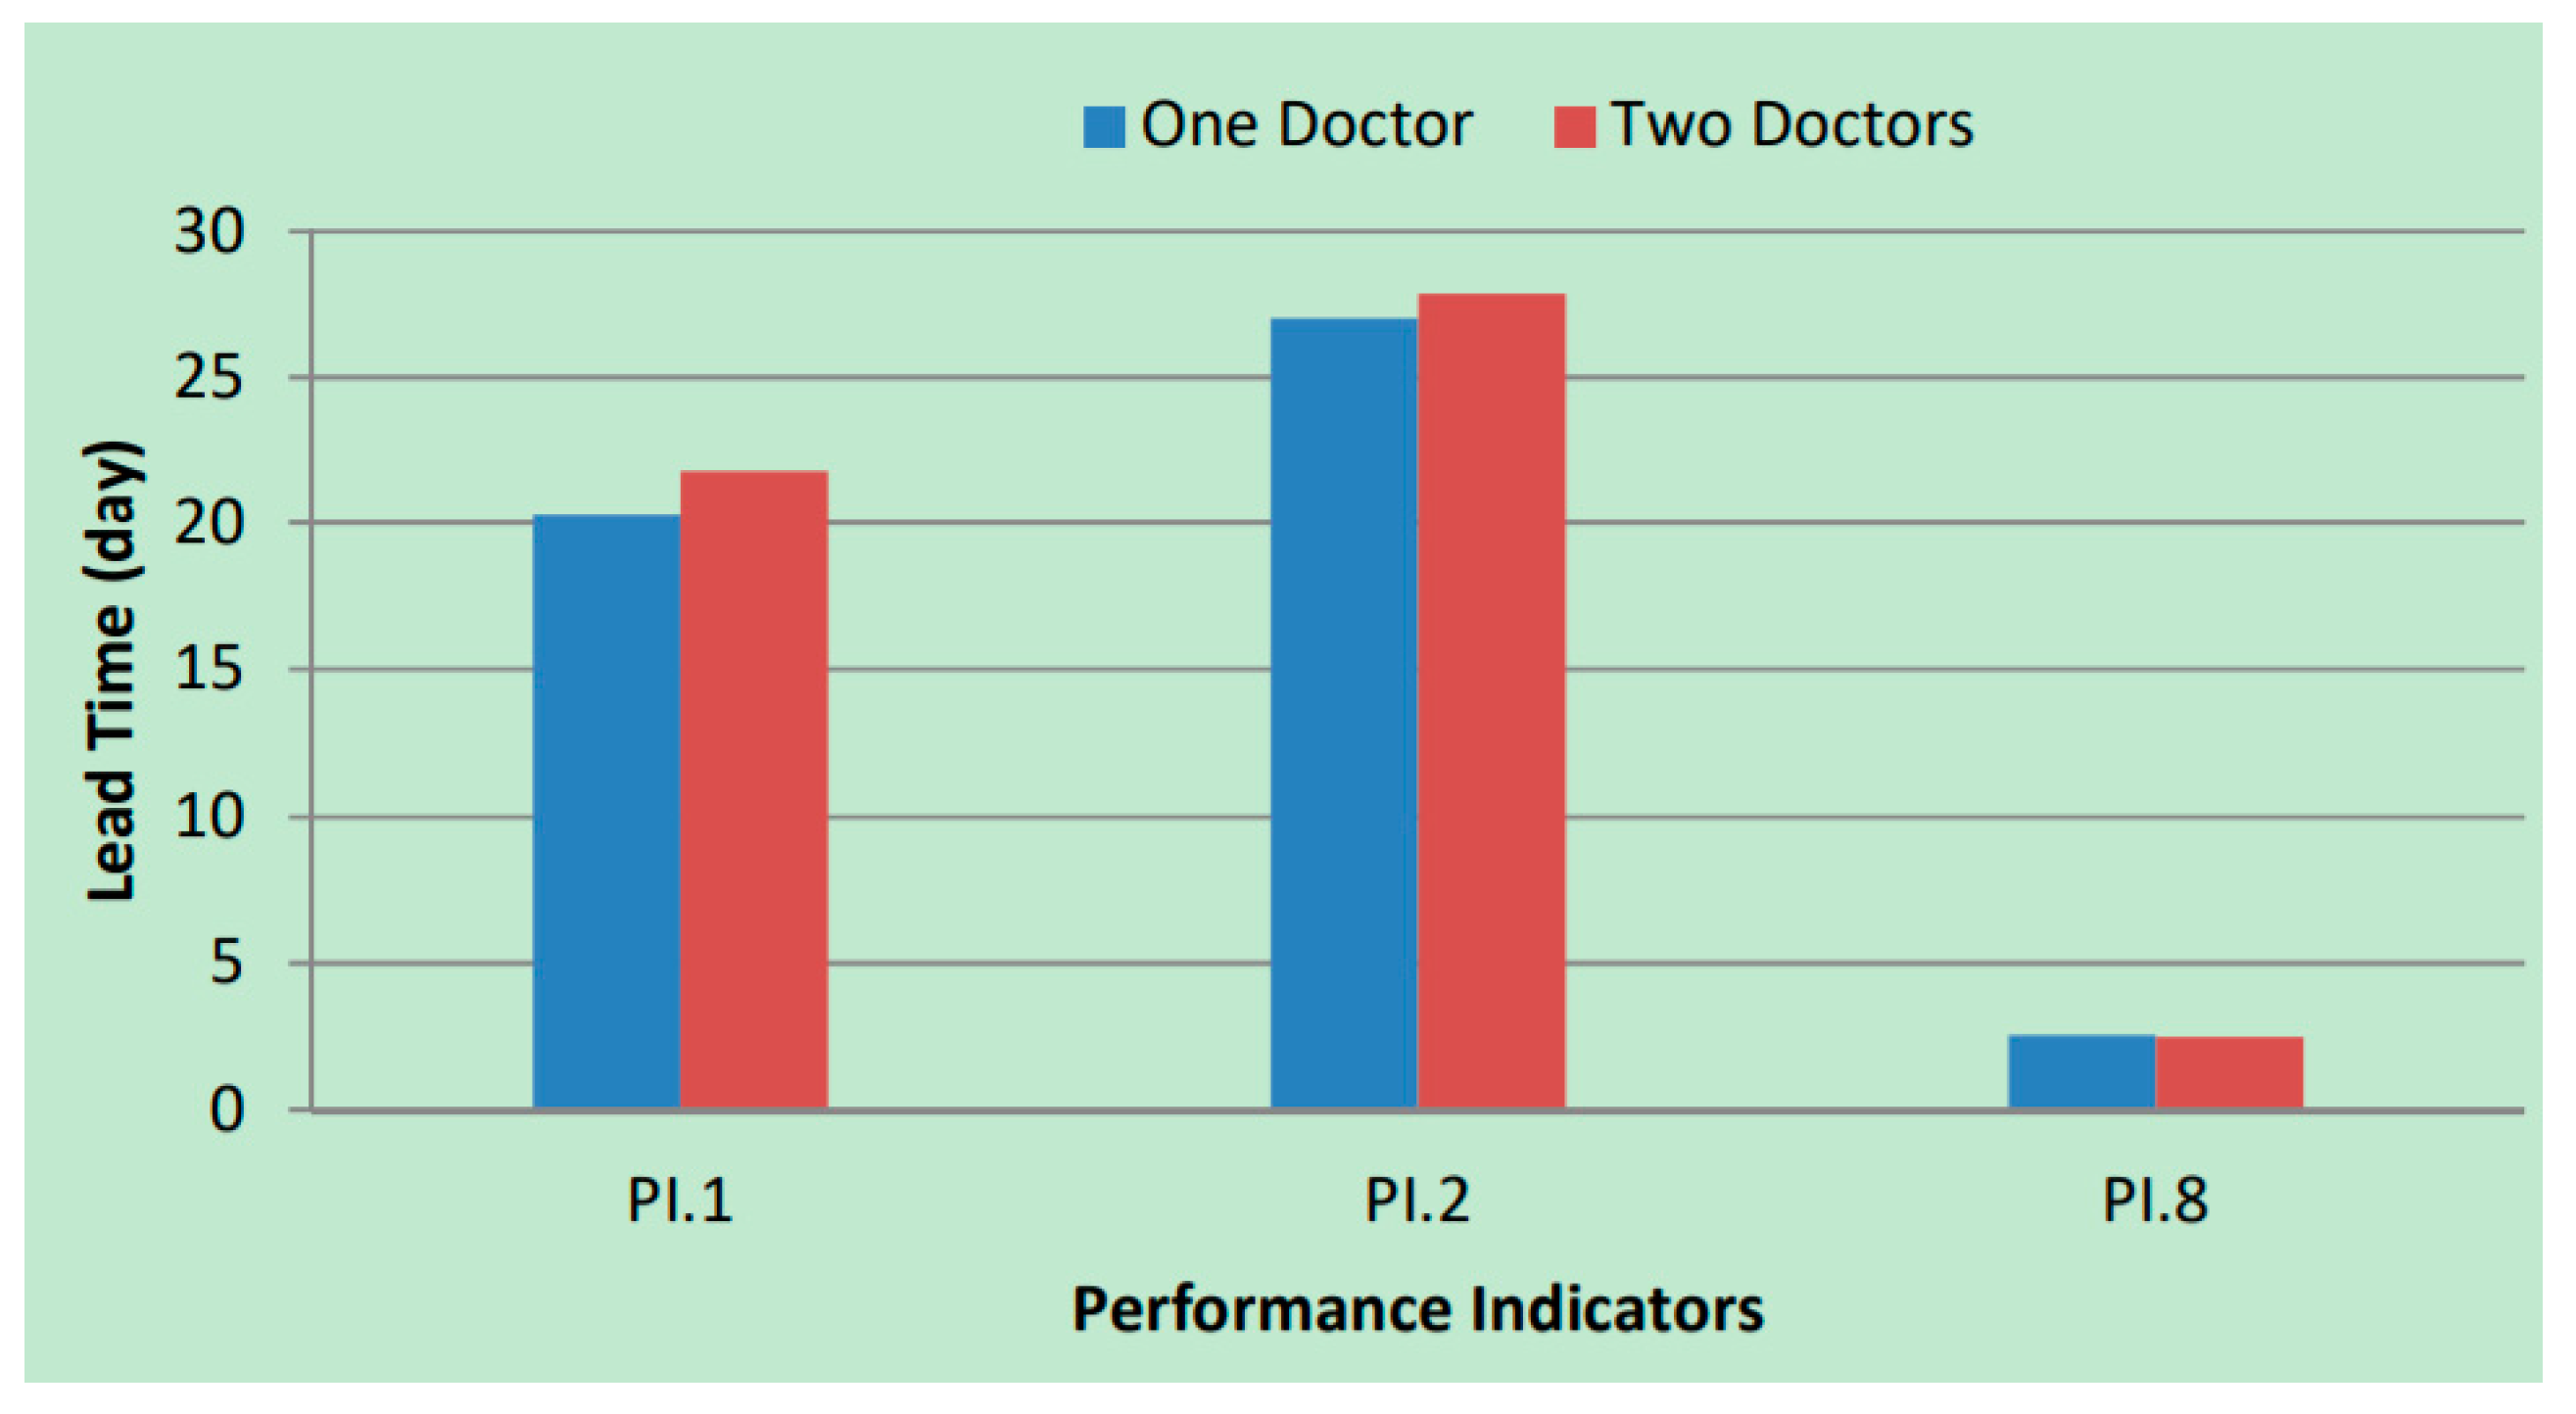
5.1.3. Sensitivity to Changes in the Number of Doctors (Scenario C)
One nontrivial parameter that we analyze here concerns the potential benefits for the current doctor of finding a new doctor who can work with him/her. The aim of the experiments in this section is to see whether the hiring a new doctor will result in improvements in the overall system. To this end, the current number of orthopedic doctor (1 for both two systems) is increased to 2 for both TSCN and 3DPSCN. Figure 20 compares the lead times for both cases. It is observed from Figure 20 that increasing the number of doctors in TSCN also increases the required lead time. The main reason of this result is the increasing the number of casts which are sent from more doctors to manufacturers. As expected, increasing the number of doctors decreases the time to take a cast. However, it results more casts which must be manufactured according to the base situation. For that reason, casts started to wait in manufacturing which leads to high lead time. On the other hand, hiring a second doctor in 3DPSCN decreases the required lead time from 2.55 to 2.48 days.
5.1.4. Sensitivity to Changes in the Distribution of Customer Arrivals (Scenario D)
In the current analysis, arrivals of customers to the orthopedist to give an order and also receive the insole are based on TRIA (50, 60, 70) min. To see the effects of exponential distribution, TRIA (50, 60, 70) min is changed to 49.5 +EXPO (10.5) min for two models. Obtained values for each performance indicator are given in Table 6. Values in Table 6 are acceptable statistically based on the 95% confidence interval.
When the obtained values in Table 6 are compared with the values in Table 4, lead time and total manufacturing time in TSCN are decreased. On the other hand, there is no change on the values of material waste and number of customers who get the insole. Thus, it can be said that if customer arrivals are considered as exponential rather than triangular (while the other parameters are constant), lead and manufacturing time in both supply chain networks can be reduced in the ratio of 50%.
5.1.5. Sensitivity to Changes in the Breakdown Situations (Scenario E)
In the initial analysis, a breakdown is not allowed. To reflect real life conditions, a break down related with the CNC machines and 3D printers are considered in this sub-section. To do so, following distributions for breakdown are added to the model. For the CNC machines in manufacturer#1, there is a breakdown which lasts TRIA (25, 30, 35) min after UNIF (3.5, 4.5) h. For the CNC machine in manufacturer#2, there is a breakdown which lasts TRIA (25, 30, 35) min after UNIF (3.5, 4) h and finally, for the 3D printer, there is a breakdown which lasts TRIA (3, 4, 5) min after UNIF (4, 5) h. It must be noted that breakdown conditions are tested when the customers arrive exponentially. Obtained values for each performance indicator are given in Table 7. Values in Table 7 are acceptable statistically based on the 95% confidence interval.
When the values in Table 7 are compared with the values in Table 6, lead time (PI.1 and PI.2) and total manufacturing time (PI.8) in TSCN are decreased as expected. On the other hand, there is no significant change on lead and manufacturing time in the case of 3D printing. In terms of the number of customers, it is decreased by 3% in TSCN while it is decreased by 0.3% in 3DPSCN.
6. Conclusions
On a strict unit cost comparison, 3D printing cannot compete with traditional manufacturing at scale, so the question one has to ask is [43]: what benefits does it offer in terms of responsiveness and customization, as well as reducing operational complexity? To answer this question, a simulation approach which reflects and compares two different SCNs (former is TSCN and latter is 3DPSCN) is developed. Proposed simulation models have briefly sought the transformative effects of additive manufacturing on traditional supply chains. A case study in orthopedic insole production and distribution is considered. Two simulation models of TSCN and 3DPSCN have been provided to illustrate how the performance and structure of supply chain may change as a result of AM technology. Obtained managerial insights show that the concrete benefits such as lead-time and cost reduction that can be achieved by 3DPSCN compared to TSCN.
Consideration of the parameters distribution as triangular and uniform, developing the model without monetary parameters and running the proposed model in healthcare industry are the limitations of the paper.
The study can be extended in several ways as given below:
- To avoid carrying out further simulation experiments, simulation optimization techniques such as meta-models or variance analysis techniques can be applied.
- To reflect larger networks in real life, the number of facilities can be increased horizontally and vertically.
- To see the environmental effects, more performance indicators which represent assessment values concerning polluting factors, water or electricity uses related with production and transportation can be added.
- To see the economic effects, cost information of shipping, manufacturing and other activities can be added.
Consequently, while there is certainly a strong possibility for 3D printing (AM technology) to expand into further reaches, we think it is important to ground this speculation into a realistic path forward from a supply chain perspective. Our aim is to contribute to this goal via the analysis provided here.
Acknowledgments
The authors are thankful to the assistant editor and anonymous three reviewers for their constructive comments and suggestions on an earlier version of the paper. First author was supported by the BAGEP Award of the Science Academy in Turkey.
Author Contributions
All authors have made contributions to the work reported in the manuscript. The authors are listed in order of their contributions. In detail, E.Ö. and C.Ç. conceived of the presented idea. E.Ö., C.Ç., and N.D. have contribution about study conception and design. They wrote the manuscript and fabricated the examples. N.D. acquired the data. O.S. built the simulation model and carried out the experiments. All authors discussed the results and contributed to the final version of the manuscript.
Conflicts of Interest
The authors declare no conflicts of interest.
References
- The Limits of 3D Printing. Available online: https://hbr.org/2015/06/the-limits-of-3d-printing (accessed on 26 June 2017).
- Çetinkaya, C.; Özceylan, E. Impacts of 3D printing on supply chain management. In Proceedings of the 13th International Logistics and Supply Chain Conference, İzmir, Turkey, 22–23 October 2015; pp. 649–657. [Google Scholar]
- Holmström, J.; Partanen, J.; Tuomi, J.; Walter, M. Rapid manufacturing in the spare parts supply chain: Alternative approaches to capacity deployment. J. Manuf. Technol. Manag. 2010, 21, 687–697. [Google Scholar] [CrossRef]
- A Third Industrial Revolution. Available online: http://www.economist.com/node/21552901 (accessed on 26 June 2017).
- Campbell, T.A.; Ivanova, O.S. Additive manufacturing as a disruptive technology: Implications of three-dimensional printing. Technol. Innov. 2013, 15, 67–79. [Google Scholar] [CrossRef]
- Liu, P.; Huang, S.H.; Mokasdar, A.; Zhou, H.; Hou, L. The impact of additive manufacturing in the aircraft spare parts supply chain: Supply chain operation reference model based analysis. Prod. Plan. Control 2014, 25, 1169–1181. [Google Scholar] [CrossRef]
- Khajavi, S.H.; Partanen, J.; Holmström, J. Additive manufacturing in the spare parts supply chain. Comput. Ind. 2014, 65, 50–63. [Google Scholar] [CrossRef]
- Janssen, G.R.; Blankers, I.J.; Moolenburgh, E.A.; Posthumus, A.L. The impact of 3D printing on supply chain management. In TNO White Papers; TNO: The Hague, The Netherlands, 2014; pp. 1–24. [Google Scholar]
- Vinodh, S.; Sundararaj, G.; Devadasan, S.R.; Kuttalingam, D.; Rajanayagam, D. Agility through rapid prototyping technology in a manufacturing environment using a 3D printer. J. Manuf. Technol. Manag. 2009, 20, 1023–1041. [Google Scholar] [CrossRef]
- Chiu, M.C.; Lin, Y.H. Simulation based method considering design for additive manufacturing and supply chain an empirical study of lamp industry. Ind. Manag. Data Syst. 2016, 116, 322–348. [Google Scholar] [CrossRef]
- Petrick, I.J.; Simpson, T.W. 3D printing disrupts manufacturing: How economies of one create new rules of competition. Res. Technol. Manag. 2013, 56, 12–16. [Google Scholar] [CrossRef]
- Walter, M.; Holmström, J.; Yrjöla, H. Rapid manufacturing and its impact on supply chain management. In Proceedings of the Logistics Research Network Annual Conference, Dublin, Ireland, 9–10 September 2004; pp. 1–12. [Google Scholar]
- Gunasekaran, A. Agile manufacturing: Enablers and an implementation framework. Int. J. Prod. Res. 1998, 36, 1223–1247. [Google Scholar] [CrossRef]
- Meredith, S.; Francis, D. Journey towards agility: The agile wheel explored. TQM Mag. 2000, 12, 137–143. [Google Scholar] [CrossRef]
- Yusuf, Y.Y.; Sarhadi, M.; Gunasekaran, A. Agile manufacturing: The drivers, concepts and attributes. Int. J. Prod. Econ. 1999, 62, 33–43. [Google Scholar] [CrossRef]
- Gardan, J. Additive manufacturing technologies: State of the art and trends. Int. J. Prod. Res. 2016, 54, 3118–3132. [Google Scholar] [CrossRef]
- Wu, P.; Wang, J.; Wang, X. A critical review of the use of 3D printing in the construction industry. Autom. Constr. 2016, 68, 21–31. [Google Scholar] [CrossRef]
- Perkins, I.; Skitmore, M. Three-dimensional printing in the construction industry: A review. Int. J. Constr. Manag. 2015, 15, 1–9. [Google Scholar] [CrossRef]
- Oettmeier, K.; Hofmann, E. Impact of additive manufacturing technology adoption on supply chain management processes and components. J. Manuf. Technol. Manag. 2016, 27, 944–968. [Google Scholar] [CrossRef]
- Wagner, S.M.; Walton, R.O. Additive manufacturing’s impact and future in the aviation industry. Prod. Plan. Control 2016, 27, 1124–1130. [Google Scholar] [CrossRef]
- Niaki, M.K.; Nonino, F. Additive manufacturing management: A review and future research agenda. Int. J. Prod. Res. 2017, 55, 1419–1439. [Google Scholar] [CrossRef]
- Niaki, M.K.; Nonino, F. Impact of additive manufacturing on business competitiveness: A multiple case study. J. Manuf. Technol. Manag. 2017, 28, 56–74. [Google Scholar] [CrossRef]
- Hasan, S.; Rennie, A.E.W. The application of rapid manufacturing technologies in the spare parts industry. In Proceedings of the 19th Annual International Solid Freeform Fabrication Symposium, Austin, TX, USA, 4–8 August 2008; pp. 584–590. [Google Scholar]
- Tuck, C.; Hague, R. The pivotal role of rapid manufacturing in the production of cost-effective customized products. Int. J. Mass Cust. 2006, 1, 360–373. [Google Scholar] [CrossRef]
- Tuck, C.; Hague, R.; Ruffo, M.; Ransley, M.; Adams, P. Rapid manufacturing facilitated customization. Int. J. Comput. Integr. Manuf. 2008, 21, 245–258. [Google Scholar] [CrossRef] [Green Version]
- Tuck, C.; Hague, R.; Burns, N. Rapid manufacturing: Impact on supply chain methodologies and practice. Int. J. Serv. Oper. Manag. 2007, 3, 1–22. [Google Scholar] [CrossRef]
- Huang, S.H.; Liu, P.; Mokasdar, A.; Hou, L. Additive manufacturing and its societal impact: A literature review. Int. J. Adv. Manuf. Technol. 2013, 67, 1191–1203. [Google Scholar] [CrossRef]
- Oettmeier, K.; Hofmann, E. Additive manufacturing technology adoption: An empirical analysis of general and supply chain-related determinants. J. Bus. Econ. 2016, 87, 97–124. [Google Scholar] [CrossRef]
- Terzi, S.; Cavalieri, S. Simulation in the supply chain context: A survey. Comput. Ind. 2004, 53, 3–16. [Google Scholar] [CrossRef]
- Persson, F.; Olhager, J. Performance simulation of supply chain designs. Int. J. Prod. Econ. 2002, 77, 231–245. [Google Scholar] [CrossRef]
- Truong, T.H.; Azadivar, F. Simulation based optimization for supply chain configuration design. In Proceedings of the Winter Simulation Conference, New Orleans, LA, USA, 7–10 December 2003; pp. 1268–1275. [Google Scholar]
- Reiner, G.; Trcka, M. Customized supply chain design: Problems and alternatives for a production company in the food industry: A simulation based analysis. Int. J. Prod. Econ. 2004, 89, 217–229. [Google Scholar] [CrossRef]
- Van der Vorst, J.G.; Beulens, A.J.; van Beek, P. Modelling and simulating multi-echelon food systems. Eur. J. Oper. Res. 2000, 122, 354–366. [Google Scholar] [CrossRef]
- Ding, H.; Benyoucef, L.; Xie, X. A simulation-based multi-objective genetic algorithm approach for networked enterprises optimization. Eng. Appl. Artif. Intell. 2006, 19, 609–623. [Google Scholar] [CrossRef]
- Kleijnen, J.P.C. Supply chain simulation tools and techniques: A survey. Int. J. Simul. Process Model. 2005, 1, 82–89. [Google Scholar] [CrossRef]
- Almeder, C.; Preusser, M.; Hartl, R.F. Simulation and optimization of supply chains: Alternative or complementary approaches? OR Spectr. 2009, 31, 95–119. [Google Scholar] [CrossRef]
- Kawa, A. Simulation of dynamic supply chain configuration based on software agents and graph theory. In Proceedings of the International Work-Conference on Artificial Neural Networks, Salamanca, Spain, 10–12 June 2009; Springer: Berlin/Heidelberg, Germany; pp. 346–349. [Google Scholar]
- Kawa, A.; Golinska, P. Supply chain arrangements in recovery network. In Agent and Multi-Agent Systems: Technologies and Applications. Lecture Notes in Computer Science; Jędrzejowicz, P., Nguyen, N.T., Howlet, R.J., Jain, L.C., Eds.; Springer: Berlin/Heidelberg, Germany, 2010; pp. 292–301. [Google Scholar]
- Jayant, A.; Gupta, P.; Garg, S.K. Simulation modelling and analysis of network design for closed-loop supply chain: A case study of battery industry. Procedia Eng. 2015, 97, 2213–2221. [Google Scholar] [CrossRef]
- Salem, R.W.; Haouari, M. A simulation-optimization approach for supply chain network design under supply and demand uncertainties. Int. J. Prod. Res. 2017, 55, 1845–1861. [Google Scholar] [CrossRef]
- Kelton, W.D.; Sadowski, R.; Zupick, N. Simulation with Arena, 5th ed.; McGraw-Hill Education: New York, NY, USA, 2009. [Google Scholar]
- Abd El-Aal, M.A.M.; El-Sharief, M.A.; El-Deen, A.E.; Nassr, A.B. Supply chain performance evaluation: A comprehensive evaluation system. Int. J. Bus. Perform. Supply Chain Model. 2011, 3, 141–166. [Google Scholar] [CrossRef]
- Holweg, M.; Hoberg, K.; Pil, F.K.; Heinen, J. Making 3D printing work for you: Defining business models for additive manufacturing. Eur. Bus. Rev. 2016, 4, 71–76. [Google Scholar]
Figure 1.
Traditional versus 3D printing supply chain [2].
Figure 1.
Traditional versus 3D printing supply chain [2].
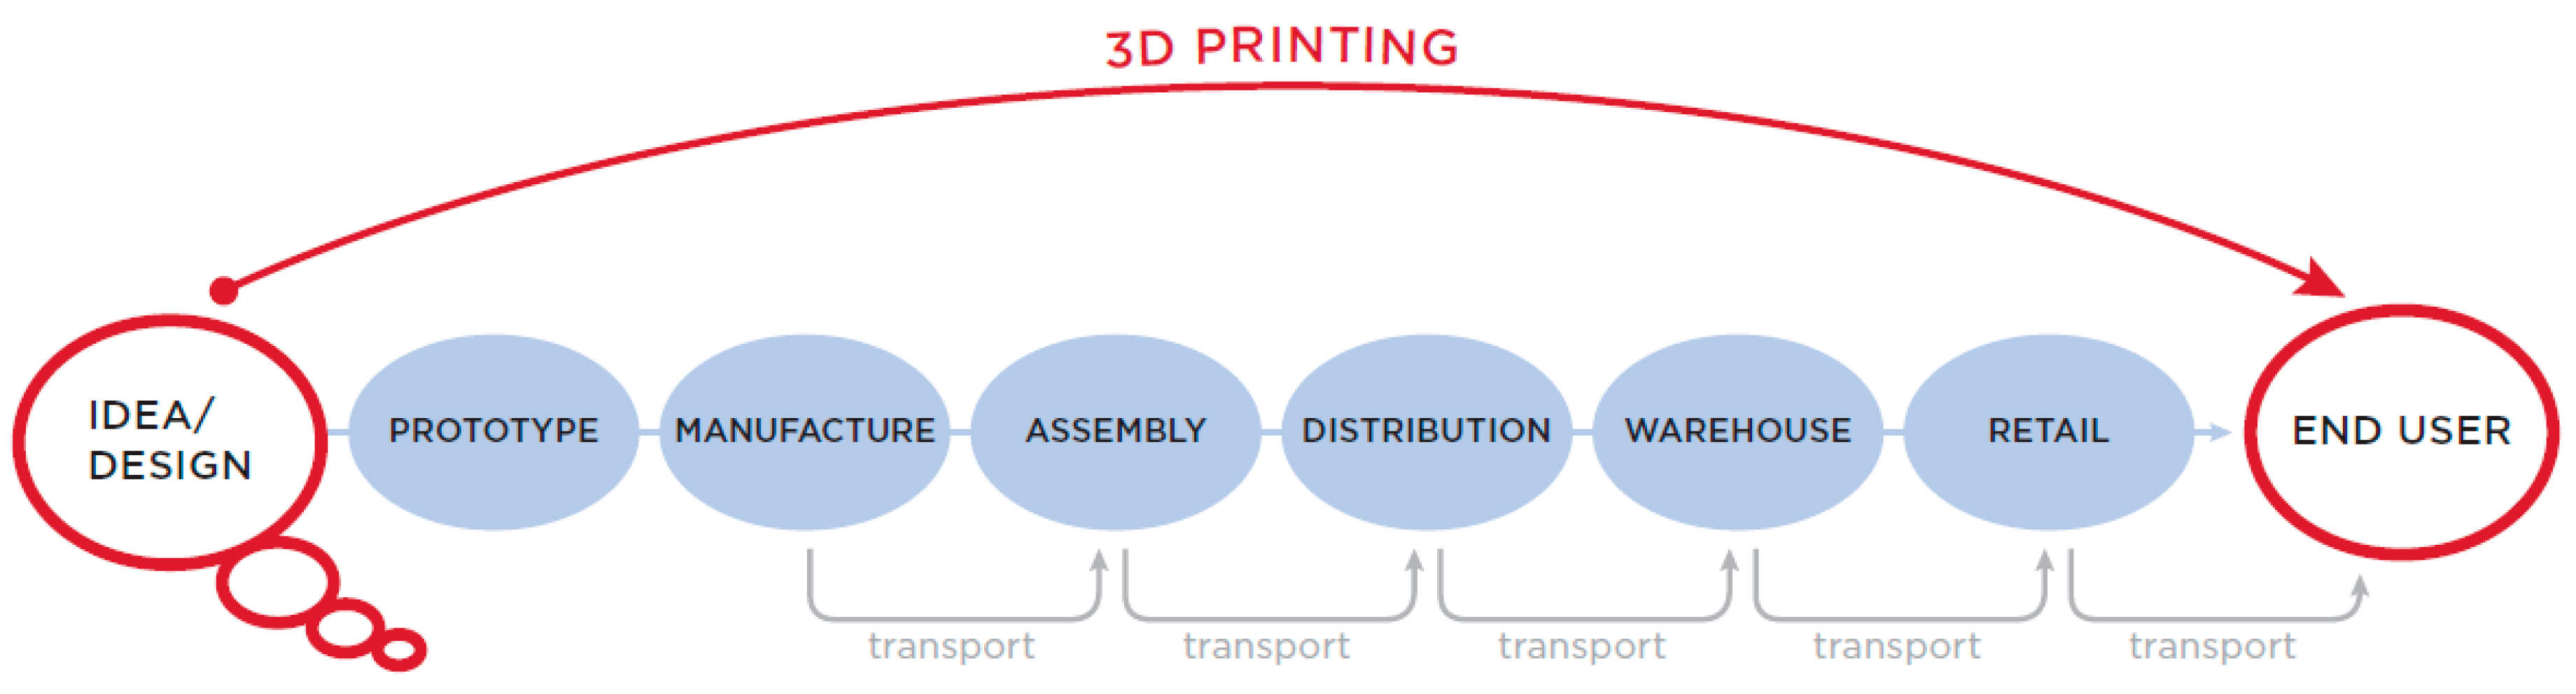
Figure 2.
Traditional (left-side) and 3D printing truck delivery (right-side) in Amazon.
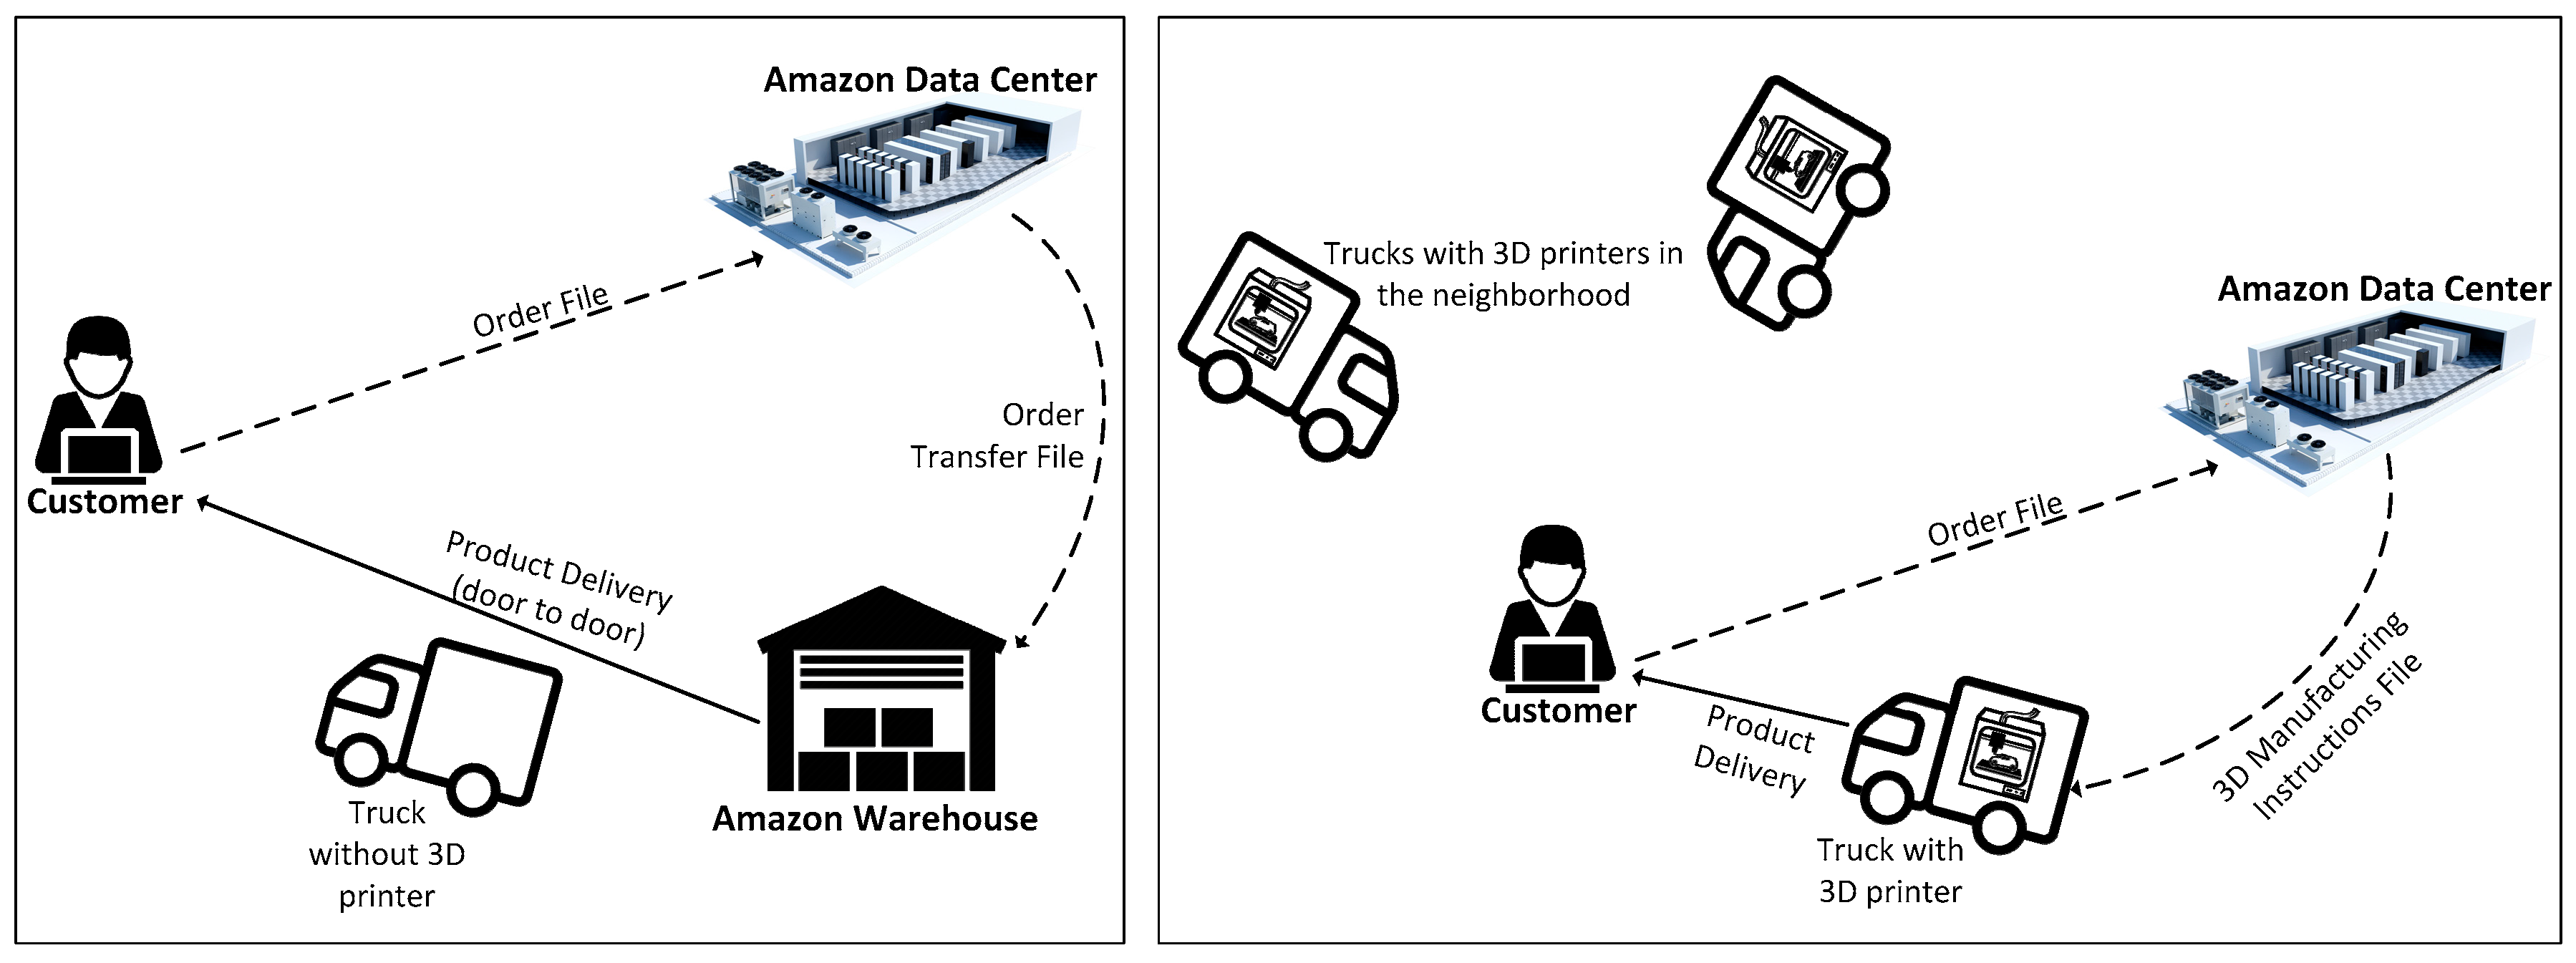
Figure 3.
Both supply chain networks for orthopedic insole.

Figure 4.
Orthopedic insoles manufactured by traditional method (a) and 3D printing (b).

Figure 5.
Traditional supply chain network for the orthopedic insole.

Figure 6.
Supply chain network with 3D printing for the orthopedic insole.

Figure 7.
Customer arrivals to the orthopedist.
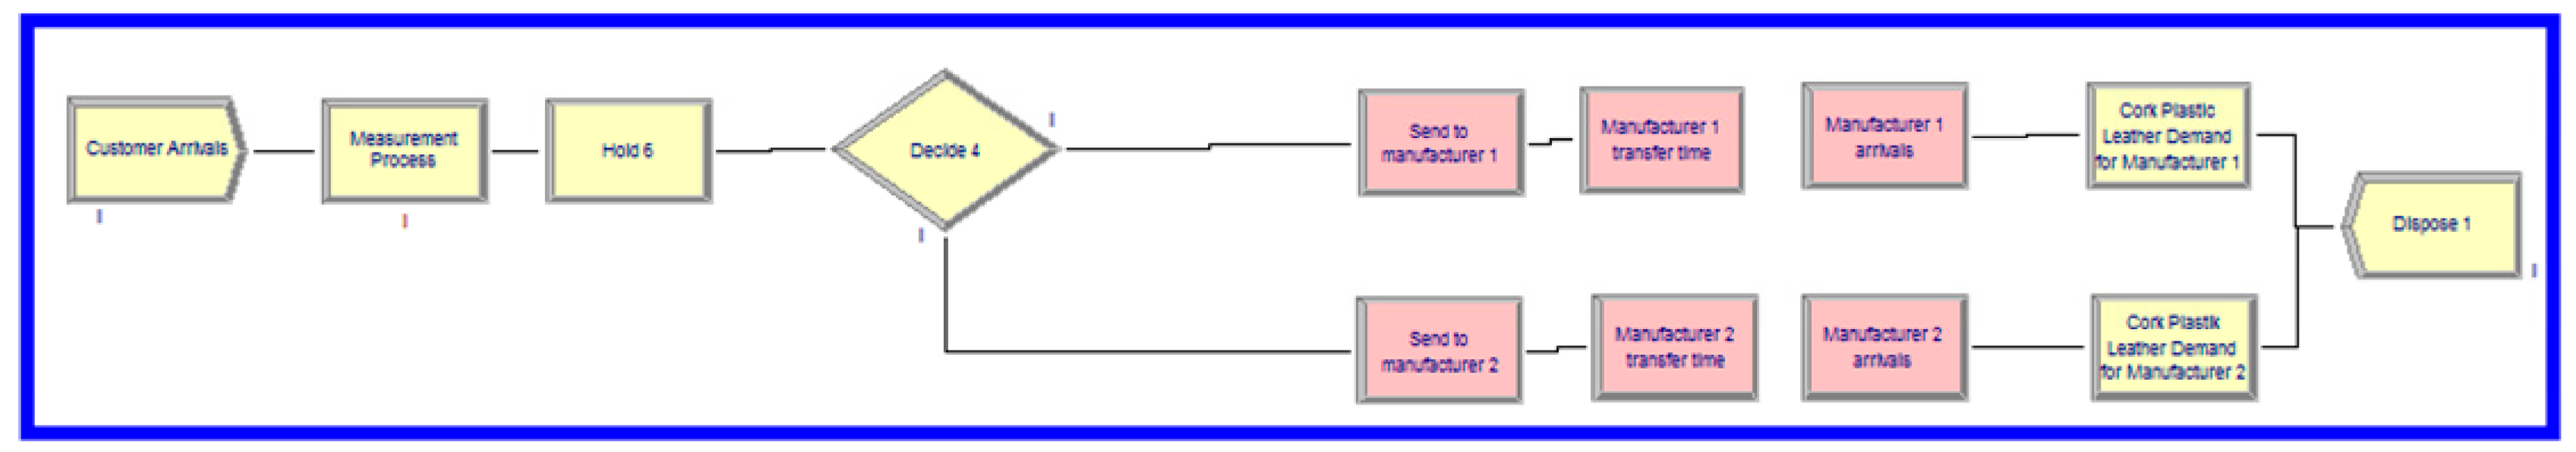
Figure 8.
Shipping cork, plastic and leather from suppliers to the two manufacturers.
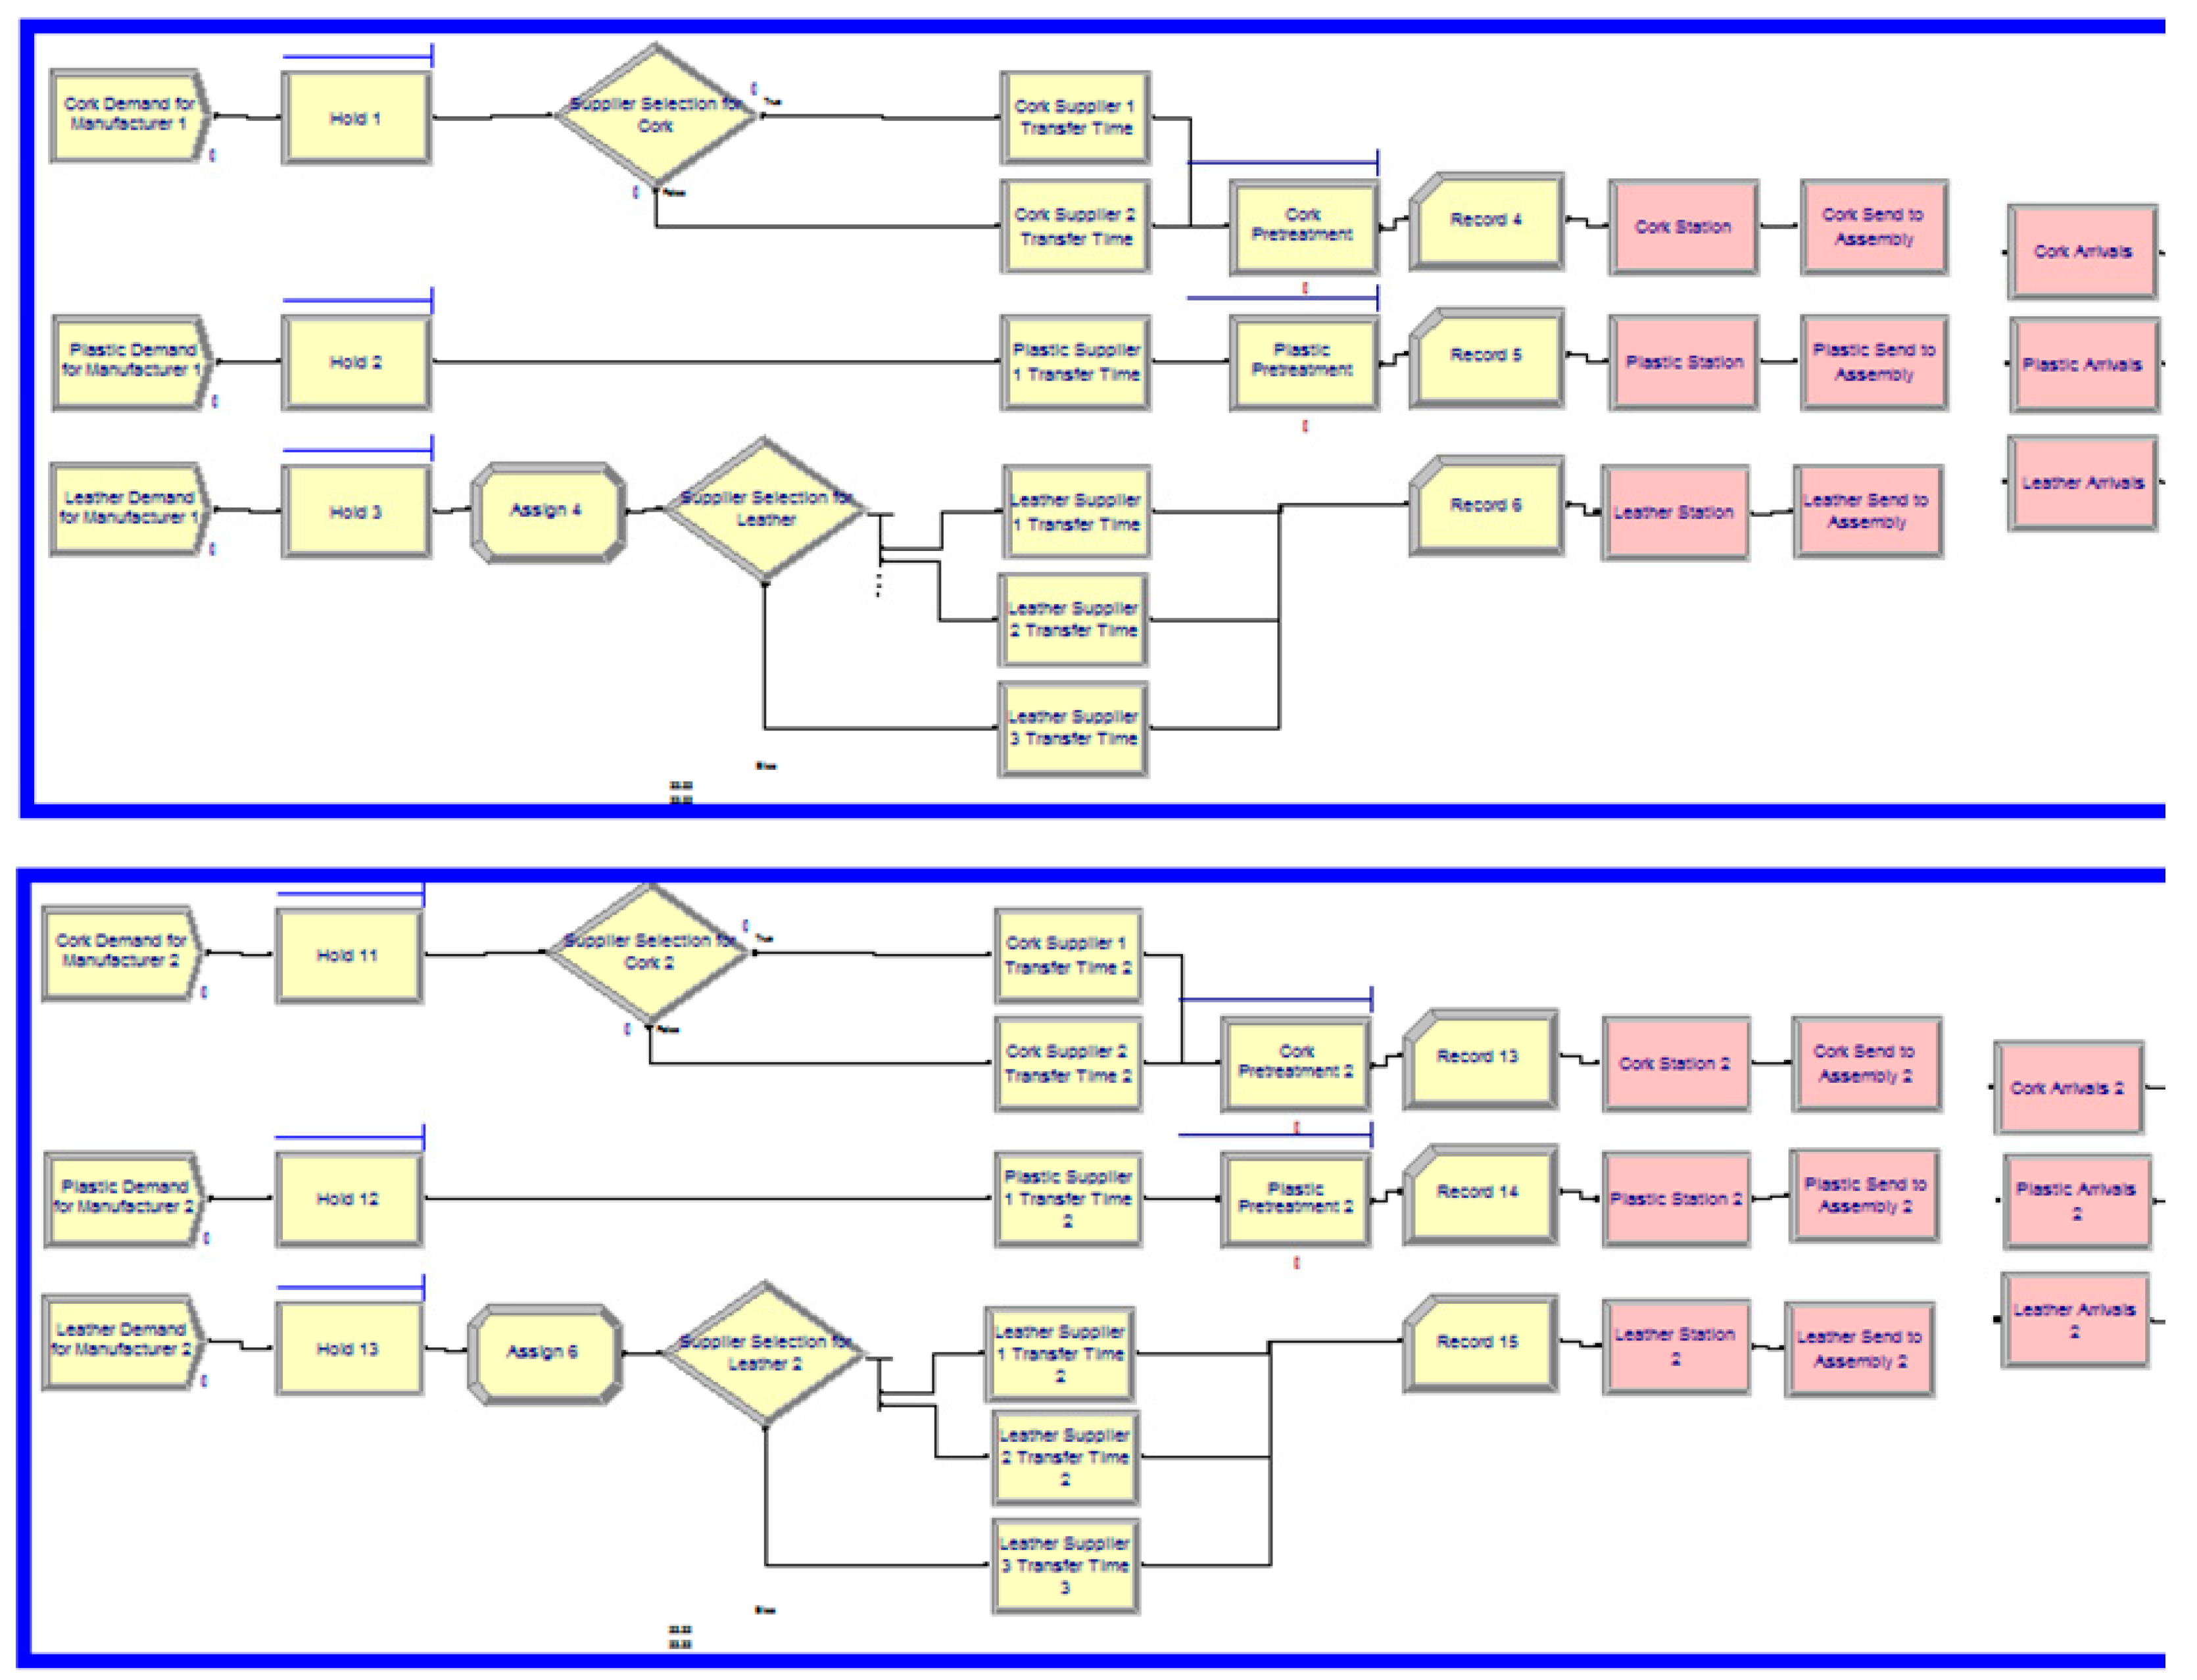
Figure 9.
Assembling of cork, plastic and leather in manufacturers.

Figure 10.
First testing of insole and adjustments in the office of orthopedist.
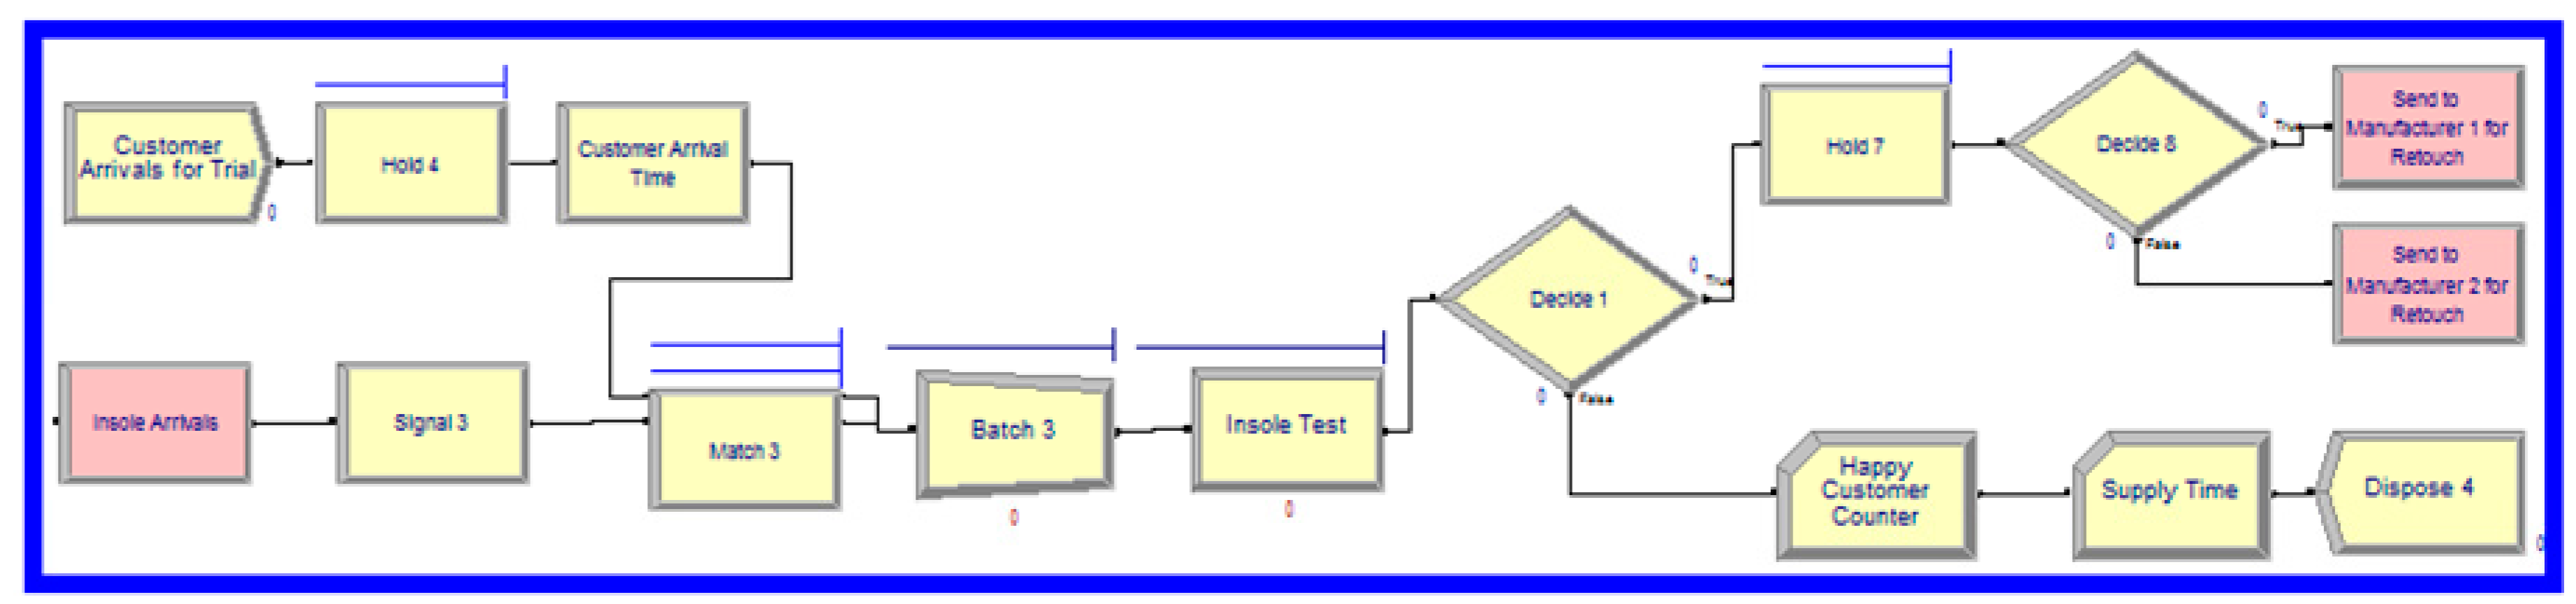
Figure 11.
Re-manufacturing operations in the manufacturers if necessary.

Figure 12.
Second testing of insole in the office of orthopedist.

Figure 13.
Customer arrivals to the orthopedist.
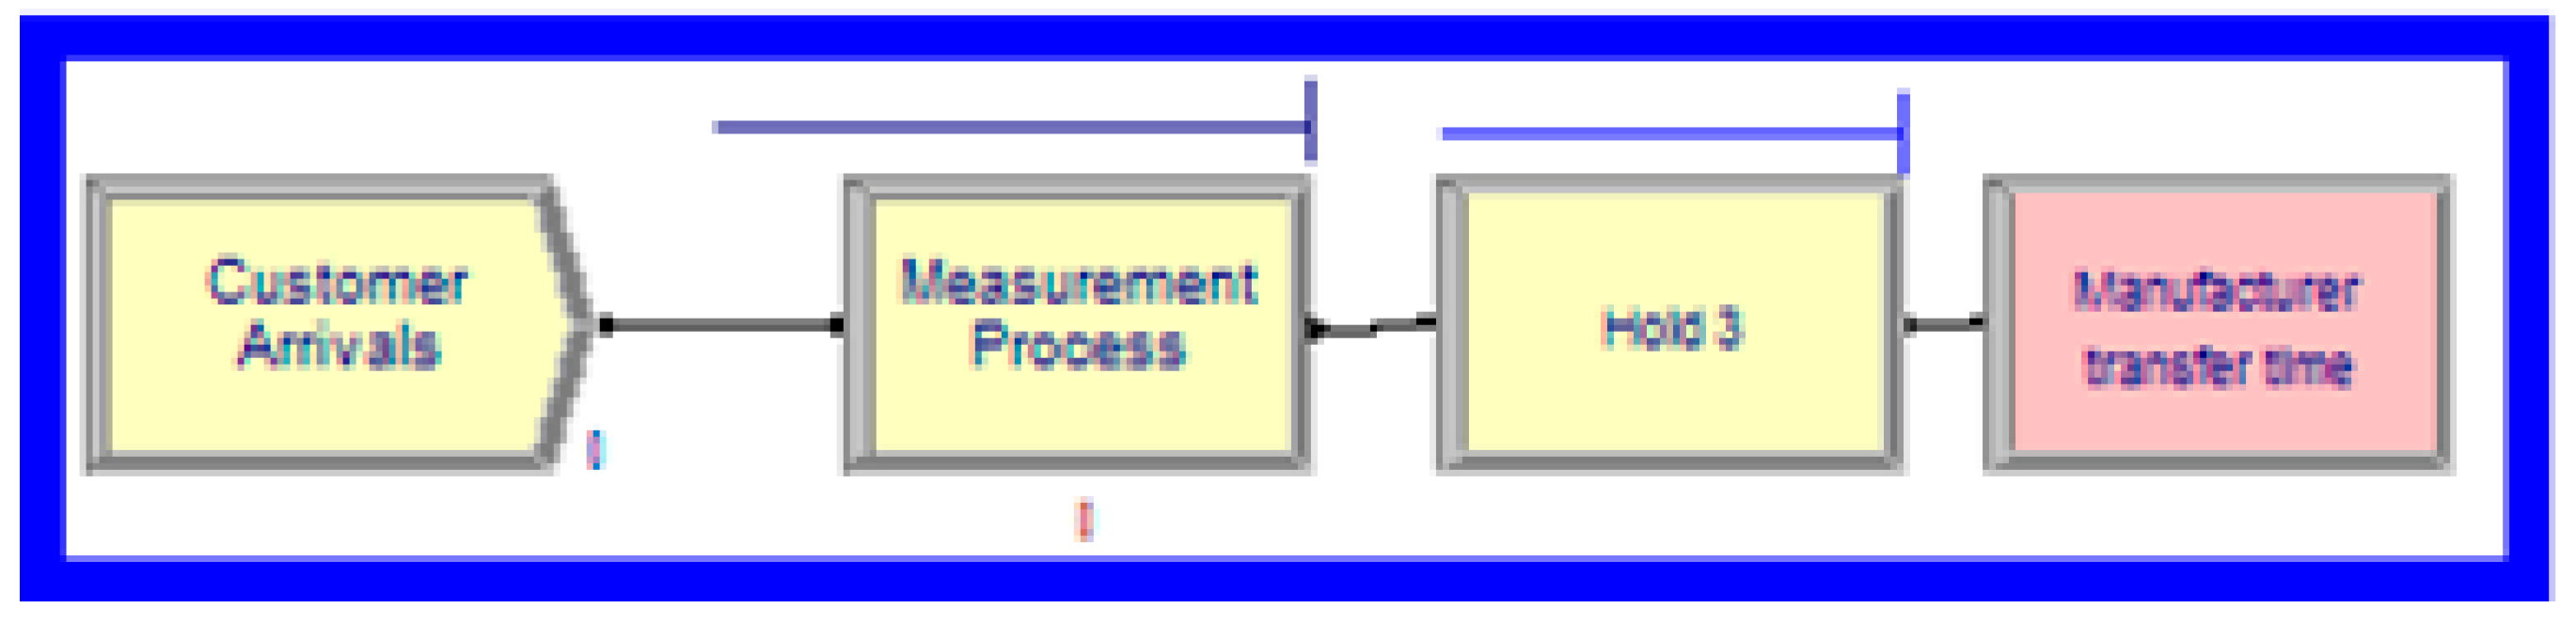
Figure 14.
Supplying filament and producing insoles with 3D printer.
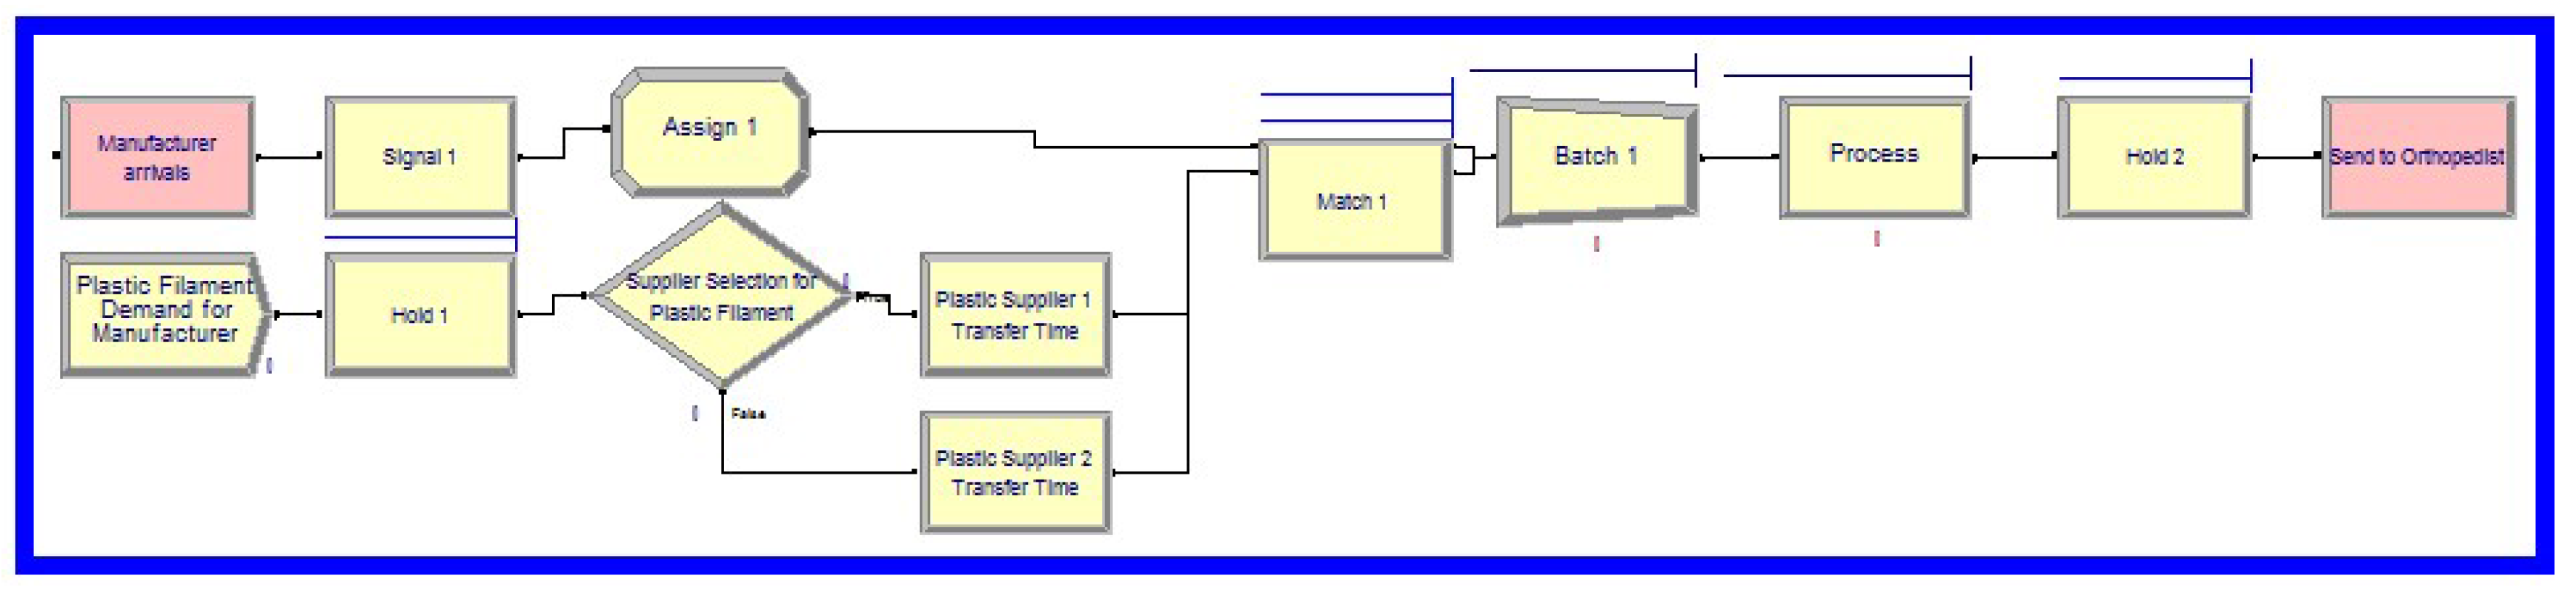
Figure 15.
Arrival of customers and testing of insole in the office of orthopedist.

Figure 16.
Plot of daily average entity output to identify the warm-up period.

Figure 17.
Comparison of two simulation models in terms of lead time and number of customers.
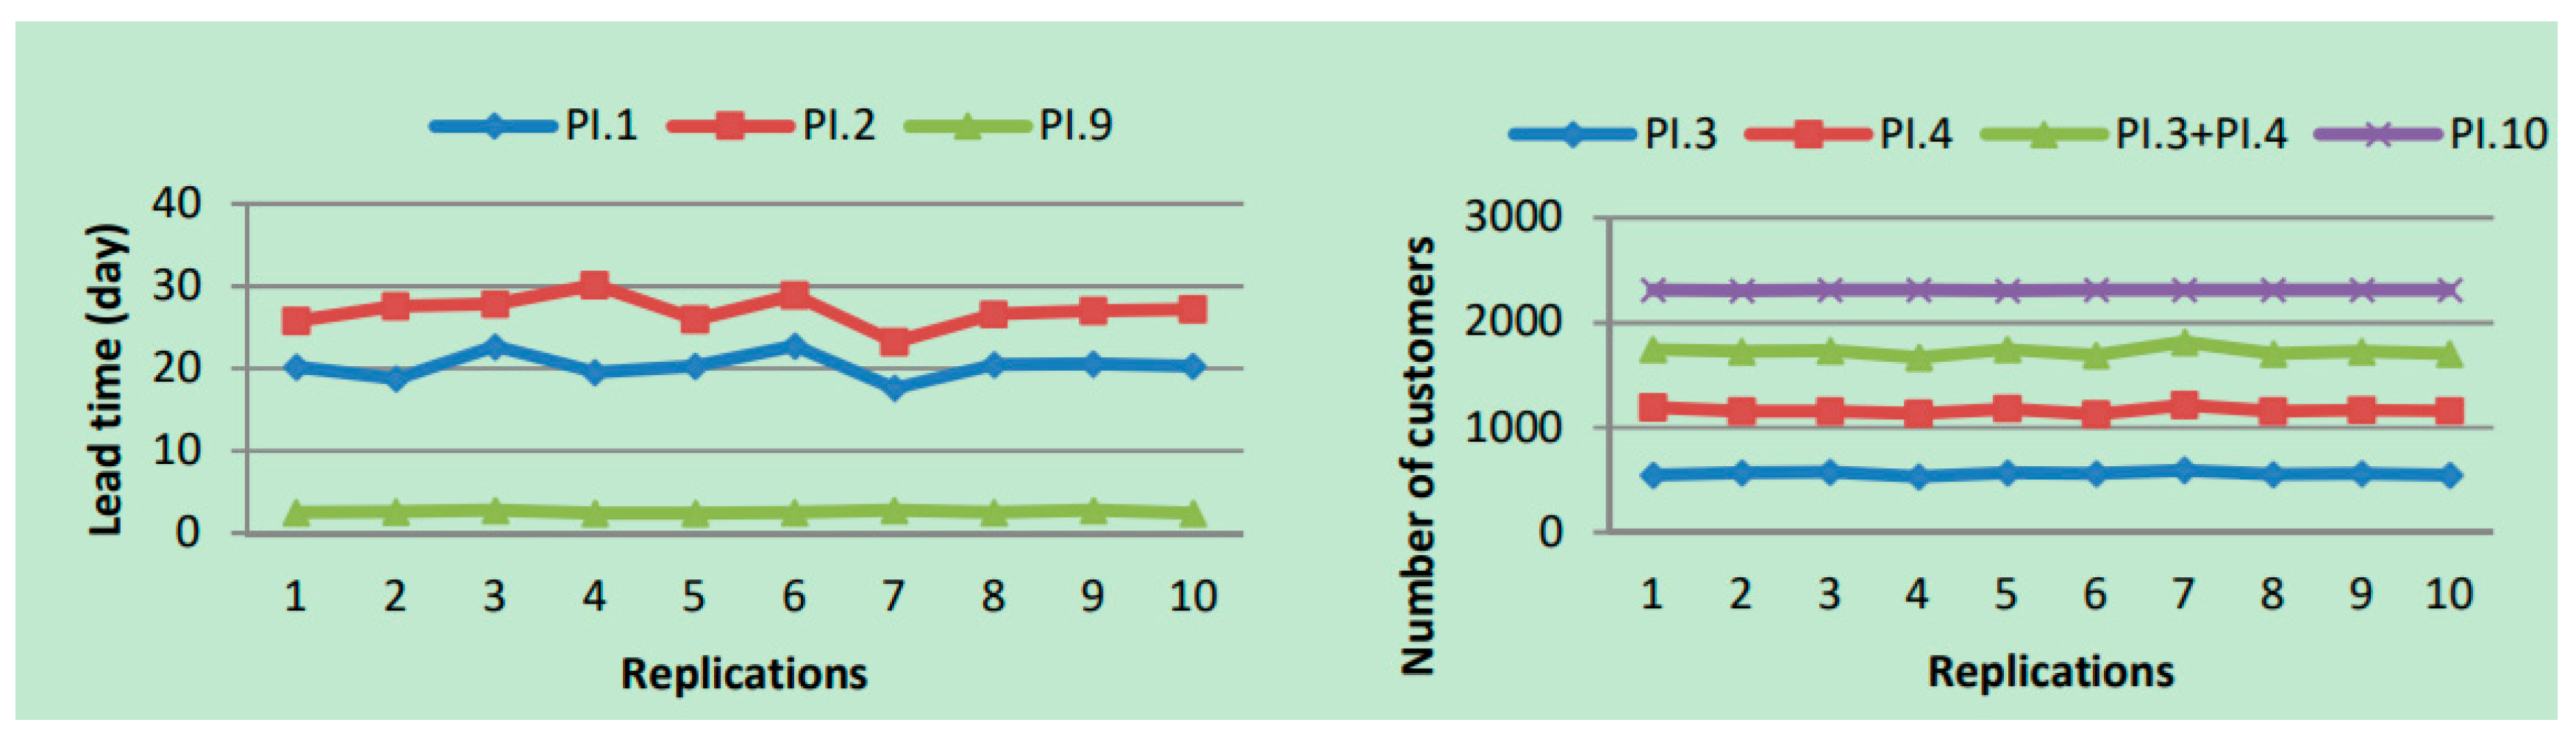
Figure 18.
Comparison of two simulation models in terms of manufacturing time and waste.

Figure 19.
Effects of different acceptance rates on lead time and number of customers.

Figure 20.
Effects of number of doctors on lead time.

Table 1.
Parameters used in TSCN simulation model.
| Definition | Parameter Value |
|---|---|
| Arrivals of customers to the orthopedist to give an order and also receive the insole | TRIA (50, 60, 70) min |
| Taking a plaster cast from the customer’s foot (per foot) | TRIA (5, 6, 7) min |
| Transportation time from orthopedist to manufacturer#1 (vice versa) | UNIF (7.5, 8.5) h |
| Transportation time from orthopedist to manufacturer#2 (vice versa) | UNIF (5.5, 6.5) h |
| Transportation time from cork supplier#1 to manufacturer#1 | UNIF (1.5, 2.0) h |
| Transportation time from cork supplier#2 to manufacturer#1 | UNIF (3.5, 3.9) h |
| Transportation time from cork supplier#1 to manufacturer#2 | UNIF (3.2, 3.8) h |
| Transportation time from cork supplier#2 to manufacturer#2 | UNIF (4.5, 4.9) h |
| Pre-processing operation time of cork | TRIA (45, 50, 55) min |
| Rate of waste in pre-processing of cork | UNIF (0.025, 0.030) |
| Waiting time of cork, plastic and leather for assembly operation | UNIF (10, 15) min |
| Transportation time from plastic supplier to manufacturer#1 | UNIF (3.9, 4.1) h |
| Transportation time from plastic supplier to manufacturer#2 | UNIF (4.6, 5.0) h |
| Pre-processing operation time of plastic | TRIA (25, 30, 35) min |
| Rate of waste in pre-processing of plastic | UNIF (0.025, 0.030) |
| Transportation time from leather supplier#1 to manufacturer#1 | UNIF (1.1, 1.5) h |
| Transportation time from leather supplier#2 to manufacturer#1 | UNIF (0.35, 0.55) h |
| Transportation time from leather supplier#3 to manufacturer#1 | UNIF (7.0, 7.8) h |
| Transportation time from leather supplier#1 to manufacturer#2 | UNIF (2.8, 3.2) h |
| Transportation time from leather supplier#2 to manufacturer#2 | UNIF (2.1, 2.5) h |
| Transportation time from leather supplier#3 to manufacturer#2 | UNIF (5.4, 5.8) h |
| Required time to assemble of plastic, cork and leather (per foot) | TRIA (20, 30, 40) min |
| Rate of waste in assembling of plastic, cork and leather | UNIF (0.03, 0.04) |
| Required time to test the insole (for a pair) | TRIA (7, 8, 9) min |
| Required time to adjust the tested insole (per foot) | TRIA (20, 30, 40) min |
Table 2.
Parameters used in 3DPSCN simulation model.
| Definition | Parameter Value |
|---|---|
| Arrivals of customers to the orthopedist to give an order and also receive the insole | TRIA (50, 60, 70) min |
| Scanning of customer’s foot in orthopedist (per foot) | UNIF (3, 4) min |
| Required time to send the scanning files from orthopedist to manufacturer | UNIF (1, 2) min |
| Transportation time from filament supplier#1 to manufacturer | UNIF (8.5, 8.9) h |
| Transportation time from filament supplier#2 to manufacturer | UNIF (8.3, 8.7) h |
| Printing the insole in 3D printer (per foot) | TRIA (55, 60, 65) min |
| Transportation time from manufacturer to orthopedist | UNIF (10, 12) min |
| Required time to test the insole (for a pair) | TRIA (7, 8, 9) min |
Table 3.
Performance indicators of the simulation models.
| Performance Indicator (PI) | Entity | Explanation |
|---|---|---|
| PI.1 | Day | Lead time of customers who get insole on the first try in TSCN |
| PI.2 | Day | Lead time of customers who get insole on the second try in TSCN |
| PI.3 | People | Number of customers who get insole on the first try in TSCN |
| PI.4 | People | Number of customers who get insole on the second try in TSCN |
| PI.5 | Unit | Amount of cork waste in TSCN |
| PI.6 | Unit | Amount of plastic waste in TSCN |
| PI.7 | Unit | Amount of waste occurred in manufacturing in TSCN |
| PI.8 | Day | Total manufacturing and pre-processing time in TSCN |
| PI.9 | Day | Lead time of customers who get insole in 3DPSCN |
| PI.10 | People | Number of customers who get insole in 3DPSCN |
| PI.11 | Day | Total manufacturing time in 3DPSCN |
Table 4.
Statistical results of each performance indicator.
| PI | Average | Standard Deviation | Half-Width | Minimum | Maximum |
|---|---|---|---|---|---|
| PI.1 | 20.32 | 1.56 | 1.17 | 17.63 | 22.81 |
| PI.2 | 27.03 | 1.88 | 1.12 | 23.18 | 30.14 |
| PI.3 | 560 | 17.18 | 12.29 | 533 | 596 |
| PI.4 | 1164 | 28.02 | 20.04 | 1128 | 1219 |
| PI.5 | 57.00 | 3.12 | 2.24 | 51.61 | 61.08 |
| PI.6 | 56.00 | 3.10 | 2.23 | 51.97 | 60.61 |
| PI.7 | 65.00 | 5.59 | 4.22 | 55.53 | 75.56 |
| PI.8 | 20.72 | 1.59 | 1.14 | 17.10 | 22.77 |
| PI.9 | 2.55 | 0.14 | 0.10 | 2.39 | 2.76 |
| PI.10 | 2308 | 1.68 | 1.21 | 2306 | 2311 |
| PI.11 | 2.36 | 0.14 | 0.10 | 2.19 | 2.56 |
Table 5.
Average, minimum and maximum values of Scenario A.
| PI | Average | Minimum | Maximum |
|---|---|---|---|
| PI.1 | 2.44 | 2.02 | 5.34 |
| PI.2 | 5.32 | 4.01 | 9.26 |
| PI.3 | 692 | 675 | 719 |
| PI.4 | 1595 | 1566 | 1620 |
| PI.5 | 62.00 | 59.00 | 67.00 |
| PI.6 | 64.00 | 58.00 | 70.00 |
| PI.7 | 81.00 | 72.00 | 90.00 |
| PI.8 | 2.01 | 1.89 | 3.10 |
| PI.9 | 2.19 | 2.12 | 2.29 |
| PI.10 | 2315 | 2310 | 2322 |
| PI.11 | 2.00 | 1.99 | 2.01 |
Table 6.
Statistical results of each performance indicator when customers exponentially arrive.
| PI | Average | Standard Deviation | Half-Width | Minimum | Maximum |
|---|---|---|---|---|---|
| PI.1 | 11.66 | 0.87 | 0.91 | 1.11 | 59.57 |
| PI.2 | 14.53 | 1.05 | 0.58 | 2.19 | 80.56 |
| PI.3 | 565 | 17.23 | 18 | 540 | 611 |
| PI.4 | 1186 | 28.09 | 19 | 1157 | 1205 |
| PI.5 | 57.40 | 3.15 | 2.17 | 52.38 | 61.35 |
| PI.6 | 56.71 | 3.08 | 2.19 | 52.75 | 61.41 |
| PI.7 | 66.00 | 5.65 | 4.29 | 59.28 | 74.97 |
| PI.8 | 11.25 | 0.68 | 0.58 | 1.04 | 59.93 |
| PI.9 | 1.49 | 0.08 | 0.09 | 1.15 | 2.31 |
| PI.10 | 2307 | 1.64 | 2 | 2303 | 2311 |
| PI.11 | 1.39 | 0.06 | 0.09 | 1.08 | 2.16 |
Table 7.
Statistical results of each performance indicator when the breakdowns are allowed.
| PI | Average | Standard Deviation | Half-Width | Minimum | Maximum |
|---|---|---|---|---|---|
| PI.1 | 12.19 | 0.95 | 0.55 | 1.11 | 61.66 |
| PI.2 | 15.10 | 1.12 | 0.46 | 2.18 | 82.72 |
| PI.3 | 550 | 16.21 | 15.72 | 523 | 588 |
| PI.4 | 1153 | 27.16 | 15 | 1125 | 1187 |
| PI.5 | 57.10 | 3.11 | 2.62 | 51.03 | 62.46 |
| PI.6 | 57.25 | 3.44 | 1.69 | 53.57 | 60.46 |
| PI.7 | 63.42 | 4.95 | 4.15 | 56.05 | 71.35 |
| PI.8 | 11.94 | 0.83 | 0.42 | 1.04 | 61.58 |
| PI.9 | 1.44 | 0.07 | 0.11 | 1.15 | 2.85 |
| PI.10 | 2300 | 1.63 | 2.43 | 2295 | 2306 |
| PI.11 | 1.34 | 0.06 | 0.11 | 1.08 | 2.70 |
© 2017 by the authors. Licensee MDPI, Basel, Switzerland. This article is an open access article distributed under the terms and conditions of the Creative Commons Attribution (CC BY) license (http://creativecommons.org/licenses/by/4.0/).
Share and Cite
MDPI and ACS Style
Özceylan, E.; Çetinkaya, C.; Demirel, N.; Sabırlıoğlu, O. Impacts of Additive Manufacturing on Supply Chain Flow: A Simulation Approach in Healthcare Industry. Logistics 2018, 2, 1. https://doi.org/10.3390/logistics2010001
AMA Style
Özceylan E, Çetinkaya C, Demirel N, Sabırlıoğlu O. Impacts of Additive Manufacturing on Supply Chain Flow: A Simulation Approach in Healthcare Industry. Logistics. 2018; 2(1):1. https://doi.org/10.3390/logistics2010001
Chicago/Turabian StyleÖzceylan, Eren, Cihan Çetinkaya, Neslihan Demirel, and Ozan Sabırlıoğlu. 2018. "Impacts of Additive Manufacturing on Supply Chain Flow: A Simulation Approach in Healthcare Industry" Logistics 2, no. 1: 1. https://doi.org/10.3390/logistics2010001