Effects of Supply Chain Design and Collaboration on Customers’ Satisfaction of Instant Noodles in Ekiti State, Nigeria


Abstract
1. Introduction
2. Literature Review
2.1. Conceptual Clarifications
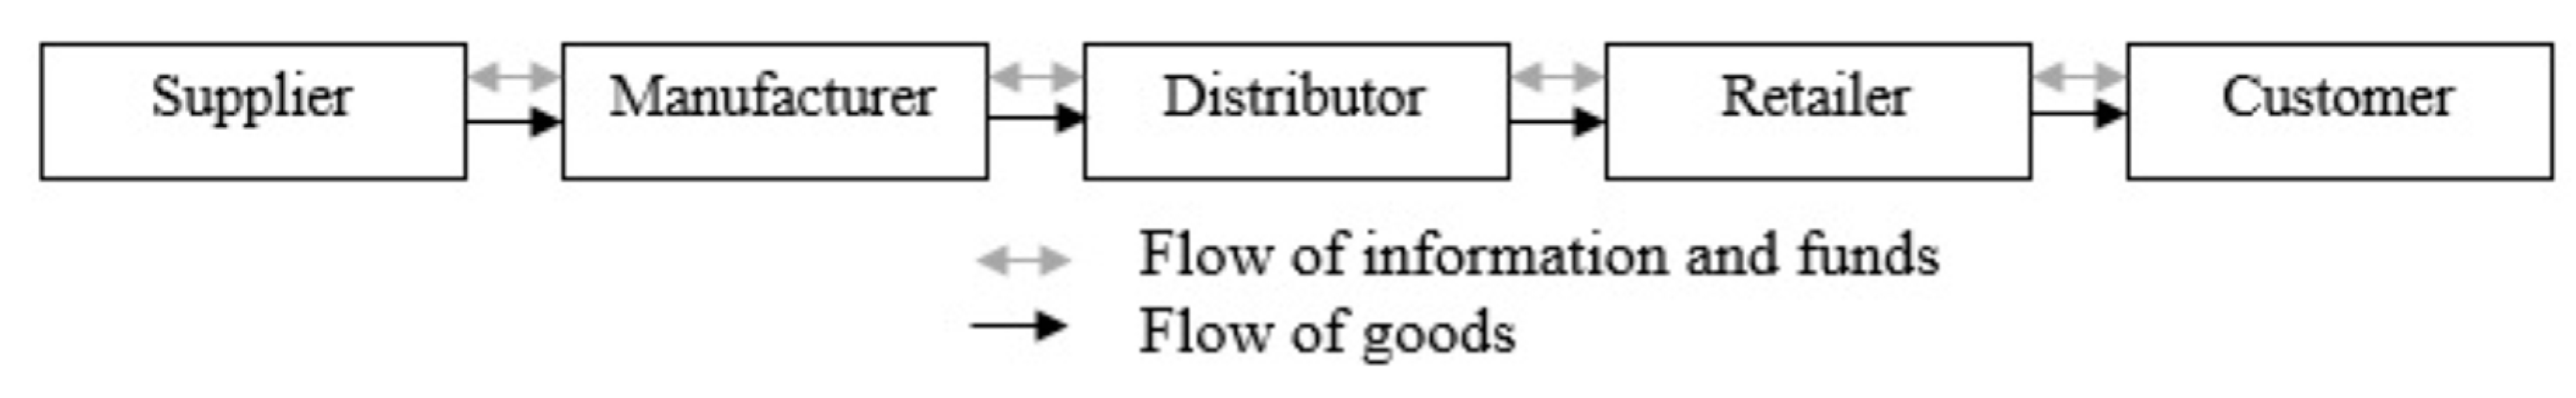
2.1.1. Supply Chain Management
2.1.2. Supply Chain Design
2.1.3. Collaboration
2.1.4. Customer Satisfaction
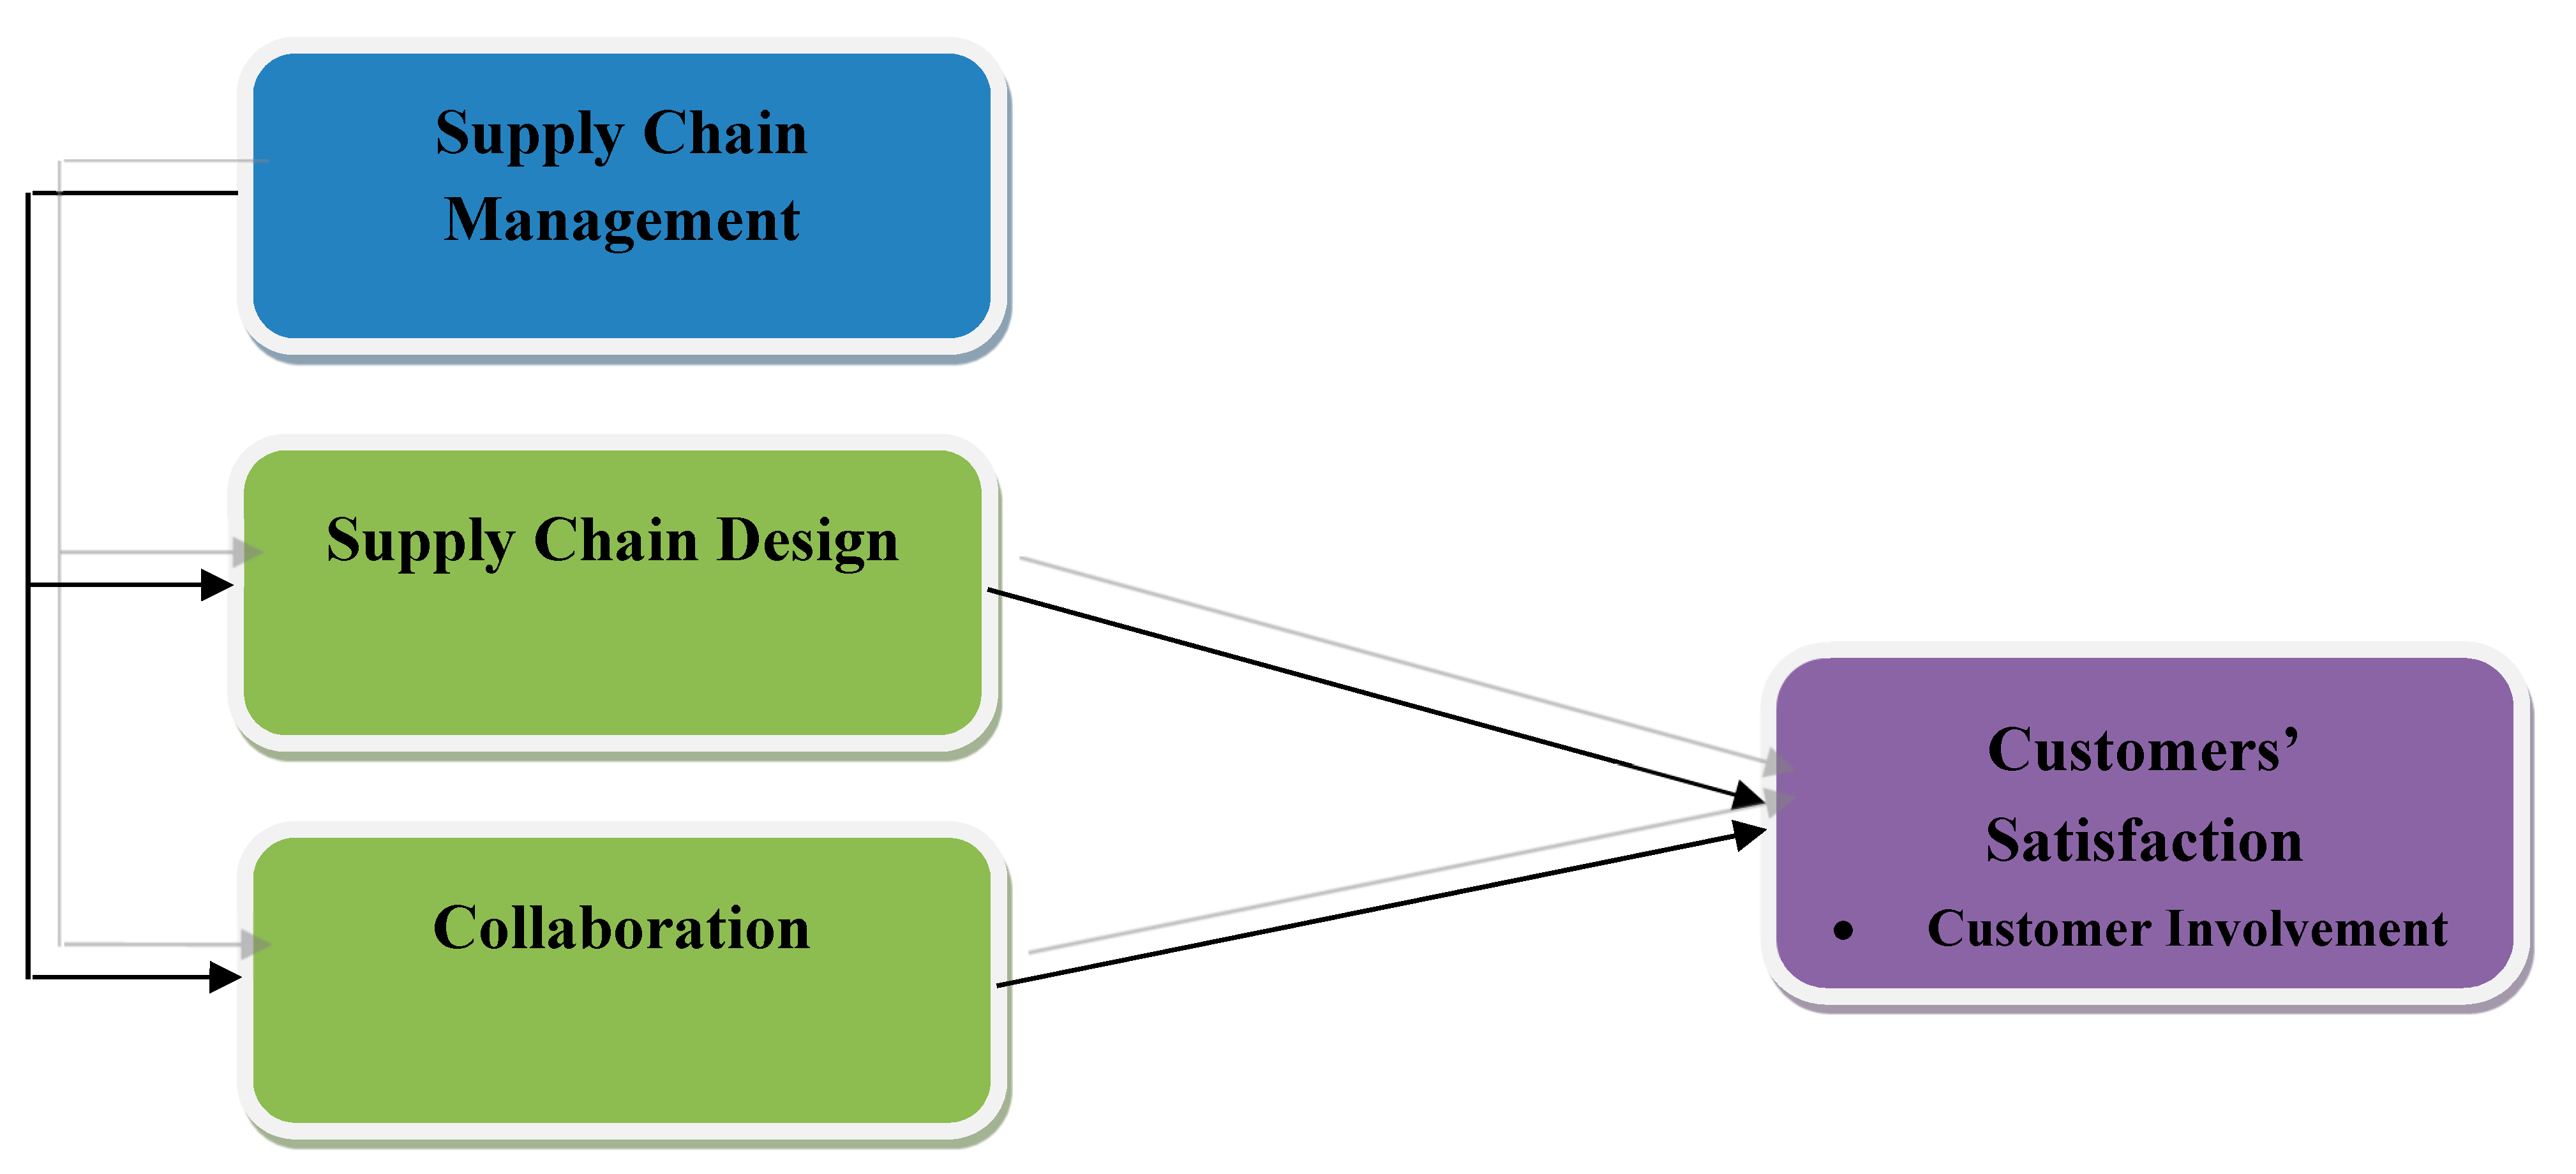
2.2. Conceptual Framework
3. Methodology
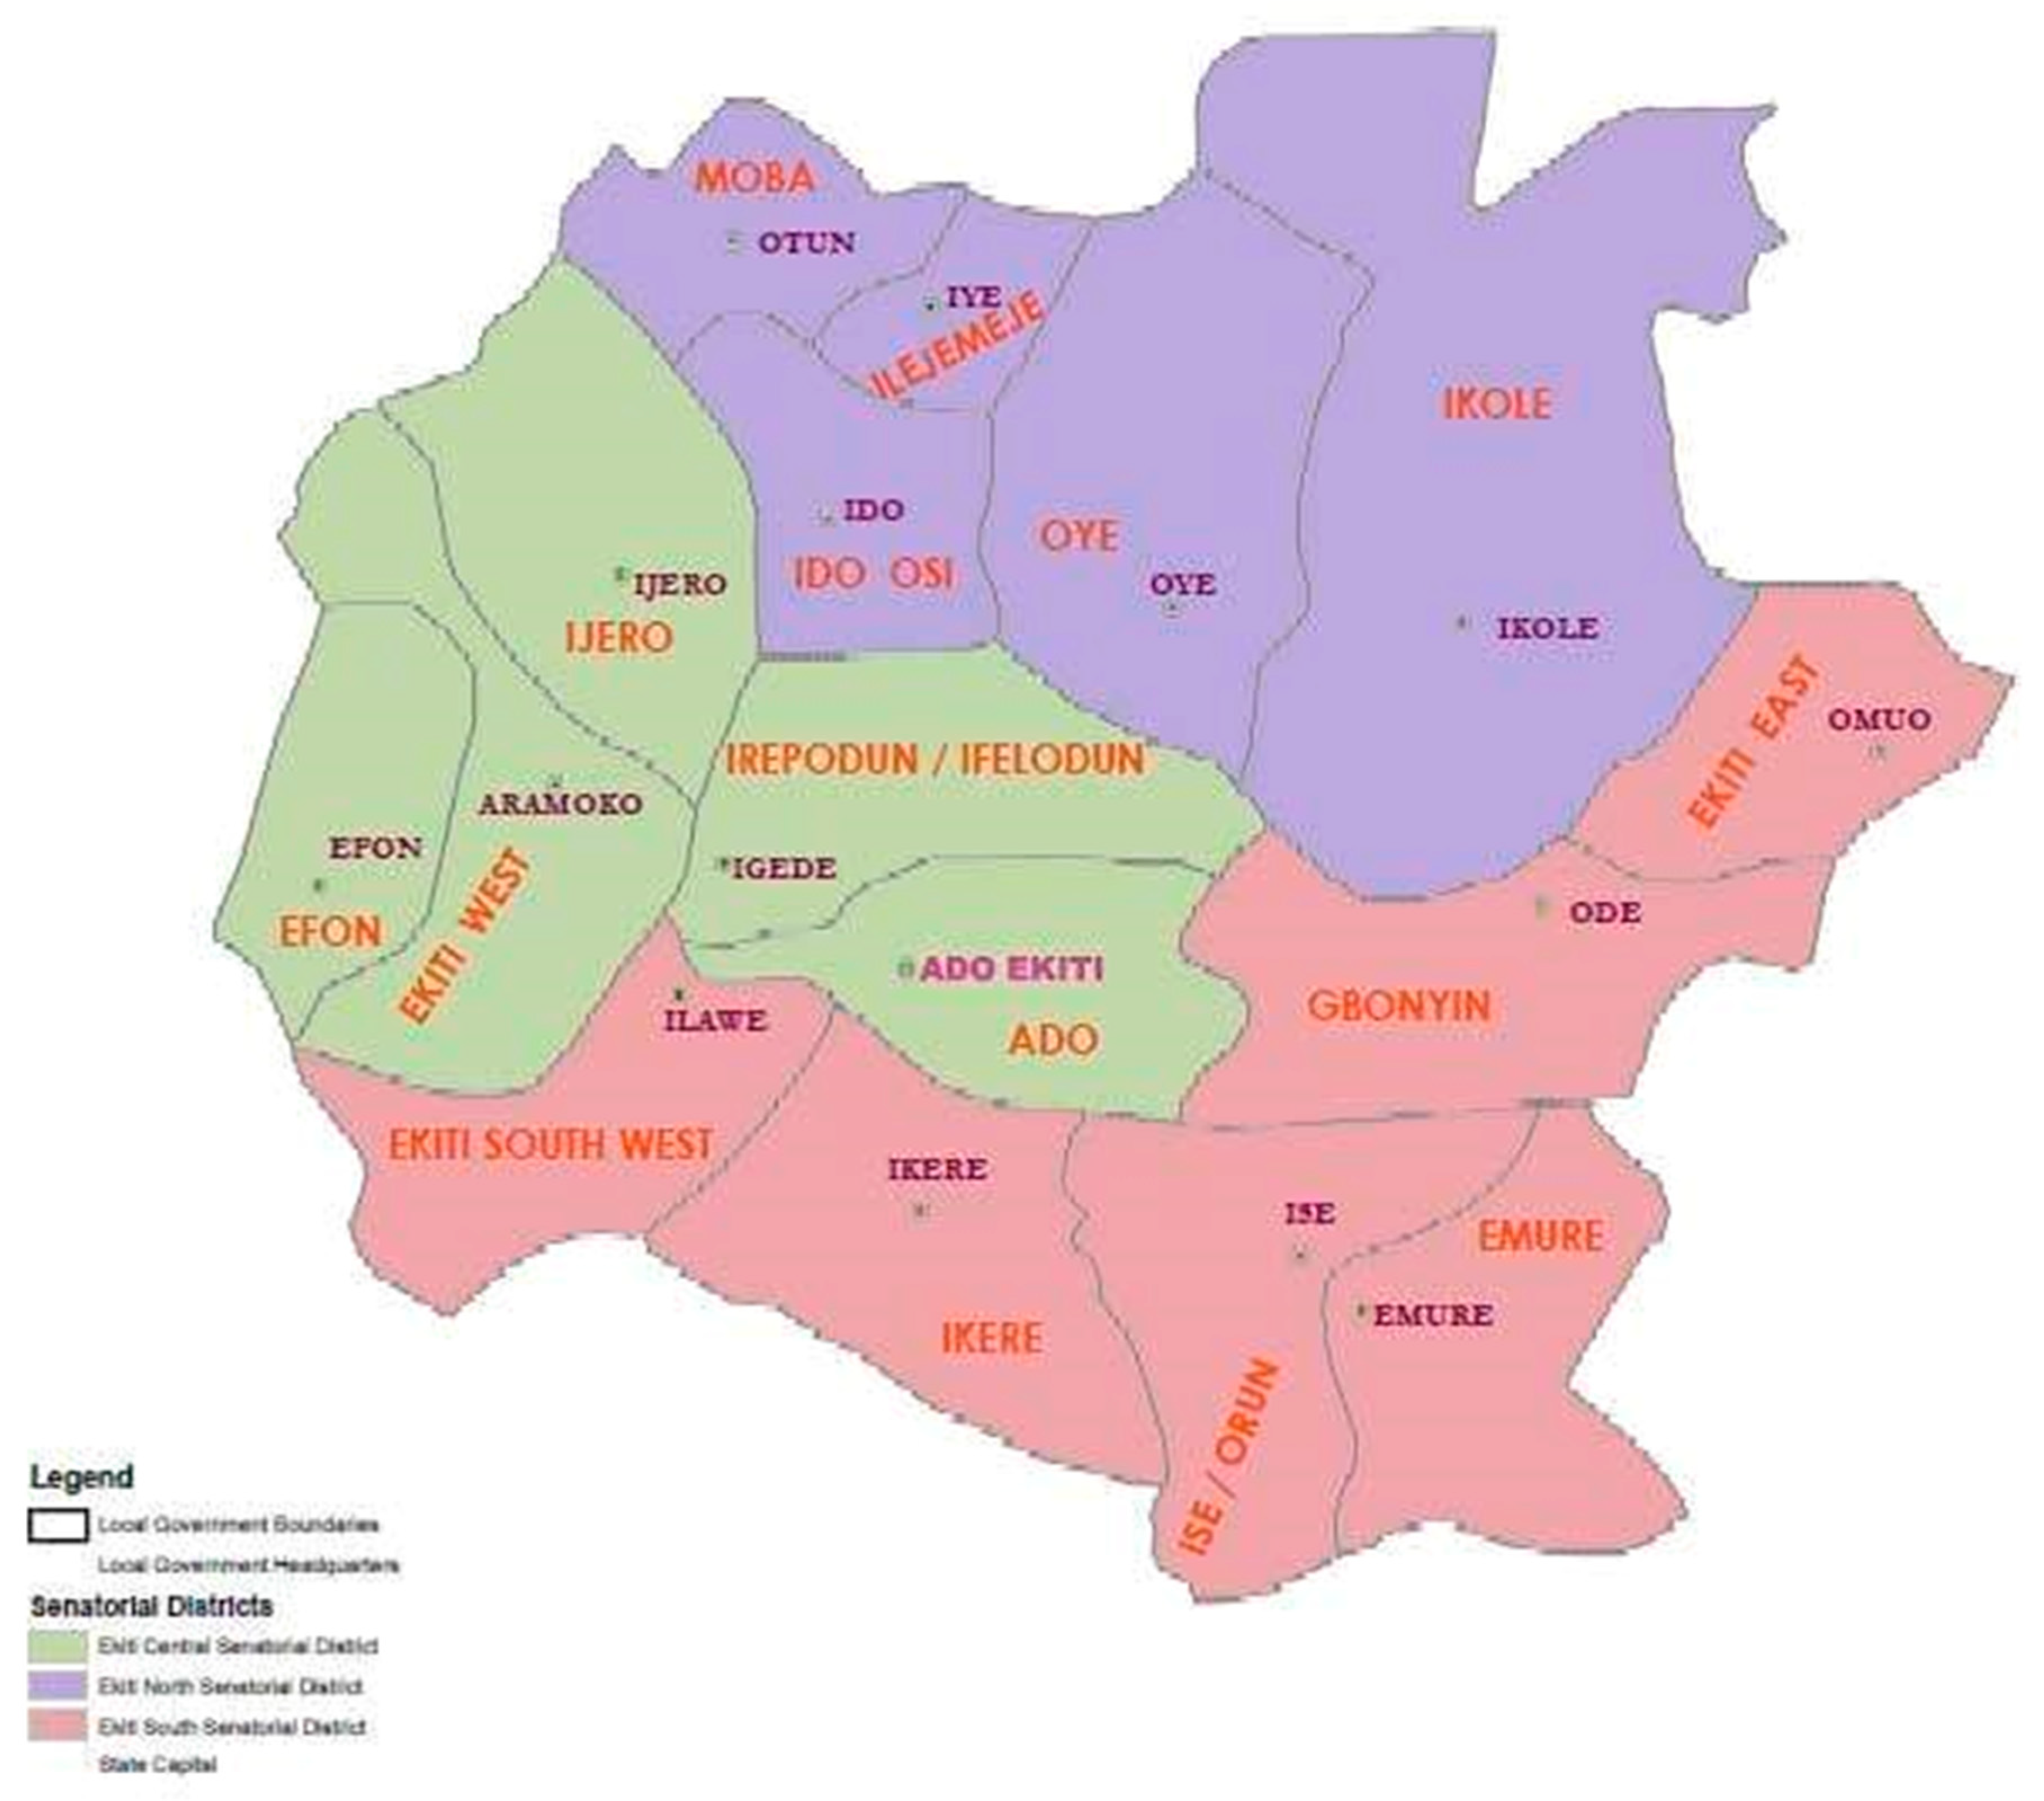
3.1. Study Area
3.2. Research Design
3.3. Reliability and Validity of Questionnaire
3.4. Data Collection and Sampling Technique
3.5. Distribution of Questionnaire
4. Results and Discussion
4.1. Testing of Hypotheses
- CS = customers’ satisfaction
- SCD = supply chain design
- COL = collaboration
- Y = the dependent variable;
- X = independent variable
- β0,β1,β2,β3, βn = Intercepts
- e is the error term.
4.1.1. Regression Analysis of Supply Chain Design and Customers’ Satisfaction
4.1.2. Regression Analysis of Collaboration and Customers’ Satisfaction
4.2. Discussions and Managerial Implications
4.2.1. Role of Supply Chain Design
4.2.2. Role of Collaboration
5. Conclusions and Recommendations
5.1. Conclusion
5.2. Recommendations
- (i)
- Having observed from the research findings that collaboration among supply chain players yielded greater influence on customers’ satisfaction than the supply chain design, it is recommended that supply chain decision makers pay more attention to policies that will enhance both vertical and horizontal integration with the organisation and among the supply chain partners in order to seamlessly harmonise production and distribution processes.
- (ii)
- Also, based on the finding that supply chain design is an important predictor of customers’ satisfaction in the noodles industry, management of organisations should pay critical attention to the structure of their distribution networks and ensure flexibility in the delivery process with less bottleneck in the relationship between the partners in order to get timely and accurate information of the chain performance and expectations of the final consumers who are closest to the retailers.
Author Contributions
Funding
Acknowledgments
Conflicts of Interest
References
- Kuo, R.; Han, Y. A hybrid of genetic algorithm and particle swarm optimization for solving bi-level linear programming problem—A case study on supply chain model. Appl. Math. Model. 2011, 35, 3905–3917. [Google Scholar] [CrossRef]
- Sezen, B. Relative effects of design, integration and information sharing on supply chain performance. Supply Chain Manag. Int. J. 2008, 13, 233–240. [Google Scholar] [CrossRef]
- Arogundade, K.K. Reverse Logistic Management and Product Pricing in the Nigerian Brewery Industry; Ekiti State University: Ado-Ekiti, Ekiti State, 2014. [Google Scholar]
- Abubakar, H.S. Brand loyalty and consumers of northern noodles Nigeria limited: An analysis of factors. Eur. J. Bus. Manag. 2014, 6, 67–72. [Google Scholar]
- FinIntell Consumers Want more Value for Money—Noodles Industry’s Report Shows. Available online: http://myfinancialintelligence.com/fmcg/consumers-want-more-value-money-noodles-industry’s-report-shows (accessed on 25 October 2017).
- MarketingEdge Battle of Noodles Brands over Market Share. Available online: https://www.marketingedge.com.ng/2017/01/27/battle-of-noodle-brands-over-market-share/ (accessed on 27 October 2017).
- Ray, S. A study of consumer acceptibilty for noodles in Siliguri market. Natl. Mon. Ref. J. Res. Commer. Manag. 2014, 1, 57–70. [Google Scholar]
- Errington, F.K.; Fujikura, T.; Gewertz, D.B. The Noodle Narratives: The Global Rise of an Industrial Food into the Twenty-First Century; University of California Press: Berkeley, CA, USA, 2013. [Google Scholar]
- Omoruyi, O.; Mafini, C. Supply chain management and customers’ satisfaction in small to medium enterprises. Stud. Univ. Babes-Bolyai Oecon. 2016, 61, 43–58. [Google Scholar] [CrossRef]
- Chiarini, A.; Douglas, A. The impact of logistics solutions on customer satisfaction: An exploratory qualitative study of manufacturing companies. Ital. J. Manag. 2015, 33, 255–270. [Google Scholar]
- Francis, G.H.; Waiganjo, E. Role of supply chain practices on customer satisfaction in the printing industry in Kenya: A case study of Morven Kester East Africa limited. Int. J. Acad. Res. Bus. Soc. Sci. 2014, 4, 128–143. [Google Scholar] [CrossRef]
- Haque, M.; Islam, R. Effective supply chain management practices on customers’ satisfaction: Evidence from pharmacautical industry of Bangladesh. Glob. Bus. Manag. Res. Int. J. 2013, 5, 120–136. [Google Scholar]
- Gilaninia, S.; Taleghani, M.; Mousavian, S.J.; Khanjani, S.; Rad, M.S.; Shadmani, E.; Shiri, Z.; Seighalani, F.Z. Impact of supply chain dimensions on customers’ satisfaction. Kuwait Chapter Arab. J. Bus. Manag. Rev. 2012, 1, 104–111. [Google Scholar]
- Ibrahim, O. Impact of Strategic Supply Chain Flexibility on Customer Retention in the B2B Segment; Erasmus University Rotterdam: Rotterdam, The Netherlands, 2012. [Google Scholar]
- Barve, A. Impact of supply chains agility on customer satisfaction. In International Conference on E-Bussiness, Management and Economics; IACSIT Press: Hong Kong, China, 2011; Volume 3, pp. 325–329. [Google Scholar]
- Sukati, I.; Hamid, A.A.; Baharun, R.; Tat, H.H. A study of supply chain mannagement practices: An empirical investigation on consumer goods industry in Malaysia. Int. J. Bus. Soc. Sci. 2011, 2, 166–176. [Google Scholar]
- La Londe, B.J. Supply Chain Management: Myth or Reality? Supply Chain Manag. Rev. 1997, 1, 6–7. [Google Scholar]
- Hudnurkar, M.; Jakhar, S.; Rathod, U. Factors affecting collaboration in supply chain: A literature Review. Procedia Soc. Behav. Sci. 2014, 133, 189–202. [Google Scholar] [CrossRef]
- Soosay, C.; Hyland, P. A decade of supply chain collaboration and directions for future research. Supply Chain Manag. Int. J. 2015, 20, 613–630. [Google Scholar] [CrossRef]
- Ralston, P. Supply Chain Collaboration: A Literature Review and Empirical Analysis to Investigate Uncertainty and Collaborative Benefits in Regards to Their Practical Impact on Collaboration and Performance; Iowa State University: Iowa Ames, IA, USA, 2014. [Google Scholar]
- Vargas, A.; Patel, S.; Patel, D. Towards a business model framework to increase collaboration in the freight industry. Logistics 2018, 2, 22. [Google Scholar] [CrossRef]
- Min, H.; Zhou, G. Supply chain modeling: Past, present and future. Comput. Ind. Eng. 2002, 43, 231–249. [Google Scholar] [CrossRef]
- Zailani, S.; Premkumar, R.; Fernando, Y. Factors influencing the effectiveness of operational information sharing within supply chain channels in Malaysia. Oper. Supply Chain Manag. Int. J. 2008, 1, 85–100. [Google Scholar] [CrossRef]
- Towil, D.R.; Childerhouse, P.; Disney, S.M. Speeding up the progress curve towards effective supply chain management. Supply Chain Manag. Int. J. 2000, 5, 122–130. [Google Scholar] [CrossRef]
- Waters, D. Logistics: An Introduction to Supply Chain Management, 1st ed.; Palgrave Macmillan: New York, NY, USA, 2003. [Google Scholar]
- Saremi, H.; Zadeh, S.M.M. Management of distribution channels. Indian J. Sci. Res. 2014, 5, 452–456. [Google Scholar]
- Pulevska-ivanovska, L.; Kaleshovska, N. Implementation of e-supply chain management. TEM J. 2013, 2, 314–322. [Google Scholar]
- Coleman, J.S. Social capital in the creation of human capital. Am. J. Sociol. 1988, 94, 121–132. [Google Scholar] [CrossRef]
- Avery, S.L.; Swafford, P.M. Social capital impact on service supply chains. J. Serv. Sci. 2009, 2, 9–16. [Google Scholar] [CrossRef]
- Smith, K.G.; Carroll, S.J.; Ashford, S.J. Intra and interorganizational cooperation: Toward a research agenda. Acad. Manag. J. 1995, 38, 7–23. [Google Scholar]
- Maboodi, M.; Javanshir, H.; Rashidi, A.; Valipour, P. The effect of applying supply chain management on customer satisfaction in the textile industry. Iran. J. Text. Sci. Technol. Res. 2010, 1, 13–27. [Google Scholar] [CrossRef]
- Lysons, K.; Farrington, B. Purchasing and Supply Chain Management, 7th ed.; Prentice Hall: London, UK, 2005; ISBN 9780273694380. [Google Scholar]
- Esper, T.; Ellinger, A.; Stank, T.; Flint, D.; Moon, M. Demand and supply integration: A conceptual framework of value creation through knowledge management. J. Acad. Mark. Sci. 2010, 38, 5–18. [Google Scholar] [CrossRef]
- Ralston, P.M.; Richey, R.G.; Grawe, S.J. The past and future of supply chain collaboration: A literature synthesis and call for research. Int. J. Logist. Manag. 2017, 28, 508–530. [Google Scholar] [CrossRef]
- Whipple, J.M.; Lynch, D.F.; Nyaga, G.N. A buyer’s perspective on collaborative versus transactional relationships. Ind. Mark. Manag. 2010, 39, 507–518. [Google Scholar] [CrossRef]
- Li, S.; Ragu-nathan, B.; Ragu-nathan, T.S.; Rao, S.S. The impact of supply chain management practices on competitive advantage and organizational performance. Int. J. Manag. Sci. 2006, 34, 107–124. [Google Scholar] [CrossRef]
- Kotler, P.; Keller, K.L. Marketing Management, 13th ed.; Pearson Education Inc.: Upper Saddle River, NJ, USA, 2009. [Google Scholar]
- Oladele, P.O. Causal direction between customers’ satisfaction and service quality: A review of literature. Eur. J. Hum. Soc. Sci. 2011, 2, 2220–9425. [Google Scholar]
- Ilieska, K. Knowledge for customers’ satisfaction—As a base for new strategic management. Skola Biznisa 2011, 5, 25–31. [Google Scholar]
- Shah, R.; Ward, P.T. Defining and developing measures of lean production. J. Oper. Manag. 2007, 25, 785–805. [Google Scholar] [CrossRef]
- Maxham, J.G.; Netemeyer, R.G. A longitudinal study of complaining customers’ evaluations of multiple service failures and recovery efforts. J. Mark. 2002, 66, 57–71. [Google Scholar] [CrossRef]
- Walsh, G.; Beatty, S.E. Customer-based corporate reputation of a service firm: Scale development and validation. J. Acad. Mark. Sci. 2007, 35, 127–143. [Google Scholar] [CrossRef]
- Solomon, M.R. Consumer Behaviour, Buying, Having and Being, 8th ed.; Pearson Education Inc.: Upper Saddle River, NJ, USA, 2009. [Google Scholar]
- Hom, W. An overview of customers’ satisfaction models. In RP Group Proceedings; RP Group: New York, NY, USA, 2000; p. 101. [Google Scholar]
- Population—Ekiti State of Nigeria. Available online: population.gov.ng/ekiti-state (accessed on 22 January 2018).
- Senatorial Districts in Ekiti State. Available online: https://ekitistate.gov.ng/about-ekiti/overview/ (accessed on 21 November 2017).
- Morris, M.; Carter, C.R. Relationship marketing and supplier logistics performance: An extension of the key mediating variables model. J. Supply Chain Manag. 2005, 41, 32–43. [Google Scholar] [CrossRef]
- Min, S.; Mentzer, J.T. Developing and measuring supply chain management concepts. J. Bus. Logist. 2004, 25, 63–99. [Google Scholar] [CrossRef]
- Chen, I.J.; Paulraj, A. Towards a theory of supply chain management: The constructs and measurements. J. Oper. Manag. 2003, 22, 119–150. [Google Scholar] [CrossRef]
- Nunnally, J.C. Psychometric Theory; McGraw-Hill: New York, NY, USA, 1978. [Google Scholar]
- Yamane, T. Statistics: An Introductory Analysis, 2nd ed.; Harper & Row, Evanston & London and John Weatherhill, INC.: New York, NY, USA, 1973. [Google Scholar]
- Golberg, M.; Cho, H. Introduction to Regression Analysis; WIT Press: London, UK, 2010; ISBN 978-1-85312-624-6. [Google Scholar]
- Field, A.P. Discovering Statistics Using SPSS: (and Sex and Drugs and Rock “n” Roll), 3rd ed.; SAGE Publications: Los Angeles/Thousand Oaks, CA, USA; London, UK, 2009; ISBN 9781847879066. [Google Scholar]
- McGrath, R.; Sparks, W.L. Supply Chain Management: The Importance of Building Social Capital; ASQ Quality Press: Washington, DC, USA, 2005; ISBN 0033524X. [Google Scholar]


| Construct | N | No. of Items | Cronbach’s Alpha |
|---|---|---|---|
| Supply Chain Design | 369 | 5 | 0.800 |
| Collaboration | 369 | 5 | 0.753 |
| Service Satisfaction | 369 | 2 | 0.768 |
| Customer Involvement | 369 | 7 | 0.773 |
| Total Cronbach’s Alpha for Scale = 0.808 | |||
| Senatorial District | Study LGA | Headquarters | Store Population |
|---|---|---|---|
| Ekiti Central | Ado | Ado-Ekiti | 3550 |
| Ekiti North | Ido/Osi | Ido-Ekiti | 1850 |
| Ekiti South | Ikere | Ikere-Ekiti | 2865 |
| Total | 8265 |
| Location | Distributed | Returned | % | Unreturned | % |
|---|---|---|---|---|---|
| Ado-Ekiti | 164 | 159 | 96.95 | 5 | 3.05 |
| Ido-Ekiti | 85 | 82 | 96.47 | 3 | 3.53 |
| Ikere-Ekiti | 132 | 128 | 96.97 | 4 | 3.03 |
| Total | 381 | 369 | 96.85 | 12 | 3.15 |
| Coefficients | ||||||||
|---|---|---|---|---|---|---|---|---|
| Model | Unstandardized Coefficients | Standardised Coefficients | t | Sig. | Collinearity Statistics | |||
| B | Std. Error | Beta | Tol | VIF | ||||
| (Constant) | 2.113 | 0.176 | 11.982 | 0.000 | ||||
| Supply Chain Design | 0.463 | 0.040 | 0.518 | 11.586 | 0.000 | 1.000 | 1.000 | |
| Model Summary: | ||||||||
| R | 0.518 | |||||||
| R Square (R2) | 0.268 | |||||||
| Adjusted R2 | 0.266 | |||||||
| F | 134.234 | |||||||
| Durbin-Watson | 1.352 | |||||||
| Independent Variable: Supply Chain Design | Dependent Variable: Customer Satisfaction | |||||||
| Source: Author’s Regression Output, 2018 | ||||||||
| Coefficients | ||||||||
|---|---|---|---|---|---|---|---|---|
| Model | Unstandardized Coefficients | Standardised Coefficients | t | Sig. | Collinearity Statistics | |||
| B | Std. Error | Beta | Tol | VIF | ||||
| (Constant) | 2.080 | 0.159 | 13.110 | 0.000 | ||||
| Collaboration | 0.516 | 0.039 | 0.564 | 13.091 | 0.000 | 1.000 | 1.000 | |
| Model Summary: | ||||||||
| R | 0.564 | |||||||
| R Square (R2) | 0.318 | |||||||
| Adjusted R2 | 0.316 | |||||||
| F | 171.385 | |||||||
| Durbin-Watson | 1.368 | |||||||
| Independent Variable: Collaboration | Dependent Variable: Customer Satisfaction | |||||||
| Source: Author’s Regression Output, 2018 | ||||||||
© 2018 by the authors. Licensee MDPI, Basel, Switzerland. This article is an open access article distributed under the terms and conditions of the Creative Commons Attribution (CC BY) license (http://creativecommons.org/licenses/by/4.0/).
Share and Cite
Ogunmola, O.S.; Arogundade, K.K. Effects of Supply Chain Design and Collaboration on Customers’ Satisfaction of Instant Noodles in Ekiti State, Nigeria. Logistics 2019, 3, 2. https://doi.org/10.3390/logistics3010002
Ogunmola OS, Arogundade KK. Effects of Supply Chain Design and Collaboration on Customers’ Satisfaction of Instant Noodles in Ekiti State, Nigeria. Logistics. 2019; 3(1):2. https://doi.org/10.3390/logistics3010002
Chicago/Turabian StyleOgunmola, Oluleye Seun, and Kayode Kingsley Arogundade. 2019. "Effects of Supply Chain Design and Collaboration on Customers’ Satisfaction of Instant Noodles in Ekiti State, Nigeria" Logistics 3, no. 1: 2. https://doi.org/10.3390/logistics3010002
APA StyleOgunmola, O. S., & Arogundade, K. K. (2019). Effects of Supply Chain Design and Collaboration on Customers’ Satisfaction of Instant Noodles in Ekiti State, Nigeria. Logistics, 3(1), 2. https://doi.org/10.3390/logistics3010002