


A Particle Swarm Optimization Approach to Solve the Vehicle Routing Problem with Cross-Docking and Carbon Emissions Reduction in Logistics Management


Department of Industrial Management, National Taiwan University of Science and Technology, Taipei City 106335, Taiwan
Logistics 2022, 6(3), 62; https://doi.org/10.3390/logistics6030062
Submission received: 29 June 2022
/
Revised: 9 August 2022
/
Accepted: 11 August 2022
/
Published: 1 September 2022
(This article belongs to the Topic Sustainable Transportation)
Abstract
:Background: The logistics network design with cross-docking operations enables shipping service providers to integrate the physical flow of products between vendors and dealers in logistics management. The collective goal is to synchronize the goods in both pickup and delivery operations concurrently to reduce the handling cost, inventory cost, and operation cost generated. Therefore, the optimal vehicle routing plan is crucial to generate a truck routing schedule with minimal total cost, fulfilling the purchasing requirements and the distribution demand. Global warming and climate change are important topics due to increasing greenhouse gas emissions. Sustainable logistics management with optimized routes for trucks can assist in reducing greenhouse gas emissions and easing the effects of temperature increases on our living environment. Methods: A heuristic approach based on Particle Swarm Optimization, called ePSO, was proposed and implemented in this paper to solve the vehicle routing problems with cross-docking and carbon emissions reduction at the same time. Results: Performance comparisons were made with the Genetic Algorithm (GA) through the experiments of several vehicle routing problems with pickup and delivery benchmark problems to validate the performance of the ePSO procedure. Conclusions: Experimental results showed that the proposed ePSO approach was better than the GA for most cases by statistical hypothesis testing.
1. Introduction
With the global economic depression during COVID-19 and the war between Russia and Ukraine, enterprises pay much attention to supply chain management (SCM) and global logistics management restructure. One of the most important considerations in implementing SCM is controlling the physical flow of goods in the supply chain efficiently. An efficient and effective logistics operation enables companies to quickly respond to customers’ requirements and to build their own competitive edge over competitors. As a matter of fact, logistics costs weigh on companies’ total production and distribution costs significantly. For example, transportation costs account for one third to two thirds of a company’s overall distribution costs in general. The authors of [1] identified logistics costs that account for approximately 10% of a company’s revenue, while the authors of [2] argued that 30 percent of the final cost is incurred in the distribution channel. Therefore, to lower costs, increase profits, and improve a company’s overall performance, a well-organized and highly efficient logistics network appears essential [3,4]. Therefore, cross-docking (CD) operations for depots in the supply chain are considered a good method to reduce inventory and improve responsiveness to various customer demands [5].
CD is a concept of flowing goods from receiving to shipping without ever putting them into the warehouse for storage, with the aim of reducing the delivery time and the storage cost. In a traditional CD warehouse, shipments are unloaded from incoming trucks, which unload goods from suppliers, at the unloading area. Then, warehouse operations are performed, such as unpacking, sorting, and repacking shipments according to the orders of customers, and then loading them into outgoing trucks at the loading area to be delivered to customers. It is also considered as the optimal vehicle route for the associated direct service fulfillment, subject to truck capacity limitations and service time constraints [6,7,8].
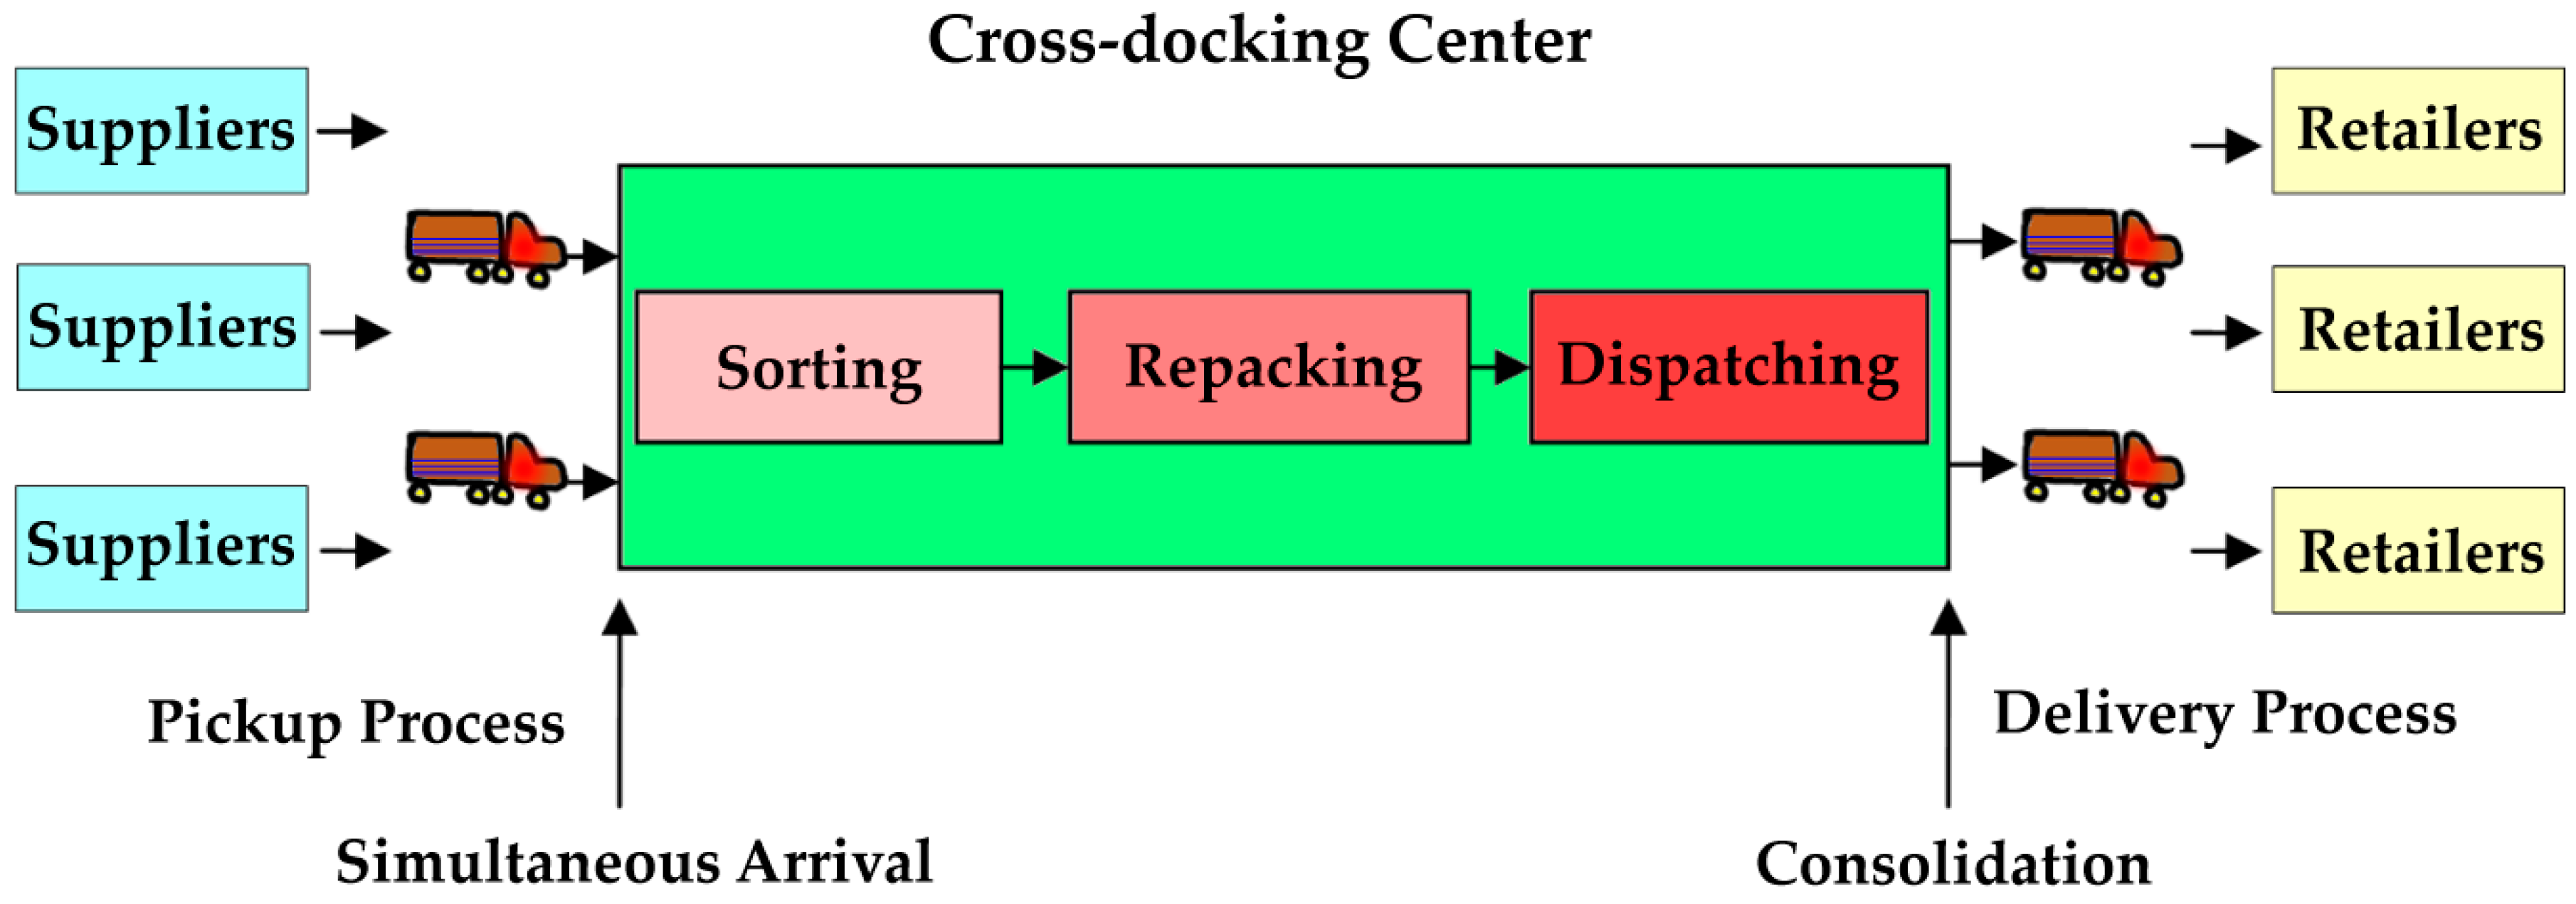
The time for the shipments in a CD warehouse usually does not exceed 24 h [9]. To achieve an optimized routing plan, the physical flow of goods in the distribution channel and the CD scheduling should be considered together with the routing of outgoing vehicles in a vehicle routing problem with cross-docking (VRPCD) to generate the lowest transport costs and increase the performance of supply chain. For a complete review of VRPCD-related literature, see [10]. The primary objective of VRPCD is to avoid inventory and handling costs so that there will ideally be no inventory stored in the central warehouse. The author of [11] mentioned that a successful CD system can bring companies significant benefits, including inventory reduction, low space requirements and transportation costs, increased customer responsiveness, and the smooth control of the distribution process. Figure 1 shows a typical layout of the CD operation. The physical flow of goods is collaboratively optimized from suppliers and retailers on both sides of the pickup and delivery processes, respectively, in order to achieve no inventory and no delayed shipment scenario to reduce overall transportation costs as well as to increase customer satisfaction and the speed of responses, as shown in the following Figure 1.
Climate change causes devastating impacts: extreme weather conditions such as flooding, tsunamis, and storms; polar ice caps melt and sea level rise; increased food insecurity; and other disasters. Global warming and climate change are important topics due to the theoretical increase in greenhouse gas emissions into the atmosphere, and require immediate attention for all countries in the world. One of the interesting observations during COVID-19 beginning from the year 2020 up to the time of this paper’s preparation period is that several regions have been on lockdown for months, especially for areas in East Asia. As people stay at home or work from home for longer than normal times, the pollutants in the atmosphere, especially the troposphere, are reduced by around 9% to 64% [12]. It is obvious that peoples’ behaviors have a huge impact on the amount of pollutants in the atmosphere. In addition, electricity usage increased at the same time due to the power required by air conditioning systems. Therefore, how to reduce greenhouse gases emission in regular activities and manufacturing industries has become an important issue. Inefficient logistics management produces more greenhouse gas emissions since vehicles need to travel for a longer time and require more gas. International enterprises must pay more attention, not only to protecting our environment but also to handling supply chain disruptions, and take actions to green their supply chains [13].
This paper focuses on solving the vehicle routing problem with cross-docking while reducing CO2 emissions in sustainable logistics management. To effectively implement the CD system into logistics networks, both receiving (pickup) and shipping (delivery) processes must be considered at the same time. The authors of [14] argued that the core issue in the pickup process is that all routing vehicles must arrive at the CD depot simultaneously. In other words, the early returned vehicle must wait at the depot till all other vehicles arrive from their pickup tasks. Moreover, the number of arrived products from suppliers must be equal to the number of products ready to be delivered to customers from the sorting centers. Then, through the sorting, repacking, and dispatching processes in the CD warehouse, the designated shipments are loaded into each corresponding vehicle for delivery to their respective destinations. In addition, to minimize total processing time (sorting, repacking, dispatching) or to maximize the throughput of the CD system, the authors of [15] studied a CD system that has a temporary storage area in front of the dispatching dock for automated guided vehicle systems. One of the objectives is to find the best truck docking sequence for both inbound and outbound trucks. In addition to AGVs, several information technology projects were also proposed to assist route planning. The authors of [16] proposed to track cars (4000 taxis) by using Global Positioning System signals. They developed a cell-based algorithm to forecast travel times to provide traffic conditions for drivers. The authors of [17] proposed industrial information integration by using an elitist nondominated sorting GA to help companies develop supply chain systems. The model was used to minimize transportation, carbon emissions, and time-window penalty costs.
Since the VRPCD is a well-known NP hard (non-deterministic polynomial-time hard) problem, applying an efficient heuristics technique is necessary to obtain a best or near optimum solution within a reasonable amount of computation time. The authors of [18] proposed a modified Ant Colony Optimization (ACO) to solve the vehicle routing problem (VRP) and found out the competitiveness of the proposed multi-ACO algorithm in terms of computation time, particularly when the number of customers is large. The author of [19] dealt with the pickup and delivery VRP by the tour-partitioning heuristics. The goal was to obtain the optimal set of vehicle routes as well as to minimize the total traveling distance. The author of [20] deals with the VRP with simultaneous pickup and delivery (VRPSPD) by the adaptive memory algorithm, which proved to be rather effective and efficient than other heuristics. Furthermore, they found some new best-known solutions for the numerous VRPSPD instances. The authors of [21] proposed a centralized route-management solution for autonomous vehicles in urban areas to control traffic that generates benefits for citizens. Their experimental results proved that their traffic prediction equation on the route server can achieve substantial improvements for average travel speeds and travel times. In this paper, we aim to propose a heuristic approach based on the Particle Swarm Optimization (PSO), called ePSO, to solve the VRPCD by adding CO2 emissions reduction and CD operation in the objective function and constraints.
Research assumptions and the mathematical model’s limitations are listed here:
- Each route begins and goes back to the same depot. All trucks for delivery depart at the same time.
- There are no product categories (or stock-keeping units) in the study.
- Customers are visited exactly once by a service truck during the pickup and delivery route, and have known inhomogeneous demand; the service time is assumed to be close to 0.
- The location of each customer for pickup and delivery is separately known.
- Assume every truck has a homogeneous vehicle capacity. The total demand for each route cannot exceed the truck’s capacity.
- The distance per unit in the plane coordinates is 1 km.
- Assume that every liter of gas consumed produces 2.2 kg of CO2 and converts it to an equivalent cost in the mathematical model by [22].
This paper is organized as follows. Section 2 provides a literature review of the study. In the third section, research problems and an ePSO approach were proposed to solve the vehicle routing problem with cross-docking while reducing CO2 emissions at the same time in sustainable logistics management. Section 4 describes experiments and results. Finally, Section 5 reports the conclusions and findings of the study.
2. Literature Review
The concept of VRP was initially brought up by the author of [23] as solving the “Truck Dispatching Problem”, in which a linear programming formulation was proposed to generate a near-best solution for the truck scheduling problem. Afterwards, numerous studies and algorithmic approaches have been proposed to solve the developing routing problems based on their study. The author of [24] used the TOPSIS multi-criteria technique to identify the most widespread performance objectives for the VRPs and found out the performance objectives in route plans “level of service”, “total number of vehicles” and “total distance traveled” were the most important factors for route planning. The author of [25] dealt with the multiple pickup and multiple delivery VRP with time windows and heterogeneous fleets by ACO approach. The goal was to obtain the optimal set of vehicle routes as well as to minimize the total travel distance and to solve the problem on the large-scale.
Moreover, the authors of [26] proposed an integer linear programming approach, under constraint relaxation and sub-tour elimination, to solve the VRP with capacity and distance restrictions. The authors of [27] applied a hybrid heuristic which incorporates a genetic algorithm with neighborhood search to solve the basic VRPs. The results showed that the hybrid GA has a significant improvement over the pure GA and is competitive with the simulated annealing approach [28] and the tabu search [29,30] based on the comparison of the benchmark problems.
The PSO is a newly developed evolutionary meta-heuristic in the field of Swarm Intelligence, like the ACO mentioned in Section 1. It was first introduced by the authors of [31] as the observation of simplified social models of bird flocks. After the introduction, various modifications have been presented. The authors of [32] and the authors of [33] added the inertia weight W to the original PSO equation. They argued that the W plays a role in balancing between local and global search and proved that when the value of W ranged from 0.9 to 1.2 on average, this results in a better performance. Moreover, a discrete binary version of PSO was presented by the authors of [34]. The concept of the PSO function remains the same, except the trajectories are changed in terms of probability.
The author of [35] first applied a discrete-type particle optimizer to the Traveling Salesman Problem (TSP). The author used the integer-based mapping approach to transfer the position of particles to the sequence of TSP’s combinatorial solution. The velocity then is defined as exchange numbers between two positions. Around the same period, the authors of [36] applied PSO to solve the task assignment problem, where they adopted the real-number-based representation to map an M-task assignment into corresponding M-coordinate particle positions. The result showed the performance of their proposed PSO is better than GA, based on the solution quality and computation time over several randomly generated instances.
The authors of [37] presented a developed PSO algorithm with an indirect real-number-based representation of (n + 2m) to map the priority lists of an n-customer and m-vehicle. The priority of the customer is assigned based on the value of a given dimension of particles. Next, the concept of the vehicle orientation point is introduced to indirectly cluster the customers and then prioritize each further. At the same time, the same authors of [38] introduced another representation method of 3m dimensional particles and replaced the concept of the vehicle orientation point with the vehicle coverage radius to construct the routes. The result showed the 3m mapping method outperformed the (n + 2m) one in solving the capacitated VRP instances.
Moreover, the authors of [39] applied an extended version of discrete PSO (DPSO) to solve the flow-shop scheduling problems, and following the authors of [40], expanded the proposed DPSO by introducing an inheritance scheme into the particle construction step to solve the lot-streaming flow-shop scheduling problem. Both results showed the proposed/improved DPSO algorithms are efficient in solving the benchmark problems for single/multiple-objective flow-shop and lot-streaming flow-shop problems, respectively, over the comparisons with GA/hybrid GA algorithms.
With the continuous development of the VRPs, the Pollution-Routing Problems (PRPs) are linked directly to one of the United Nations’ 17 Sustainable Development Goals. The PRPs were first proposed in 2011 by the authors of [41], which served as a variant of classical VRPs, with objective functions that considered not only the transportation range, but also greenhouse gases emission, gas usage, transportation times, and their costs. Moreover, variants of the PRP attracted many researchers’ attention for environmental-protection purposes. The authors of [42] extended the PRP into a dual objectives model pertaining to the minimization of fuel consumption and driving time in 2014. They developed an adaptive large neighborhood search method, combined with speed optimization, to solve the bi-objective PRP. The authors of [43] added time-dependent constraints into the PRP, considering that traffic congestion at peak hours lead to increased CO2 emissions, for a time-dependent PRP model, in 2017. The authors of [44] proposed an ε-accurate method in a continuous optimization module to solve the continuous PRP. The authors of [45] proposed an improved GA approach to solve the PRP by minimizing CO2 emissions in the objective function and constraints of the PRP’s formulation. Finally, the authors of [46] dealt with a time-dependent pollution-routing problem with one general period of congestion (PRP-1GPC), where the start and finish times of this period can be set freely. They used an adaptive large neighborhood search to optimize the routing plan.
3. Problem Proposition and Proposed ePSO Heuristics Approach
3.1. Vehicle Routung Problem with Cross-Docking Mathematical Formulation
The VRP generally is described as a graph format, with vertices standing for terminal points and arcs as vehicle routes, as shown in Figure 2. The basic notations for all VRPs are shown as follows:
where V = {v0, …, vn} is a vertex set;
G = (V, E∪A),
A = {(vi, vj): i ≠ j, vi, vj ∈ V} denotes the directed arc set;
E = {(vi, vj): i < j, vi, vj ∈ V} denotes the set of undirected edges;
v0 stands for the central depot where pickups and deliveries are made from this point.
On the problem of the vehicle routing with one CD hub introduced by the authors of [14], the constraints for the simultaneous arrival of each truck from the pickup routes and the equivalent quantity of goods transported in both sides of the supply chain are particularly emphasized. Therefore, several assumptions are made in the VRPCD formulation. First, we have n nodes, which are comprised by both suppliers and retailers serviced by m vehicles. Each vehicle must be sent out and arrived at the CD (i = 0) hub, particularly restricting the simultaneous arrival of vehicles from pickup routes. Second, for each customer, only one vehicle is assigned and associated with a cost amount of Cij. Every customer has the same amount of demand d, which is restricted to the capacity limit q of each truck. Moreover, time horizon T specifies the total distance traveled by trucks which cannot be exceeded. Two types of cost are considered in this model: (1) transportation cost; and (2) CO2-emission-equivalent cost. The overall scope is to obtain the optimal routing schedule while minimizing the number of vehicles used in the planning. The following presents the decision variables of VRPCD model in this paper.
Decision variables:
Xijk: a binary variable representing the route from i to j is serviced by vehicle k.
Yijk: loaded quantity of vehicle k from pickup trip i to j.
Zijk: unloaded quantity of vehicle k from delivery trip i to j.
tcijk: the transportation and CO2 emission cost of vehicle k from customer i to j.
etijk: time for vehicle k to move from i to j.
δik: service time required by vehicle k to load/unload the quantity demand at i.
m: total number of trucks.
n: total number of demand points.
ck: fixed cost of vehicle k.
q: maximum capacity for each vehicle.
T: planning horizon.
P: unit demand from each pickup stop.
D: unit demand from each delivery stop.
DTjk: departure time for truck k to leave node j.
ATk: arrival time for truck k.
Objective function:
Subject to:
Equation (1) states the overall objective is to minimize transportation costs, CO2 emission equivalent costs, and fixed costs. Equations (2) and (3) specify that a customer is serviced by only one truck, and Equation (4) means each truck arriving at that customer node must also leave from that node. The constraints of each vehicle are that it is only allowed to start from and return to the CD hub and is used to serve at most one route, which are shown in (5) and (6), respectively. Equation (7) specifies that the loaded and uploaded demand from pickup and delivery processes cannot exceed the vehicle quantity limit. Equations (8) and (9) each detail the quantity limit for pickup and delivery processes. The total distance visited and time traveled cannot exceed the planning horizon specified in Equation (10). Equations (11) and (12) state the departure and arrival time, respectively. Equation (13) constrains the simultaneous arrival of vehicles at the CD hub.
3.2. Particle Swarm Optimization
As a metaphor for a group of birds randomly searching for food in an area, the best strategy to find the food is to follow the one who is closest to the source of the food. The velocity (Vidt) of a particle is determined by three terms at each iteration. First, the inertia factor forces the particle to fly in the same direction as its previous iteration. Second, the self-cognitive factor forces a particle to go back to its previous best position (Pid). Third, the social term forces a particle to move to the group’s best position (Pgd). Afterwards, each particle is able to update its current position (Xidt) to the next one (Xidt+1) based on the new direction generated. Figure 3 illustrates the searching behavior of particles.
The evolutionary step of our proposed PSO heuristics is developed based on the following formulations, where Rand1() and Rand2() are two random-number generators:
Xidt+1←Xidt + Vidt.
Subject to:
If Vid > Vmax, then Vid = Vmax;
If Vid < Vmax, then Vid = −Vmax;
In addition, the individual best position is updated using:
The global best of each individual particle is updated using:
3.3. Research Methodology
To ensure the potential for minimization of the total cost incurred, each dispatched vehicle must serve the maximum number of customers under the capacity limit and the route’s minimum traveling distance. Accordingly, clustering customers based on their area closeness to assigned deliveries must be established first. In this paper, we apply this practical strategy of a two-phase route construction approach to solve the VRPCD problem. Figure 4 shows the standard cluster-route shipping approach. Moreover, there are many gene string representations in the literature, including binary representation, floating point representation, and integer representation. In this paper, we chose an integer representation to represent our gene string. Figure 5 shows a gene string representation as an example.
Every gene can be represented as an integer number, as shown in Figure 5. Each node number is the gene and has a corresponding DNA order. In this paper, number 0 means depot, and other numbers represent customer’s number. This representation in route planning means a vehicle starts from depot 0, visits node 1, node 2, node 3, node 4, node 5, and finally returns to depot 0.
In the route-generating phase, the nearest neighbor search or closest point search [47] is executed to circle different shipping networks that cover relatively narrow areas traveled by vehicles in order to fulfill the maximum number of customers under the capacity limit. In this case, we increase the potential of generating the least number of vehicles used and distances traveled by vehicles.
Second, a permutation-based mapping technique is developed in the route optimizing phase in order to apply particles’ continuous flying trail to the discrete solution domain of the VRPCD. We inherit the initial routes generated in the first step to determine the number of vehicles needed to fulfill total demands. Within each cluster of customers, the particle dimension is set to be the number of customers served. In other words, we deem different groups of particles as the number of vehicles to move toward each best solution, which represents the best combination of routing sequences we desire.
3.4. ePSO Heuristics Procedure
As mentioned, a permutation-based representation is developed to perform the particle construction phase. The dimension of a particle represents the position of the nodes to be visited by vehicles. Consequently, the velocity is then generated as real-value-based, representing the following difference in nodes between two random permutations from the same route. Therefore, the differences in velocities have different means of direction change, leading to the adjustment of an individual particle’s searching path. In addition, with the inclusion of inertia weight W factors, the velocity then plays a role of probability in the occurrence of executing the rate of direction change.
Moreover, each particle can record its own best experience of flying as well as detect and share other particles’ knowledge. The best experience here implies whichever permutation set generates the best fitness value. Based on this characteristic, we initiated the movement of pursuing quality positions (learning) to compose the cognition mode (Pid − Xid) and social mode (Pgd − Xid), respectively. Therefore, the difference in velocity can be obtained by this subtraction procedure.
Afterwards, with the composition of two learning factors and , which each control the speed of acceleration that pulls particles toward Pbest and Gbest, the probability of transpositions can thus be performed. In other words, the pace of direction change is determined by the probability assigned. The following Table 1 details the procedure of the proposed ePSO algorithm.
4. Computational Experiments
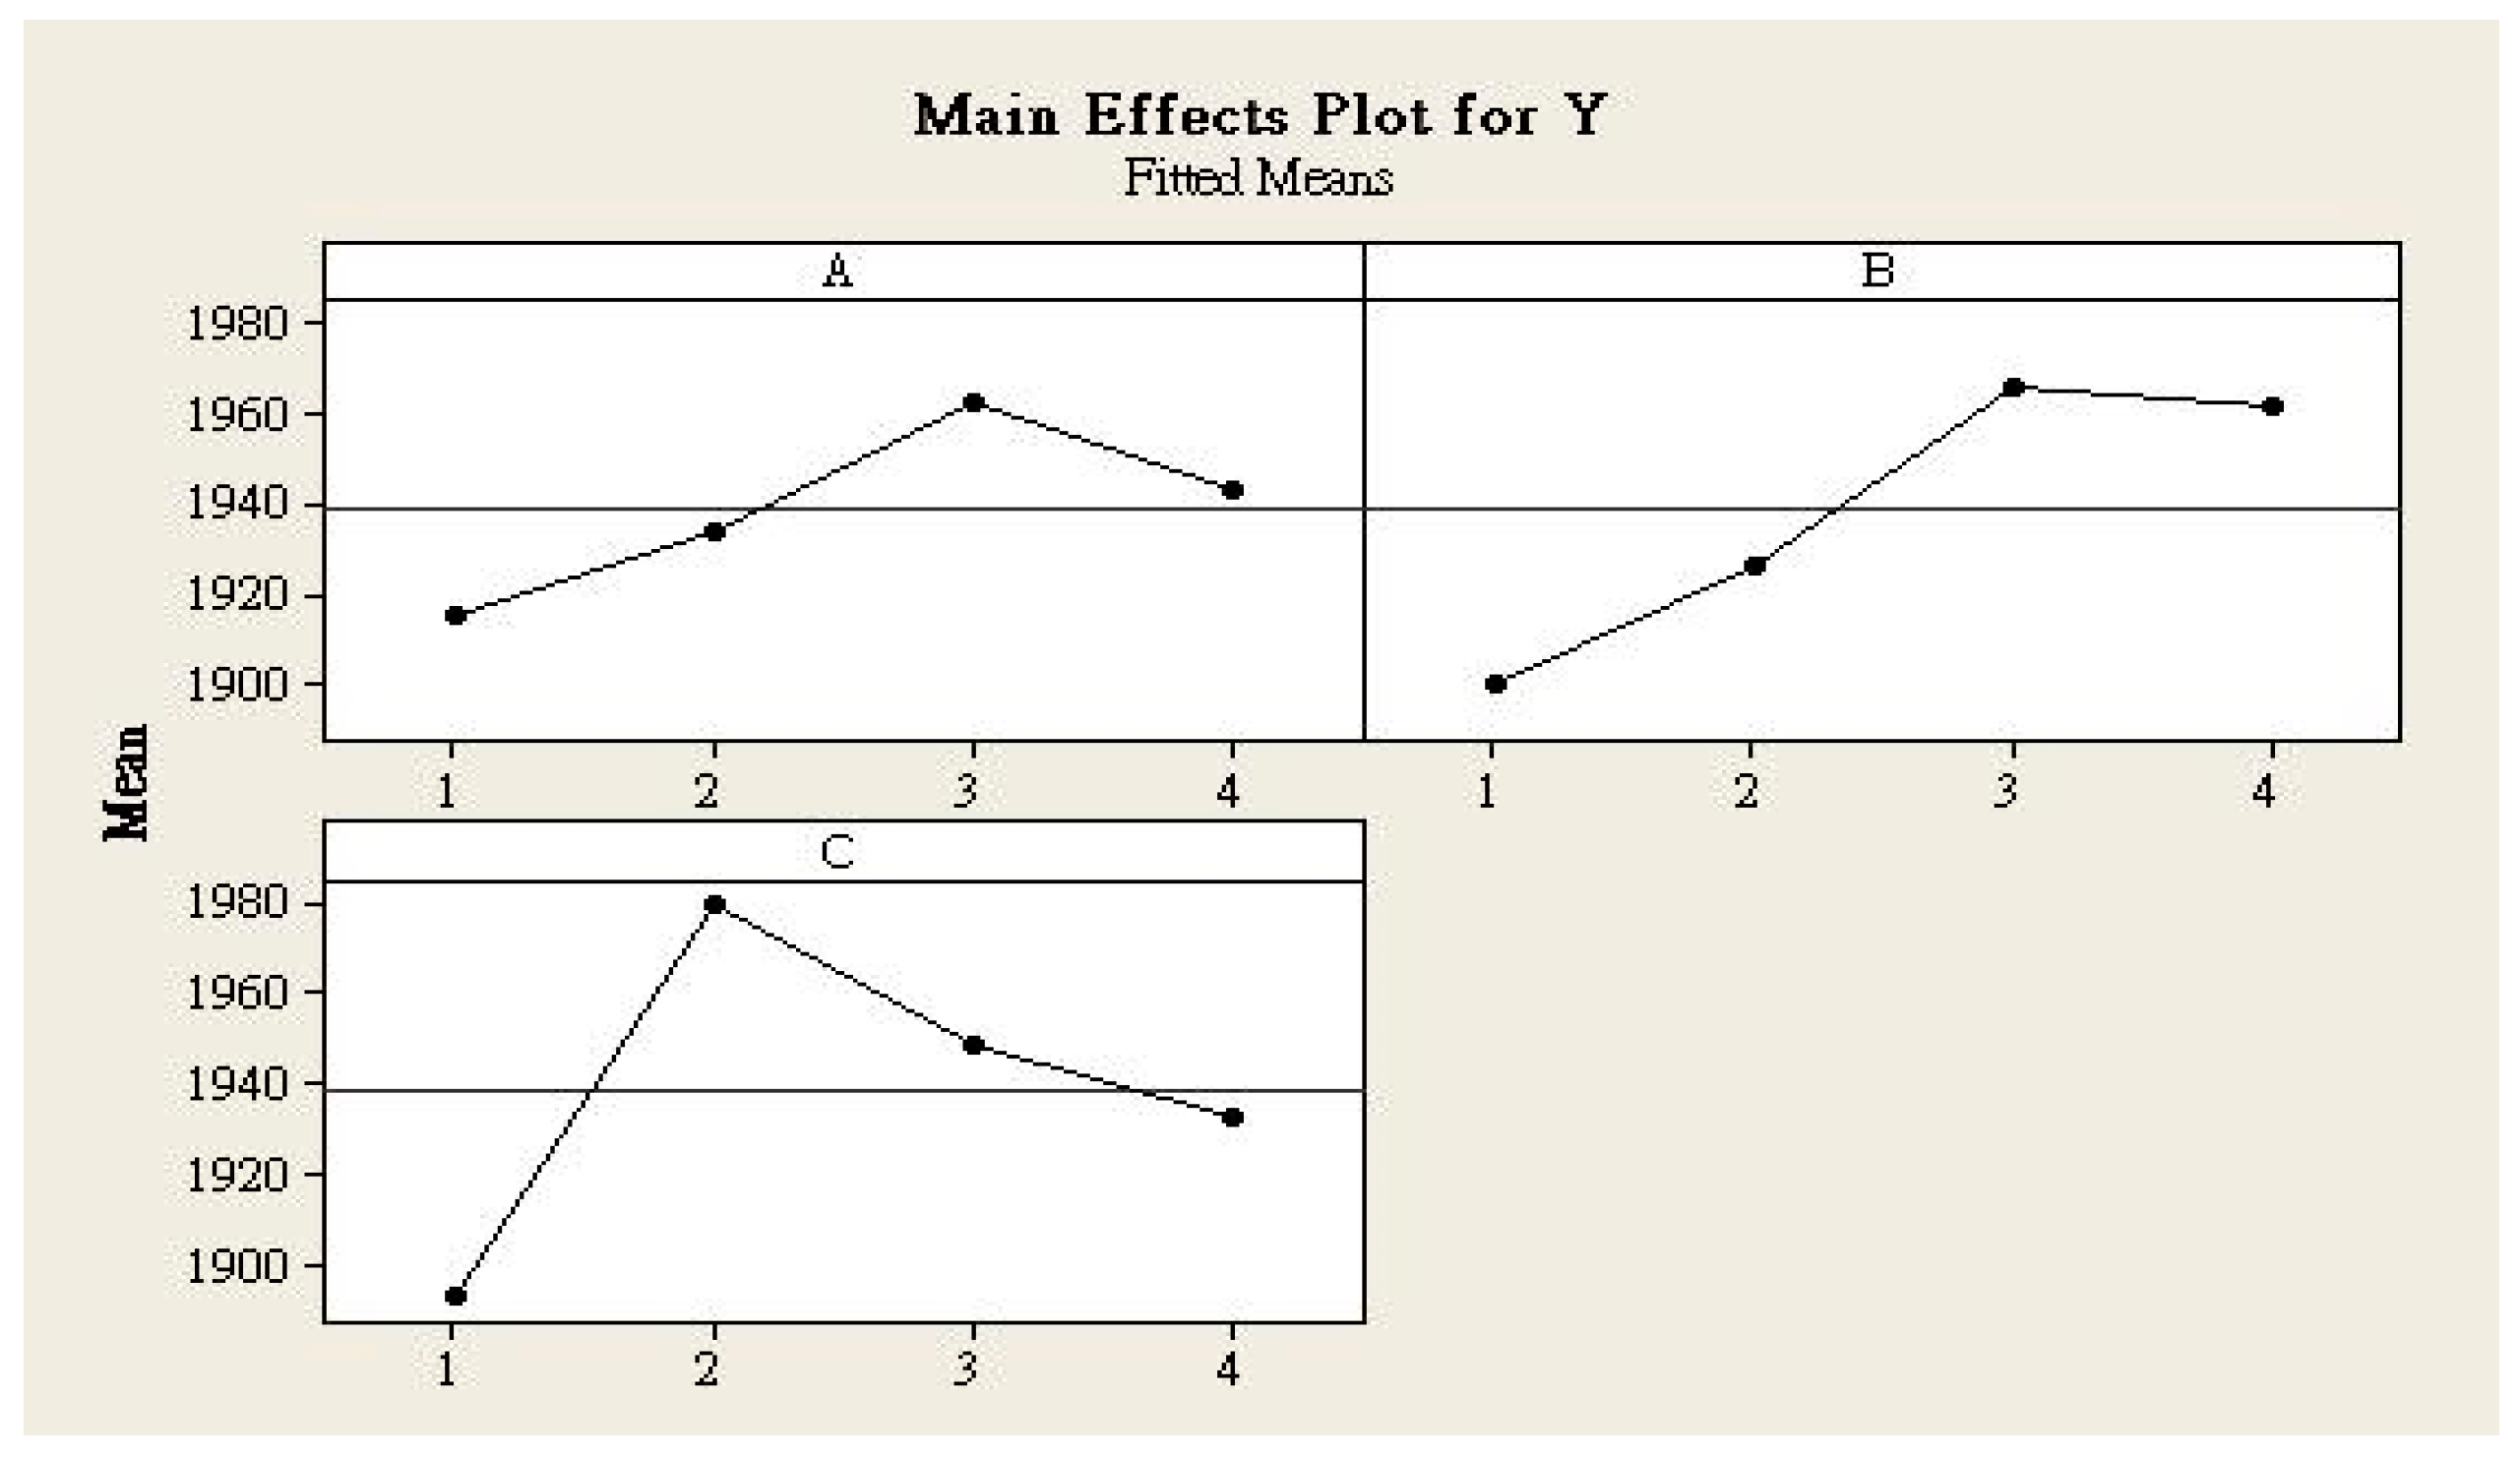
The Design of Experiment (DOE) is initiated to verify the optimal PSO parameter settings (, , and W) for the proposed heuristics as a preliminary step. The recommended ranges of the three were derived from previous literature [33,48] and applied on one randomly selected instance. Therefore, a complete 43 factorial experiment design is constructed, specifying that
and were set at the range of [0.4, 1.9] with an increment of 0.5, while W was suggested as [0.8, 1.4] with an increment of 0.2. Figure 6 shows the main effects plot from the results of DOE. A, B, and C are each symbolized as , , and W. Y is the response of the total cost, including carbon pollution cost.
It is observed that our proposed ePSO algorithm produced a better quality of solution when the three were all assigned at level 1, which is 0.4 for both and , and 0.8 for W. Other than that, the number of particle sizes is given at 200, and the maximum iteration is set at 1000 trials as the termination criterion. On the other hand, the population size of genes in the GA method is set at 50, with a mutation rate of 0.06 and a crossover rate of 0.15. The maximum iteration number is 1000 trials, with 30 replications for each instance.
Sixty datasets of VRP pickup and delivery benchmark problems with the condition of homogeneous demand were experimented on. Each instance is replicated for 30 runs for both the GA and the ePSO algorithms. The experimental results are given in Table 2.
A paired T-test was conducted to verify the performance of the two methods. The hypothesis test is:
H0: μGA − μePSO = 0
HA: μGA − μePSO > 0
Result showed that the t-value is 9.62 and the p-value = 0. Hence, we can reject the null hypothesis under a 0.05 significant level and conclude that μePSO is significantly smaller than μGA. That is, the total cost, including transportation cost, CO2 emission cost, and fixed asset cost, generated by the ePSO approach is smaller than the total cost generated by the GA in our experiments. Figure 7 presents the optimum routing plan for instance 16P1 with a central depot located at (50, 50) as an example.
5. Conclusions
This research studies the practical operation of cross-docking between the pickup and delivery routing schedule in the logistics network, with the optimization of vehicle route scheduling aiming to minimize the distribution costs incurred in the supply chain activities. Major contributions of this paper include the integration of the operational modeling of cross-docking, minimizing cost for both pickup and delivery process, and minimizing CO2 emissions costs in the supply chain optimization design. A significant development lies in synchronization for hub operations between upstream suppliers and downstream retailers. With the establishment of this model, the desirable scenario of no customer order delay and no inventory stocking in the central warehouse can be practically achieved.
One important contribution of this paper is to consider carbon emissions costs in both objective functions and set of constraints in the mathematical model, and to propose a metaheuristic approach to solve this model. By doing this, the mathematical model can optimize routes for trucks, not only considering transportation costs and operation costs, but also embed CO2 costs in the model as a study in sustainable logistics management.
A third significant effort reflects on the proven robustness of the proposed ePSO approach, which can be effectively applied to solve combinatorial optimization problems. The experimental results from 60 pickup and delivery benchmark problems showed that the proposed ePSO approach can produce significant improvements over the GA algorithm for the total minimum cost, validated by the paired T-test. In addition, the ability of the proposed ePSO to discover a better best solution than the GA was verified in a set of 55 instances out of the 60 benchmarks in the experiment.
For future work, there are many unfinished studies that are not covered in this paper. First, the estimated pay-off limit may be calculated to provide evidence for the model. There are many factors that are worth investigating, such as the duration of the transport task and the road, transport path, emissions of harmful compounds, the safety of vehicle traffic, legal restrictions, and psychophysical condition of drivers. Moreover, the features of transport roads may be taken into account, such as the type of surface, season, weather, precipitation, driver experience, road behavior strategy, cargo safety, random disturbance, kinematics of traffic, local infrastructure affecting the ability to move vehicles, which directly affects the time of transport services, overcoming obstacles on the road, the impact of the suspension, or the strategy of making decisions related to the risk of a reduced coefficient of adhesion. Finally, there may exist other conversions of carbon emissions with more precise CO2 reduction costs.
Funding
This research received no external funding.
Informed Consent Statement
Not applicable.
Data Availability Statement
Not applicable.
Acknowledgments
The authors would like to thank the editors and three reviewers for their professional and valuable comments and suggestions that helped improve the quality and value of this study.
Conflicts of Interest
The author declares no conflict of interest.
References
- LaLonde, B.J.; Zinszer, P.H. Customer Service: Meaning and Measurement; National Council of Physical Distribution Management: Chicago, IL, USA, 1976; pp. 156–159. [Google Scholar]
- Apte, U.M.; Viswanathan, S. Effective cross docking for improving distribution efficiencies. Int. J. Logist. Res. Appl. 2000, 3, 291–302. [Google Scholar] [CrossRef]
- Pérez-Gómez, P.; Arbelo-Pérez, M.; Arbelo, A. Profit efficiency and its determinants in small and medium-sized enterprises in Spain. BRQ Bus. Res. Q. 2018, 21, 238–250. [Google Scholar] [CrossRef]
- Camisón-Haba, S.; Clemente-Almendros, J.A. A global model for the estimation of transport costs. Econ. Res.-Ekon. Istraz. 2020, 33, 2075–2100. [Google Scholar] [CrossRef]
- Vanajakumari, M.; Sun, H.; Jones, A.; Sriskandarajah, C. Supply chain planning: A case for hybrid cross-docks. Omega 2022, 108, 102585. [Google Scholar] [CrossRef]
- Song, S.H.; Sung, C.S. Integrated service network design for a cross-docking supply chain network. J. Oper. Res. Soc. 2003, 54, 1283–1295. [Google Scholar] [CrossRef]
- Chargui, T.; Bekrar, A.; Reghioui, M.; Trentesaux, D. Scheduling trucks and storage operations in a multiple-door cross-docking terminal considering multiple storage zones. Int. J. Prod. Res. 2022, 60, 1153–1177. [Google Scholar] [CrossRef]
- Mendes, N.F.M.; Iori, M. A Decision Support System for a Multi-Trip Vehicle Routing Problem with Trucks and Drivers Scheduling. In Proceedings of the 22nd International Conference on Enterprise Information Systems, Online, 5–7 May 2020; ICEIS: Sutton, UK, 2020; Volume 1, pp. 339–349. [Google Scholar] [CrossRef]
- Arbabi, H.; Nasiri, M.M.; Bozorgi-Amiri, A. A hub-and-spoke architecture for a parcel delivery system using the cross-docking distribution strategy. Eng. Optim. 2021, 53, 1593–1612. [Google Scholar] [CrossRef]
- Nasiri, M.M.; Rahbari, A.; Werner, F.; Karimi, R. Incorporating supplier selection and order allocation into the vehicle routing and multi-cross-dock scheduling problem. Int. J. Prod. Res. 2018, 56, 6527–6552. [Google Scholar] [CrossRef]
- Rohrer, M. Simulation and Cross Docking. In Proceedings of the 27th Conference on Winter Simulation, Arlington, VA, USA, 3–6 December 1995; pp. 846–849. [Google Scholar] [CrossRef] [Green Version]
- Kanniah, K.D.; Zaman, N.A.F.K.; Kaskaoutis, D.G.; Latif, M.T. COVID-19’s impact on the atmospheric environment in the Southeast Asia region. Sci. Total Environ. 2020, 736, 139658. [Google Scholar] [CrossRef]
- Maxie, E. Supplier Performance and the Environment. In Proceedings of the 1994 IEEE International Symposium on Electronics and The Environment, San Francisco, CA, USA, 2–4 May 1994; pp. 323–327. [Google Scholar] [CrossRef]
- Lee, Y.H.; Jung, J.W.; Lee, K.M. Vehicle routing scheduling for cross-docking in the supply chain. Comput. Ind. Eng. 2006, 51, 247–256. [Google Scholar] [CrossRef]
- Yu, W.; Egbelu, P.J. Design of a variable path tandem layout for automated guided vehicle systems. J. Manuf. Syst. 2001, 20, 305–319. [Google Scholar] [CrossRef]
- Sananmongkhonchai, S.; Tangamchit, P.; Pongpaibool, P. Cell-Based Traffic Estimation from Multiple GPS-Equipped Cars. In Proceedings of the 2009 IEEE Region 10 Conference (TENCON 2009), Singapore, 23–26 January 2009; pp. 1–6. [Google Scholar] [CrossRef]
- Guo, K.; Hu, S.; Zhu, H.; Tan, W. Industrial information integration method to vehicle routing optimization using grey target decision. J. Ind. Inf. Integr. 2022, 27, 100336. [Google Scholar] [CrossRef]
- Bell, J.E.; McMullen, P.R. Ant colony optimization techniques for the vehicle routing problem. Adv. Eng. Inform. 2004, 18, 41–48. [Google Scholar] [CrossRef]
- Mosheiov, G. Vehicle routing with pick-up and delivery: Tour-partitioning heuristics. Comput. Ind. Eng. 1998, 34, 669–684. [Google Scholar] [CrossRef]
- Zachariadis, E.E.; Tarantilis, C.D.; Kiranoudis, C.T. An adaptive memory methodology for the vehicle routing problem with simultaneous pick-ups and deliveries. Eur. J. Oper. Res. 2010, 202, 401–411. [Google Scholar] [CrossRef]
- Zambrano-Martinez, J.L.; Calafate, C.T.; Soler, D.; Lemus-Zúñiga, L.-G.; Cano, J.-C.; Manzoni, P.; Gayraud, T. A centralized route-management solution for autonomous vehicles in urban areas. Electronics 2019, 8, 722. [Google Scholar] [CrossRef] [Green Version]
- Huijgen, W.J.J.; Comans, R.N.J.; Witkamp, G.-J. Cost evaluation of CO2 sequestration by aqueous mineral carbonation. Energy Convers. Manag. 2007, 48, 1923–1935. [Google Scholar] [CrossRef]
- Dantzig, G.B.; Ramser, J.H. The truck dispatching problem. Manag. Sci. 1959, 6, 80–91. [Google Scholar] [CrossRef]
- Nobre, A.V.; Oliveira, C.C.R.; de Lucena Nunes, D.R.; Silva Melo, A.C.; Guimarães, G.E.; Anholon, R.; Martins, V.W.B. Analysis of decision parameters for route plans and their importance for sustainability: An exploratory study using the TOPSIS technique. Logistics 2022, 6, 32. [Google Scholar] [CrossRef]
- Ky Phuc, P.N.; Phuong Thao, N.L. Ant colony optimization for multiple pickup and multiple delivery vehicle routing problem with time window and heterogeneous fleets. Logistics 2021, 5, 28. [Google Scholar] [CrossRef]
- Loporte, G.; Nobert, Y.; Desrochers, M. Optimal routing under capacity and distance restrictions. Oper. Res. 1985, 33, 1050–1073. [Google Scholar] [CrossRef]
- Baker, B.M.; Ayechew, M.A. A genetic algorithm for the vehicle routing problem. Comput. Oper. Res. 2003, 30, 787–800. [Google Scholar] [CrossRef]
- Osman, I.H. Metastrategy simulated annealing and tabu search algorithms for the vehicle routing problem. Ann. Oper. Res. 1993, 41, 421–451. [Google Scholar] [CrossRef]
- Taillard, É. Parallel iterative search methods for vehicle routing problems. Networks 1993, 23, 661–673. [Google Scholar] [CrossRef]
- Gendreau, M.; Hertz, A.; Laporte, G. A tabu search heuristic for the vehicle routing problem. Manag. Sci. 1994, 40, 1276–1290. [Google Scholar] [CrossRef]
- Kennedy, J.; Eberhart, R.C. Particle Swarm Optimization. In Proceedings of the ICNN’95—International Conference on Neural Networks, Perth, WA, Australia, 27 November–1 December 1995. [Google Scholar] [CrossRef]
- Shi, Y.; Eberhart, R.C. A Modified Particle Swarm Optimizer. In Proceedings of the 1998 IEEE International Conference on Evolutionary Computation, Anchorage, AK, USA, 4–9 May 1998. [Google Scholar] [CrossRef]
- Shi, Y.; Eberhart, R.C. Parameter Selection in Particle Swarm Optimization. In Evolutionary Programming VII; Lecture Notes in Computer Science; Porto, V.W., Saravanan, N., Waagen, D., Eiben, A.E., Eds.; Springer: Berlin/Heidelberg, Germany, 1998; Volume 1447, pp. 591–600. [Google Scholar] [CrossRef]
- Kennedy, J.; Eberhart, R.C. A Discrete Binary Version of the Particle Swarm Algorithm. In Proceedings of the 1997 IEEE International Conference on Systems, Man, and Cybernetics, Orlando, FL, USA, 12–15 October 1997. [Google Scholar] [CrossRef]
- Clerc, M. Discrete Particle Swarm Optimization, Illustrated by the Traveling Salesman Problem. In New Optimization Techniques in Engineering; Onwubolu, G.C., Babu, B.V., Eds.; Springer: Berlin/Heidelberg, Germany, 2004; Volume 141, pp. 219–239. [Google Scholar] [CrossRef]
- Salman, A.; Ahmad, I.; Al-Madani, S. Particle swarm optimization for task assignment problem. Microprocess. Microsyst. 2002, 26, 363–371. [Google Scholar] [CrossRef]
- Ai, T.J.; Kachitvichyanukul, V. A particle swarm optimization for the vehicle routing problem with simultaneous pickup and delivery. Comput. Oper. Res. 2009, 36, 1693–1702. [Google Scholar] [CrossRef]
- Ai, T.J.; Kachitvichyanukul, V. Particle swarm optimization and two solution representations for solving the capacitated vehicle routing problem. Comput. Ind. Eng. 2009, 56, 380–387. [Google Scholar] [CrossRef]
- Liao, C.J.; Tseng, C.T.; Luarn, P. A discrete version of particle swarm optimization for flowshop scheduling problems. Comput. Oper. Res. 2007, 34, 3099–3111. [Google Scholar] [CrossRef]
- Tseng, C.T.; Liao, C.J. A discrete particle swarm optimization for lot-streaming flowshop scheduling problem. Eur. J. Oper. Res. 2008, 191, 360–373. [Google Scholar] [CrossRef]
- Bektaş, T.; Laporte, G. The pollution-routing problem. Transp. Res. Part B Methodol. 2011, 45, 1232–1250. [Google Scholar] [CrossRef]
- Demira, E.; Bektaş, T.; Laporte, G. The bi-objective pollution-routing problem. Eur. J. Oper. Res. 2014, 232, 464–478. [Google Scholar] [CrossRef]
- Franceschetti, A.; Demir, E.; Honhon, D.; Van Woensel, T.; Laporte, G.; Stobbe, M. A metaheuristic for the time-dependent pollution-routing problem. Eur. J. Oper. Res. 2017, 259, 972–991. [Google Scholar] [CrossRef]
- Xiao, Y.; Zuo, X.; Huang, J.; Konak, A.; Xu, Y. The continuous pollution routing problem. Appl. Math. Comput. 2020, 387, 125072. [Google Scholar] [CrossRef]
- Lo, S.-C.; Shih, Y.-C. A genetic algorithm with quantum random number generator for solving the pollution-pouting problem in sustainable logistics management. Sustainability 2021, 13, 8381. [Google Scholar] [CrossRef]
- Liu, Z.; Chen, Y.; Qin, J. The pollution-routing problem with one general period of congestion. J. Model. Manag. 2022, 35, 1–46. [Google Scholar] [CrossRef]
- Arya, S.; Mount, D.M.; Netanyahu, N.S.; Silverman, R.; Wu, A.Y. An optimal algorithm for approximate nearest neighbor searching fixed dimensions. J. ACM 1998, 45, 891–923. [Google Scholar] [CrossRef]
- Hu, X.; Shi, Y.; Eberhart, R. Recent Advances in Particles Swarm. In Proceedings of the 2004 Congress on Evolutionary Computation (IEEE Cat. No. 04TH8753), Portland, OR, USA, 19–23 June 2004; Volume 1, pp. 90–97. [Google Scholar] [CrossRef]
Figure 1.
A vehicle routing network begins with picking up raw materials from suppliers, transporting them to the cross-docking center for the sorting, repacking, and dispatching processes, and delivering them to retailers.
Figure 1.
A vehicle routing network begins with picking up raw materials from suppliers, transporting them to the cross-docking center for the sorting, repacking, and dispatching processes, and delivering them to retailers.

Figure 2.
An example of a VRP roadwork.

Figure 3.
Search behavior example for particles.

Figure 4.
The typical cluster-route shipping approach.

Figure 5.
Example of gene string representation for a routing sequence.

Figure 6.
The main effects plot of factors , , and W referred to as A, B, C.

Figure 7.
The optimum routing plan for instance 16P1, as an example.


Table 1.
The algorithm of the proposed ePSO heuristics for solving VRPCD.
| Step 0. Begin procedure Initial parameters: , , and W, swarm size, and maximum number of iterations, etc. |
Step 1. Generate initial solution
|
| Step 2. Initialization (start iteration 0) For i = 1 to NumSwarmSize; d = 1 to NumParticleDim
|
Step 3. Evaluation
|
| Step 4. Iteration process Loop: iteration t = t + 1 Update velocity and position
|
| Determine new Pbest and Gbest Repeat If maximum iteration is achieved, stop; otherwise, go Loop. |
Table 2.
Comparisons of minimum total cost for the ePSO with GA.
| No. Instance | GA | ePSO | No. Instance | GA | ePSO |
|---|---|---|---|---|---|
| 1P1 | 1617.71 | 1572.09 | 31P1 | 1041.12 | 1025.50 |
| 2P1 | 1788.00 | 1791.85 | 32P1 | 1223.01 | 1206.50 |
| 3P1 | 2175.71 | 2175.71 | 33P1 | 1649.25 | 1632.81 |
| 4P1 | 1513.00 | 1505.17 | 34P1 | 955.92 | 957.60 |
| 5P1 | 1588.97 | 1574.28 | 35P1 | 1183.73 | 1178.87 |
| 6P1 | 2075.80 | 2062.60 | 36P1 | 1642.65 | 1632.16 |
| 7P1 | 1688.25 | 1654.85 | 37P1 | 1142.94 | 1127.24 |
| 8P1 | 1740.61 | 1721.43 | 38P1 | 1293.50 | 1289.56 |
| 9P1 | 2085.49 | 2034.57 | 39P1 | 1698.30 | 1693.74 |
| 10P1 | 2021.74 | 1998.01 | 40P1 | 1026.61 | 1020.44 |
| 11P1 | 1937.52 | 1923.21 | 41P1 | 1294.75 | 1284.06 |
| 12P1 | 2224.89 | 2191.13 | 42P1 | 1743.6 | 1724.90 |
| 13P1 | 1687.86 | 1676.29 | 43P1 | 1200.26 | 1185.10 |
| 14P1 | 1822.42 | 1793.59 | 44P1 | 1355.71 | 1333.86 |
| 15P1 | 2065.08 | 2009.82 | 45P1 | 1656.96 | 1631.16 |
| 16P1 | 1368.41 | 1364.13 | 46P1 | 1100.42 | 1087.80 |
| 17P1 | 1466.61 | 1462.48 | 47P1 | 1248.41 | 1248.41 |
| 18P1 | 1801.82 | 1772.76 | 48P1 | 1641.21 | 1641.21 |
| 19P1 | 1079.62 | 1076.95 | 49P1 | 1140.18 | 1135.11 |
| 20P1 | 1179.45 | 1174.99 | 50P1 | 1346.41 | 1336.44 |
| 21P1 | 1526.74 | 1517.37 | 51P1 | 1734.86 | 1724.98 |
| 22P1 | 1141.29 | 1132.40 | 52P1 | 1358.85 | 1331.17 |
| 23P1 | 1239.31 | 1222.51 | 53P1 | 1508.96 | 1492.33 |
| 24P1 | 1568.71 | 1550.76 | 54P1 | 1823.91 | 1819.08 |
| 25P1 | 1045.00 | 1022.92 | 55P1 | 1375.68 | 1362.92 |
| 26P1 | 1131.59 | 1120.17 | 56P1 | 1532.66 | 1502.50 |
| 27P1 | 1471.00 | 1462.20 | 57P1 | 1981.11 | 1949.11 |
| 28P1 | 1207.28 | 1204.93 | 58P1 | 1310.87 | 1295.22 |
| 29P1 | 1298.99 | 1288.95 | 59P1 | 1442.05 | 1425.48 |
| 30P1 | 1630.19 | 1615.41 | 60P1 | 1867.95 | 1849.82 |
Publisher’s Note: MDPI stays neutral with regard to jurisdictional claims in published maps and institutional affiliations. |
© 2022 by the author. Licensee MDPI, Basel, Switzerland. This article is an open access article distributed under the terms and conditions of the Creative Commons Attribution (CC BY) license (https://creativecommons.org/licenses/by/4.0/).
Share and Cite
MDPI and ACS Style
Lo, S.-C. A Particle Swarm Optimization Approach to Solve the Vehicle Routing Problem with Cross-Docking and Carbon Emissions Reduction in Logistics Management. Logistics 2022, 6, 62. https://doi.org/10.3390/logistics6030062
AMA Style
Lo S-C. A Particle Swarm Optimization Approach to Solve the Vehicle Routing Problem with Cross-Docking and Carbon Emissions Reduction in Logistics Management. Logistics. 2022; 6(3):62. https://doi.org/10.3390/logistics6030062
Chicago/Turabian StyleLo, Shih-Che. 2022. "A Particle Swarm Optimization Approach to Solve the Vehicle Routing Problem with Cross-Docking and Carbon Emissions Reduction in Logistics Management" Logistics 6, no. 3: 62. https://doi.org/10.3390/logistics6030062