1. Introduction
It is frequent to store energy available from renewable energy sources for its posterior use when necessary. This energy storage procedure can be of four types: chemical energy, electrical energy, mechanical energy and thermal energy [
1,
2]. The thermal energy storage is a very interesting option to store available solar energy as well as thermal energy being wasted in industrial processes. When the storage material does not suffer any phase change or chemical reaction, the thermal storage technique is named sensible heat storage. If the storage medium undergoes any chemical reaction, there is thermochemical energy storage, whereas if there is any phase change of the material, there is latent heat storage [
3,
4].
The latent heat thermal energy storage uses a material that suffers a phage change of its molecular structure, be it solid-liquid, liquid-vapour or solid-solid [
5]. The solid-liquid phase changes are considered more efficient when compared with the liquid-vapour or the solid-solid transitions. Liquid-vapour transitions undergo a high-volume variation while the solid-solid transitions have a very low latent heat of phase change [
4,
5]. The materials used for latent heat storage are called phase change materials (PCM) and because of the high value of the latent heat of phase change the mass of material required per unit of stored energy is smaller than for sensible heat storage, leading to advantageous applications either in domestic or in industrial storage processes [
5,
6]. There are however some practical aspects that still require further development, like the heat transfer rate between the thermal energy transportation fluid and the heat storage material, or the PCM capacity of enduring a high number of operating cycles keeping the corresponding chemical and thermal stability [
7]. The biggest disadvantage of the PCM’s is the lower thermal conductivity, in the 0.2 to 0.8 W/(m·K) range and if these values could be increased an overall augmentation of the thermal efficiency of the storage process would be achieved through the improvement of the thermal energy charging and discharging processes [
4]. The encapsulation of PCM’s has solved some of the heat transfer limitations and is being used from solar plants to the thermal structure of buildings or even in textile fabrics, covering a wide range of operating temperatures [
7].
To increase the charging and discharging efficiency different techniques to increase the thermal conductivity were studied [
8,
9,
10]. The simplest methodology is to increase the heat transfer area through the application of fins to the heat transfer surfaces. Either radial or axial fins were evaluated [
4]. Velraj et al. [
11] investigated the solidification of PCM’s in a vertical cylindrical pipe with internal radial fins and concluded that this configuration with a V like geometry could keep the PCM inside it, guarantying the best possible results for a finned geometry. Erek et al. [
12] studied numerically and experimentally the latent heat energy storage by means of radial fins. The stored energy increased with the fin radius and the reduction of inter fin spacing. Castell et al. [
13] added graphite longitudinal fins inside the PCM media to test the possible reduction of the solidification time. They found that although the use of fins changed the natural convection currents inside the PCM, it was possible to reduce the solidification time of the material.
The majority of the commercially available PCM’s are mixtures or impure materials, so the phase change does not take place at a fixed temperature value but instead, in a range of temperature values. On the contrary, pure PCM’s present phase changes at fixed temperatures [
14].
Low temperature PCM’s, either organic, inorganic or eutectic are mainly used for the recuperation of wasted thermal energy in buildings, while inorganic or eutectic PCM’s can be used in solar applications or other high temperature thermal energy storage applications [
4,
14].
The objective of the present study was to obtain data on the time evolution of the temperature of two commercially available PCM’s during the fusion and solidification processes and subsequently overall heat transfer coefficients, during the PCM fusion and solidification, were also determined. To obtain the overall heat transfer coefficients, between the heat transfer oil and the phase change material, a mathematical treatment of the heat transfer process was developed leading to the definition of the corresponding logarithmic mean temperature differences. These logarithmic mean temperature differences take into account the different situations the PCM’s under text undergo.
Many experimental and numerical studies have been carried out with pure or laboratory derived mixtures of PCM’s [
15,
16] while in the present work commercial products were analysed. The reason for this choice was concerned with the necessity to determine design values for a specific application, where the heat was exchanged from thermal oil towards the PCM and vice-versa and also because a very specific physical configuration was adopted, with the PCM surrounding a heat transfer pipe inside which the thermal energy transporting thermal oil flew. These data are to be used for the design of a solar thermal system to be installed in an industrial plant in the south of Portugal.
2. Laboratory Set-Up
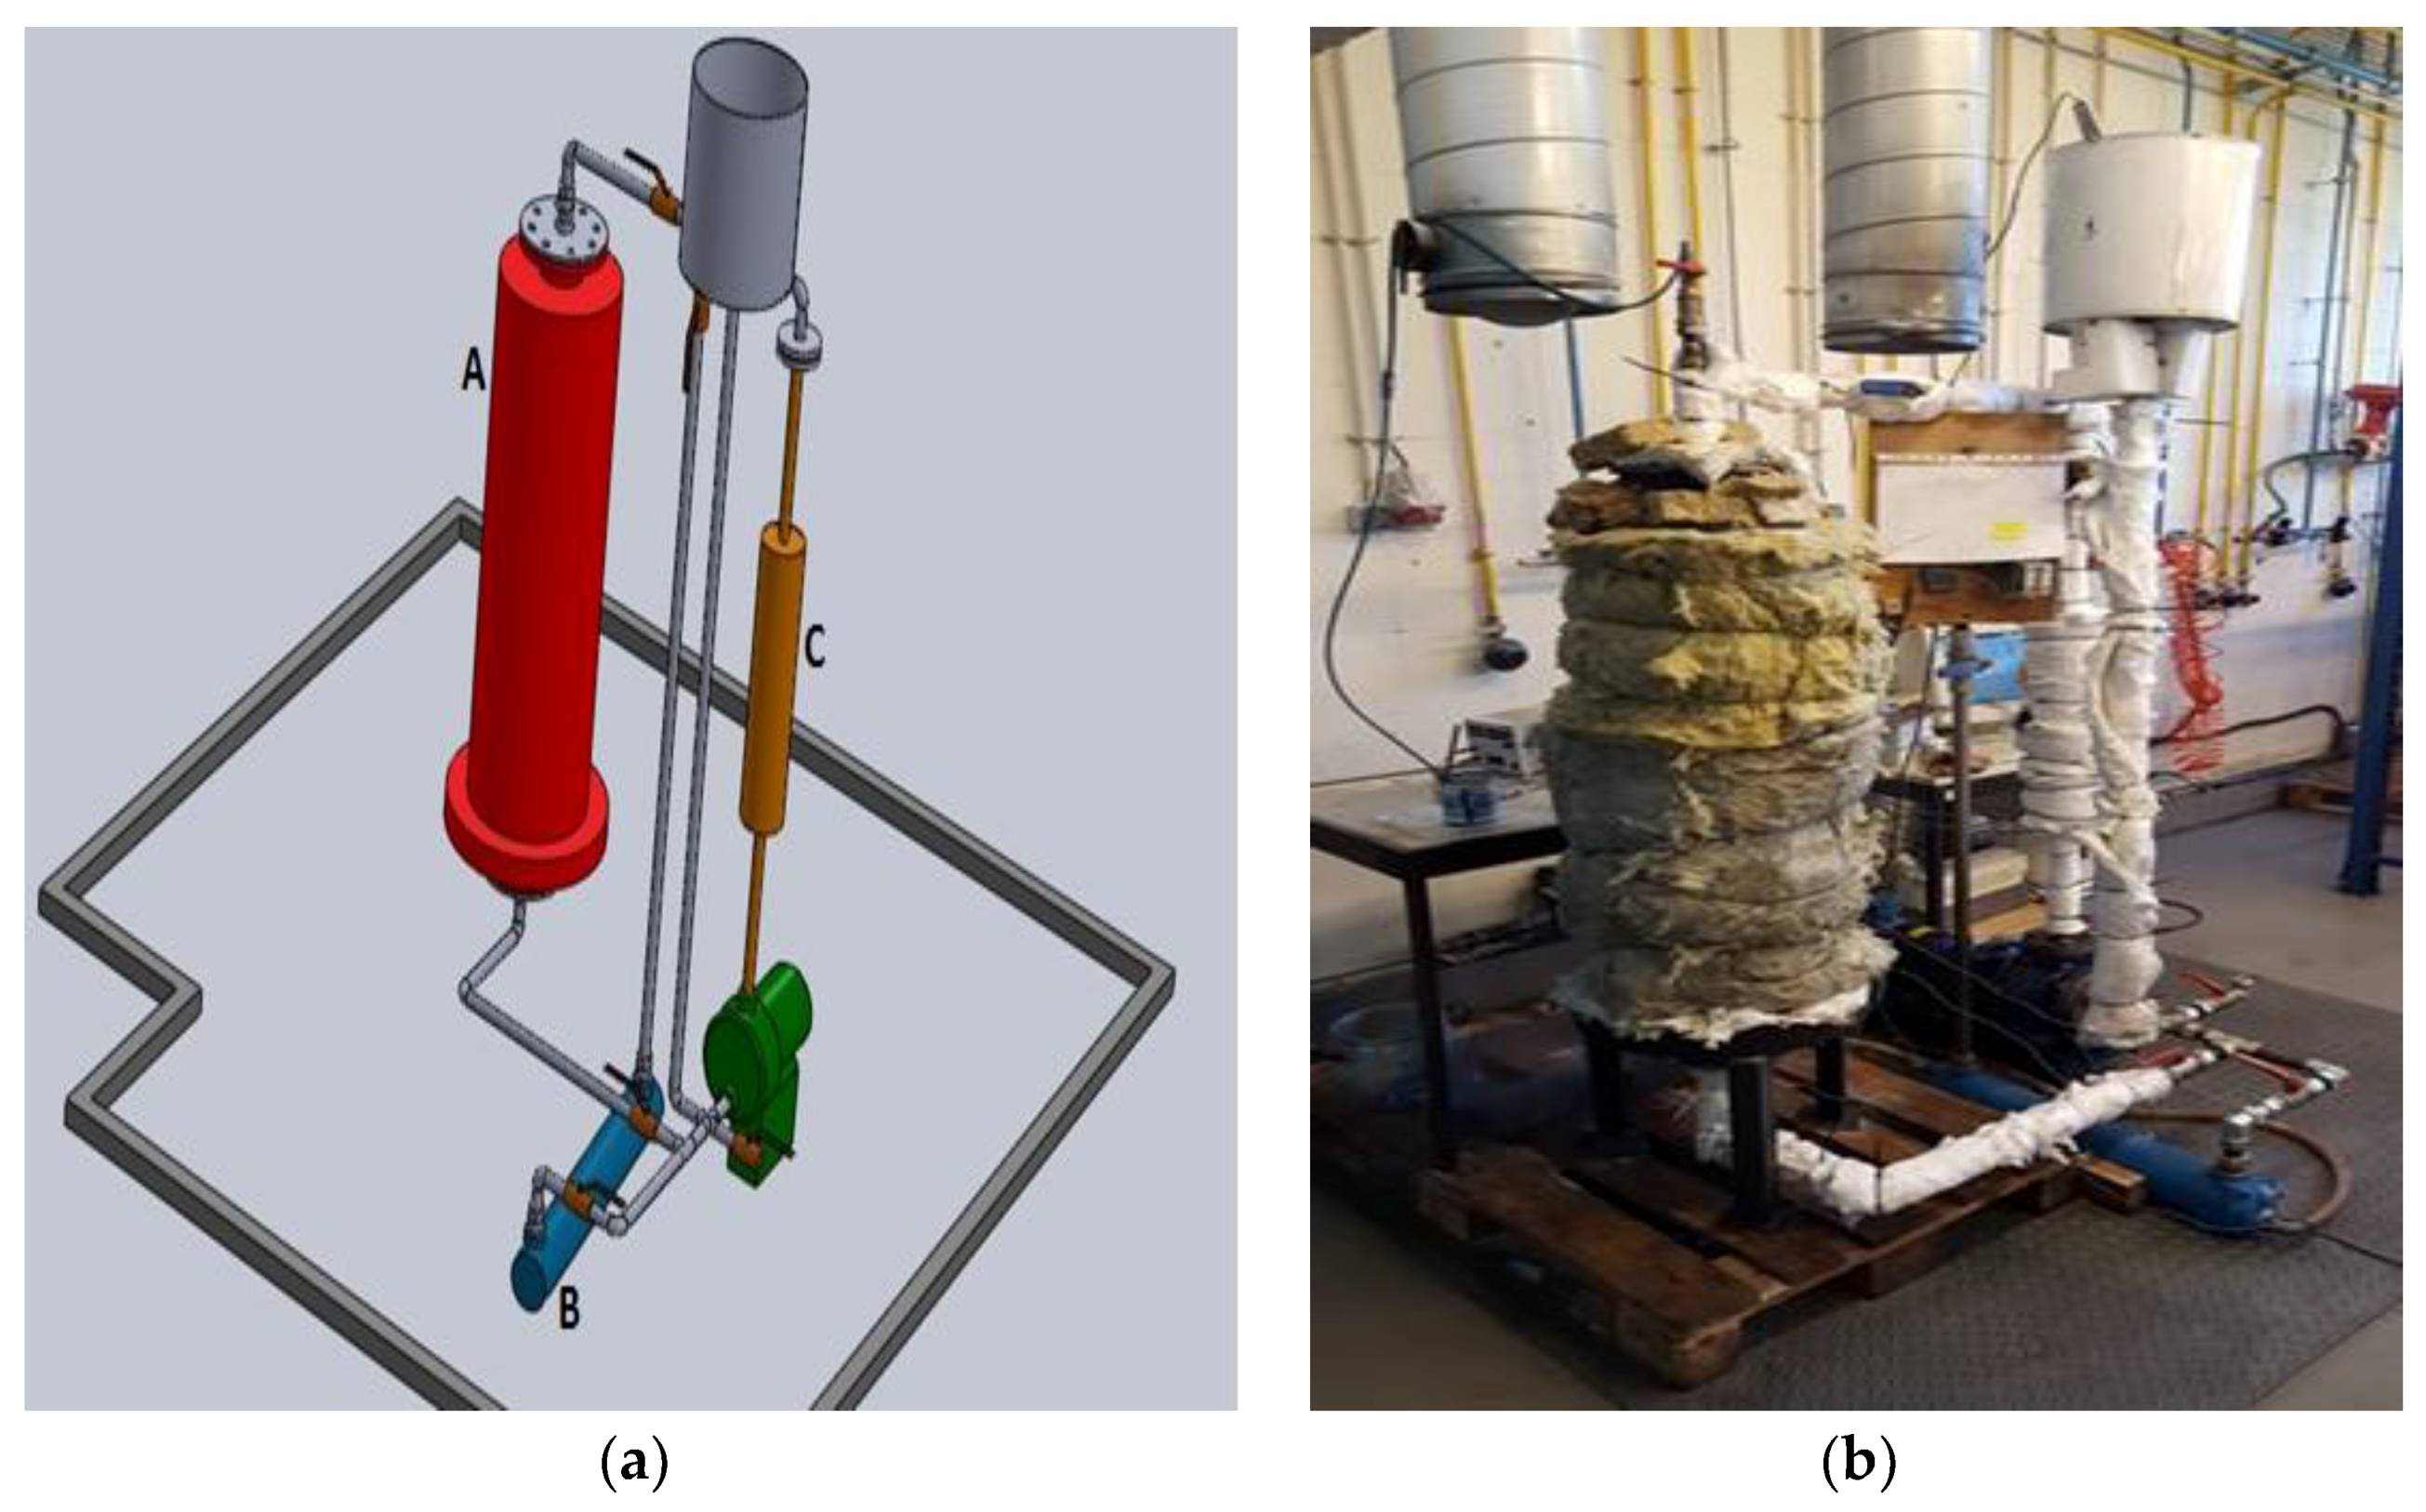
To evaluate the fusion and solidification of the two PCM’s under scrutiny the following experimental procedure was established. The thermal oil Therminol 66 was used as the energy transportation fluid, working either as a heating or as a cooling fluid. This oil circulated among the three main components of the experimental setup, namely, a test heat exchanger inside which there was the PCM, an oil heater equipped with electrical resistances and a water-cooled shell and tube heat exchanger. A centrifugal pump, capable of operating up to 170 °C, was used to promote the thermal oil circulation. A 3D scheme and a picture of the experimental set-up are shown in
Figure 1. The testing procedure was composed by a two-step cycle. In the first step (fusion) heat was supplied to the PCM, in the second step (solidification) heat was retrieved from the PCM. During the PCM fusion step the thermal oil was heated in the equipment A and supplied thermal energy to the PCM in the test exchanger C. During the solidification of the PCM, the thermal fluid received thermal energy from the PCM, enclosed in the test exchanger C and rejected this thermal energy to the environment through the shell and tube heat exchanger B.
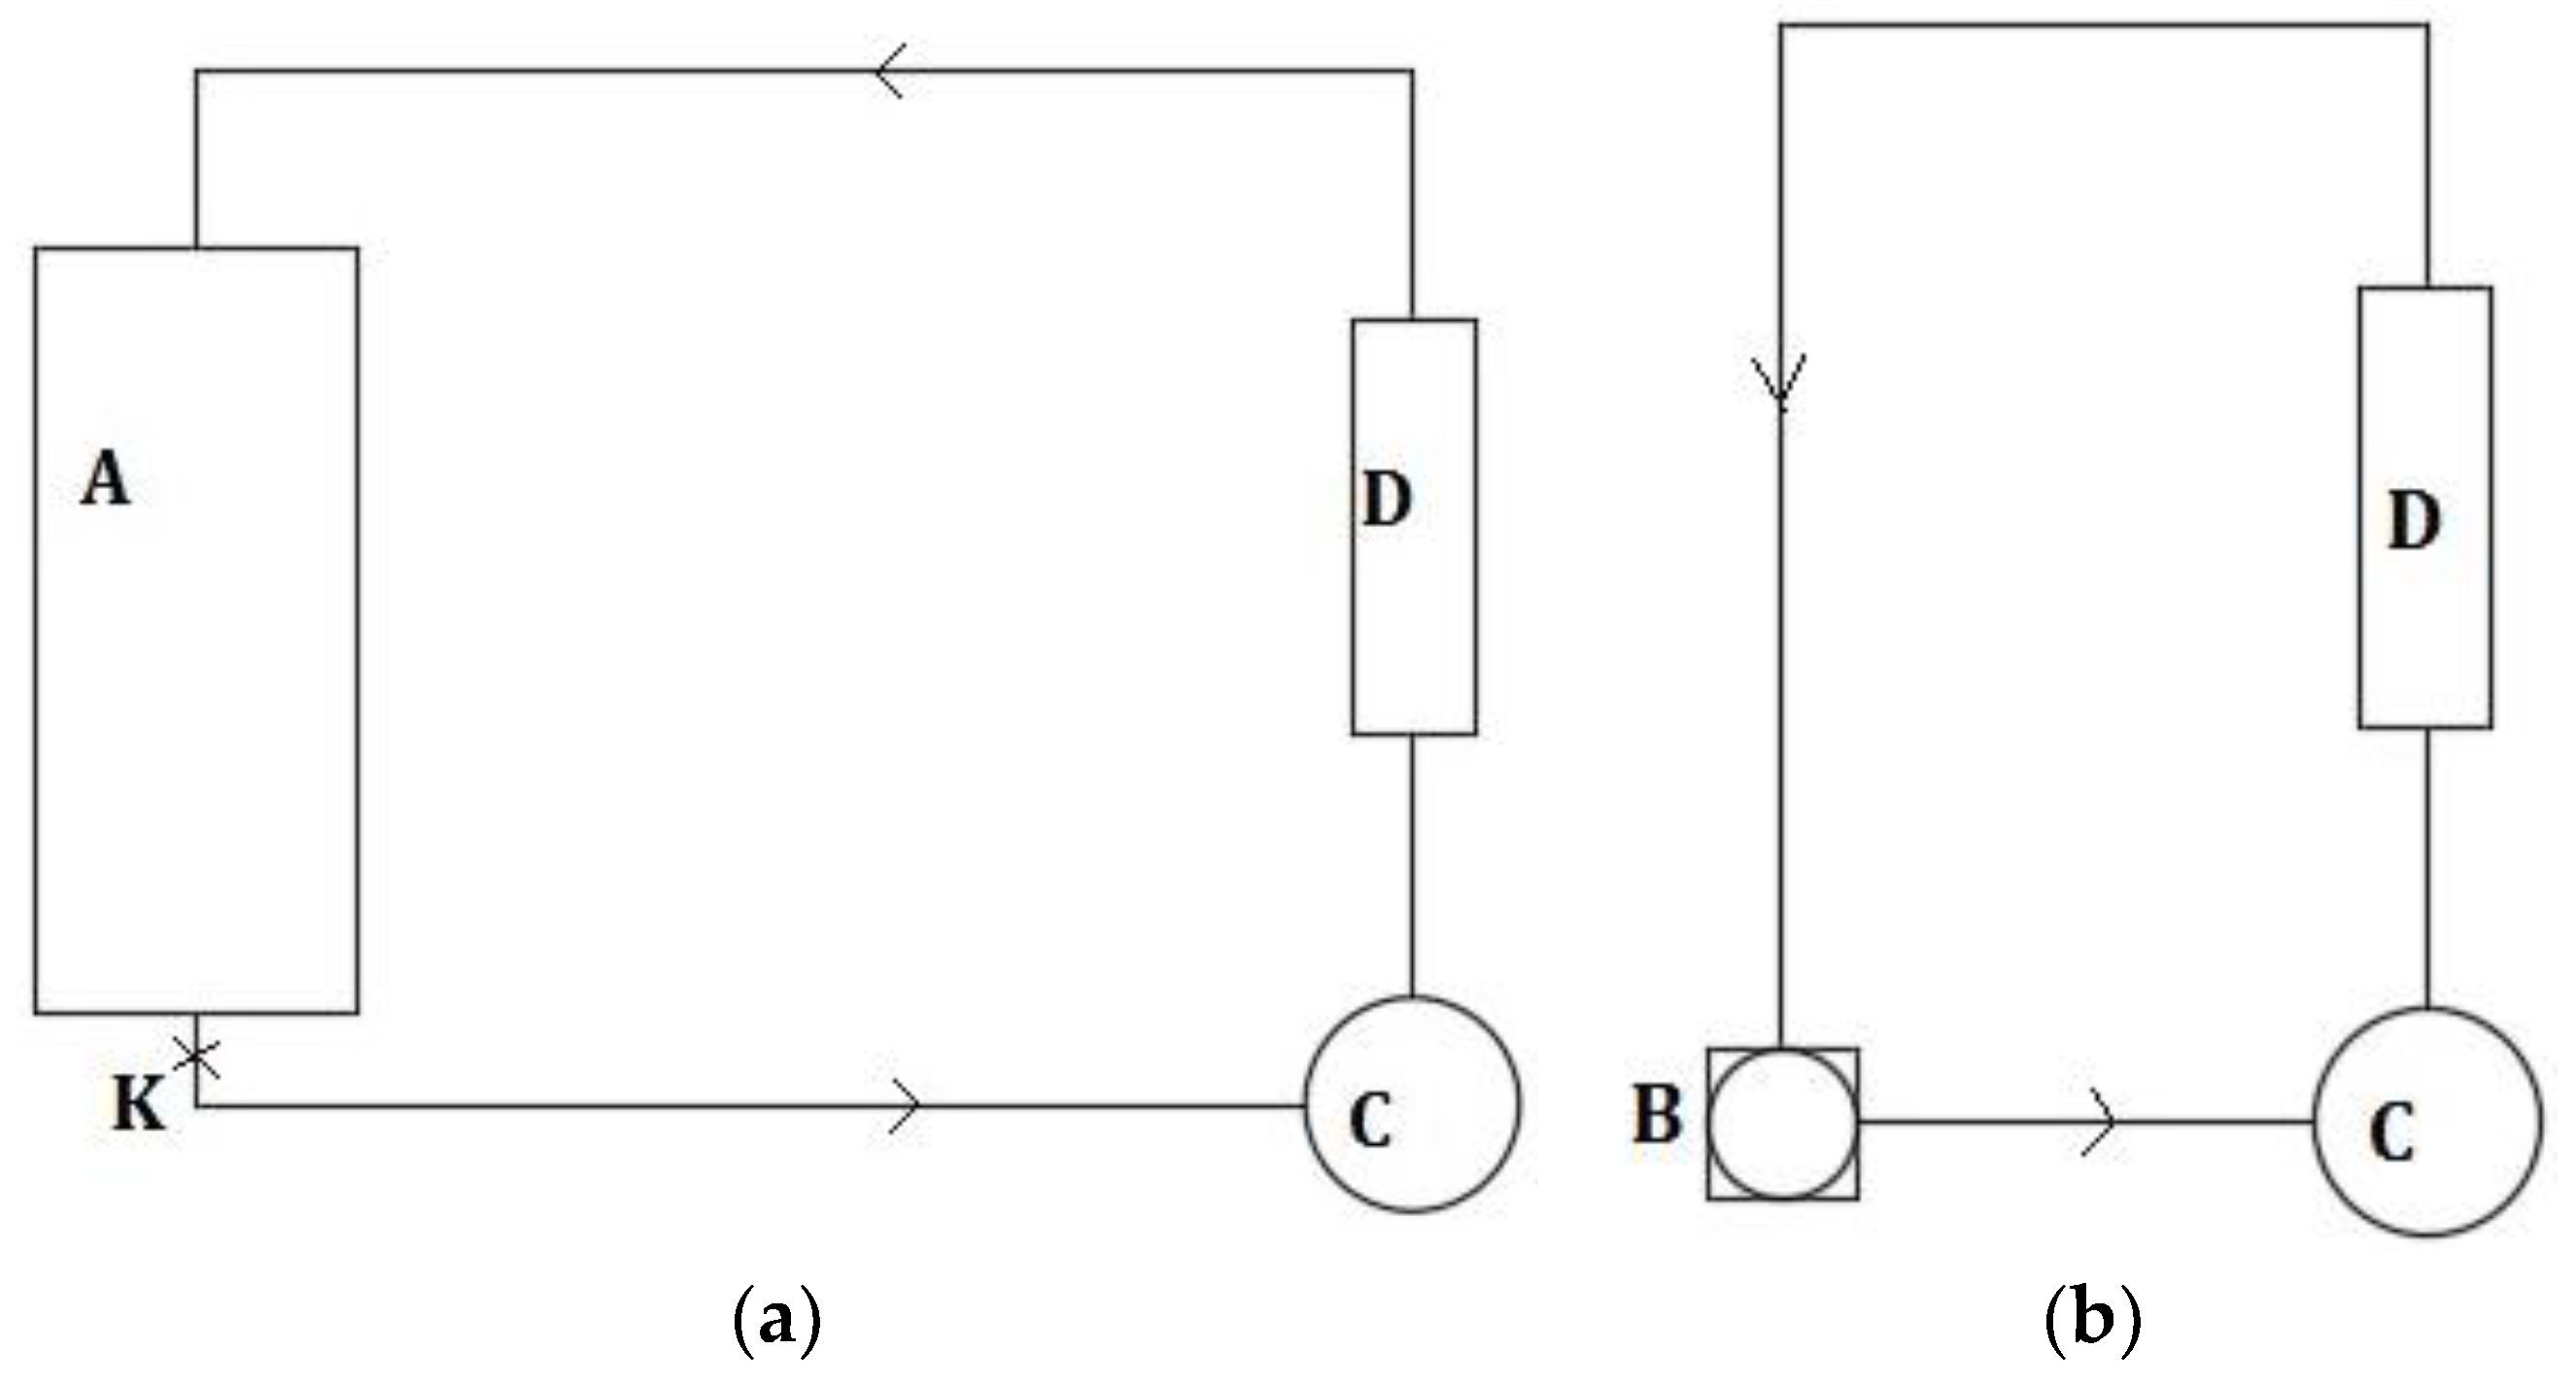
Figure 2 shows, with more detail, the thermal oil circulation cycle:
- -
During the PCM fusion step the heat transfer oil was heated inside equipment A,
Figure 2, which was controlled by a PID Eurotherm controller according to the oil temperature in point K. The centrifugal pump C pumped the fluid towards the PCM heat exchanger D until the PCM was completely liquefied;
- -
During the PCM solidification step, the heat transfer oil extracted heat from the PCM heat exchanger D and transferred this energy towards the environment through the shell and tube heat exchanger B. Again, the centrifugal pump C was responsible for the oil impelling. This step ended with the complete solidification of the PCM.
The PCM heat exchanger was designed according to the following specifications:
- -
Low pressure drop in a single pipe heat exchanger;
- -
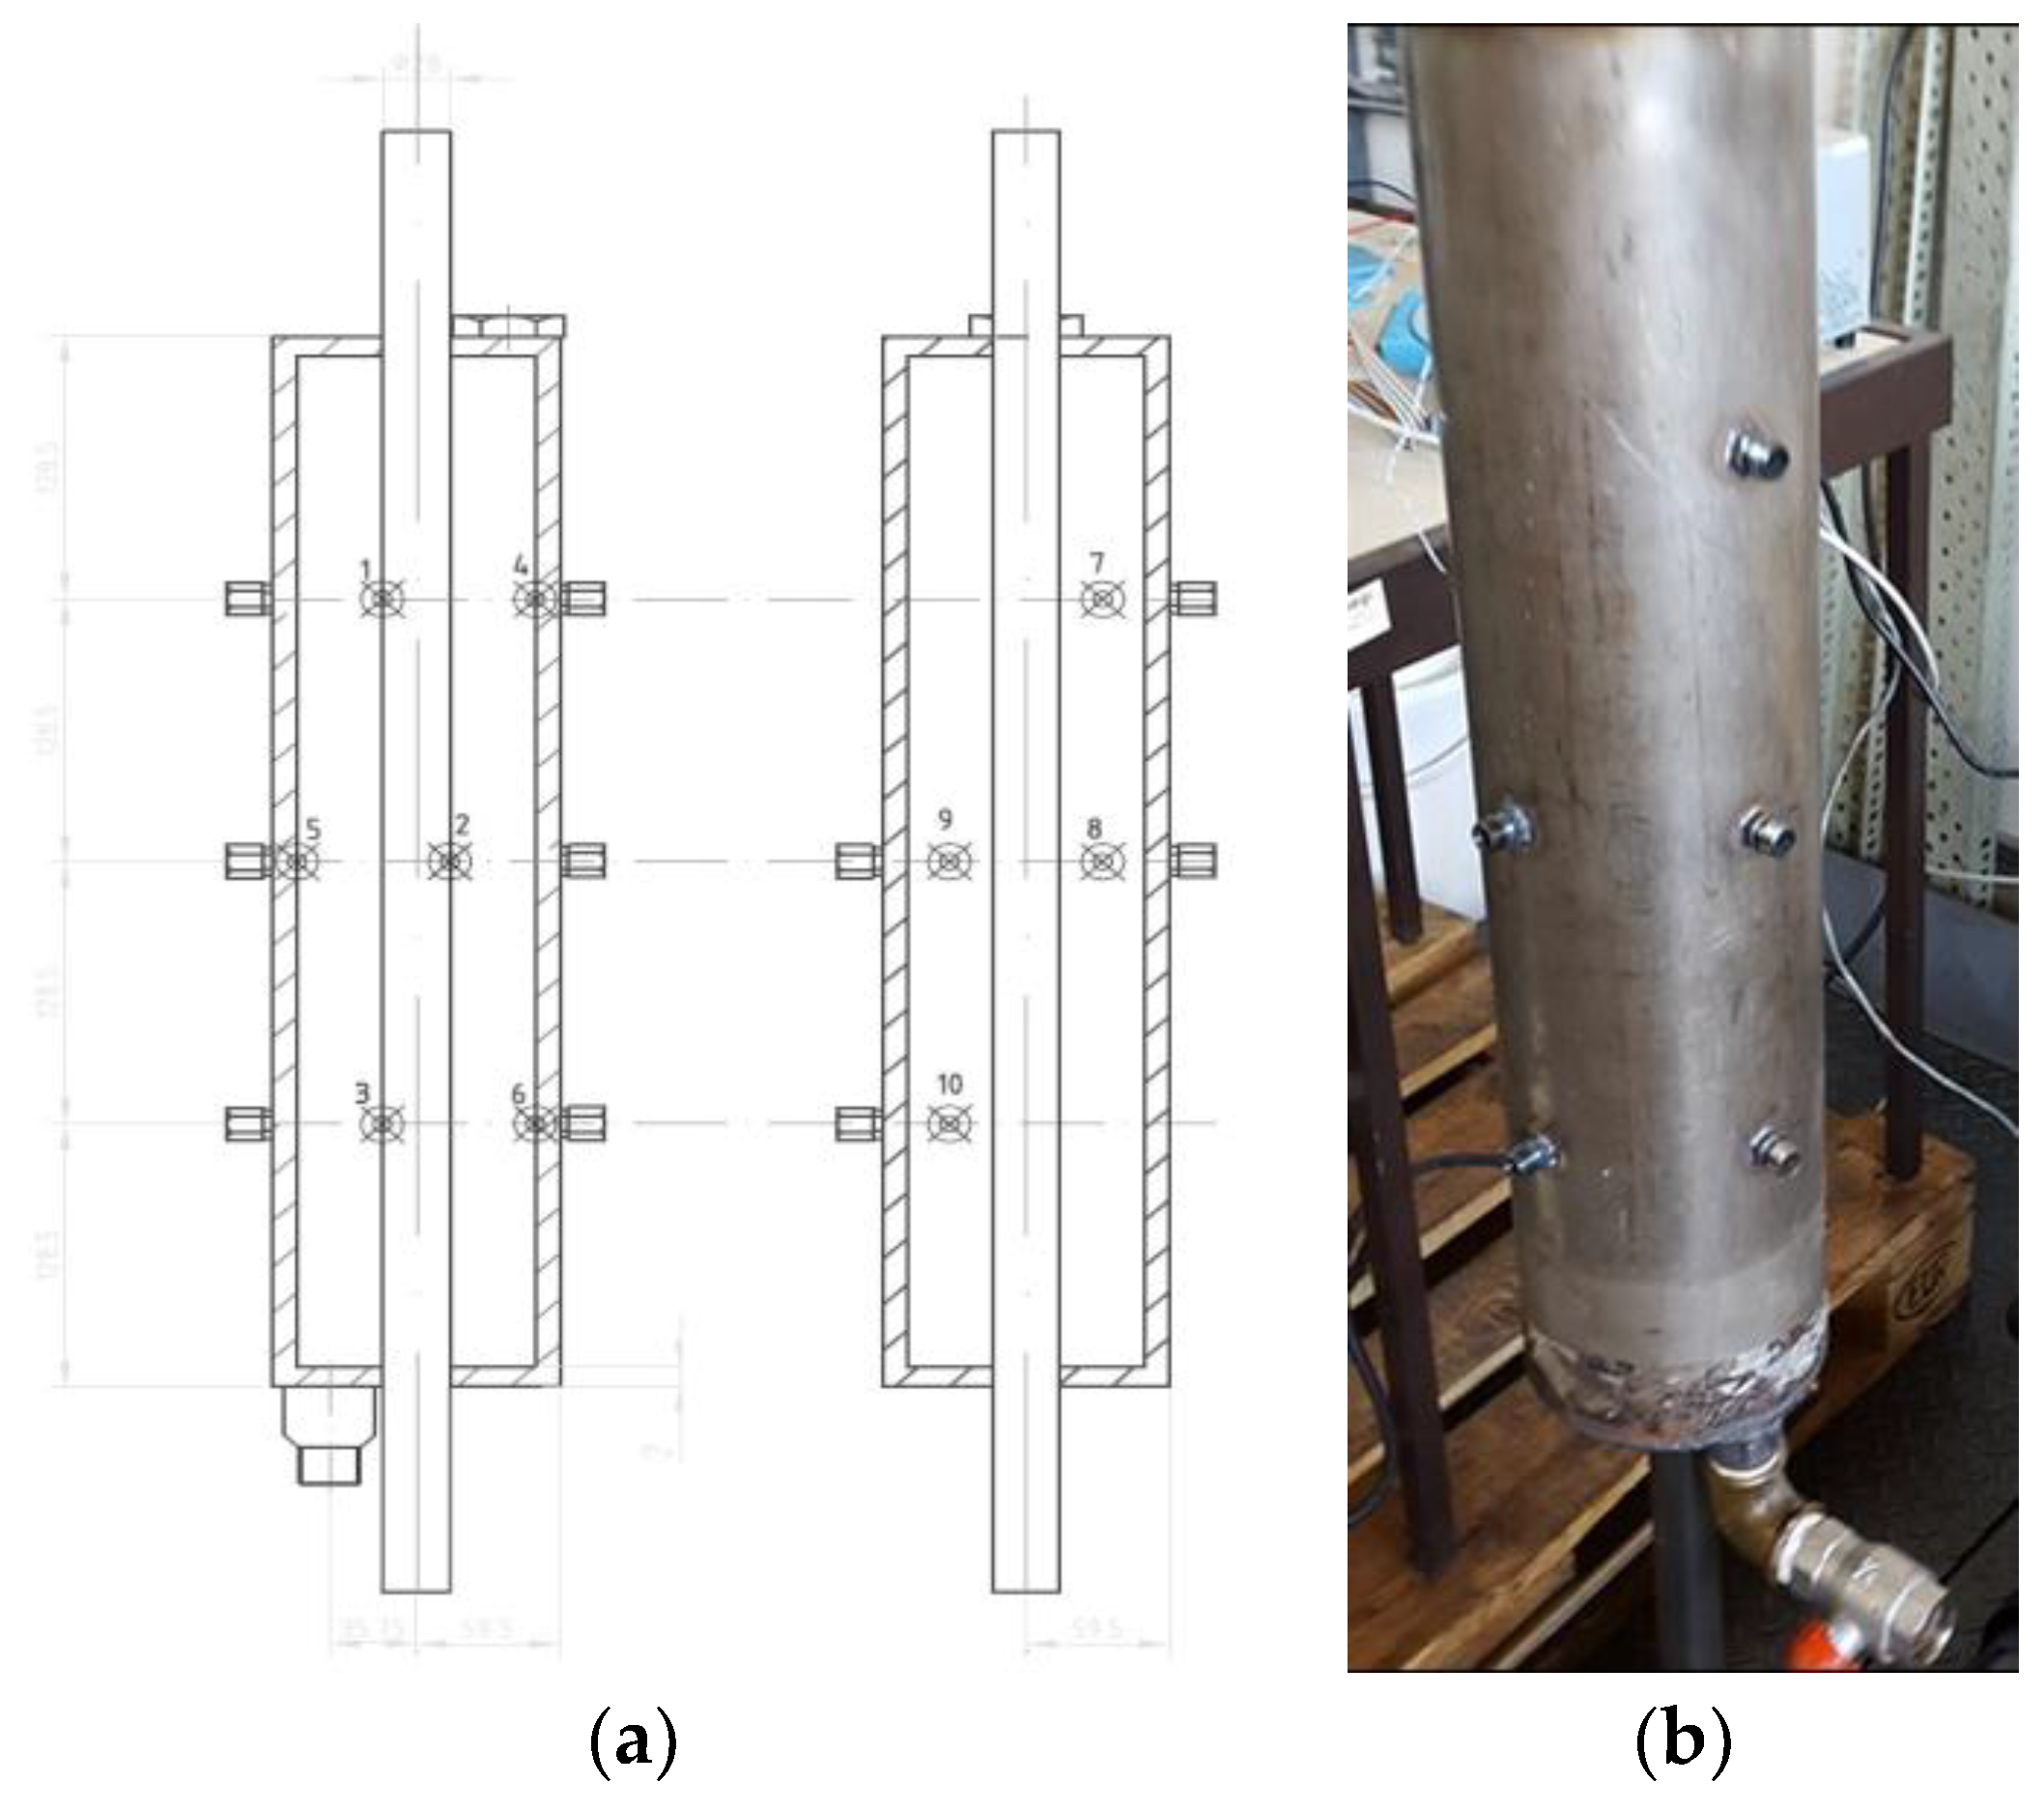
Easy placement of temperature probes to allow the evaluation of radial and axial temperature profiles inside the PCM. The thermocouples positions inside the PCM heat exchanger are shown in
Figure 3. Thermocouples 1 to 3 are close to the external surface of the thermal oil pipe. Thermocouples 4 to 6 are 2 mm below the external shell of the heat exchanger. Thermocouples 7 to 10 are midway between the oil pipe and the exchanger external shell. When jointly evaluating (T1, T2, T3) with (T4, T5, T6) and (T7, T8, T9, T10) it is possible to characterize the axial evolution of the temperature inside the PCM for different radii. When comparing (T1 T7, T4) with (T5, T9, T8, T2) and (T3, T10, T6), it is possible to evaluate the radial evolution of PCM temperature at different levels. Finally, thermocouples T8 and T9 validate the thermal symmetry.
All these thermocouples are type T thermocouples, because they are more suitable for the range of temperatures under analysis and have an uncertainty of ±0.75% above 90 °C [
17,
18].
3. The Phase Change Materials
The main thermal properties of the two tested PCM’s are presented in
Table 1. The H105 PCM is an inorganic material, the salt KNO
3, presented in a granulated form. The material A82 is concerned it is an organic product, a paraffin and it was supplied as a package of small spherical particles.
As can be seen in
Table 1 the density of H105 is twice that of A82. Thus, for the same volume being tested the corresponding mass was double for H105. From measurements of the solid-liquid thermal expansion of both materials it was found that H105 had a thermal expansion of 21% whereas A82 had a thermal expansion of 11%. These values were taken into account during the PCM exchanger filling process.
Table 2 presents the designation of the experiments that were carried according to the corresponding set point temperature and the operating frequency of the centrifugal pump.
The mass and volume flow rates of thermal oil used during the experiments were function of the centrifugal pump operating frequency and are shown in
Table 3 according to the adopted test conditions.
4. Experimental Results
The time evolution of the PCM’s temperature for several points inside the two tested materials is now presented. Through the analysis of the time temperature curves it is possible to validate the different heat transfer regimes taking place during the fusion and solidification processes.
The curves shown for the H105 concern results obtained for the t2 testing conditions while for the A82 the plotted curves concern the t1 experiments. The choice of the presentation of these results is connected with the better perception that can be achieved through the analysis of these experimental curves.
4.1. Characterization of the Axial and Radial Evolution of Temperature during the Fusion Process
During the fusion process the hot thermal oil supplies thermal energy to the PCM contained in the test heat exchanger, while the temperature evolution in several spots inside the PCM is measured. Accordingly, it was possible to evaluate the axial temperature evolution at different radii as well as the radial temperature evolution for different heights.
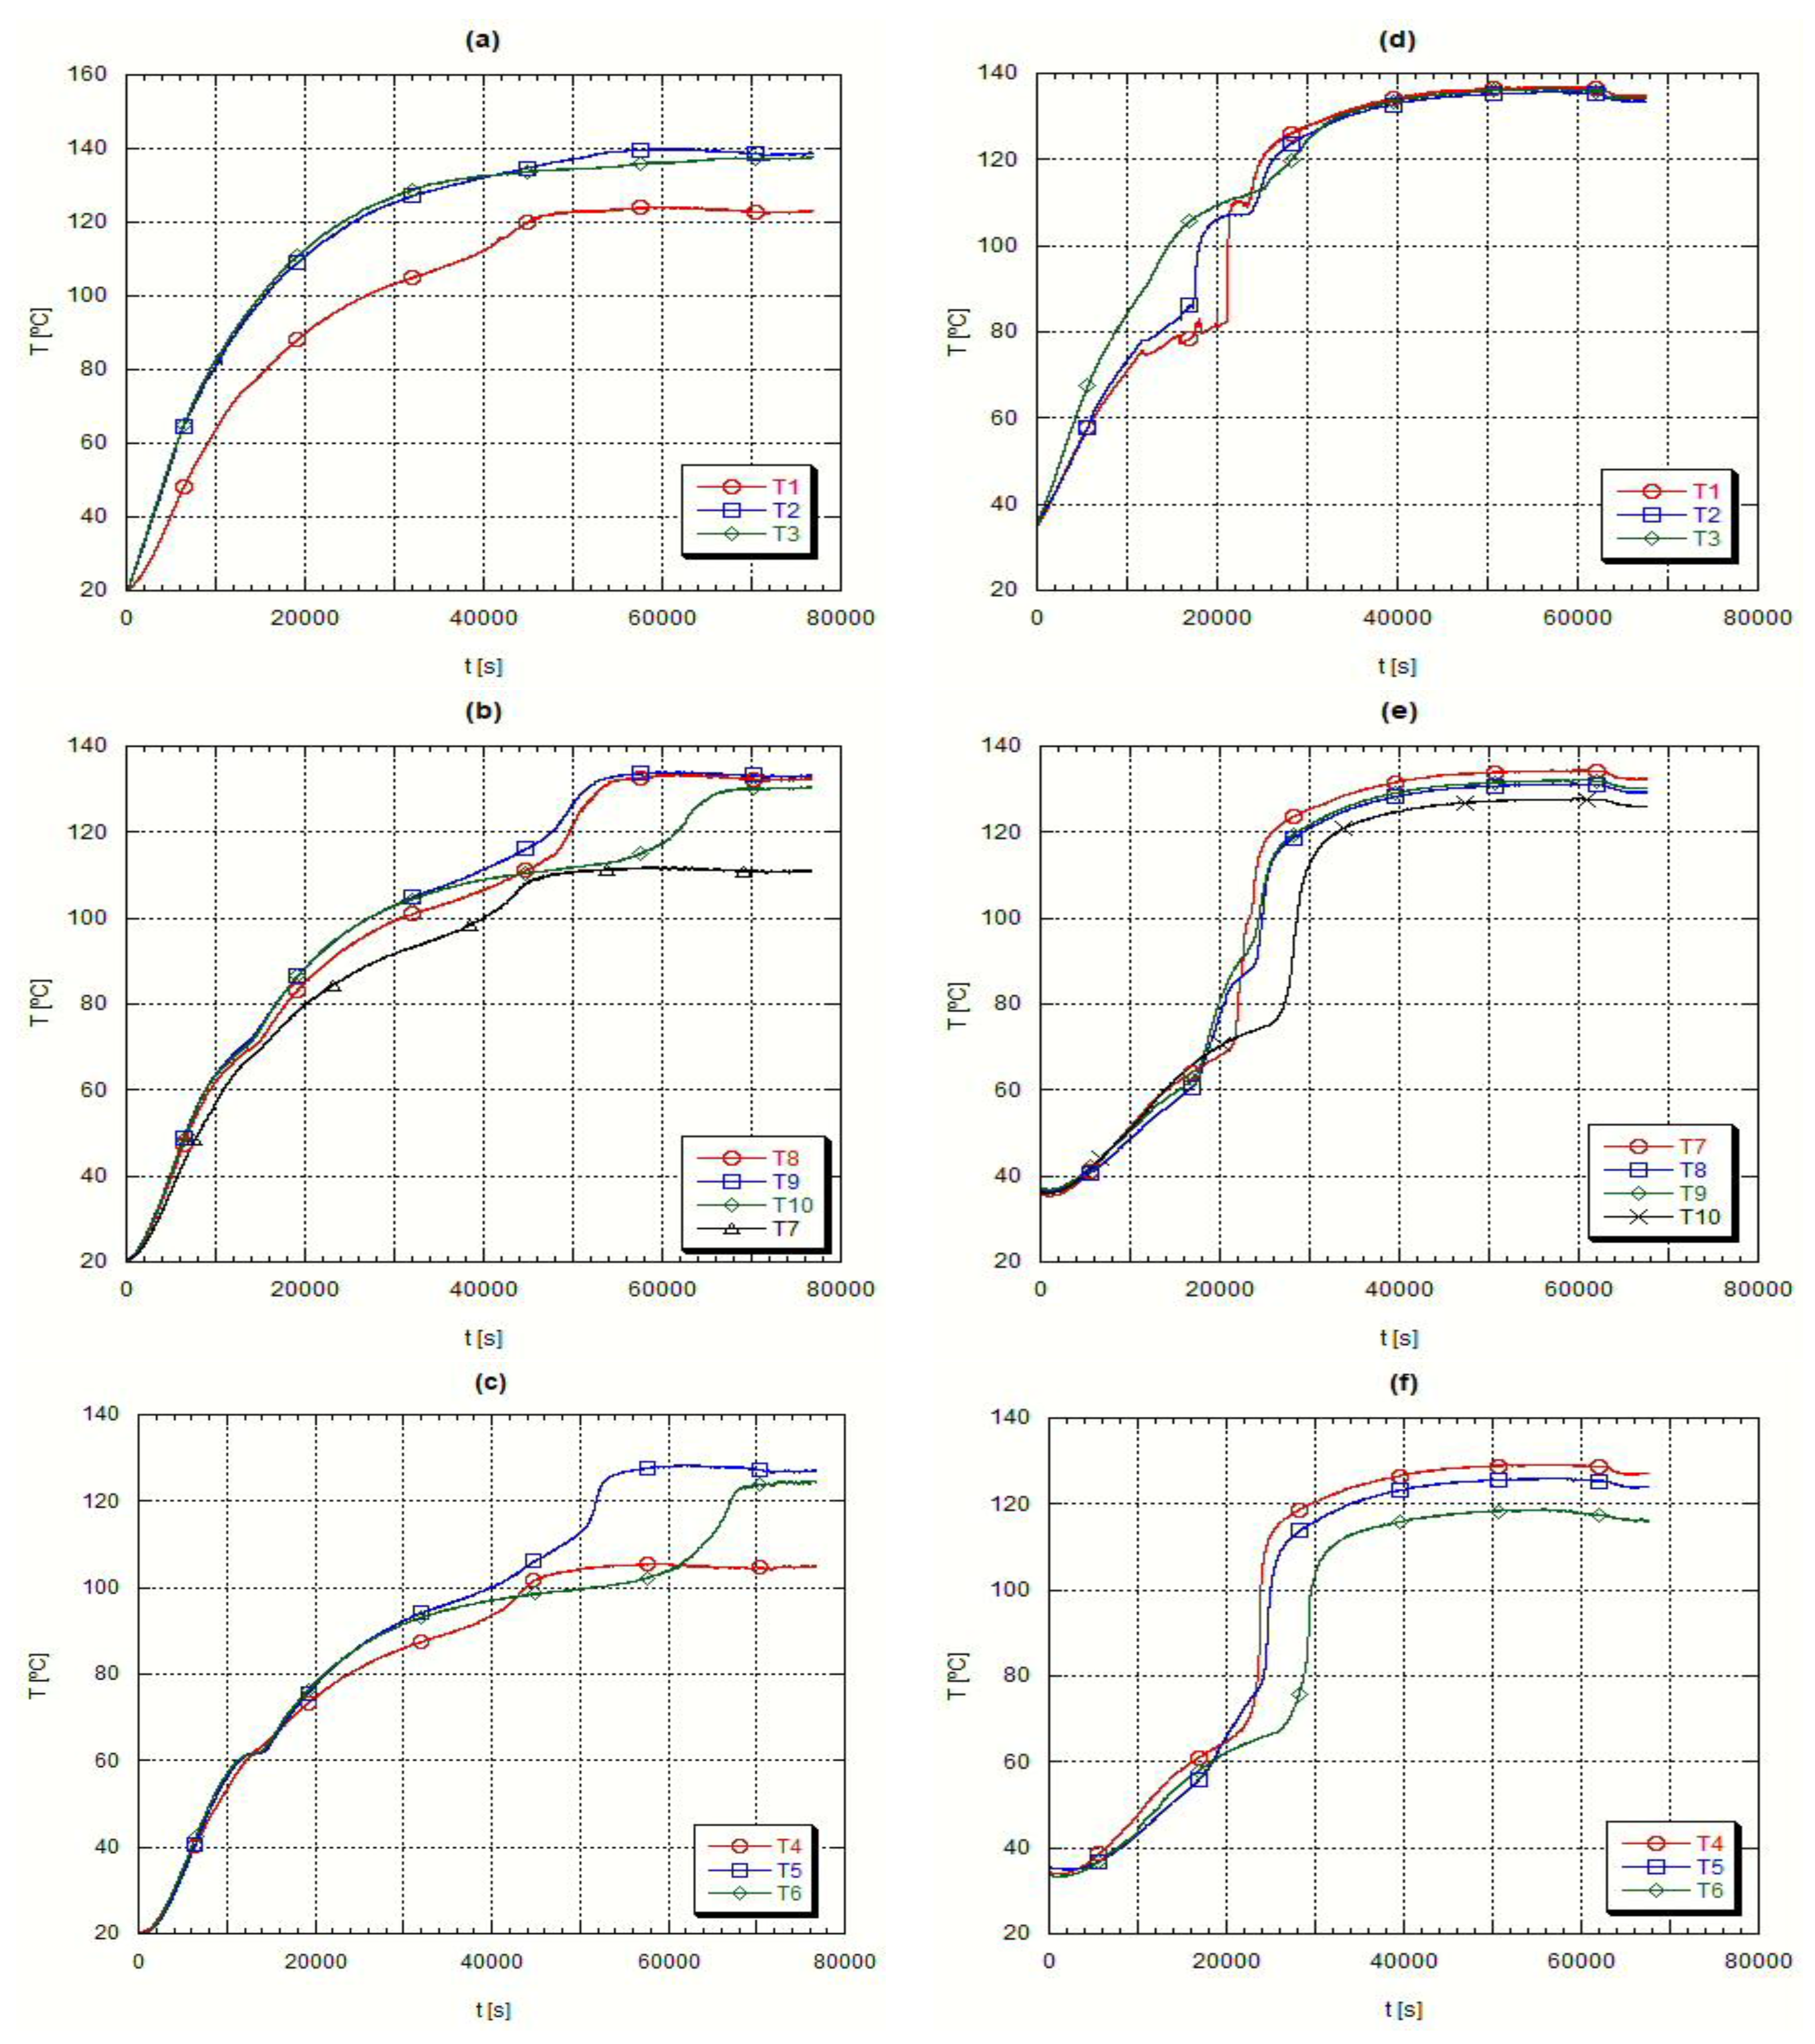
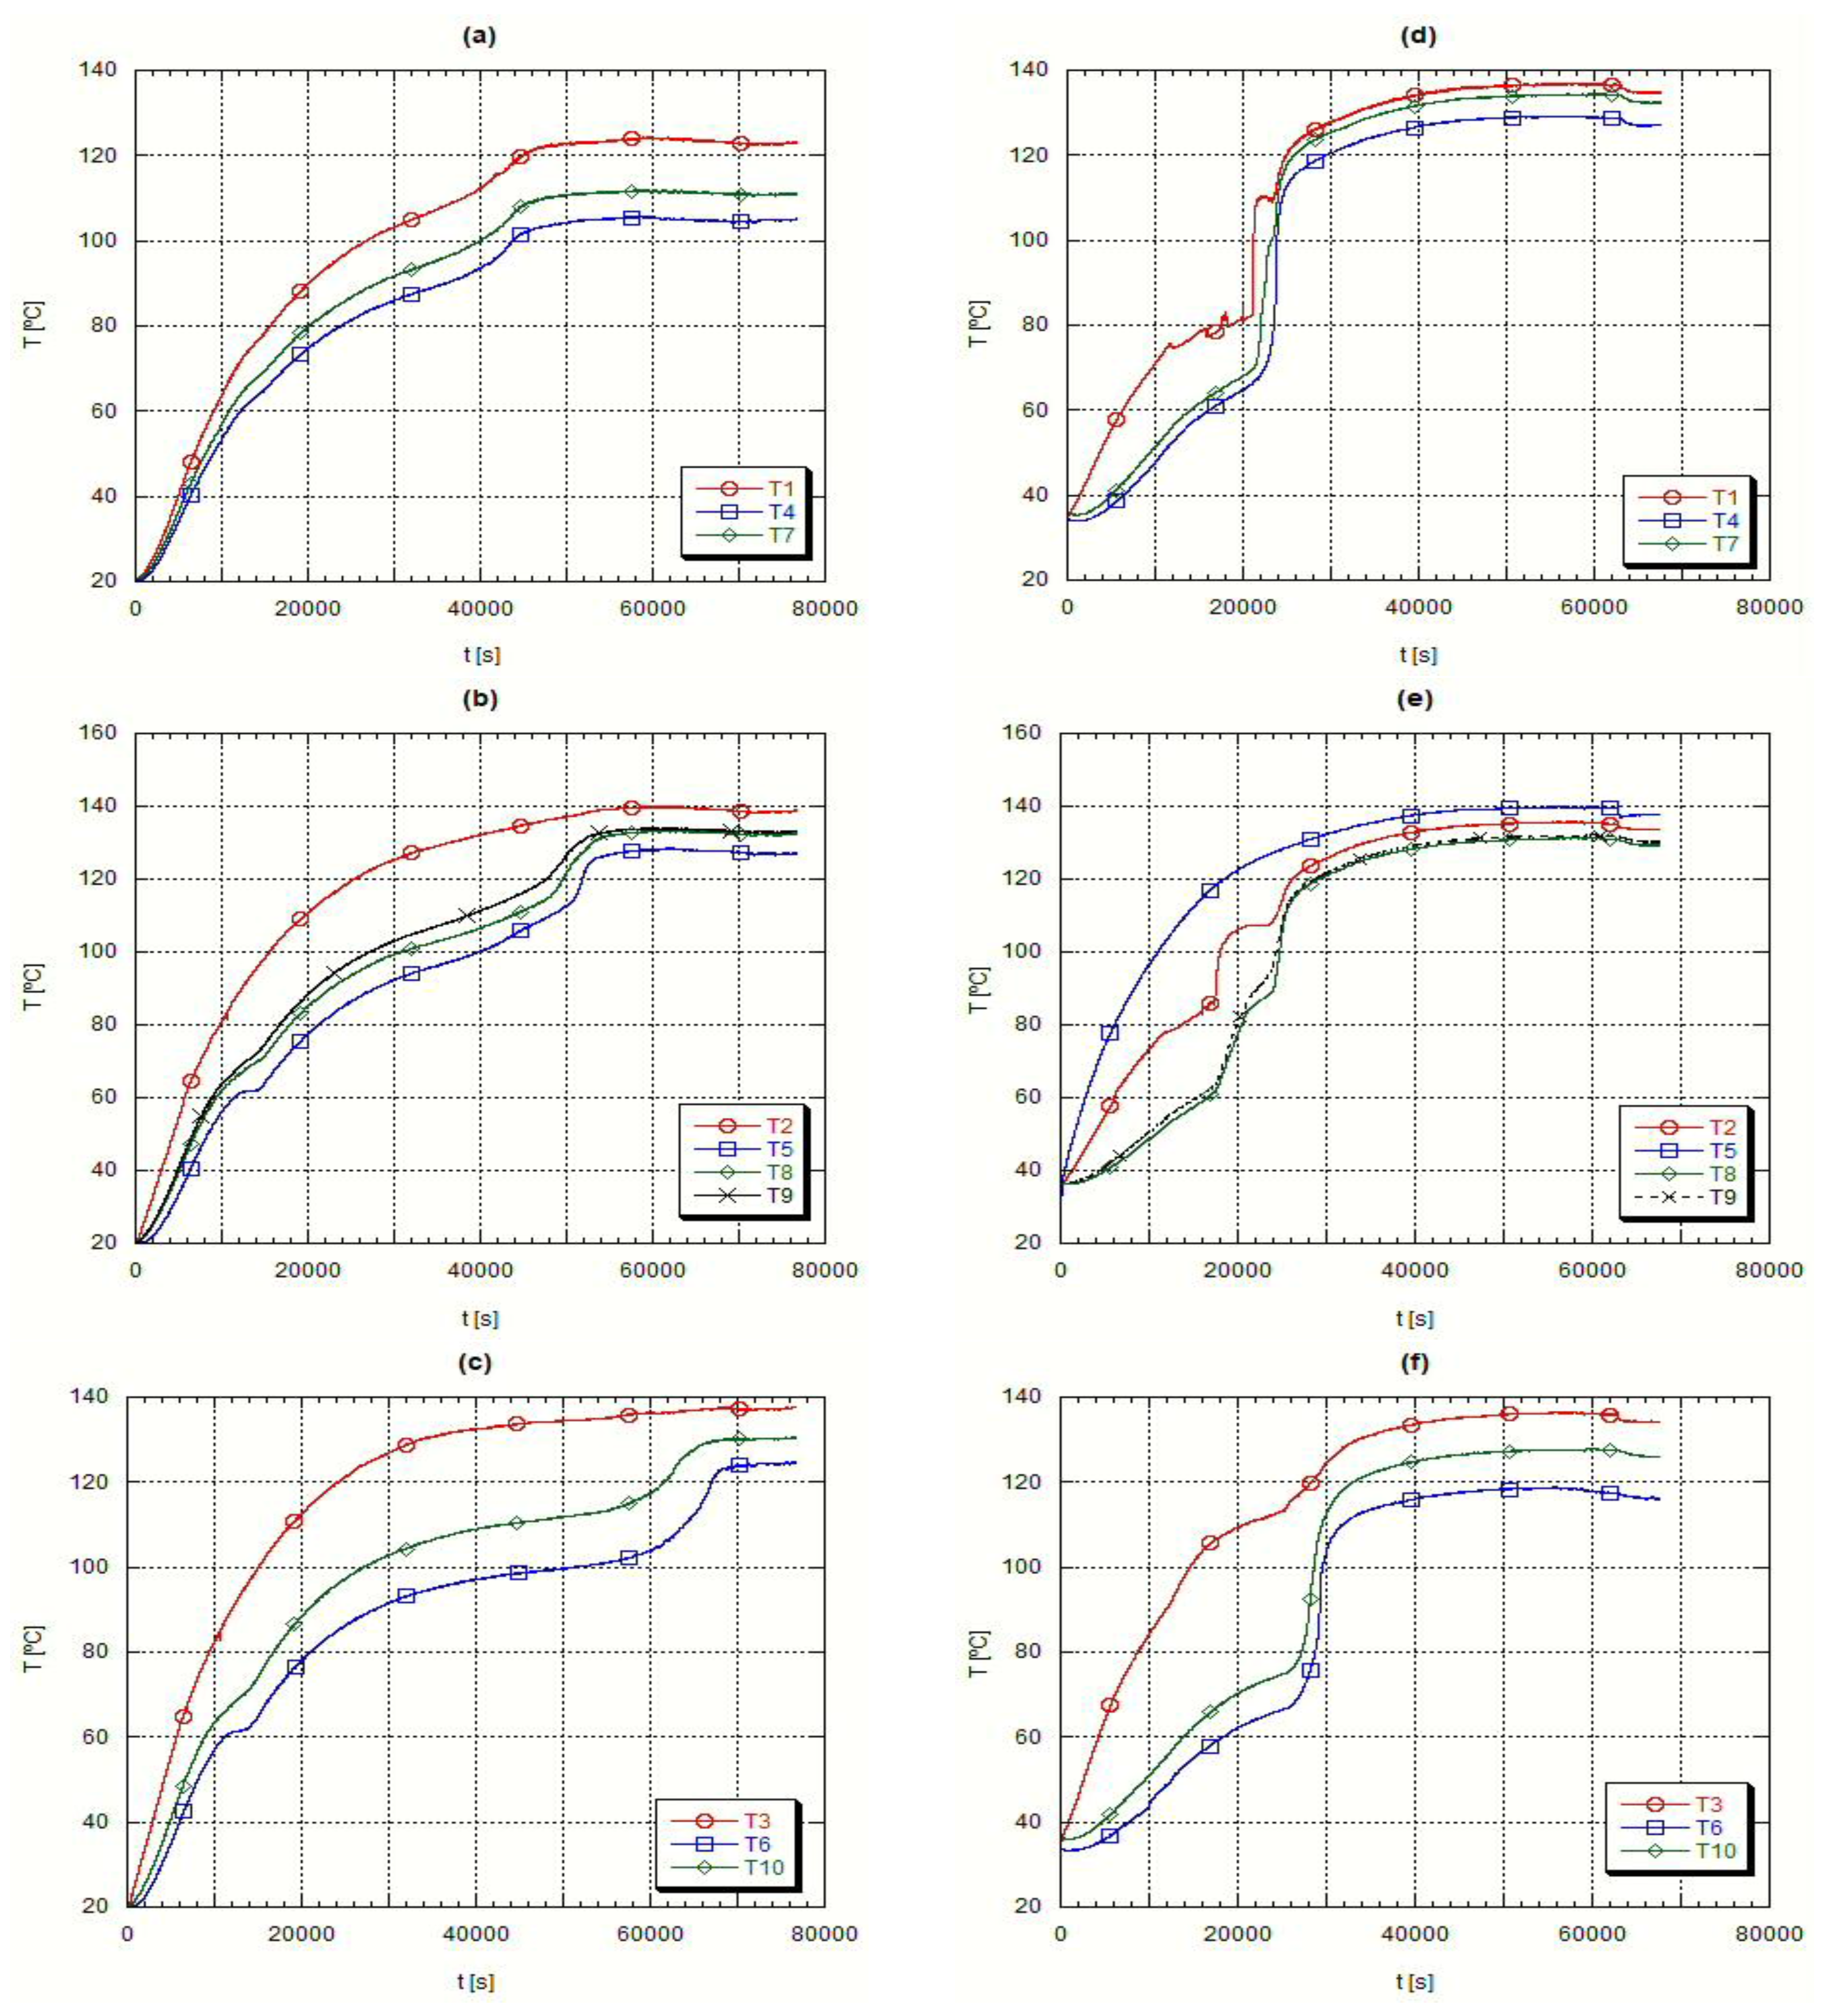
Figure 4 presents the axial temperature evolution while
Figure 5 presents the radial temperature evolution for the same fusion experiment.
The PCM fusion starts in the lower region, close to the external wall of the inner pipe, plots (a) and (d) in
Figure 4, obtained with thermocouple T3. In the following time instants, the PCM moves up to the top of the container, due to natural convection currents occurring because of the strong density differences between the solid and the liquid phase. Because of this sudden rise of the fused PCM there is an anticipated liquefaction of both the upper and lower regions, plots (a) and (d) in
Figure 4 and
Figure 5, resulting on the formation of a conic geometry in the solid-liquid interface. Because of this conic evolution of the material fusion, the readings from thermocouple T6, placed at a lower external level in the test heat exchanger, presented a longer phase change delay, plots (c) and (f) from
Figure 4 and
Figure 5. During this fusion process, liquid and solid co-exist in close contact. The conduction is the unique heat transfer mechanism in the solid phase and the thermal conductivity is low in the PCM’s. Such is clearly detectable in the radial temperature evolutions, plots (b) to (d) in
Figure 5, where, as far as the thermocouples are from the heat transfer surface, the external surface of the inner pipe, the slower is the event of fusion. It is also quite clear, by looking at the thermocouple data, the evidence of the conical geometry, i.e., the solid-liquid interface. However as soon as the liquid phase appears, the solid phase starts receiving convection heat transfer from the liquid phase remaining in the upper layers of the shell side. Concerning the liquid phase, the density induced differences promoted by the temperature variations increase the heat transfer rate and obviously the PCM circulation. This explains the higher temperature values at its uppermost surface,
Figure 5 plot (d).
However, when looking at the initial results obtained with the thermocouples T1, T4 and T7 for the H105 PCM,
Figure 5 plot (a), it is necessary to remember that this material has a thermal expansion coefficient superior to that of A82 and because of that the volume occupied by the H105 in the solid phase is smaller and the initial temperature values measured by those thermocouples refer to the air remaining above the material. Afterwards, the sudden temperature jump detected by those thermocouples refers to the corresponding liquid temperature reading, resulting from the solid fusion and expansion,
Figure 5 plot (a). This does not happen with A82, where the thermocouples T1, T4 and T7 are initially reading the solid phase temperature of A82. Finally, the closeness of data collected by the thermocouples T8 and T9, plots (b) and (e) from
Figure 4 and
Figure 5, clearly demonstrate that there is geometrical symmetry, geometry of boundary conditions and a uniform liquid mass distribution inside the testing PCM exchanger.
4.2. Characterization of the Axial and Radial Evolution of Temperature during the Solidification Process
Immediately after the fusion step the temperature and circulation rate of the heat transfer oil were adjusted to start the heat extraction from the liquid PCM.
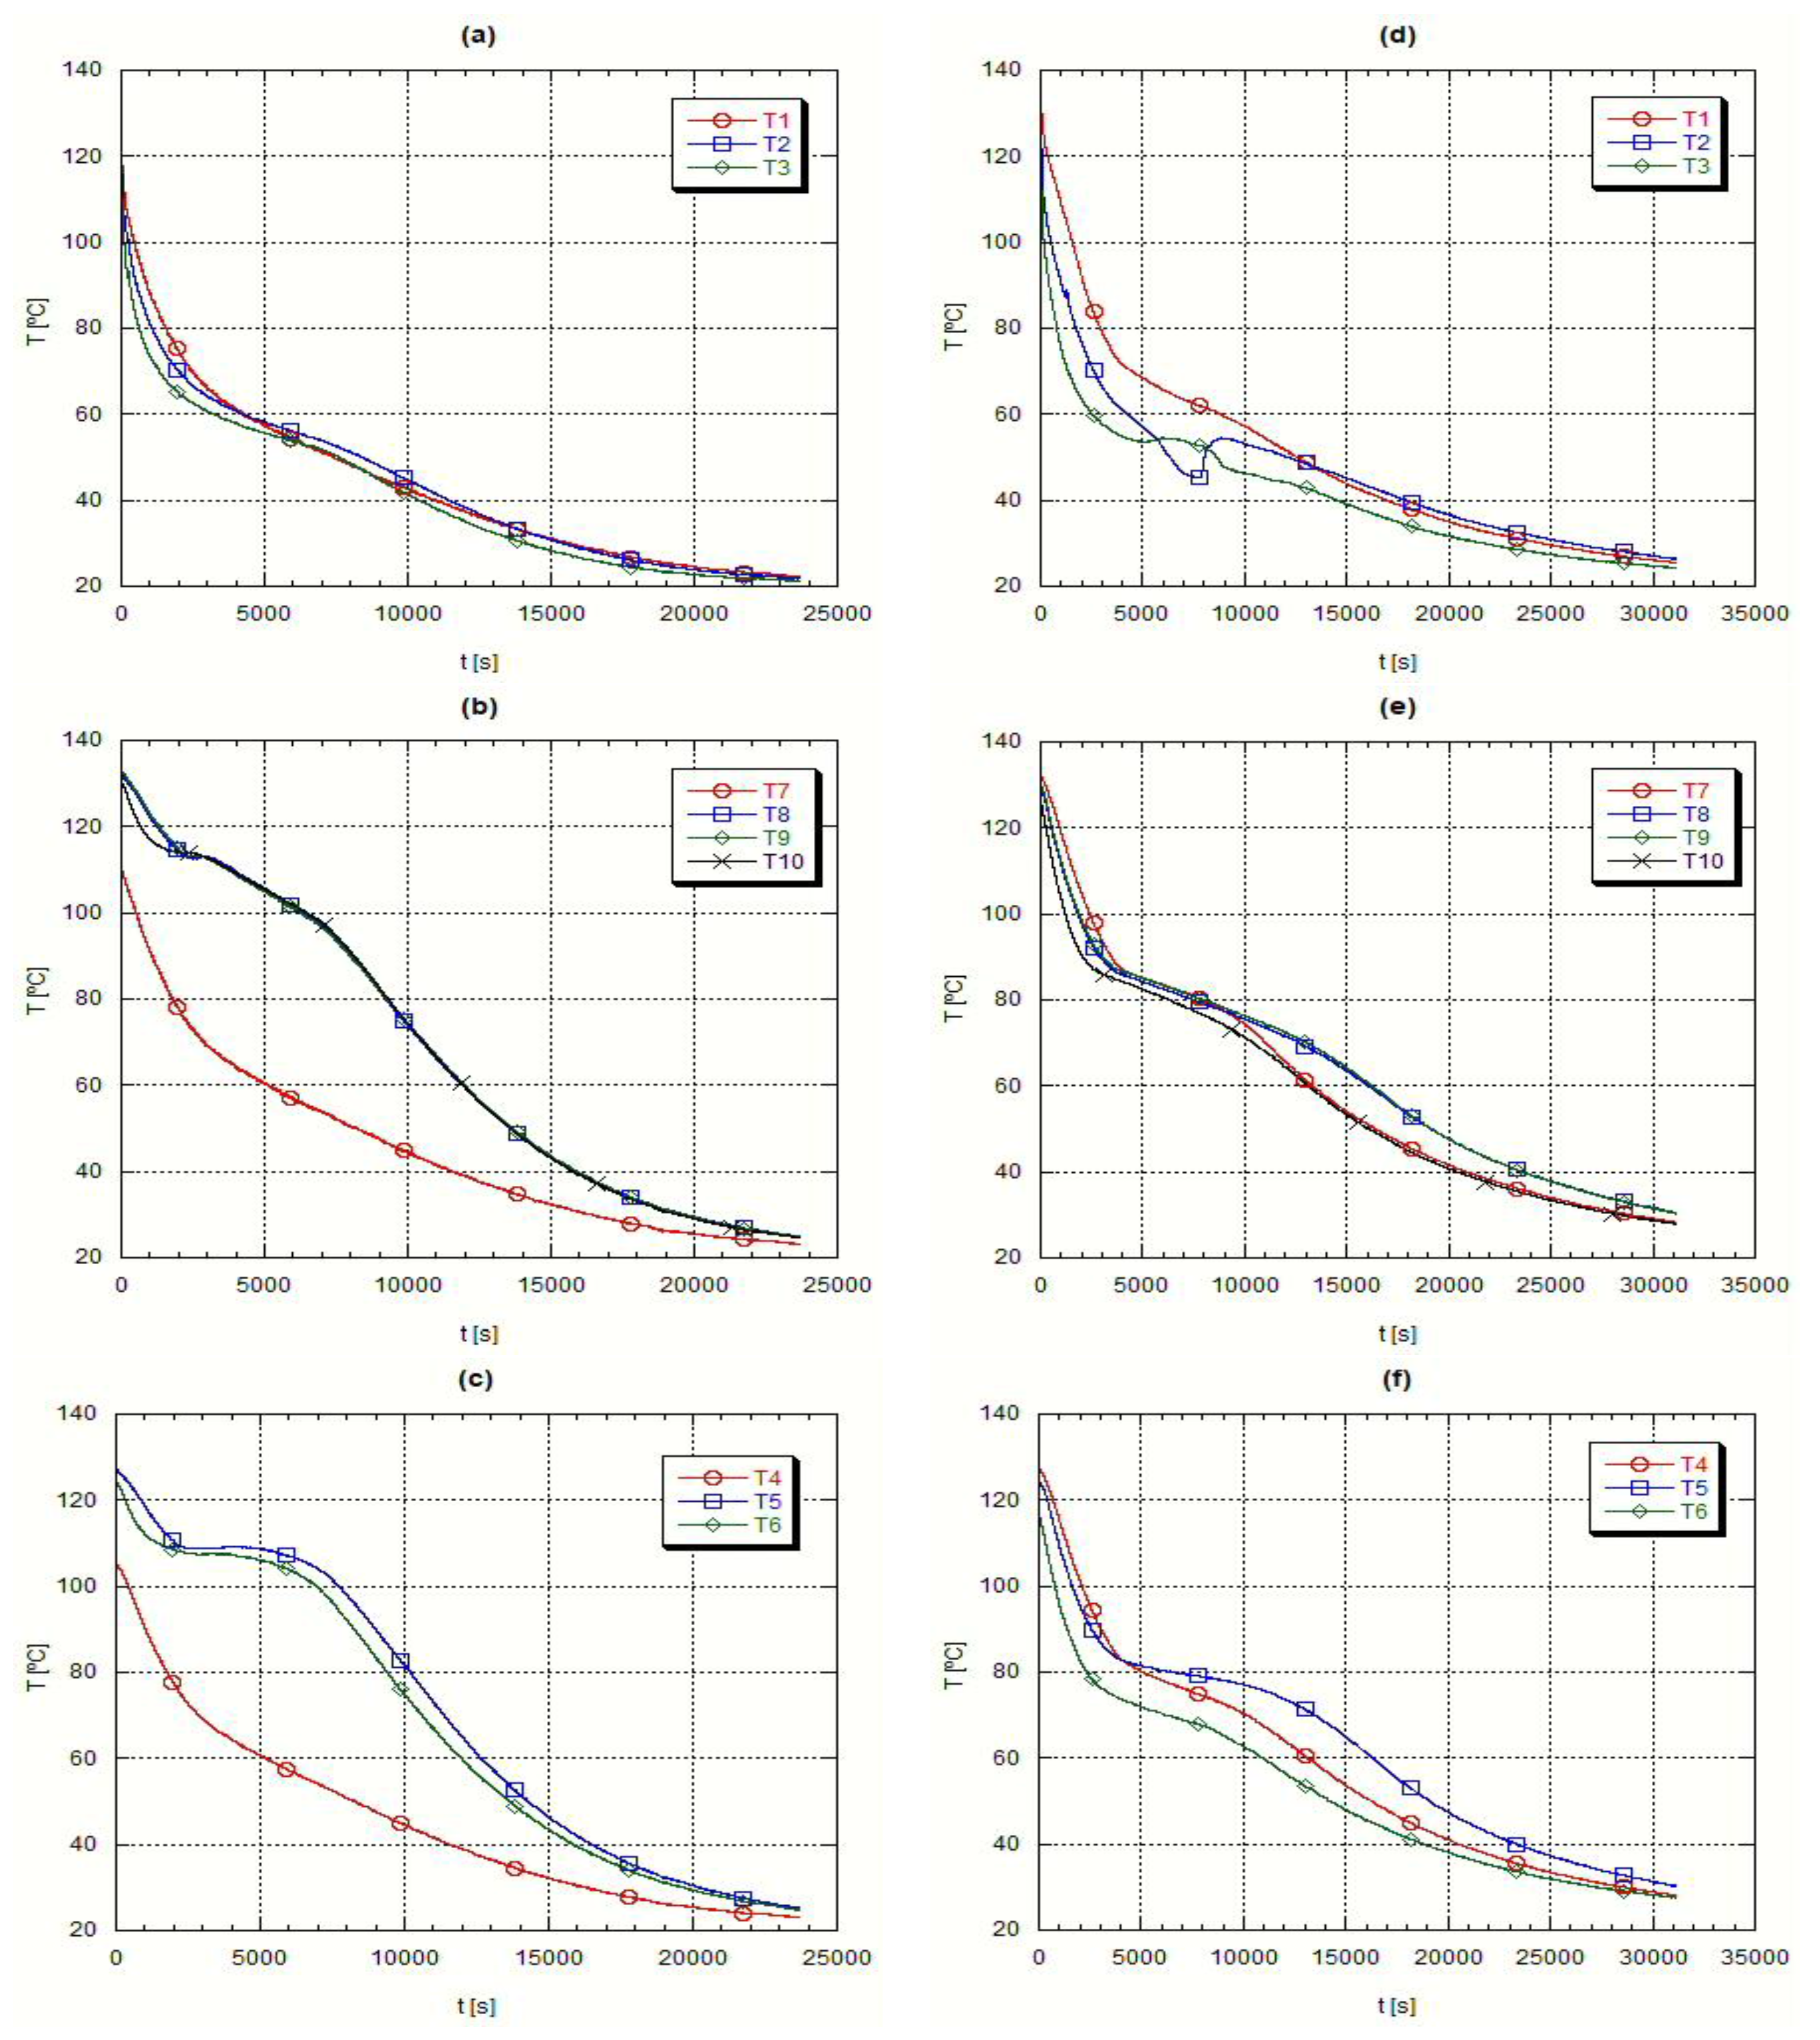
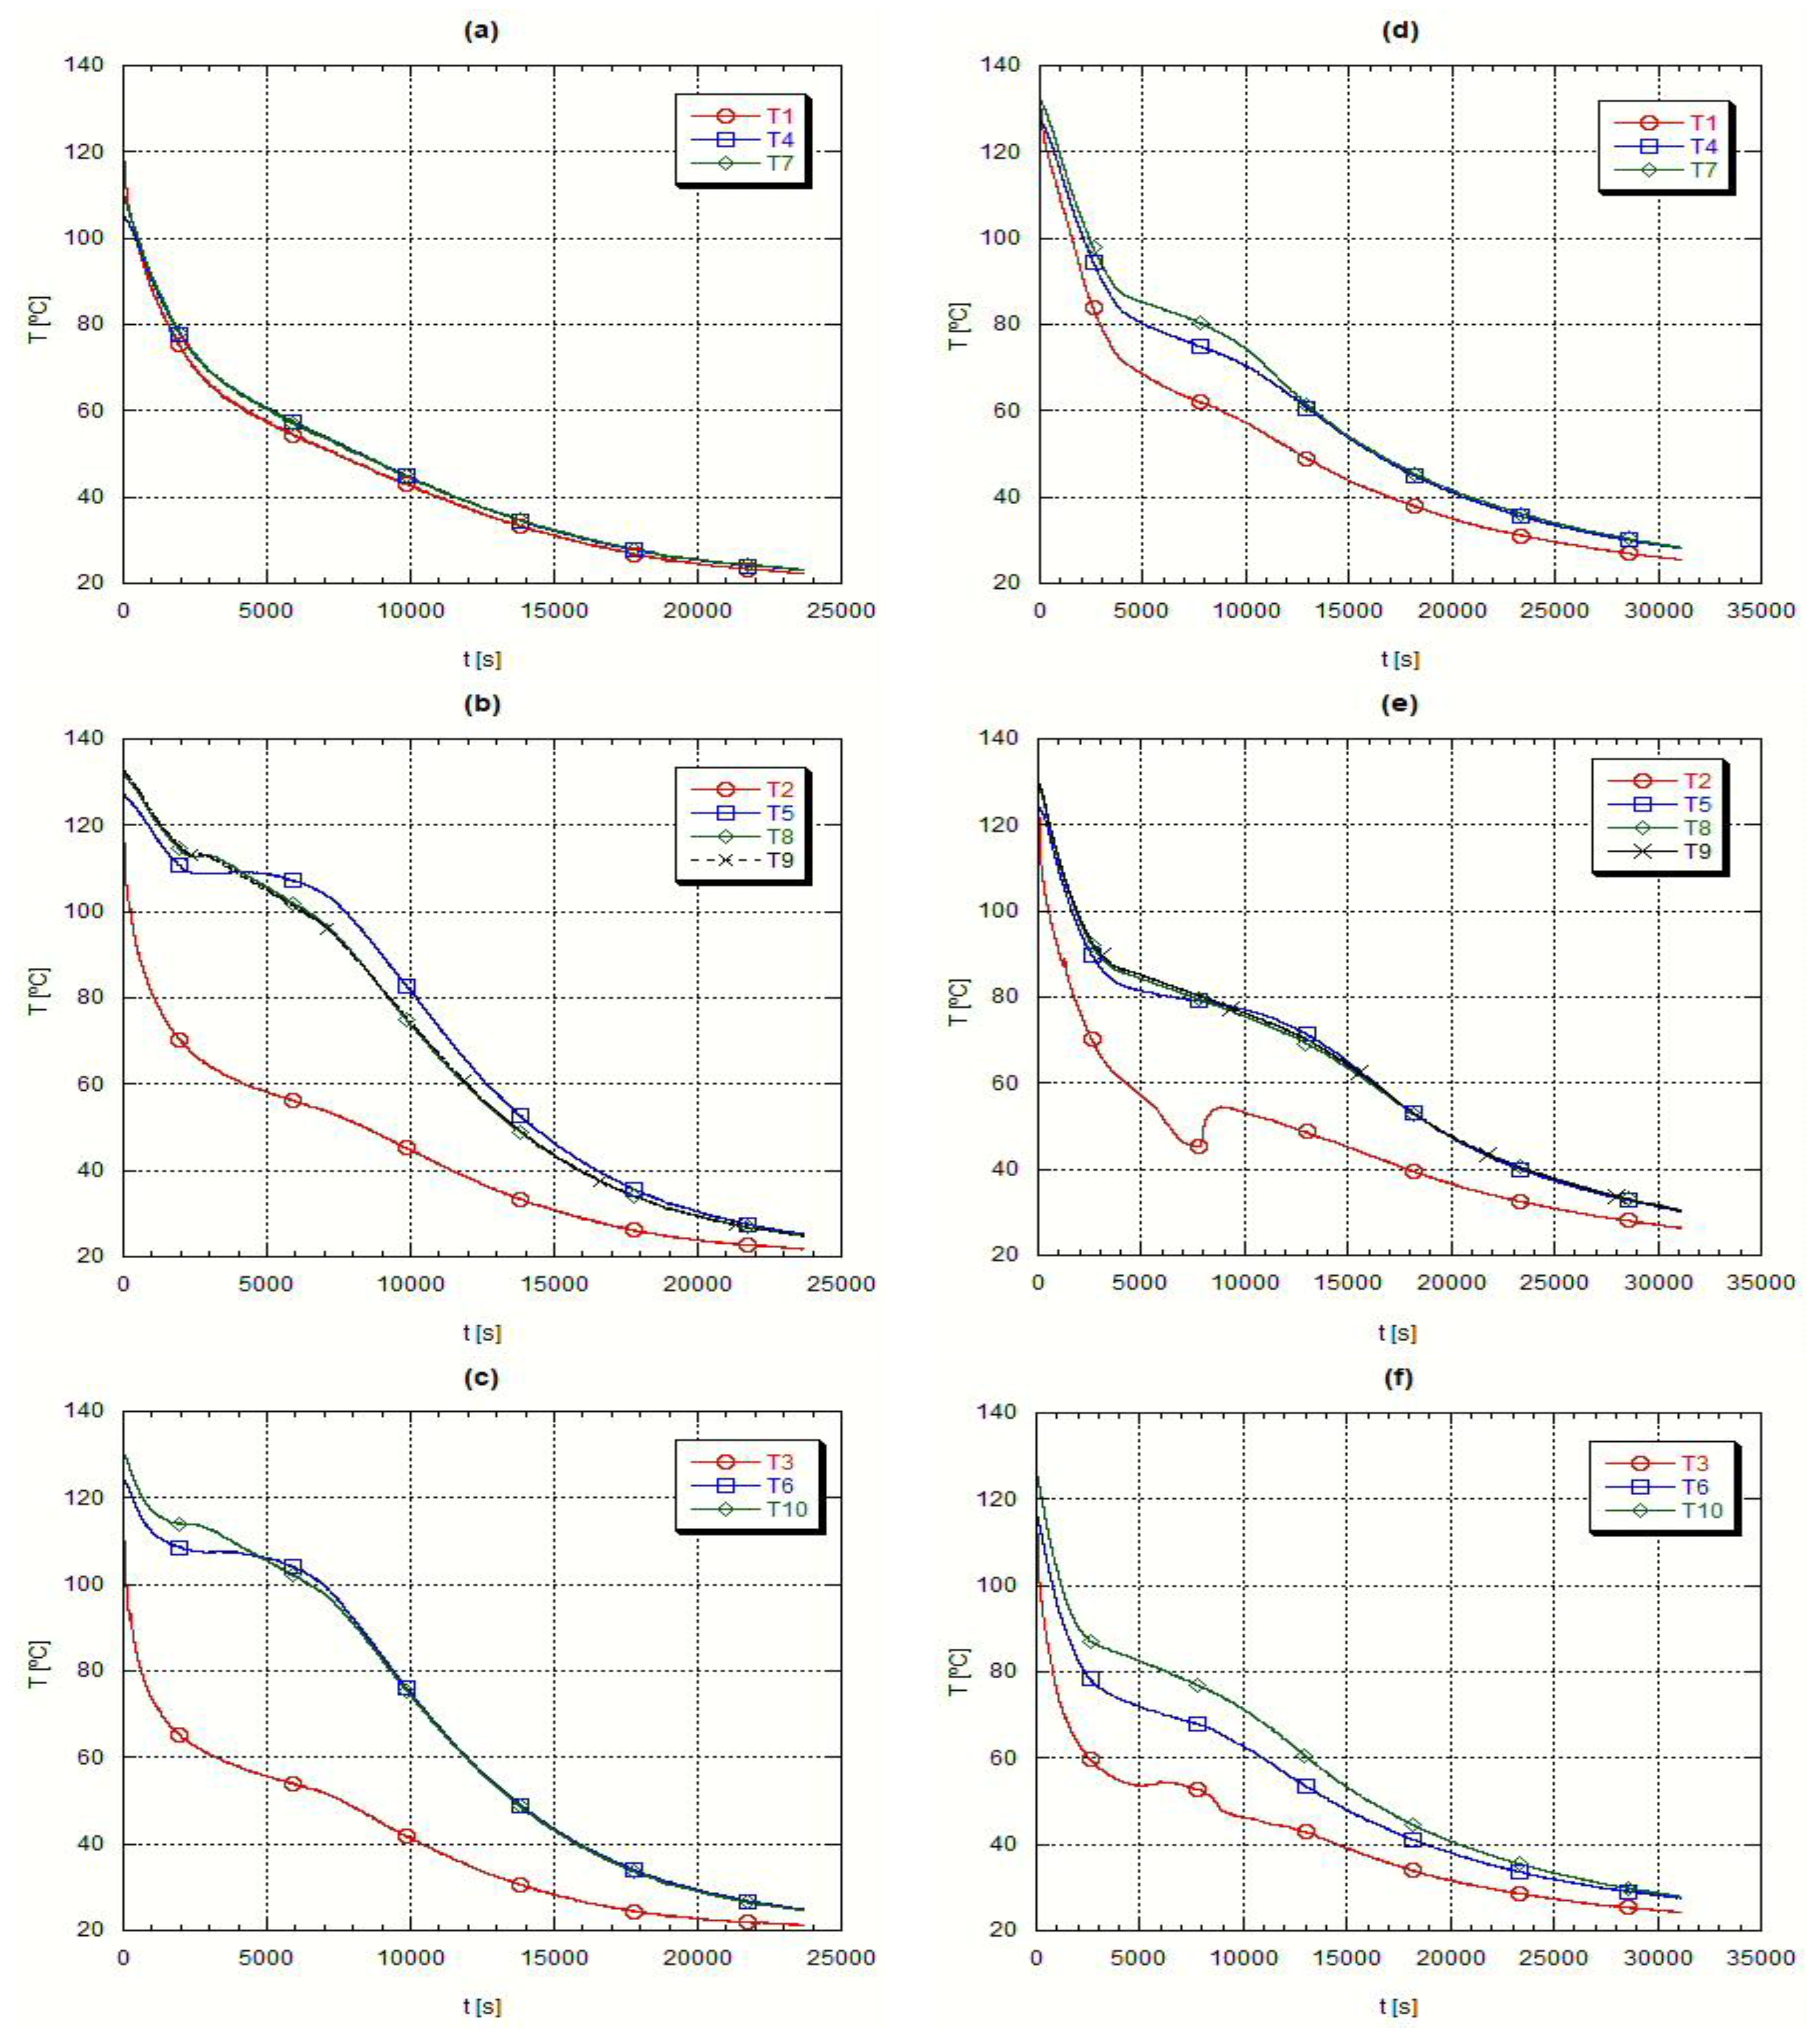
Figure 6 presents the axial temperature evolution during the solidification step, whereas
Figure 7 presents the corresponding radial temperature evolution. In the first instants of the cooling process it is detected an abrupt temperature drop, followed by a smaller temperature gradient, during which the phase change takes place. If the material was a pure one, a constant temperature time evolution would be found but as it is a mixture there is a temperature interval concerning this change of phase. Finally, at the end of the process, temperature changes with time became slower.
These initial abrupt temperature changes, due to the large thermal differences between the heat transfer oil and the PCM, are demonstrated by the readings from the thermocouples placed close to the external surface of the inner tube crossing the testing heat exchanger,
Figure 6 plots (a) and (d), when the temperature readings closely follow the evolution of the oil temperature. The almost constant temperature periods refer to the change of phase, the most beneficial characteristic of the PCM’s,
Figure 6 plots (b) to (d).
During the solidification, the H105 presents a narrower temperature range, plots (a) to (c) in
Figure 6 and
Figure 8, while A82 has a wider solidification temperature range, plots (d) to (f) in
Figure 6 and
Figure 7. This means that A82 is a mixture of several substances while H105 is closer to a pure substance.
At the end of the solidification process the temperature evolution is slower because the temperature difference between the PCM and the heat transfer oil is smaller. When the PCM solidifies the heat transfer process becomes difficult as the only heat transfer mechanism is solid phase conduction, which is, as repeatedly referred, very small for the PCM’s.
5. Determination of the Global Heat Transfer Coefficient
The next step following the analysis of the evolution of the temperature profiles inside the PCM during fusion and solidification was to determine the global heat transfer coefficient.
5.1. Theoretical Analysis
The energy balance to the test heat exchanger and the heat transfer theory lead to the following equations concerning the thermal power being exchanged between the thermal energy transportation fluid and the PCM,
For the overall heat transfer area, it will be considered the external surface area of the inner pipe existing in the shell and tube heat exchanger. Through this inner pipe flows the heat transfer oil. As far as the mean logarithmic temperature is concerned, it must be taken into account that in the shell side of the test heat exchanger there is no fluid flow. As such a simplified mathematical approach will be used, according to many found in the scientific literature [
19], to properly quantify the amount of thermal energy transferred between the heat transfer fluid and the PCM.
The thermal power that the heat transfer fluid sends or receives from the PCM, when considering an infinitesimal volume element of the test heat exchanger, is given by,
and as expected it is only sensible heat. As far as the PCM is concerned, when the heat being transferred takes place while the material is only in the solid or in the liquid phase,
whereas for an infinitesimal time interval and for the material inside the shell side of the test heat exchanger,
In Equation (4)
is the thermal oil mass flow rate,
is the specific heat of the thermal oil and
the infinitesimal temperature variation of the fluid. In Equations (5) and (6)
is the mass of the PCM and
its corresponding specific heat. Considering also an infinitesimal time interval but for the heat transfer fluid, it can be written that,
So, for the infinitesimal element of test heat exchanger Equation (2) changes to,
where
is the temperature differential between the heat transfer oil and the PCM. For an infinitesimal time interval, this last temperature difference can be written as,
Combining Equations (6), (7) and (9),
and then combining Equations (8) and (10),
For this type of heat exchanger, the temperatures
,
and
change along the operation time and thus the integration of Equation (11) along the life time of the process becomes quite complicated, unless a simple approach is considered. It will be assumed that when
, being
a finite albeit very small time interval, it can be assumed that,
,
and
. Then the integration of Equation (11) is rather simple
or
being,
and
.
From the energy balance to the heat transfer fluid,
and to the PCM
replacing into Equation (13),
and reorganizing,
Comparing this last equation with Equation (2) it can be said that,
However, during the phase change period,
and consequently the
is now defined as
The analysis of the experimental data was carried out for successive time intervals and and were the corresponding average values of the thermal oil temperature for the time interval under analysis. and were the initial and final values of for the PCM on the same time interval and when the analysis was carried out for a time interval corresponding to a phase change, was constant during such time interval. The readings from the thermocouple T8 were used as the values because this thermocouple was placed inside the test heat exchanger. From Equation (2) the overall heat transfer coefficient U was determined during the experiment provide the correct expression for was used, Equation (18) or Equation (19), according to the PCM situation.
5.2. Experimental Results for the Global Heat Transfer Coefficient
Next, the obtained curves for the overall heat transfer coefficient, or overall conductance, are shown for several experimental situations involving H105 and A82. It must be stressed that the simplified analysis that lead to the development of Equation (19) means that although these results can be used for design purposes, a future deeper analysis will either justify or deny the quality of the present data.
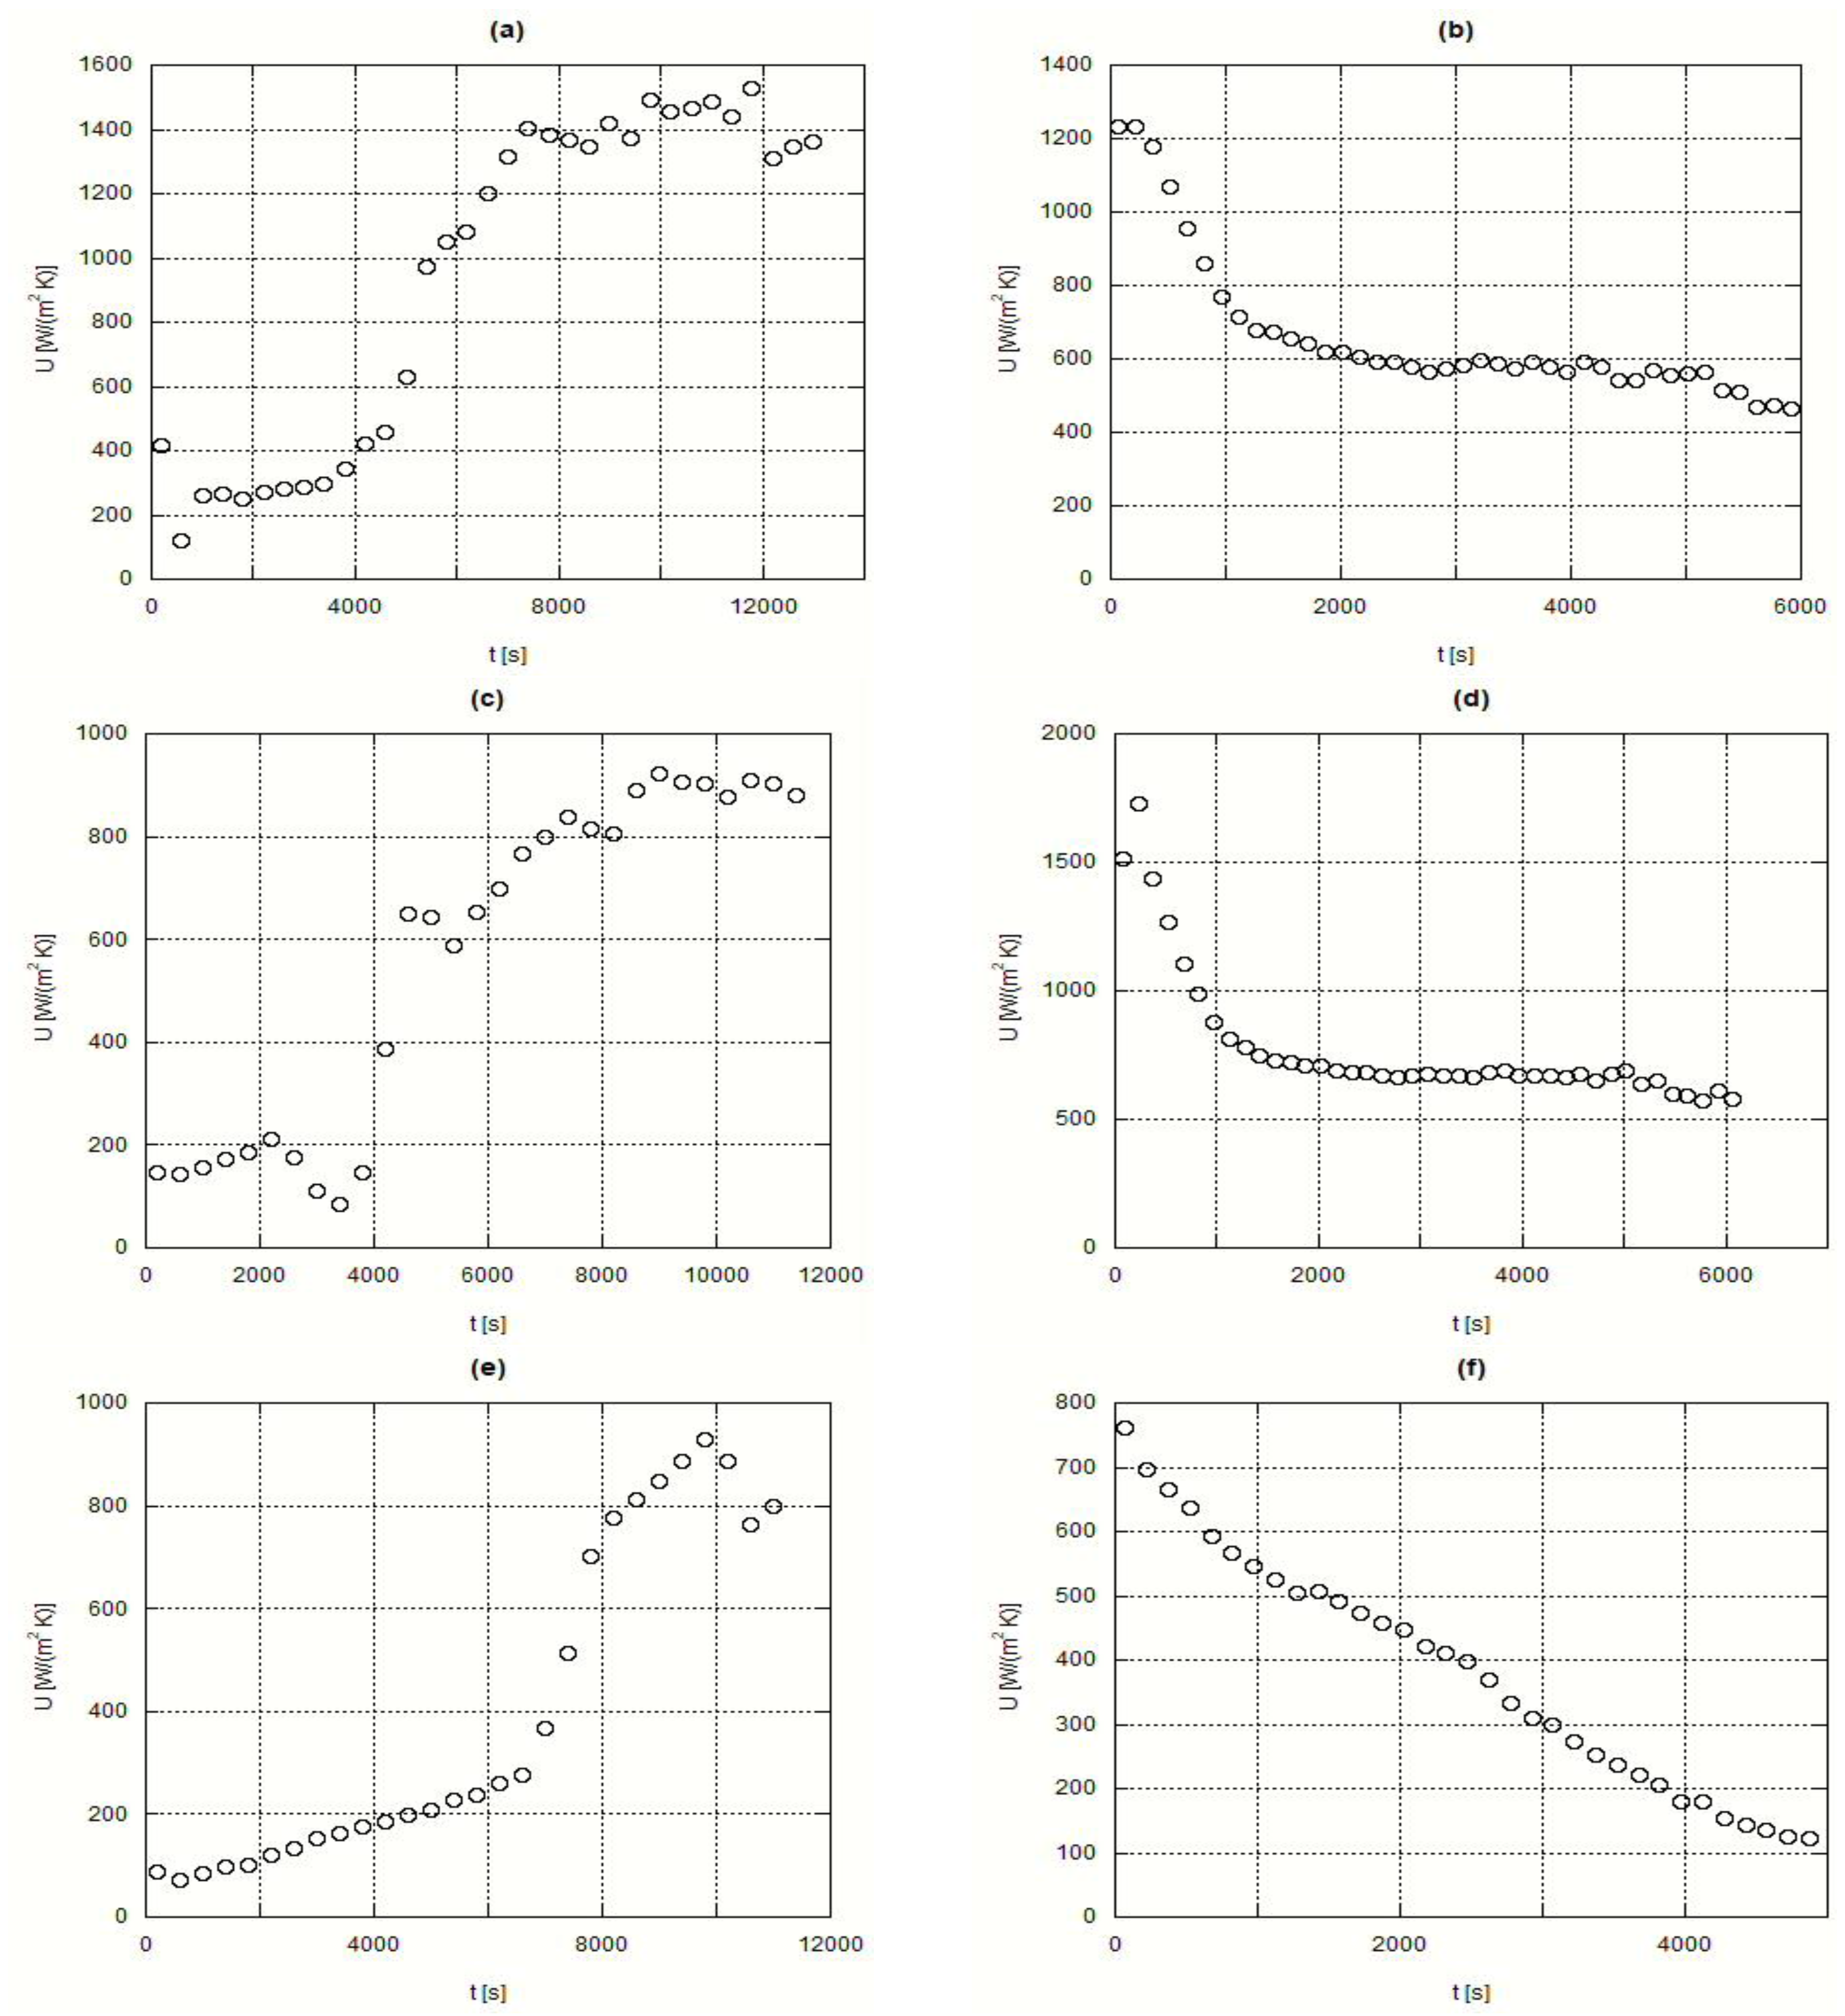
Figure 8 shows the time evolution of
U for the H105 (the inorganic PCM). Plots (a) and (b) present the fusion and solidification processes under t1 test conditions, while plots (c) and (d) concern the t2 test conditions. With such curves, the
U values can be obtained for H105. In the plots (b) and (d) from this
Figure 8, some inconsistent oscillations can be observed on the value of
U. This is connected with a non-uniform solidification process.
Figure 9 presents the evolution of
U for the organic PCM, A82.
The obtained results are in the 100 to 1800 W/(m
2·K) range, depending on the test conditions and instant of measurement, although the great majority of results can remain in the 100 to 1000 W/(m
2·K) interval In a report prepared for the US DOE [
20], experimental overall heat transfer coefficients from a heat transfer fluid towards an inorganic salt, a dilute eutectic NaNO
3-NaOH, stayed in the 500 to 2500 W/(m
2·K) according to the operating conditions, which included a higher range of temperatures, 310 to 565 °C, while in the present study the operating temperatures were in the 20 to 130 °C interval. Izquierdo-Barrientos et al. [
21] presented values for the overall heat transfer coefficient between a bed of PCM’s and an internal heat exchanger through which water was flowing: for a fixed bed, the obtained values were around 20 to 140 W/(m
2·K), whereas for the case of a fluidized bed, the obtained values went from 100 to 330 W/(m
2·K); in these experiments, the PCM had a phase change temperature around 50 °C. It must be stressed that experimental literature results for the overall heat transfer coefficients from thermal oil to PCM are non-existent and consequently no coherent comparisons could be made.
Further work is under way to evaluate new encapsulation configurations and also higher temperature PCM’s, in order to widen the capabilities of the experimental plant under design and construction.
5.3. Heat Transfer Coefficient of the Phase Change Materials
From the overall heat transfer coefficients obtained in the previous section and taking into account that the overall conductance is related with
where
is the heat transfer coefficient of the thermal oil,
is the PCM heat transfer coefficient,
kw is the thermal conductivity of the wall material, while
ri and
are respectively the internal radius (thermal oil side) and external radius(PCM side) of the pipe. So, the PCM heat transfer coefficient can be determined if
and
are previously known.
The
values were obtained from the Gnielinski [
22] correlation. However, this correlation refers to the fully developed flow Nusselt number
, which was subsequently corrected as suggested by Incropera et al. [
23] to obtain an average value
, function of the length along the flow direction
. This correction is necessary because in the used experimental setup the heat exchanger length was not enough for the thermal oil flow to achieve a fully developed flow. Thus, the following was considered,
leading to
where
is the internal diameter of the pipe and
is the thermal conductivity of the thermal oil.
The values presented in the next table are average heat transfer coefficient values for the solid and liquid phase of both tested phase change materials.
Looking at the values in
Table 4 it is clear that the material A82 presents higher heat transfer values thus leading to a faster heat storage process. Such is also clear when looking either at the time evolution of the temperature profiles or at the curves of the overall heat transfer coefficients.
6. Conclusions
The analysis of the fusion and solidification process of two commercially available PCM’s was presented. To carry out such task a small laboratory scale installation was built. The heat was supplied and retired to the PCM being tested in a single pipe shell and tube heat exchanger and the evolution of the temperature in several points inside the material was analysed and commented. The time evolution of the overall heat transfer coefficient between the heat transfer oil and the PCM, was presented leading to data adequate for design and calculation purposes. The measured values were in the 100 to 1800 W/(m2·K) range. The theoretical analysis and determination of such experimental results were based on an approximated definition of the mean logarithmic temperature difference, both for sensible and latent energy storage periods. As far as the heat transfer values are concerned both PCM’s have similar behaviour and are equally suited for the application under consideration.
Average values of the heat transfer coefficients of the phase change materials were also determined, either for the solid or for the liquid phase. From these heat transfer coefficients, the time evolution of the PCM temperatures and also from the time evolution of the overall conductance U, it is clear that the A82 is the best material leading to faster heat storage and delivery rates. Finally, its higher latent heat of fusion is another advantage.


