Article

The Effect of Off-Spec Canola Biodiesel Blending on Fuel Properties for Cold Weather Applications

Process Systems Engineering, Faculty of Engineering and Applied Science, University of Regina, 3737 Wascana Parkway, Regina, SK S4S 0A2, Canada
*
Authors to whom correspondence should be addressed.
ChemEngineering 2018, 2(3), 30; https://doi.org/10.3390/chemengineering2030030
Submission received: 12 February 2018 / Revised: 2 June 2018 / Accepted: 29 June 2018 / Published: 2 July 2018
(This article belongs to the Special Issue Control and Optimization of Chemical and Biochemical Processes)

Abstract

:
Biodiesel is a renewable and reduced-emission alternative fuel produced mainly from the alcoholysis of vegetable oils and/or animal fats. It is mainly used in blends with diesel fuel to reduce emissions, enhance lubrication and lower sulfur content. Being able to accurately determine the physicochemical properties of blended fuel is important for optimal injection, combustion, and lubricating performance in diesel engines. Also, fuel properties vary as the ratio of biodiesel-diesel changes, affecting the final fuel quality. In this study, a wide range and narrow intervals of (0, 2, 4, 6, 8, 10, 12, 15, 18, 20, 25, 35, 50, 75 and 100% by volume) off-quality canola-based biodiesel blends were prepared at ambient conditions and used to study the blended fuel properties (density, kinematic viscosity, flash point, cloud point and pour point). This is particularly important for examining the effect of a biodiesel content of more than 20%—the industry maximum blend content—on cold flow properties, fuel stability, energy value, and emissions. It was found that the kinematic viscosity and density increased linearly as the concentration of the biodiesel in the blend increases. The pour point and cloud point temperature showed a small increase up to 35% blending ratio and a rapid increase in temperature for biodiesel concentrations higher than 35%. Also, the flash point remained almost constant at an average value of 73 °C for blends less than 20%, above which the values for the flash point increased exponentially with biodiesel concentration. Furthermore, predictive correlations were developed for all tested fuel properties from regressing corresponding experimental data. All models exhibited excellent agreement with experimental data with an average absolute deviation of less than 5%.

1. Introduction

Biodiesel is a long chain fatty acid ester mainly produced from reacting vegetable oils and/or animal fats with alcohol (methanol or ethanol) in the presence of a strong base catalyst (NaOH or KOH). It is considered a biodegradable environmentally friendly fuel that has similar properties to petrodiesel. Biodiesel is typically used as a blending agent to improve the combustion and lubricating quality of convectional diesel fuel. Also, biodiesel does not contain a detectable amount of sulfur and is considered carbon neutral due to its closed carbon cycle [1]. Evaluating the biodiesel-diesel blended fuel properties is of utmost importance for choosing a suitable blending ratio in order to meet the required blended fuel standard [2]. This work proposes an alternative method for estimating the bulk modulus of biodiesel-diesel fuel blends by means of experimental investigation commonly used for determining fuel properties.
The literature shows that biodiesel-diesel blend concentrations of 10% by volume (B10) have no significant effect on the density and viscosity of the blended fuel at temperatures of 20 °C to 80 °C [3]. For higher concentrated blends with concentrations of B20, the density was found to vary with temperature according to the correlation given by Equation (1):
ρ = 0.0007·T + 0.8696
where ρ is the fuel density and T is the system temperature. Equation (2) describes a power-fitting correlation between the dynamic viscosity (μ) and temperature:
μ = c·T·d
where ν is the fuel dynamic viscosity (cP), c and d are the fitting curve coefficients.
For B20; c = 860.73; d = −0.508; R2 = 0.9811. The variation of kinematic viscosity ( ν ) as a function of temperature for different types of fluids is described by means of Andrade type equations as shown in Equation (3) [4,5]:
ν = e ( A + B T + C / T 2 )
The constants (A, B, C) and the regression coefficients (R2)—for B20, the constants are A = 0.1624; B = 61.8512; C = −491.0603; R2 = 0.9623 [6]. It was observed that the viscosity of the biodiesel-diesel blend increases as the amount of methyl ester increases in the fuel mixture [7]. Another important parameter that needs to be determined for the blend is the cetane number. The cetane number, a commonly used parameter as an indication of the quality of ignition, is measured using a specific test engine (ASTM D 613) or a constant volume combustion apparatus (ASTM D6890) [8,9]. However, both of these techniques are complicated and expensive. Many attempts were made to develop new methods to determine the cetane number of a fuel including calculated cetane index (CCI) [10]. The CCI index is determined—as a function of fuel density at 15 °C and the T50 distillation curve point—from empirical correlations according to the ASTM D976 and ASTM D4737. In addition, ASTM D4737 takes into account T10 and T90 values in a distillation curve. CCI values of 48.9 and 47 were obtained using ASTM D976 and ASTM D4737, respectively [6]. The low heating value (LHV) is calculated from high heating values (HHV), taking into account the elemental composition of the pure fuels and the enthalpy of the vaporization of water. It was found that the LHV of blends decreases proportionally with biodiesel concentration [6]. The HHV as a function of viscosity, density, and flash point is described by Equation (4):
HHV = K4 + K3 V + K2 ρ + K1 FP
where HHV is in (MJ/kg), V is the kinematic viscosity (cSt), ρ is density (g/L), FP is flash point (K), K1, K2, K3, and K4 are coefficient. Biodiesel is reported to have higher heating values of about 42 MJ/kg compared to about 50 MJ/kg for diesel fuel. Another important ingredient is the biodiesel oxygen content. The presence of oxygen in biodiesel helps to improve its combustion efficiency and decreases its oxidation potential due to an increase in the homogeneity of oxygen with the fuel during combustion. Biodiesel is reported to have a higher combustion efficiency than diesel fuel [11]. Also, the effect of canola oil derived biodiesel on the improvement of combustion and exhaust emissions was studied using blend concentrations B10, B20, and B30 [12]. As the blend ratio increased, the combustion pressure and the indicated mean effective pressure decreased at low engine speeds, while they increased at moderate engine speeds. Most of the original equipment manufacturer (OEM) dealers and customer service departments showed that the use of up to 5% biodiesel (B5) is acceptable. However, the pure biodiesel must meet the quality standards specified by the ASTM D 6751 prior to blending [13,14].
In this paper, blends of B0, B2, B4, B6, B8, B10, B12, B15, B18, B20, B25, B35, B50, B75 and B100 were prepared to study the effects of blending on the properties of the blended fuel. Different correlations and equations were developed to predict properties such as density, viscosity, flash point, cloud point, pour point, and refractive index. Also, multi-variable models were established using non-linear regression for ignition properties.

2. Experimental Details

Commercial biodiesel produced from canola oil was obtained from Milligan Biofuel, Saskatchewan, Canada. Diesel fuel was obtained from the Co-op Refinery in Regina. The main standard properties are shown in Table 1.
Predetermined quantities of biodiesel were mixed with diesel fuel on a volume basis to obtain a wide range of biodiesel-diesel fuel blends of 0%, 2%, 4%, 6%, 8%, 10%, 12%, 15%, 18%, 20%, 25%, 35%, 50%, 75% and 100%. An overhead stirrer adjusted at 150 RPM was used to provide mechanical mixing (5 min) of the different prepared blends. The properties of diesel fuel, the biodiesels and the blends, were determined using standard ASTM methods as follows: density at 15 °C (ASTM D941), viscosity at 40 °C (ASTM D445), flash point (ASTM D93), cloud point (ASTM D2500) and pour point (ASTM D97). Since the dispensing of fuel is measured by volumetric means, variations in the fuel density greatly affect the engine performance. Biodiesel density ranges from 0.86 to 0.90 kg/L depending on the source raw material. Density is defined as the degree of consistency measured by the quantity of mass per unit volume. The density of the blends in this work was measured at a controlled temperature of 15 °C according to the ASTM D941 standard. Kinematic viscosity is one of the most important parameters considered while selecting a fuel for an internal combustion engine as it affects the fuel injection system especially at low temperature increases [16]. Viscosity is defined as the extent to which a fluid resists a tendency to flow. The viscosity of the blends in this work was measured at a controlled temperature of 40 °C according to the ASTM D445 method. High viscosity causes problems in automobile atomization systems while spraying and it is also responsible for deposition and engine wear in the fuel system. Moreover, it also increases the pumping power required to pump the fuel to the engine. Flash point is another important parameter of fuel especially for the safety of its storage and transportation. It is the measurement of the flammability of a fuel and indicates its fire and explosion potential. Flash point is defined as the minimum temperature at which enough vapors are produced above the fuel to form a mixture with air so that a spontaneous ignition can occur if a spark is provided [6]. Flash point in this study was determined using the ASTM D93 standard method with automatic closed cup Pensky-Marten apparatus. Flash point is inversely proportional to volatility of the fuel, and hence biodiesel is expected to have a higher flash point than diesel fuel. Cloud point and pour point are known as the cold flow properties of the fuel, since they highly depend on cold weather conditions, and describe the limitations of certain fuel under these conditions. Cloud point is defined as the minimum temperature at which wax cluster or crystal is observed in a cloudy appearance. The cloud point of the blends in this work was determined according to the ASTM D2500 method. Pour point is the temperature at which a fuel loses its ability to flow and the wax becomes semisolid, like a gel losing its flow potential [16,17,18,19]. The pour point of the blends in this work was determined according to the ASTM D97 method. Refractive index is the ratio of velocity of light in the vacuum to the speed of light in that medium (oil) [18]. It shows the change in the angle of light when passed through medium, oil, in this case. The refractive index of the blends was determined using ASTM D1218. The physical properties of diesel-biodiesel fuel blend are given in Table 2.

3. Results and Discussion

3.1. Density

Figure 1 shows the effect of blending different concentrations of biodiesel with diesel on the resulting blended fuel density. It can be seen that the density increases as the concentration of biodiesel in the blend increases. This increase in density will cause more fuel consumption as fuel is regulated by volume. Also, the heating value of biodiesel is less than that of diesel fuel; hence more fuel will be required to obtain the same amount of energy [14,15]. It was found that the maximum absolute error between the experimental and predicted density values to be 0.072% with an R2 value of 0.9985. Simple Kay’s mixing rule (Equation (6)) was used to obtain average blends values [20]. The proposed correlation developed from experiments performed in this current study showed good agreement with the values obtained from literature on waste palm oil biodiesel [21]. The results show that the developed correlations adequately fitted the experimental data with excellent coefficient of correlation (>0.99). However, as the concentration of biodiesel increased beyond 20% (B20), the error level increased relatively and reached a maximum value of 0.48% for B100. Equations (5)–(7) represent the correlation used to fit the density experimental data.
ρ ( x ) = 0.000345121   x + 0.84174
ρ ( x ) = i = 1 n y i   ρ i
ρ ( x ) = 0.0003   x + 0.8423
The density of the blend varies from 0.842 kg/L for B0 to 0.876 kg/L for B100, which satisfies the requirement of ASTM D6751 as shown in Figure 1. Density of the blend B35 is 1.32% higher than the B0 (pure diesel). The blend density is greatly affected by the biodiesel source raw material. Therefore, if the density of biodiesel is low, the final density of the blend will also be lower at high blend concentrations. Figure 1 also shows that blends beyond B50 do not comply with the fuel standard density requirements as per ASTM D7467. The low density directly affects the heating value of the fuel, which ultimately lowers the engine output.

3.2. Viscosity

Viscosity of biodiesel is higher than the conventional diesel and therefore viscosity of a blend is directly proportional to the amount of biodiesel blended [15,18,22]. The data were regressed and analyzed using the correlations in Equations (8)–(11). The linear model was tested against the experimental data but it did not yield adequate fit and therefore was not considered further. On the other hand, the second order polynomial equation, Equation (8), and an exponential model Equation (11) are developed in this study and the values were compared with experimental data using the Kay’s mixing rule (Equation (9)) and Arrhenius mixing model (Equation (10)). The Arrhenius equation (Equation (10)) is an updated model of Nissan—Grunberg equation (which uses mass % instead of volume %). According to the Arrhenius model, it is observed that the interaction parameters in the Nissan—Grunberg equation can be neglected if the mixture components have the same structure and can therefore be used to compare the data because biodiesel and diesel both are non-polar and completely miscible in each other [6,21].
ν ( x ) = 0.00006   x 2 + 0.015   x + 3.0395
ν ( x ) = i = 1 k y i   ν i
log ν ( b l e n d ) = v P l o g ν P + v B l o g ν B
ν ( x ) = 3.0338   e 0.0054   x
From Figure 2, it can be seen that viscosity increases as the amount of biodiesel in the blend increases. The pure biodiesel had a viscosity 42.56% higher than that of pure diesel. Except for Equation (9), which gave the maximum absolute error of 4.48%, the remaining Equations (8), (10) and (11) showed excellent agreement with the experimental data and produced maximum absolute errors of 2.10%, 2.18 and 1.65%, respectively. Even though the correlation coefficient (R2) value for Equation (8) was highest (0.9972) among all models, the exponential model showed the least error among the four equations.
All prepared blends including B100 fulfill the ASTM D6751 standard requirements for viscosity. Also, blends up to B60 met the ASTM D7467 standard and blends beyond B60 failed to comply with this standard. Since the temperature in Canada during winter can plummet to −50 °C, the fuel suppliers avoid mixing biodiesel with diesel fuel due to these extreme temperatures that can greatly affect cold flow properties.

3.3. Flash Point

Table 2 shows that the biodiesel flash point is almost 2.4 times higher than that of conventional diesel. Figure 3 shows that the flash point gradual (10% increment) increased as the biodiesel content in the blend increased up to a concentration of B35. For biodiesel concentrations from B50 to B100, the flash point increased exponentially to the maximum of 170 °C. Figure 3 provides a representation of the quadratic and cubic equations. The quadratic model did not fit the data accurately and gave a maximum absolute error of 16.3%, while the cubic model (Equation (13)) showed good agreement with the experimental values, with a maximum absolute error of only 5.1%. Therefore, the cubic model is used to predict the flash point of biodiesel blends.
F P ( x ) = 0.0138   x 2 0.5299   x + 77.117
F P ( x ) = 0.000251436   x 3 0.02191   x 2 + 0.662974   x + 70.289

3.4. Cloud Point and Pour Point

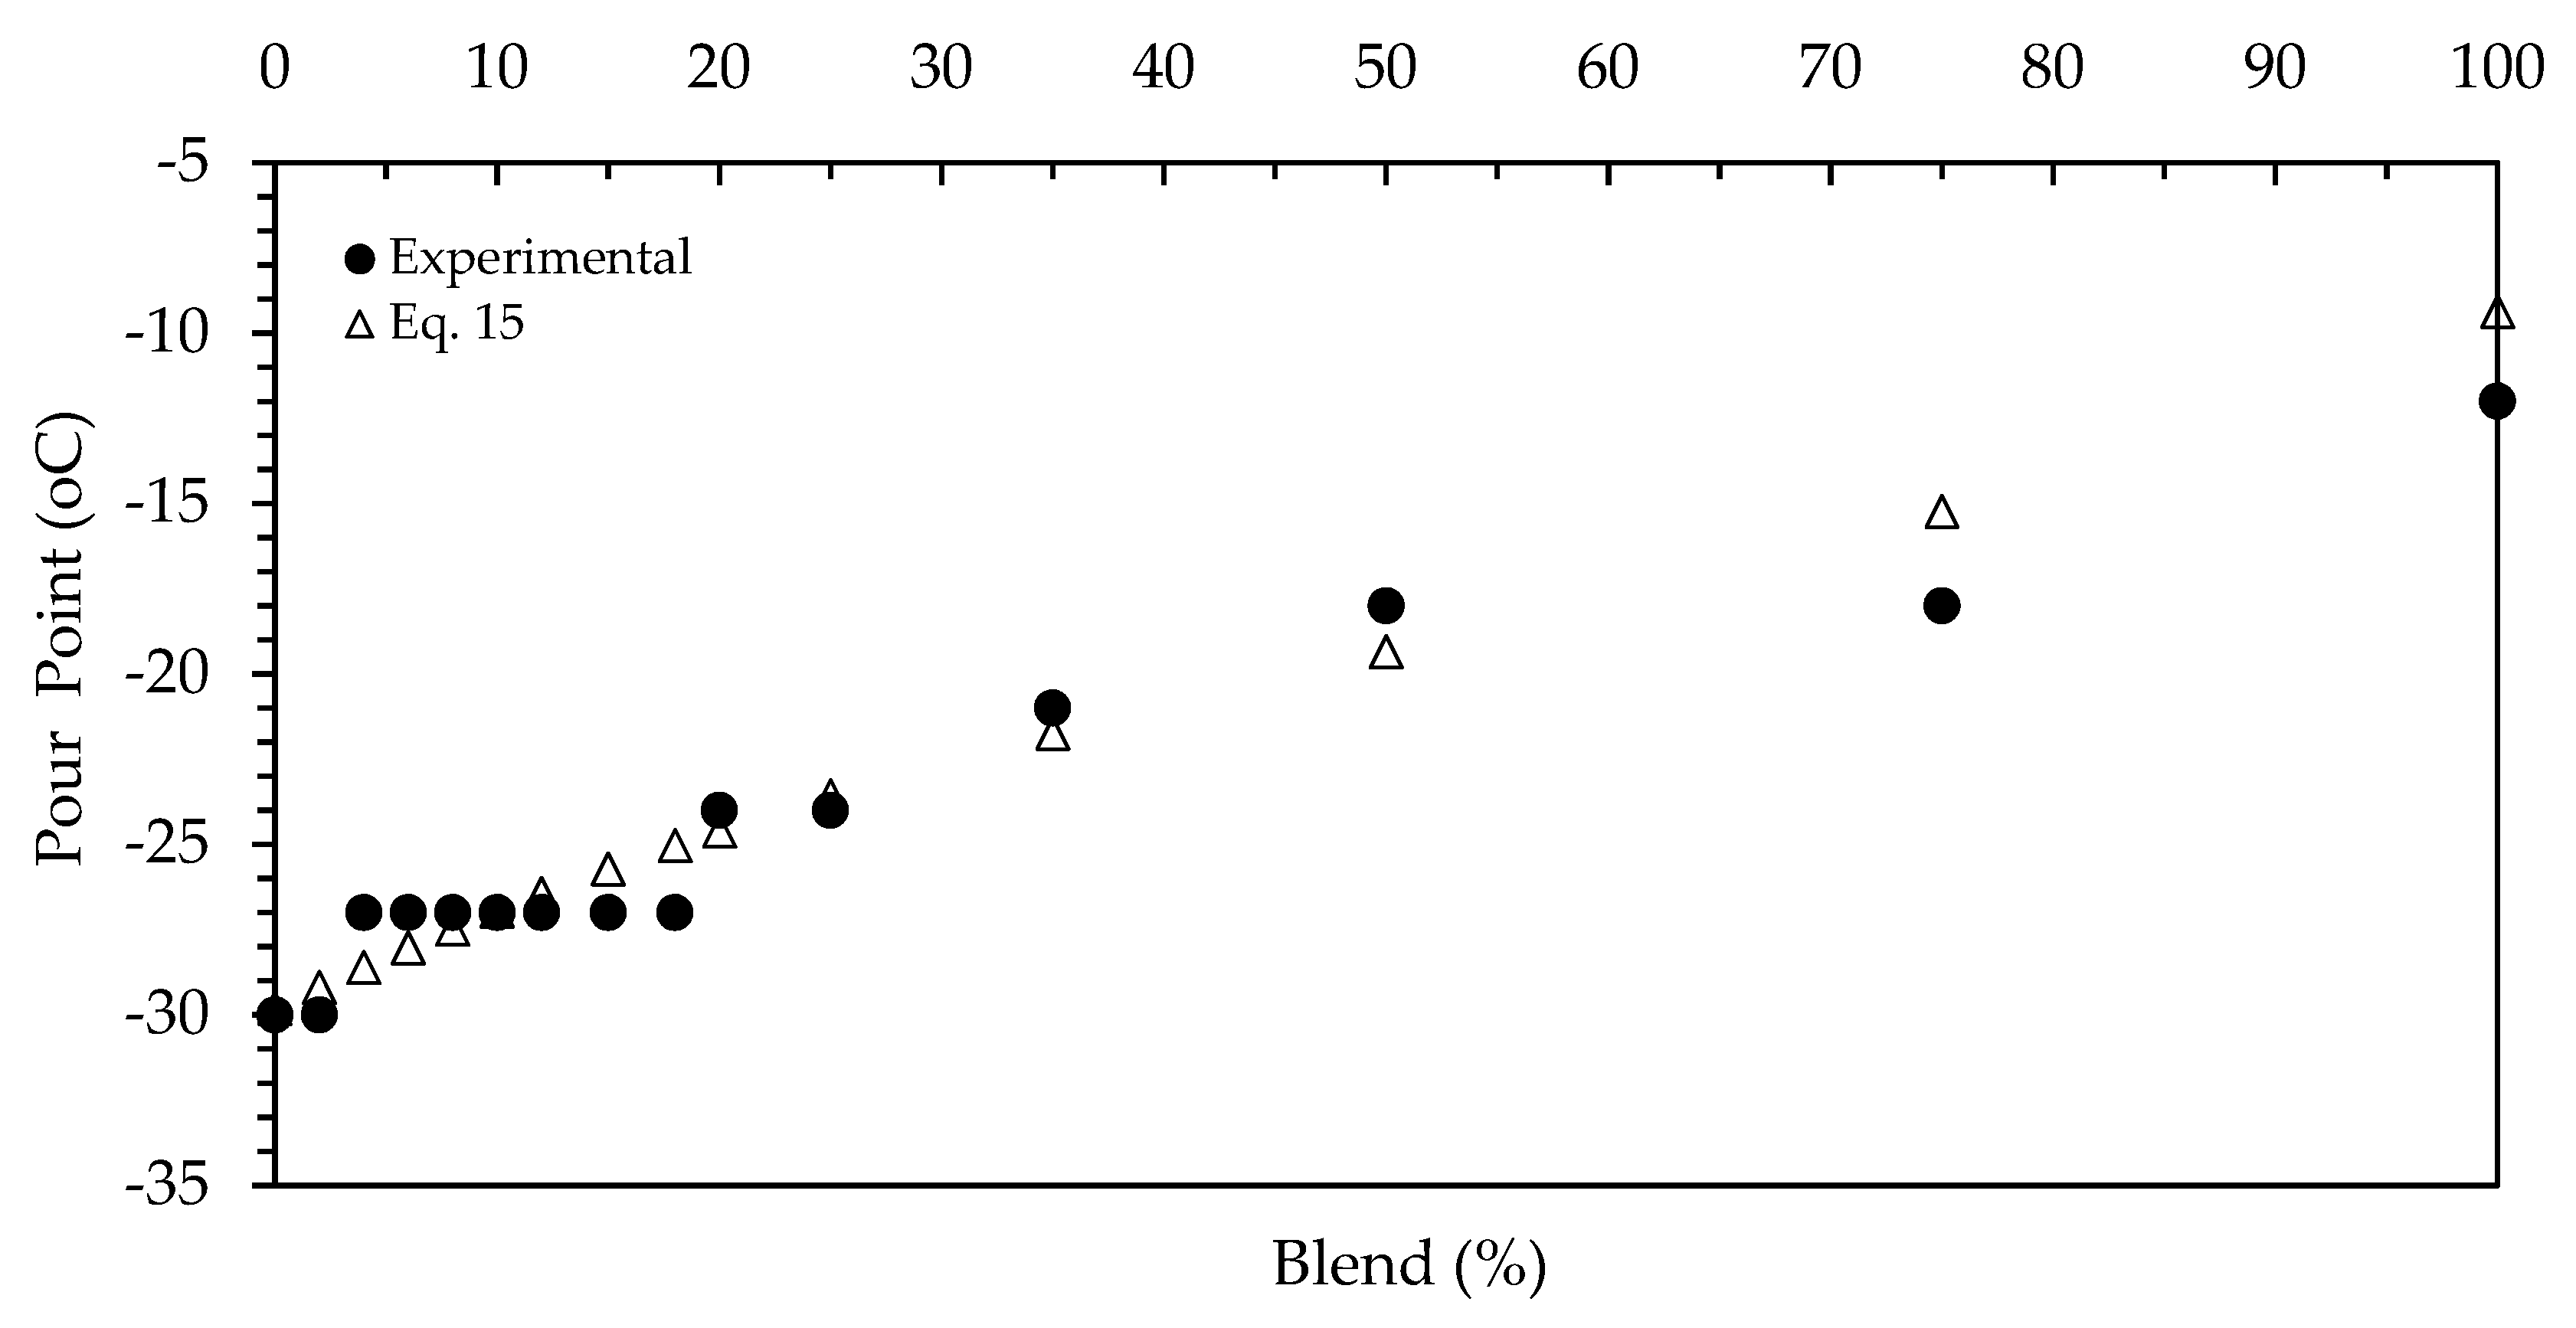
Figure 4 and Figure 5 show the experimental and predicted values of pour and cloud point for all prepared blends. Predicted values for cloud point and pour point were obtained using Equations (14) and (15), respectively. It was observed that the cloud and pour points of blends increase as the concentration of methyl ester increases in the diesel fuels. This was attributed to the fact that the cloud and pour points of biodiesel are higher than those of diesel fuel due to the composition of fatty acid present in biodiesel [7]. Cloud and pour points of pure biodiesel and pure diesel were −2.4, −12 and −12, −30, respectively. These figures show a proportional trend of cold flow properties increasing with biodiesel content. The cloud point increases linearly while the pour point is best fitted with a second order polynomial equation with coefficient of correlation values of 0.9901 and 0.9479, respectively. The linear relation of the cloud point with respect to biodiesel concentration is in agreement with observations reported in the literature [6]. The effect of biodiesel content on the cloud point was not significantly high from B0 to B25. However, above B35, biodiesel concentration had an appreciable impact on the cloud point. The same phenomenon was observed for the pour point with the most significant increase appears at values greater than B25.
C P ( x ) = 0.0966   x 12.414
P P ( x ) = 0.0007   x 2 + 0.2339   x 29.344

3.5. Refractive Index

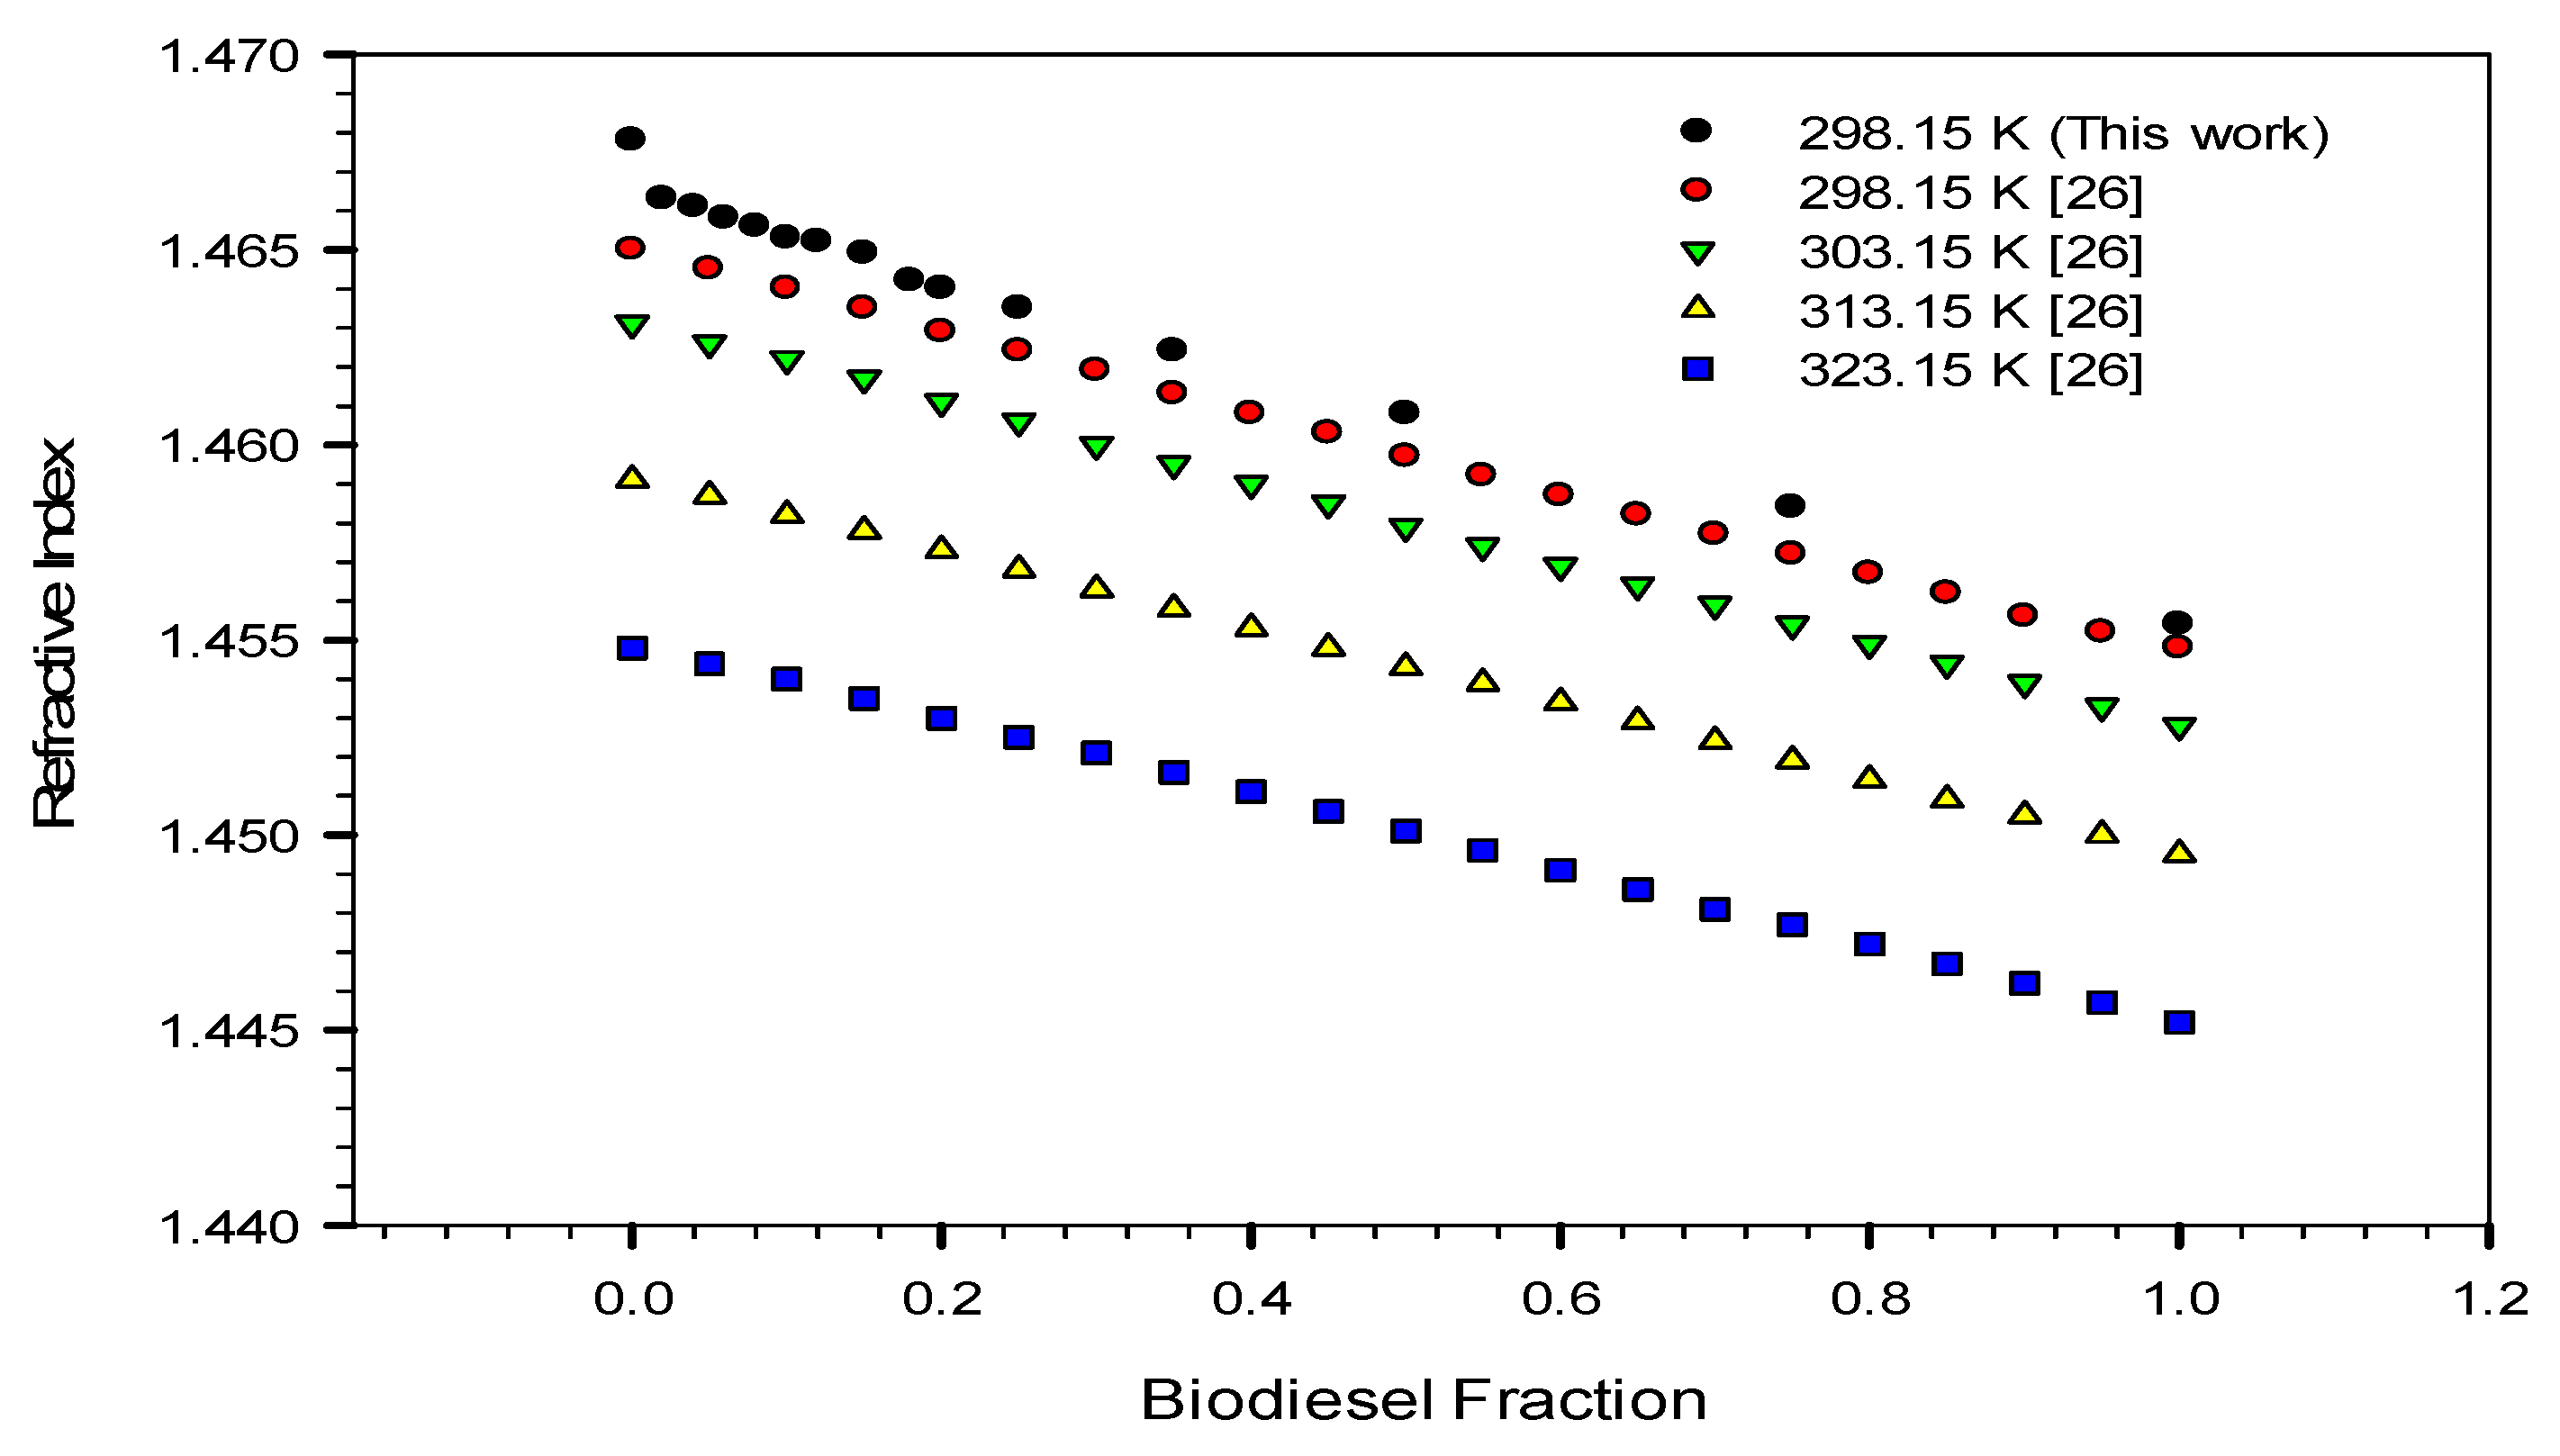
Figure 6 shows the experimental and predicted (Equation (16)) refractive index values for the biodiesel blends. It was observed that the refractive index (RI) decreases as the biodiesel content increases for both experimental and predicted data. Figure 7 shows the variation of refractive index for the prepared biodiesel blends at 298 K and literature data at different temperatures (298–323 K) [23]. For a given biodiesel concentration, it was found that the refractive decreased as the temperature increased. Refractive index is a simple and quick turnaround tool that can be used to develop correlations to predict blended fuel properties such as density, viscosity, heating values, etc.
R I ( x ) = 0.000113232   x + 1.466575205
Refractive index was used to develop mathematical models for predicting density and viscosity. Figure 8 and Figure 9 show the density and viscosity values plotted using Equations (17) and (18), with corresponding coefficients of correlation 0.98 and 0.97, respectively. These equations have certain limitations; such as it predicted B0 blend values with a relatively large error (8.19%) compared to the other blends for viscosity. This can be attributed to the significant change in refractive index from B0 to B2 since the pure diesel (B0) color was opaque.
D e n s i t y = 3.0044   R I + 5.2481
V i s c o s i t y = 185.41   R I + 274.91

4. Conclusions

Biodiesel-diesel blended fuel properties of density, kinematic viscosity, flash point, cloud point and pour points were experimentally determined for a set of pre-defined blends using wide range and small internal blending ratios (0, 2, 4, 6, 8, 10, 12, 15, 18, 20, 25, 35, 50, 75 and 100% v/v). The biodiesel used in this study was obtained using off-spec canola feedstock. It is worth noting that increasing kinematic viscosity will have an adverse effect on the diesel oil pumping quality especially in Canadian extreme cold winter conditions. The increasing values of cloud and pour points also has a negative effect on the pumping performance of oil circulation as well as on the oil filter due to the formation of heavy materials, which may block the filter, and this may need to have a frequent oil filter change. It is therefore recommended that up to 10% of biodiesel be added to diesel fuel during summer and no blending during wintertime. In addition, the experimental results showed that the kinematic viscosity and density increased linearly as the concentration of the biodiesel in the blend increases. The pour point and cloud point temperature showed small increases up to 35% blending ratio and rapid increases in temperature for biodiesel concentrations higher than 35%. The flash point remained almost constant at an average value of 73 °C for blends less than 20%, above which the values for flash point increased exponentially with biodiesel concentration. Also, different predictive mathematical models were developed for these properties from regressing the experimental data. All models exhibited excellent agreement with experimental data with an average absolute deviation of less than 5%.

Author Contributions

H.I. and I.A.-Z. secured funding, proposed the original idea and provided direction and guidance; U.H. conducted all experimental work; U.H. and I.A.-Z. wrote the first draft of the manuscript; H.I. provided critical revision and wrote the final draft of the submitted manuscript; H.I. and I.A.-Z. supervised the project and provided final approval of the version to be published.

Funding

This research was funded by the Natural Science and Engineering Research Council (NSERC) grant number [RGPIN-402583-2011].

Acknowledgments

The authors would like to thank the Co-op Refinery of Regina for providing access to their labs to perform some of the experimental work needed for this paper. The authors also wish to acknowledge the financial support provided by the Faculty of Graduate Studies and Research (FGSR), the Natural Science and Engineering Research Council (NSERC), Clean Energy Technologies Research Institute (CETRi), and the Canada Foundation for Innovation (CFI).

Conflicts of Interest

The authors declare no conflict of interest.

References

  1. Gerpen, J.V. Biodiesel processing and production. Fuel Process. Technol. 2005, 86, 1097–1107. [Google Scholar] [CrossRef]
  2. Armas, O.; Martínez, S.M.; Mata, M.; Pacheco, C. Alternative method for bulk modulus estimation of diesel fuels. Fuel 2016, 167, 199–207. [Google Scholar] [CrossRef]
  3. Mosesane, M.J.; Mbaya, R.K.; Tshabalala, L.C.; Kalombo, L. Characterization of fuel properties for the biodiesel-petro-diesel blends dosed with the FPC. Glob. J. Res. Eng. J. Gen. Eng. 2015, 15, 1–7. [Google Scholar]
  4. Mustafa, E.T.; Van Gerpen, J.H. The kinematic viscosity of biodiesel and its blends with diesel fuel. J. Am. Oil Chem. Soc. 1999, 76, 1511–1513. [Google Scholar]
  5. Kerschbaum, S.; Rinke, G. Measurement of the temperature dependent viscosity of biodiesel fuels. Fuel 2004, 83, 287–291. [Google Scholar] [CrossRef]
  6. Benjumea, P.; Agudelo, J.; Agudelo, A. Basic properties of palm oil biodiesel–diesel blends. Fuel 2008, 87, 2069–2075. [Google Scholar] [CrossRef]
  7. Alptekin, E.; Canakci, M. Characterization of the key fuel properties of methyl ester–diesel fuel blends. Fuel 2009, 88, 75–80. [Google Scholar] [CrossRef]
  8. Knothe, G.; Matheaus, A.C.; Ryan, T.W. Cetane numbers of branched and straight chain fatty esters determined in an ignition quality tester. Fuel 2003, 82, 971–975. [Google Scholar] [CrossRef]
  9. Knothe, G. Dependence of biodiesel fuel properties on the structure of fatty acid alkyl esters. Fuel Process. Technol. 2005, 86, 1059–1070. [Google Scholar] [CrossRef]
  10. Chevron Product Company. Diesel Fuels Technical Review (FTR-2); Chevron Product Company: San Ramon, CA, USA, 1998. [Google Scholar]
  11. Sivaramakrishnan, K. Determination of higher heating values of biodiesels. Int. J. Eng. Sci. Technol. 2011, 3, 7981–7987. [Google Scholar]
  12. Yoon, S.K.; Kim, M.S.; Kim, H.J.; Choi, N.J. Effects of canola oil biodiesel fuel blends on combustion, performance, and emissions reduction in a common rail diesel engine. Energies 2014, 7, 8132–8149. [Google Scholar] [CrossRef]
  13. National Biodiesel Board, OEM Warranty Statements and Use of Biodiesel Blends over 5% (B5). Available online: http://biodiesel.org/docs/default-source/ffs-engine_manufacturers/oem-warranty-statement-and-use-of-biodiesel-blends-over-5-(b5).pdf?sfvrsn=6 (accessed on 12 November 2017).
  14. Specifications for Biodiesel, National Biodiesel Board, December 2001. Available online: http://biodiesel.org/docs/default-source/ffs-production/fuel-quality-policy-update.pdf?sfvrsn=4 (accessed on 10 January 2018).
  15. Alptekin, E.; Canakci, M. Determination of the density and the viscosities of biodiesel–diesel fuel blends. Renew. Energy 2008, 33, 2623–2630. [Google Scholar] [CrossRef]
  16. Geacai, S.; Iulian, O.; Nita, I. Measurement, correlation and prediction of biodiesel blends viscosity. Fuel 2015, 143, 268–274. [Google Scholar] [CrossRef]
  17. Wakil, M.A.; Kalam, M.A.; Masjuki, H.H.; Atabani, A.E.; Fattah, I.M.R. Influence of biodiesel blending on physicochemical properties and importance of mathematical model for predicting the properties of biodiesel blend. Energy Convers. Manag. 2015, 94, 51–67. [Google Scholar] [CrossRef]
  18. Chang, A.; Pashikanti, K.; Liu, Y. Refinery Engineering; Wiley-VCH: Weinheim, Germany, 2012. [Google Scholar]
  19. Saxena, P.; Jawale, S.; Joshipura, M.H. A review on prediction of properties of biodiesel and blends of biodiesel. Procedia Eng. 2013, 51, 395–402. [Google Scholar] [CrossRef]
  20. Grunberg, L.; Nissan, A. Mixture Law for viscosity. Nature 1949, 164, 799–800. [Google Scholar] [CrossRef] [PubMed]
  21. Hasan, M.M.; Rahman, M.M. Performance and emission characteristics of biodiesel–diesel blend and environmental and economic impacts of biodiesel production: A review. Renew. Sustain. Energy Rev. 2017, 74, 938–948. [Google Scholar] [CrossRef]
  22. Muñoz, M.; Moreno, F.; Monné, C.; Morea, J.; Terradillos, J. Biodiesel improves lubricity of new low sulphur diesel fuels. Renew. Energy 2011, 36, 2918–2924. [Google Scholar] [CrossRef]
  23. Nita, I.; Geacai, S.; Neagu, A.; Geacai, E. Estimation of the refractive index of diesel fuel+biodiesel blends. Ovidius Univ. Ann. Chem. 2013, 24, 24–26. [Google Scholar] [CrossRef] [Green Version]
Figure 1. Density variation with biodiesel content.
Chemengineering 02 00030 g001
Figure 2. Viscosity variations with biodiesel content.
Chemengineering 02 00030 g002
Figure 3. Flash point variation with biodiesel content.
Chemengineering 02 00030 g003
Figure 4. Cloud Point experimental and predicted values.
Chemengineering 02 00030 g004
Figure 5. Pour Point experimental and predicted value.
Chemengineering 02 00030 g005
Figure 6. Refractive Index biodiesel blend with predicted value.
Chemengineering 02 00030 g006
Figure 7. Refractive Index variation of different blend at different temperatures.
Chemengineering 02 00030 g007
Figure 8. Parity plot for fuel density.
Chemengineering 02 00030 g008
Figure 9. Parity plot for fuel viscosity.
Chemengineering 02 00030 g009
Table 1. The fuel properties of biodiesels and diesel fuels [15].
PropertyCanola BiodieselDiesel Fuel
Density at 15 °C g/cm30.88280.8424
Viscosity at 40 °C, cSt4.34012.7109
Flash point °C10758
Calculated Cetane number61.557.8
Pour point, °C−8−6
Acid number, mg KOH/g0.16-
Free glycerin % mass0.010-
Total glycerin % mass0.12-
Ester content % mass99.2-
Distillation, °C
10%350228
50%352283
90%359350
End point382372
Table 2. The physical properties of diesel-biodiesel fuel blend.
Blend (%)Density (kg/L)Kin. Viscosity (cSt)Flash Point (°C)Pour Point (°C)Cloud Point (°C)
00.842243.01271−30−12
20.842543.05374.44−30−12.3
40.8433.064772.22−27−12
60.843623.110973.33−27−12
80.84463.173573.33−27−11.5
100.84553.238274.44−27−11.8
120.84653.291274.44−27−11.7
150.84713.3162775.55−27−10.7
180.84783.354674.44−27−10.3
200.8483.3975.55−24−10.4
250.849913.4577.77−24−9.9
350.85353.655678.88−21−9.2
500.85853.986584.44−18−7.8
750.867924.484998.88−18−5.5
1000.876545.2443170−12−2.4