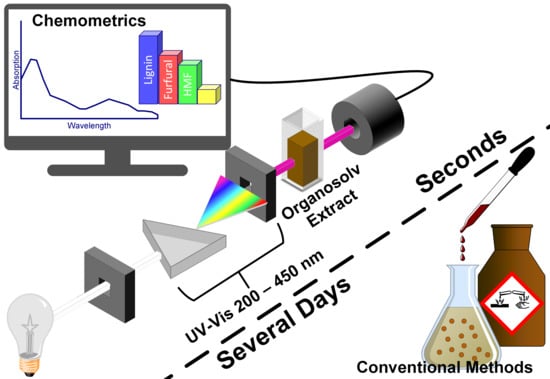
UV-Vis Spectroscopy and Chemometrics for the Monitoring of Organosolv Pretreatments


1
Institute of Chemical, Environmental and Bioscience Engineering, TU Wien, 1060 Vienna, Austria
2
Institute of Statistics and Mathematical Methods in Economics, TU Wien, 1040 Vienna, Austria
*
Author to whom correspondence should be addressed.
ChemEngineering 2018, 2(4), 45; https://doi.org/10.3390/chemengineering2040045
Submission received: 15 August 2018
/
Revised: 2 September 2018
/
Accepted: 10 September 2018
/
Published: 21 September 2018
(This article belongs to the Special Issue Advances in Bio-Fuels Production)
Abstract
:Lignocellulosic agricultural side products like wheat straw are widely seen as an important contribution to a sustainable future economy. However, the optimization of biorefinery processes, especially the pretreatment step, is crucial for an economically viable biorefinery. The monitoring of this pretreatment process in terms of delignification and the generation of the fermentation inhibitors acetic acid, furfural, and hydroxymethylfurfural (HMF) is essential in order to adapt the process parameters for a desired outcome and an economical operation. However, traditional wet chemistry methods are time-consuming and not suitable for on-line process monitoring. Therefore, UV-Vis spectroscopy in combination with partial least-squares regression was used for the determination of the concentrations of lignin, acetic acid, furfural, and HMF. Five different data blocks with increasing amounts of impurities were investigated to evaluate the influence of the inevitable impurities on the calibration models. Lignin showed a good prediction accuracy with 95% tolerance intervals between ±0.46 to ±1.6 mg/L for concentrations up to 30 mg/L. Also, the other components could be predicted with a sufficient accuracy for on-line process monitoring. A satisfactory calibration can be obtained with 10 to 20 reference samples valid at process temperatures between 160 °C and 180 °C.
1. Introduction
Many petrochemicals are produced from conventional crude oil-fed refineries, whereas it is anticipated that in the future, many products and chemicals will be produced from biorefineries fed with lignocellulosic biomass such as agricultural residuals [1]. This renders the term “waste”, in the context of biomass processing terminology, obsolete, as each production stream has the potential to be converted into a by-product or energy rather than waste [2]. Especially lignin, as one of the three main components of lignocellulosic biomass, is currently underutilized and mainly used as an energy source, whereas it is anticipated to improve the economics of a biorefinery [3].
A biorefinery approach involves multi-step processes in which the first step, subsequent to the feedstock selection, typically involves treating the biomass to pre-separate the main components and to make it more amenable for further processing [4]. This step is conventionally referred to as pretreatment. To facilitate the lignin utilization, a pretreatment process yielding lignin with little changes in the chemical structure is favored. Compared to other pretreatment technologies, the organosolv process, used in this work, extracts relatively pure, low-molecular-weight lignin from biomass. This lignin shows a minimum of carbohydrate and mineral impurities and facilitates lignin applications with a higher value than heat and power generation [5].
Lignin is a highly irregularly branched polyphenolic polyether, consisting of the primary monolignols, p-coumaryl alcohol, coniferyl alcohol, and sinapyl alcohol, which are connected via aromatic and aliphatic ether bonds [6]. Even by using only one type of raw material in a lignocellulosic biorefinery, the growth environment, harvesting method, and storage can increase the inherent biomass property of heterogeneity [7].
The mentioned variability in the composition and structure of feedstocks poses one of the most significant challenges to the industrial-scale processing of lignocellulosic materials [6]. Therefore, in-situ process monitoring of the pretreatment and the lignin concentration is essential for an adaption of process parameters and a constant product quality. However, traditional wet chemistry methods are expensive and time-consuming, requiring several days for a full composition analysis, which is a timeframe clearly incompatible with on-line process monitoring [8].
In addition to the lignin concentration, degradation products generated during the pretreatment process such as furfural, hydroxymethylfurfural (HMF), and acetic acid are of interest. The furans originate from the dehydration of hexose and pentose sugars, whereas the acetic acid originates from the cleavage of the acetyl substitutions from xylan, and both are of particular importance for the toxicity in yeasts [9,10,11]. A low concentration of these inhibitors is therefore favored for subsequent fermentation processes and needs to be monitored. These components can be measured by HPLC in a time frame of hours, which is inappropriate for on-line process monitoring [12].
Therefore, spectroscopic methods are anticipated to be used to gain real-time composition results. The widely used and powerful spectroscopic method UV-Vis was applied in this work. However, several degradation products exhibit interfering UV spectra [13,14] and consequently, simple linear regression models (using data only from a single wavelength) are not successful. Therefore, the multivariate linear partial least-squares (PLS) regression [15] was chosen. PLS models have been developed for the estimation of the concentrations of lignin, acetic acid, HMF, and furfural from UV-Vis data. The strategy of repeated double cross validation (rdCV) was applied to obtain calibration models with an optimum complexity (optimum number of PLS components) and to obtain a realistic estimation of the prediction errors [16].
Five different data blocks were used to investigate the feasibility of this measurement method for wheat straw organosolv extracts which contain a multitude of inevitable impurities interfering with the spectral results. The data blocks contain increasing amounts of impurities starting from pure component spectra, synthetic extracts, and organosolv extract spiked with pure components to neat organosolv extracts from different pretreatment temperatures. In a first step, the single blocks are investigated separately in terms of the prediction performance of the PLS models derived from the block data. In a second step, the obtained calibrations from block 1 are applied to the data blocks with reference analyzed neat extracts. Furthermore, the validity of the models for varying pretreatment temperatures is investigated. Finally, the influence of a decreased number of calibration samples is investigated, thus reducing the effort for making calibration models for different process conditions. The main focus of this work is, however, on monitoring the pretreatment process at nearly constant process parameters.
2. Materials and Methods
2.1. Materials
The wheat straw used was harvested in 2015 in lower Austria and stored under dry conditions until use. The particle size was reduced in a cutting mill, equipped with a 5-mm mesh, before pretreatment. The dry composition of the straw was 16.1 wt % lignin and 63.1 wt % carbohydrates consisting of Arabinose, Glucose, Mannose, Xylose, and Galactose. Ultra-pure water (18 MΩ/cm) and Ethanol (Merck, Darmstadt, Germany, 96 vol %, undenatured) were used in the organosolv treatment and additionally sulfuric acid (Merck, 98%) in the precipitation of lignin.
Acetic acid (Sigma-Aldrich, St. Louis, MO, USA, 99.7%), HMF (Sigma-Aldrich, 99%), and furfural (Sigma-Aldrich, 99%) were used for the preparation of synthetic extracts and pure component spectra.
2.2. Organosolv Pretreatment
The organosolv pretreatment was conducted in a 1 L stirred autoclave (Zirbus, HAD 9/16) using a 60 wt % aqueous ethanol mixture as the solvent under consideration of the water content in the straw. The wheat straw content in the reactor based on dry straw was 8.3 wt %. The reactor was heated to 160 °C, 180 °C, or 200 °C within 45 min and held at this temperature for 15 min. After these 60 min of treatment, the reactor was cooled to room temperature. The solid and liquid fractions were separated using a hydraulic press (Hapa, HPH 2.5) at 200 bar and a centrifuge (Sorvall, RC 6+) at 30,074× g for 20 min.
2.3. Reference Analysis and Synthetic Extract
The organosolv extract was analyzed for concentrations of lignin and the degradation products acetic acid, HMF, and furfural by a Shimadzu LC-20A “prominence” HPLC system with a Shodex SH-G guard column and a Shodex SH1011 column at 50 °C, with 0.005 M H2SO4 as the eluent. Acetic acid was determined via a refractive index detector, furfural, and HMF via a UV-Vis detector. The lignin content was determined following the NREL LAP “Determination of Structural Carbohydrates and Lignin in Biomass” [8] using the dry matter of the extract obtained at 105 °C.
Lignin for pure component measurements and spiking material was precipitated from the extract using a sulfuric acid/water mixture at pH 2 as the antisolvent. The particles were separated from the suspension after precipitation by centrifugation. The bottom product was purified by repeated sonication, centrifugation, and replacement of the supernatant with water. The freeze-dried lignin was finally analyzed in terms of its lignin and carbohydrate content via the method mentioned before. The purified lignin had a lignin content of 94.4 wt %.
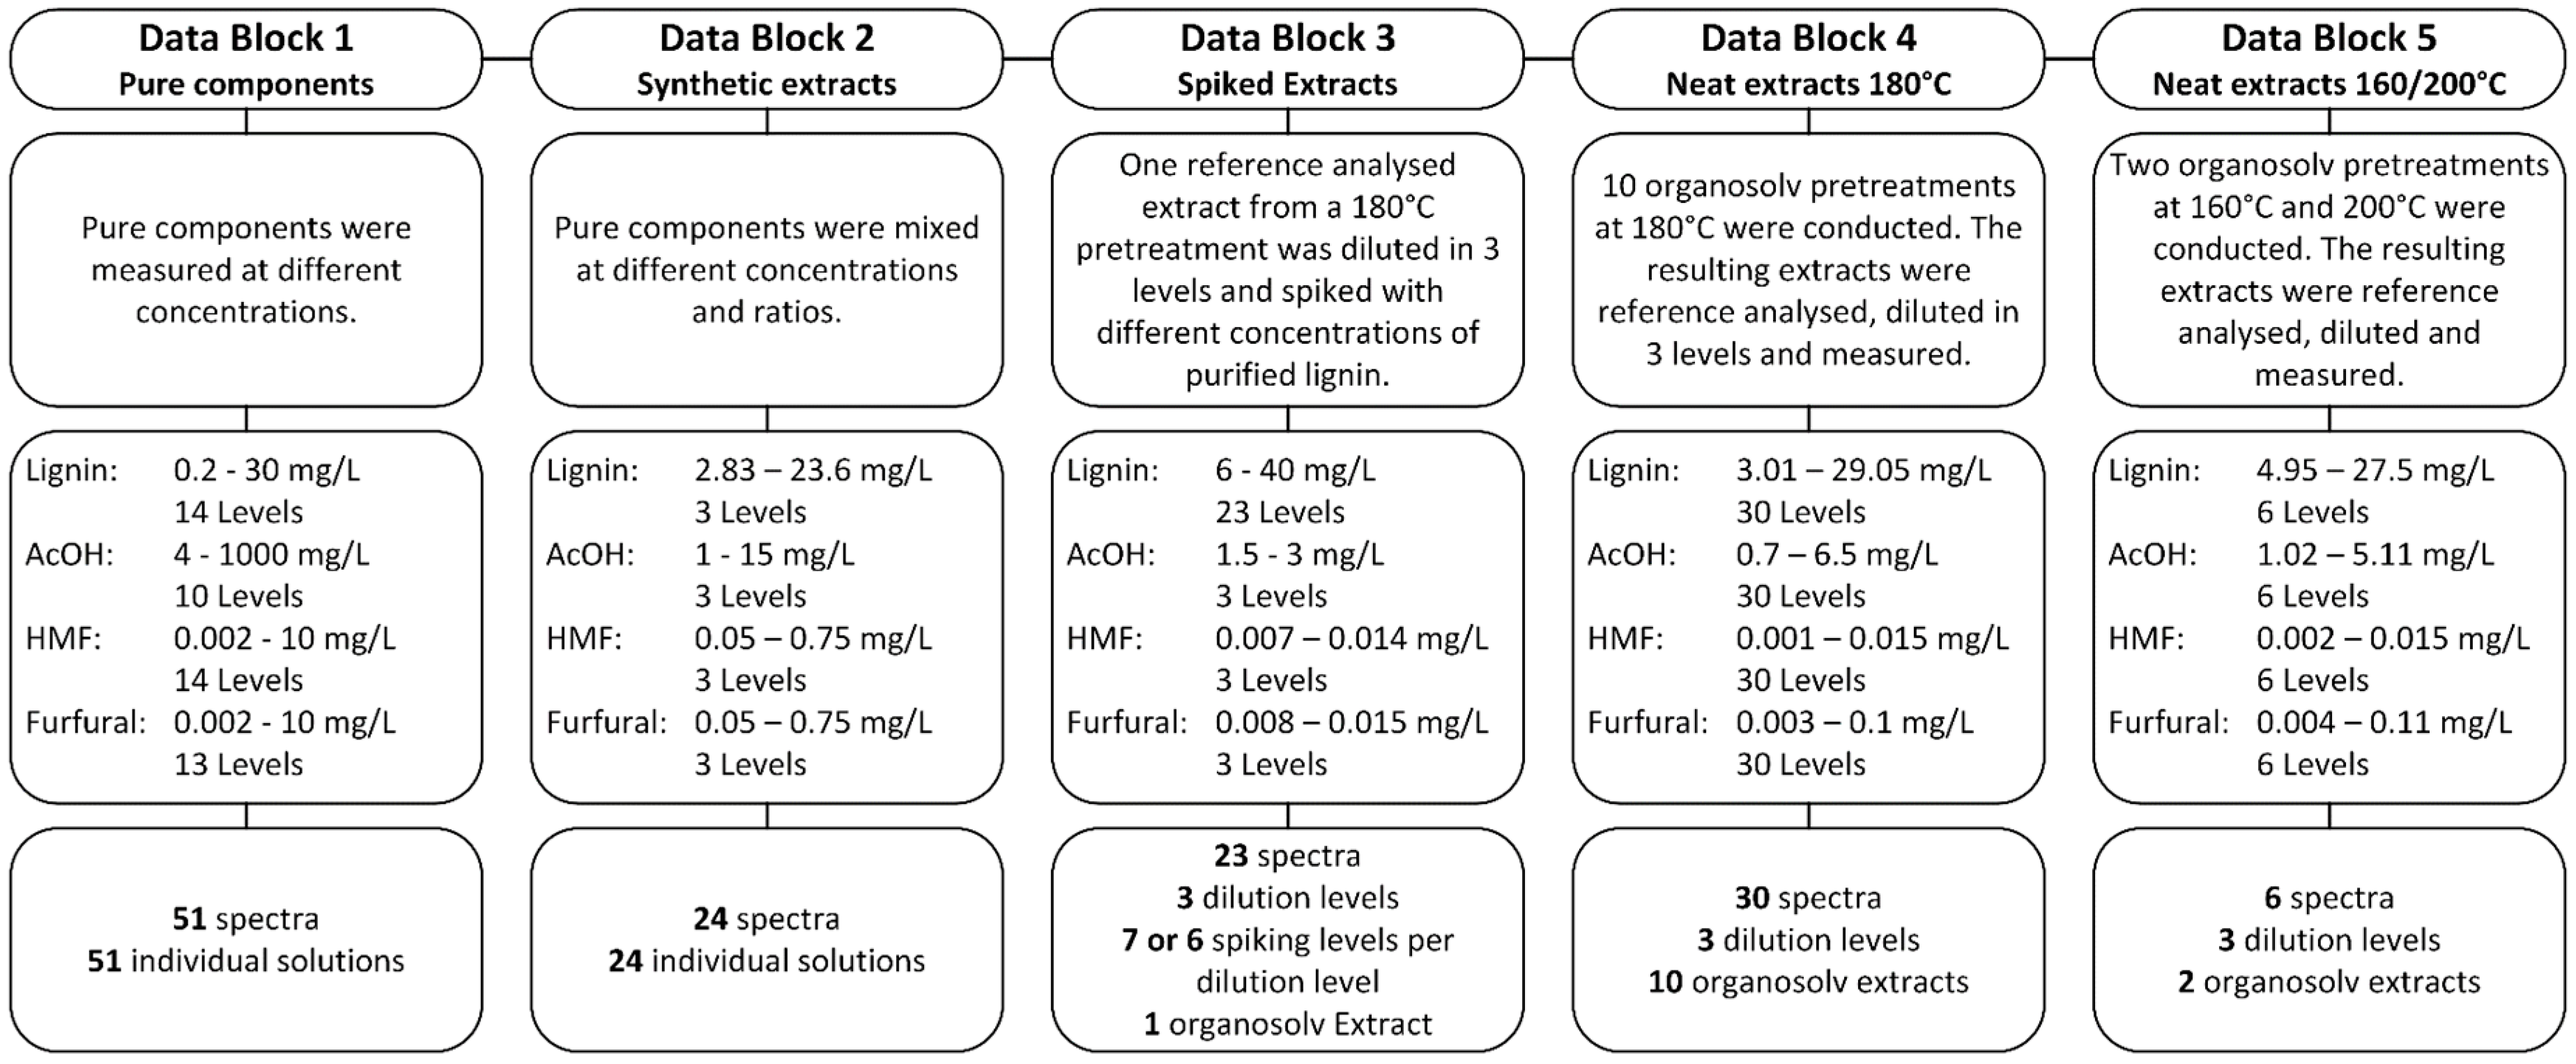
Subsequently, five different sample sets were prepared and UV-Vis spectra were recorded, resulting in the data blocks which are summarized in Figure 1. All samples were measured in a 60 wt % aqueous ethanol solution. The reference concentrations of all components in the five data blocks are shown in the Supplementary Material in Tables S1–S5.
2.4. UV-Vis Spectroscopy
UV-Vis spectra were recorded with a Spectrophotometer UV-1800 (Shimadzu, Kyoto, Japan) in a wavelength range of 190–450 nm using a spectral resolution of 1 nm. The organosolv extracts were diluted from 1:250 to 1:1000 in 60 wt % aqueous ethanol and measured in 100-QS cuvettes (Hellma Analytics, Müllheim, Germany) with a 10 mm path length at room temperature. As the background, 60 wt % aqueous ethanol was used and internally subtracted from the sample spectra. Absorbance values were exported from the spectrophotometer software UV-Probe 2.62 (Shimadzu, Japan) and subsequently used for chemometric calculations.
2.5. Chemometrics
Data pre-processing and analysis was carried out in the open source software “R” [17]. Different packages were used for various data treatments. For calibration models, the package “chemometrics” [18] was used. Derivatives were calculated with the package “prospectr” [19], and the “pls” package [20] was used to apply the chemometric models to validation samples.
The spectral data from the UV-Vis measurements were reduced to a wavelength range of 200 nm to 450 nm in order to remove noise below a wavelength of 200 nm. The wavelength reduced and not pre-processed data is further referred to as raw data and directly used for PLS. Additionally, three data pre-processing methods were applied before PLS. The first and second derivative of the spectral data was calculated using a Savitzky–Golay filter with a window size of 5 and a second polynomial order. Furthermore, a pretreatment method for a linear regression prediction method for furfural and HMF described by Martinez et al. [21] was modified and applied. This method uses the difference of the absorbance at wavelength 284 nm and 320 nm in order to determine furfural and HMF. In this work, the method was adapted by normalizing the spectral data to the absorption at 284 nm and 320 nm, respectively, and the two normalized spectra were subtracted and applied in the PLS. This pre-processing method is further referred to as Δ284/320 nm. Details of these datasets are shown in Tables S6 and S7 of the Supplementary Materials. Matrix X (n × m) for PLS has n = 6, ..., 30 rows (samples, spectra) and m = 247, ..., 251 columns (variables, absorbances or preprocessed absorbances).
PLS regression was combined within the strategy of repeated double cross validation (rdCV), more specifically to all pretreated data sets and to the raw data, separately for each block and separately for the four components lignin, acetic acid, furfural, and HMF. The rdCV is a strategy for optimizing the complexity of regression models and for a realistic estimation of prediction errors when the model is applied to new cases that are within the population of the data used [16,22]. It includes two nested cross-validation (CV) loops and a repetition loop. In the repetition loop, the dataset is randomly split into calibration sets and test sets. The inner CV loop uses the calibration set, divides it randomly into a training and validation set, and estimates the optimum complexity of the model. The outer CV loop uses the test set, applying the optimized model from the inner CV loop, and results in predicted values (ŷ) for the test samples. An essential feature of rdCV is the separation of model optimization and model performance tests. Each repetition of rdCV yields a test set predicted ŷ value for each sample from which the performance criterion SEP is calculated.
SEP is the standard deviation of the prediction errors for test set samples, short “standard error of prediction” (SEP), defined as:
The target value of the modelled property for sample i is denoted by , the predicted value by . The bias is the arithmetic mean of the prediction errors (); z is the number of test set cases used. SEP is an appropriate measure for the prediction performance if the prediction errors are normally distributed; a 95% tolerance interval for predicted values is ±2 SEP.
Repeating the double CV 50 times gives 50 estimations of SEP (from varying random splits into sets), allowing a reasonable comparison of different data sets. A more detailed explanation of the rdCV is shown in Filzmoser et al. [16].
The optimal number of PLS components resulting from the rdCV was applied for PLS models derived from certain complete data blocks, and these models have been applied to data blocks with increasing amounts of impurities. Thus, the prediction accuracy for external samples could be estimated using the SEP and bias values as indicators.
For reduction of the calibration complexity, two different approaches were investigated: (1) calibration with lignin-spiked organosolv extracts (data block 3) and (2) calibration with reference-analyzed organosolv extracts (data block 4). For the first approach, the number of calibration samples from data block 3 was gradually decreased and the resulting calibration model was applied to data block 4. In this way, the minimum number of calibration samples was estimated. The calibration samples from block 3 were randomly chosen and the procedure was repeated 100 times for each calibration sample size. For the second approach, rdCV was applied to data block 4 and the number of samples was randomly chosen with a repetition of 5 for each calibration sample size. The second approach was therefore not applied to external samples.
3. Results and Discussion
3.1. Single Component Spectra
In a first step, the UV-Vis spectra of the pure components lignin, acetic acid, furfural, and HMF were investigated. The spectra of the pure components are shown in Figure 2. The positions of the minima and maxima in these spectra are mostly different in the four substances.
Separated and purified lignin from a wheat straw organosolv pretreatment process shows the least specific spectra due to its heterogeneous molecular structure. However, maxima at 203 nm and 274 nm, as well as a minimum at 258 nm, are present. Acetic acid has a specific maximum at 206 nm, but shows a very low absorbance in comparison to the other three components. For example, the absorbance coefficient at 203 nm has a value of 78.8 L/g cm and 0.607 L/g cm for lignin and acetic acid, respectively. HMF shows slightly shifted maxima and minima to a higher wavelength when compared to furfural. Maxima appear at 227 nm and 275 nm for furfural and at 228 nm and 284 nm for HMF. The minima are at 206 nm and 241 nm for furfural and 211 nm and 244 nm for HMF. The absorbance coefficients are in the same order of magnitude as lignin.
The absorbance coefficients are of special interest since the concentrations of the single components vary considerably. Applying organosolv pretreatment conditions used in this work, the share of the components is roughly 82%, 18%, 0.1%, and 0.1% for lignin, acetic acid, HMF, and furfural, respectively. However, these shares can change significantly when pretreatment parameters are changed.
3.2. Validation of the Calibration
To validate the possible application of UV-Vis spectrometry in combination with PLS, the data blocks 1 to 4 were characterized in terms of their prediction errors as obtained from rdCV [16]. The interferences and impurities regarding a certain component are gradually increased from data block 1 to data block 4. This gives an indication of the influence of the inevitable impurities in processes with natural raw materials on the prediction ability of each component. Only the data of each data block is investigated and no connection between the data blocks was made.
The quality of the calibration was evaluated by the resulting SEP values. The results of all combinations of pre-processing and analyzed components are shown in Table 1.
In terms of the data preprocessing, the raw data exhibit the smallest SEP in most cases. The pre-processing method Δ284/320 nm gives the poorest calibration performance, e.g., with lignin SEPs 28.3, 12.6, and 9.2 times higher compared to the raw data for block 2, 3, and 4, respectively. The first derivative data shows results similar to the raw data, whereas the second derivative gives increased SEP values. All components in block 1 can be quantified with an SEP less than 16% of the standard deviation of the component concentrations in the calibration data set when the raw data is used for rdCV.
The low prediction performance for acetic acid in blocks 1 and 2 can be explained by the low absorption coefficient, and low concentrations in block 2.
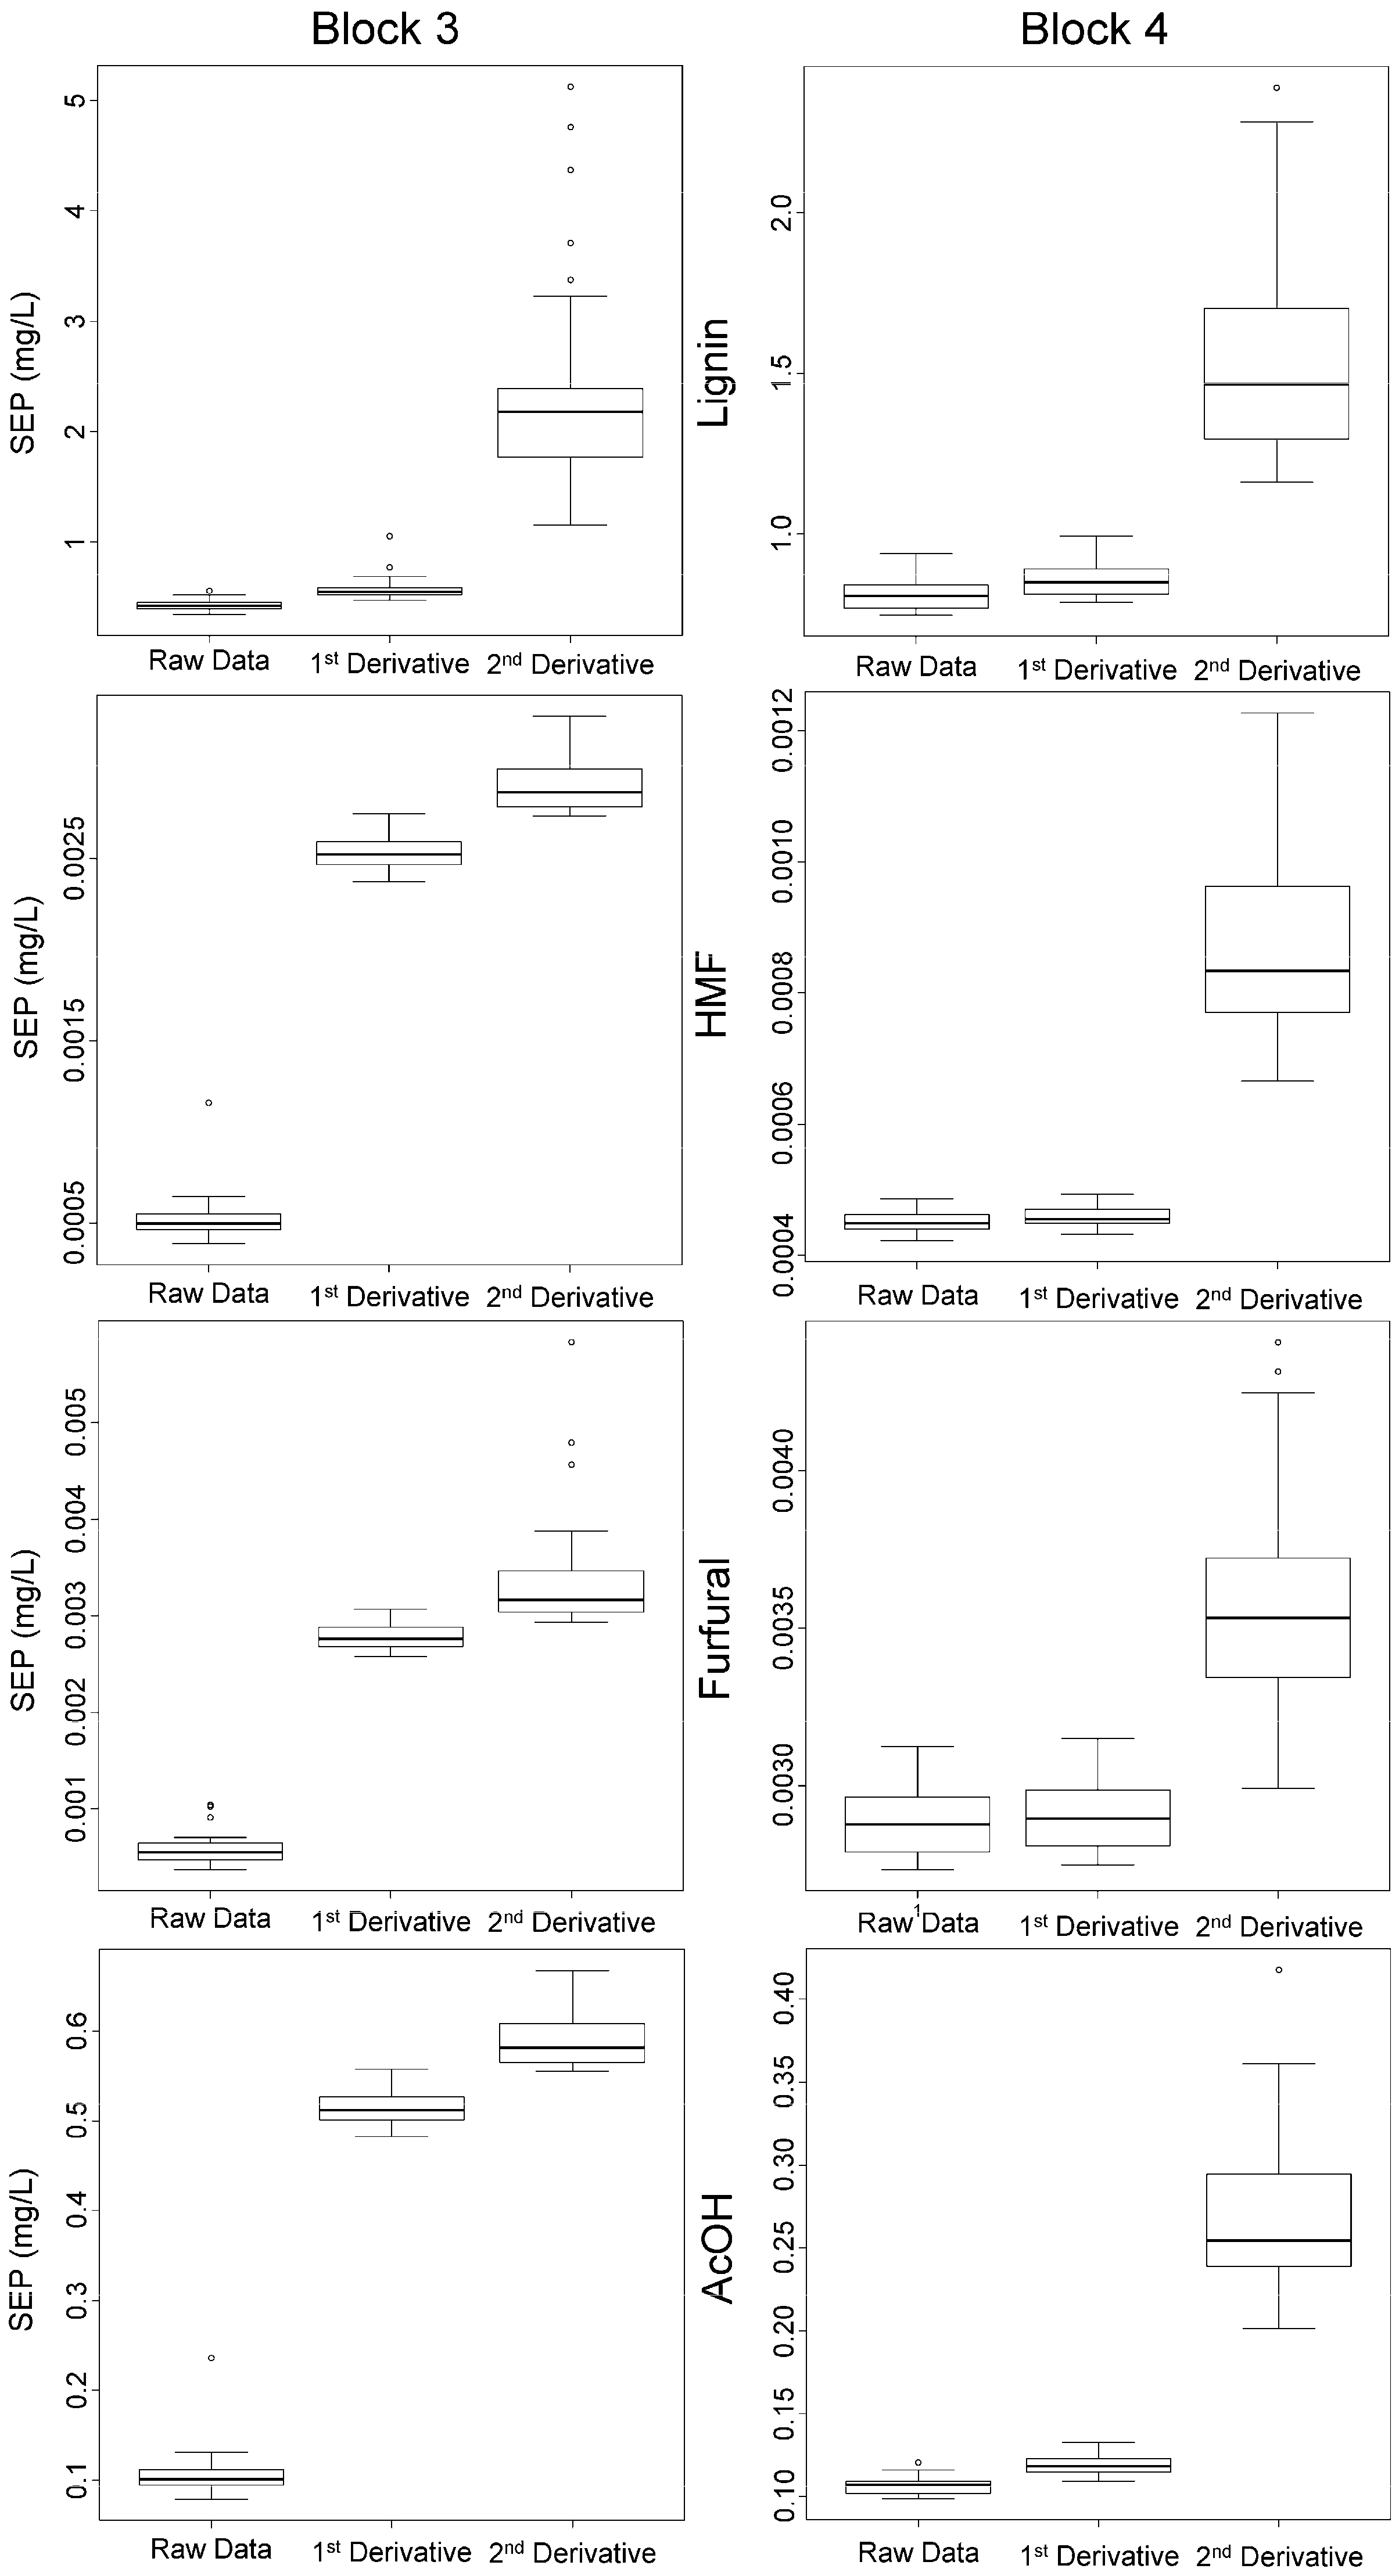
The range of the SEPs of block 3 and 4 of selected data is presented by boxplots in Figure 3. Data blocks 3 and 4 show the highest amounts of impurities and represent real process conditions. The second derivative as the pre-processing method shows, in all cases, higher SEP and a wider range compared to the raw data. Furthermore, the first derivative shows comparable SEPs in the case of lignin in block 3 and 4, as well as for HMF, furfural, and acetic acid in block 4. These results clearly indicate that the applied pre-processing does not improve the calibration models. Consequently, only the raw data have been used throughout the following investigations.
To compare the influence of impurities in the calibration samples, the standard deviation of the concentrations in the calibration sets was divided by the SEPs, which is necessary to compare the different concentration ranges in the data blocks. The values are shown in Figure 4, where high ratios indicate a good predictability. Lignin shows the overall best predictability, indicated with ratios of at least 10 in all four data blocks. The decreased value in block 4 compared to block 3 might arise from errors in the reference method since lignin determination still remains a challenging task [23]. HMF, as a pure component, offers a very high predictability with a ratio of up to 109.6, but decreases significantly when impurities are present, to values of 4.0, 5.6, and 5.1 for block 2, 3, and 4, respectively. Furfural shows a low predictability as a pure component with a ratio of 6.6 and decreases further when predicted in the spiked extracts of block 3 with a value of 5.4. In block 4, a ratio of 2.6 was reached. Highly variable results can be seen for acetic acid due to the low absorbance coefficient, which is roughly a factor of 100 lower compared to the absorbance coefficient of the other components. Acetic acid as a pure component shows a good predictability with a ratio of 18.3, but is not predictable in block 2. The maximum acetic acid concentrations present in data block 1 and 2, however, are significantly different with 1000 mg/L and 15 mg/L, respectively. In data block 3, the predictability increases compared to block 2 and block 4 shows a similar value to block 1.
The optimal model complexity (and optimal number of PLS components) was determined via rdCV; for details, see [16,24]. The results are summarized in Table 2. The low values between 1 and 4 indicate high correlations between the used variables.
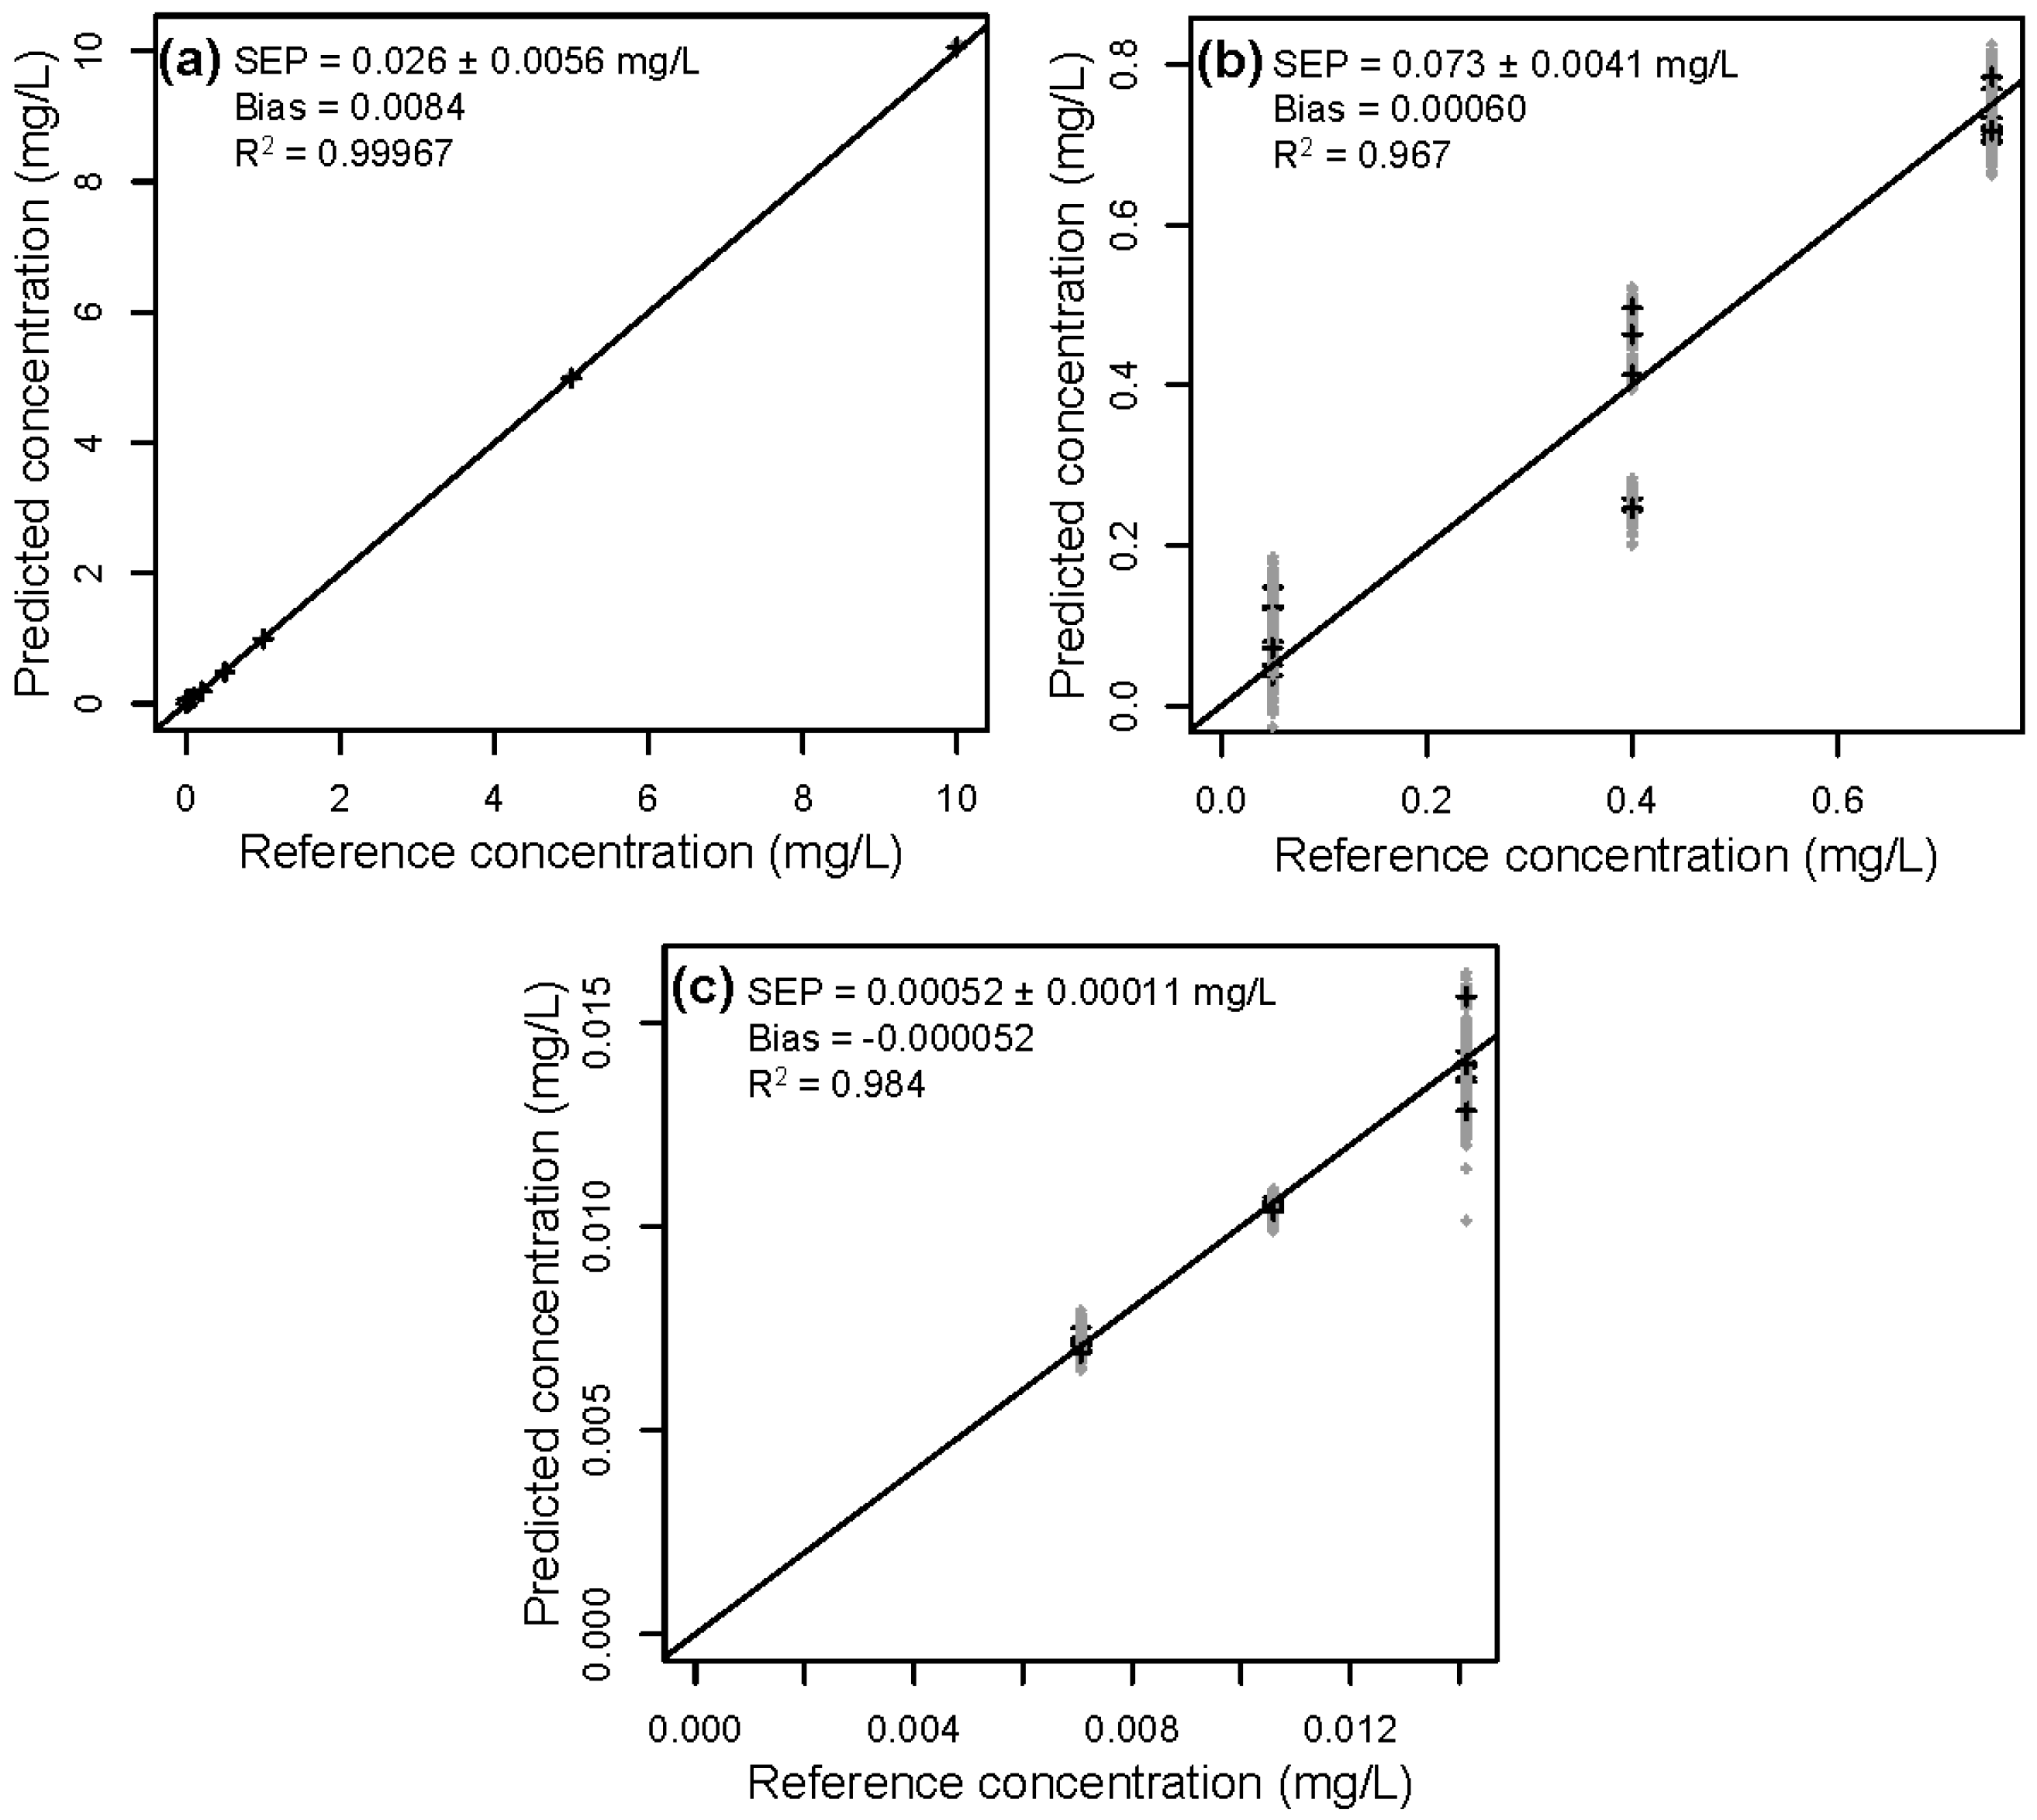
The reference vs. predicted concentrations for HMF as obtained by rdCV for the data blocks 1 to 3 are shown in Figure 5. The concentration range of the calibration data set gradually decreases from block 1 to 3. Blocks 2 and 3 show high variations of the SEP values in the applied 50 repetitions (indicated by the grey crosses). Especially the concentrations in block 3 are low and close to the detection limit of the spectrophotometer, which might explain, in combination with the increased amount of impurities, the declining predictability.
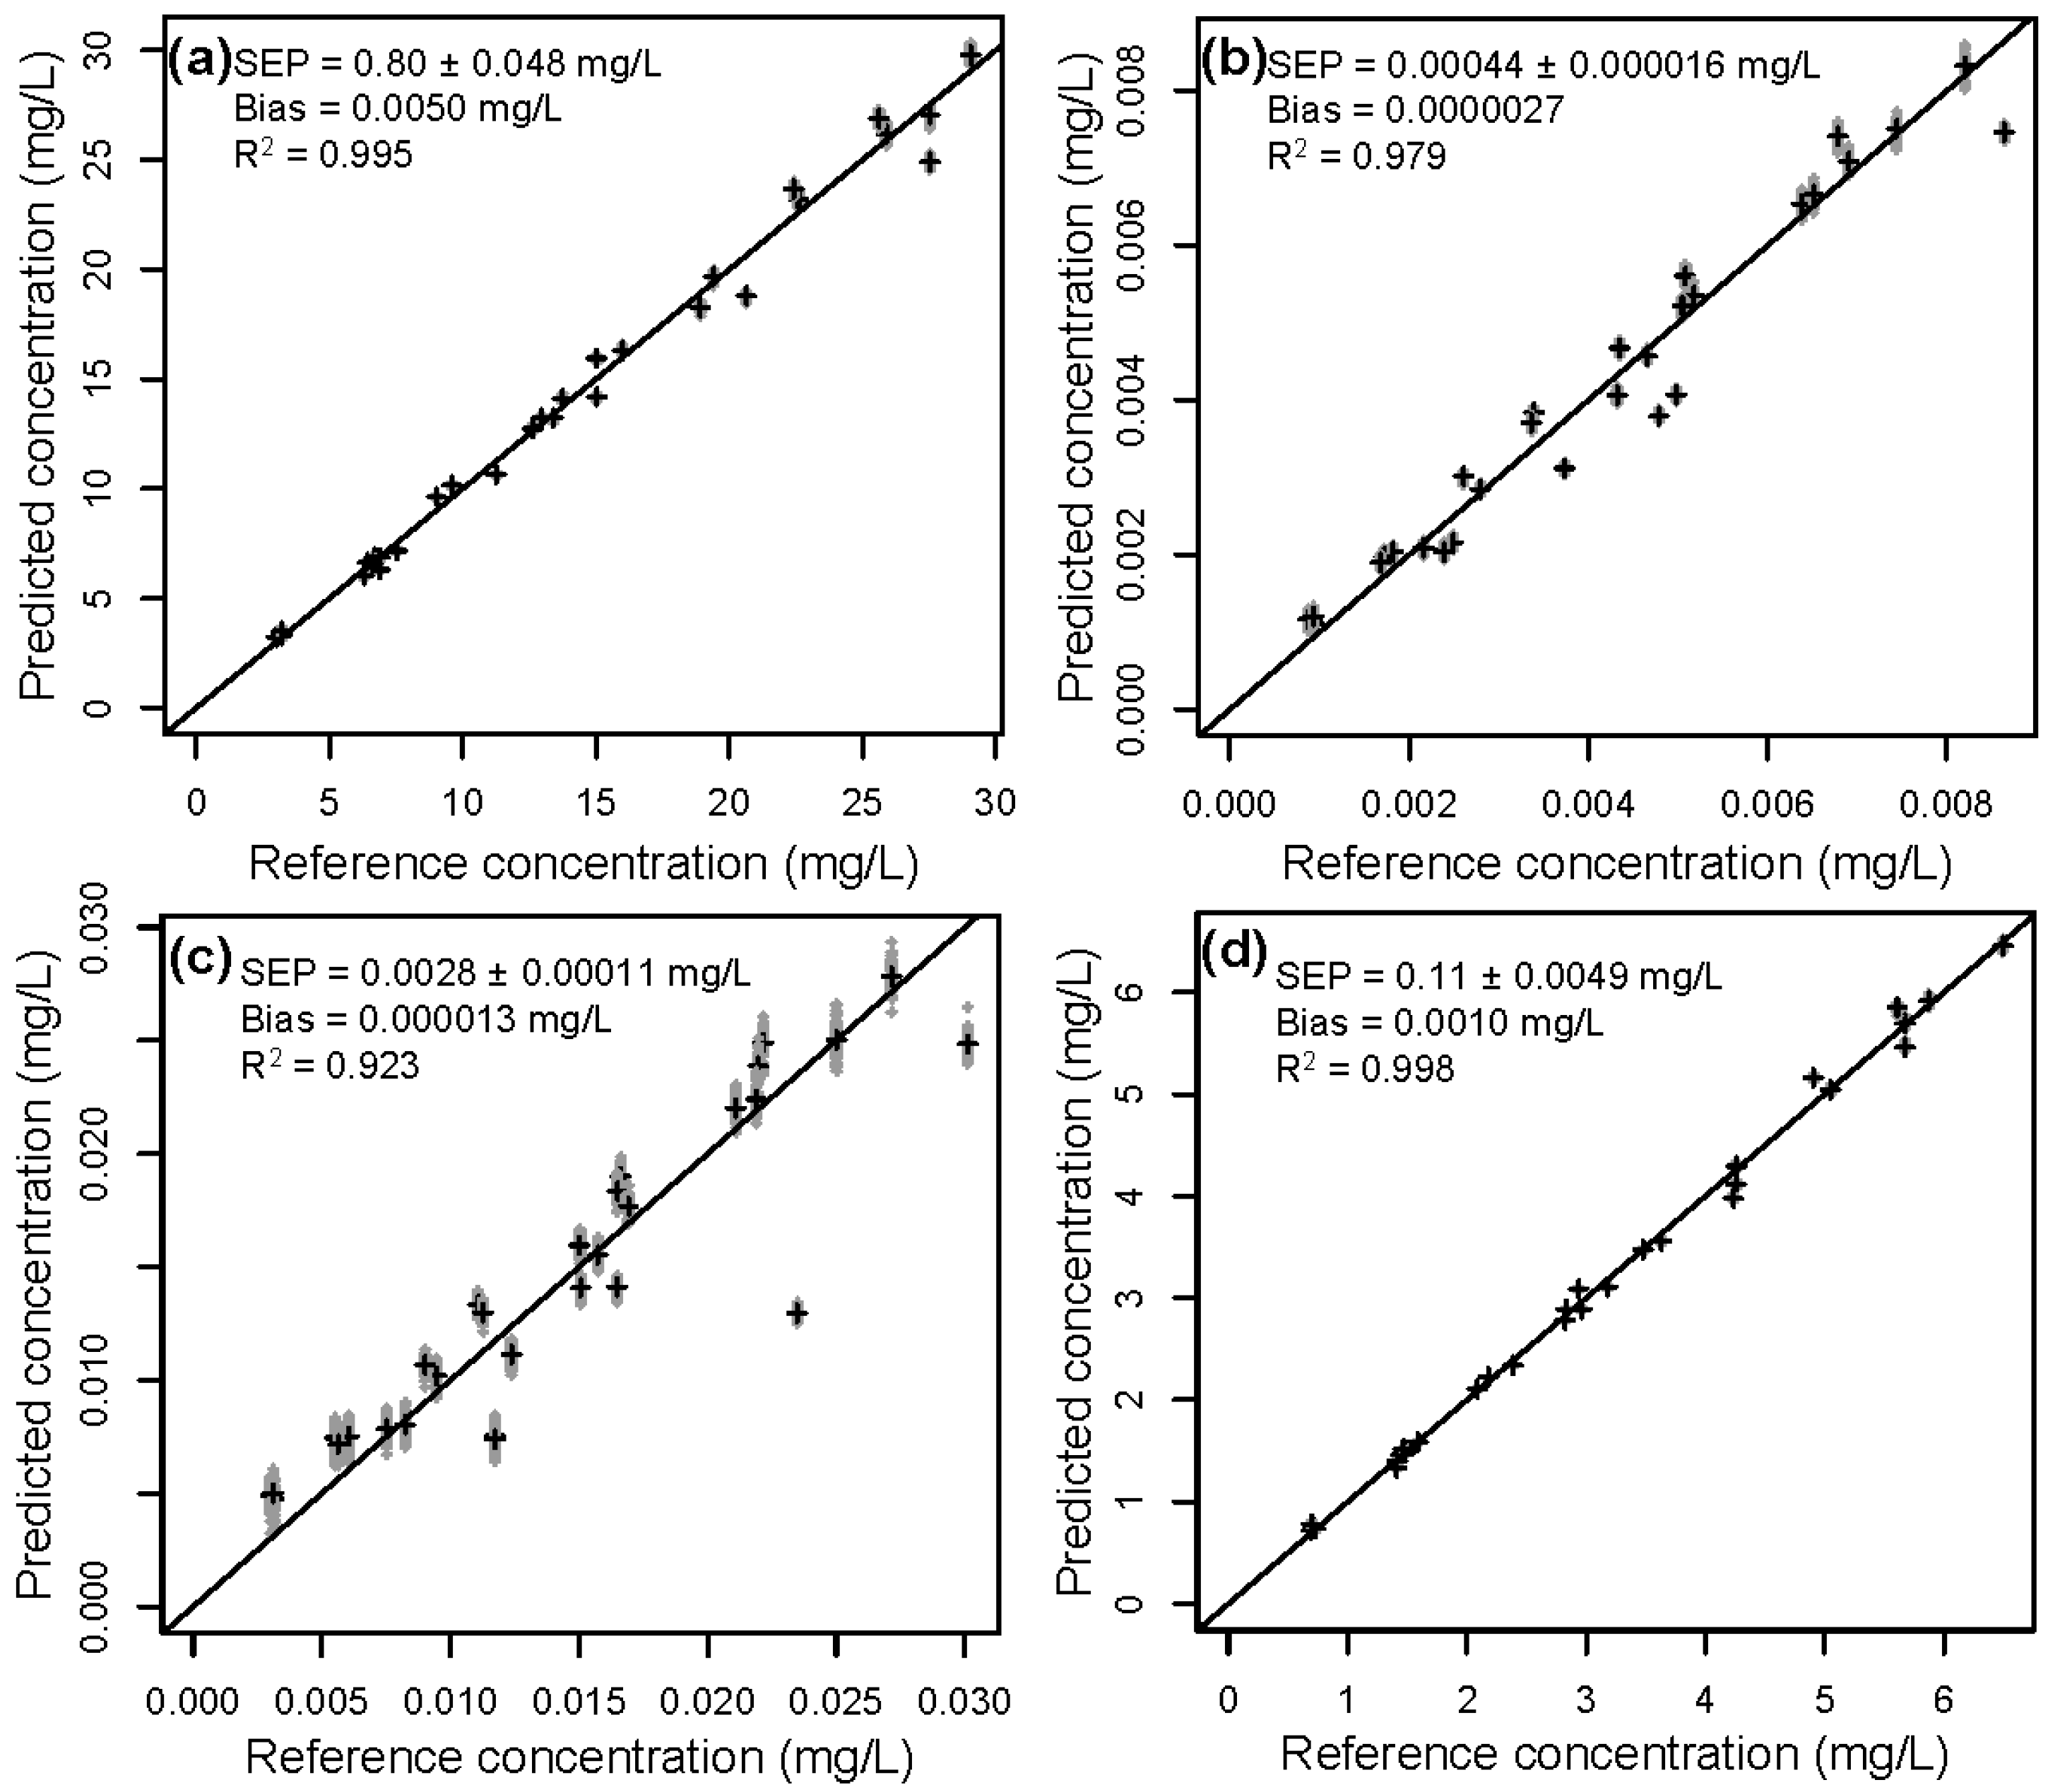
Figure 6 shows rdCV results of all components for the calibration with neat diluted extracts from block 4. Calibrations for all components show a high correlation between predicted and reference values, with correlation coefficients of 0.995, 0.980, 0.923, and 0.998 for lignin, HMF, furfural, and acetic acid, respectively. It can be stated, that within given data set, a high predictability and accuracy can be reached.
3.3. Model Application
The conventional methods for the composition analysis of organosolv extracts are labor intensive and time consuming. It is therefore favorable if this analytical effort can be at least minimized in the calibration step of the PLS model. The preparation and measurement effort for the data blocks 1 to 3 increases, respectively. The application of pure component spectra in the data block is therefore favorable in terms of labor input.
We investigated the applicability of calibration models made from data blocks 1 to 3 to the neat organosolv extracts from data block 4. The resulting SEP and bias values are given in Table 3. While the bias values are near zero within the CV in the calibration, significant values appear for the external test data, indicating systematic errors. Decreasing bias values from block 1 to block 3, respectively, can be seen, especially for HMF and AcOH, induced by the increasing amounts of impurities in the calibration samples. If using an appropriate correction for the bias, a calibration model from block 3 might give an option for calibration with decreased effort compared to the use of several reference-analyzed extracts.
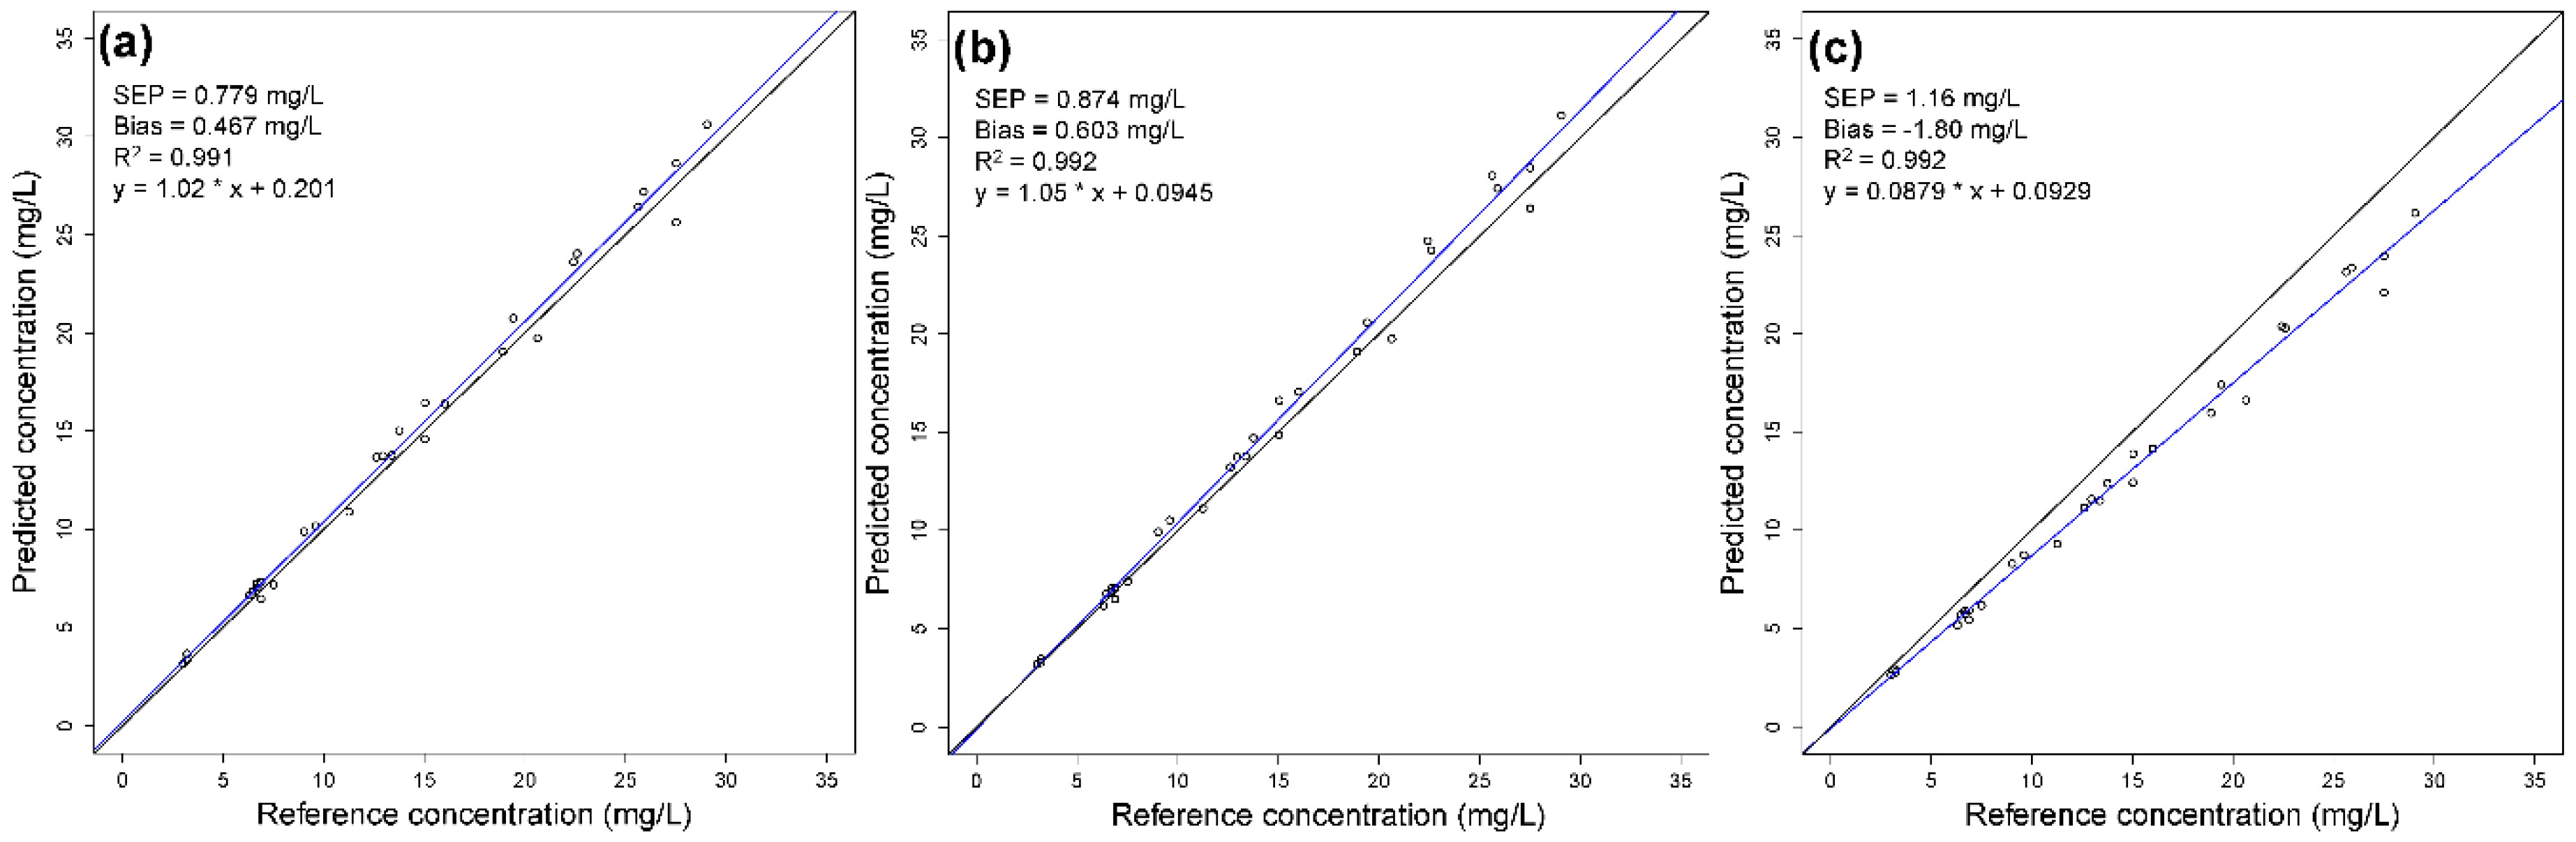
The application of PLS models for lignin made with data of block 1, 2, and 3 to data block 4 is shown in Figure 7. All three calibration models show a good predictability; however, an increasing systematic deviation can be seen from block 1 to block 3, corresponding to increased impurities in the calibration samples. Calibration with pure component samples is therefore recommended.
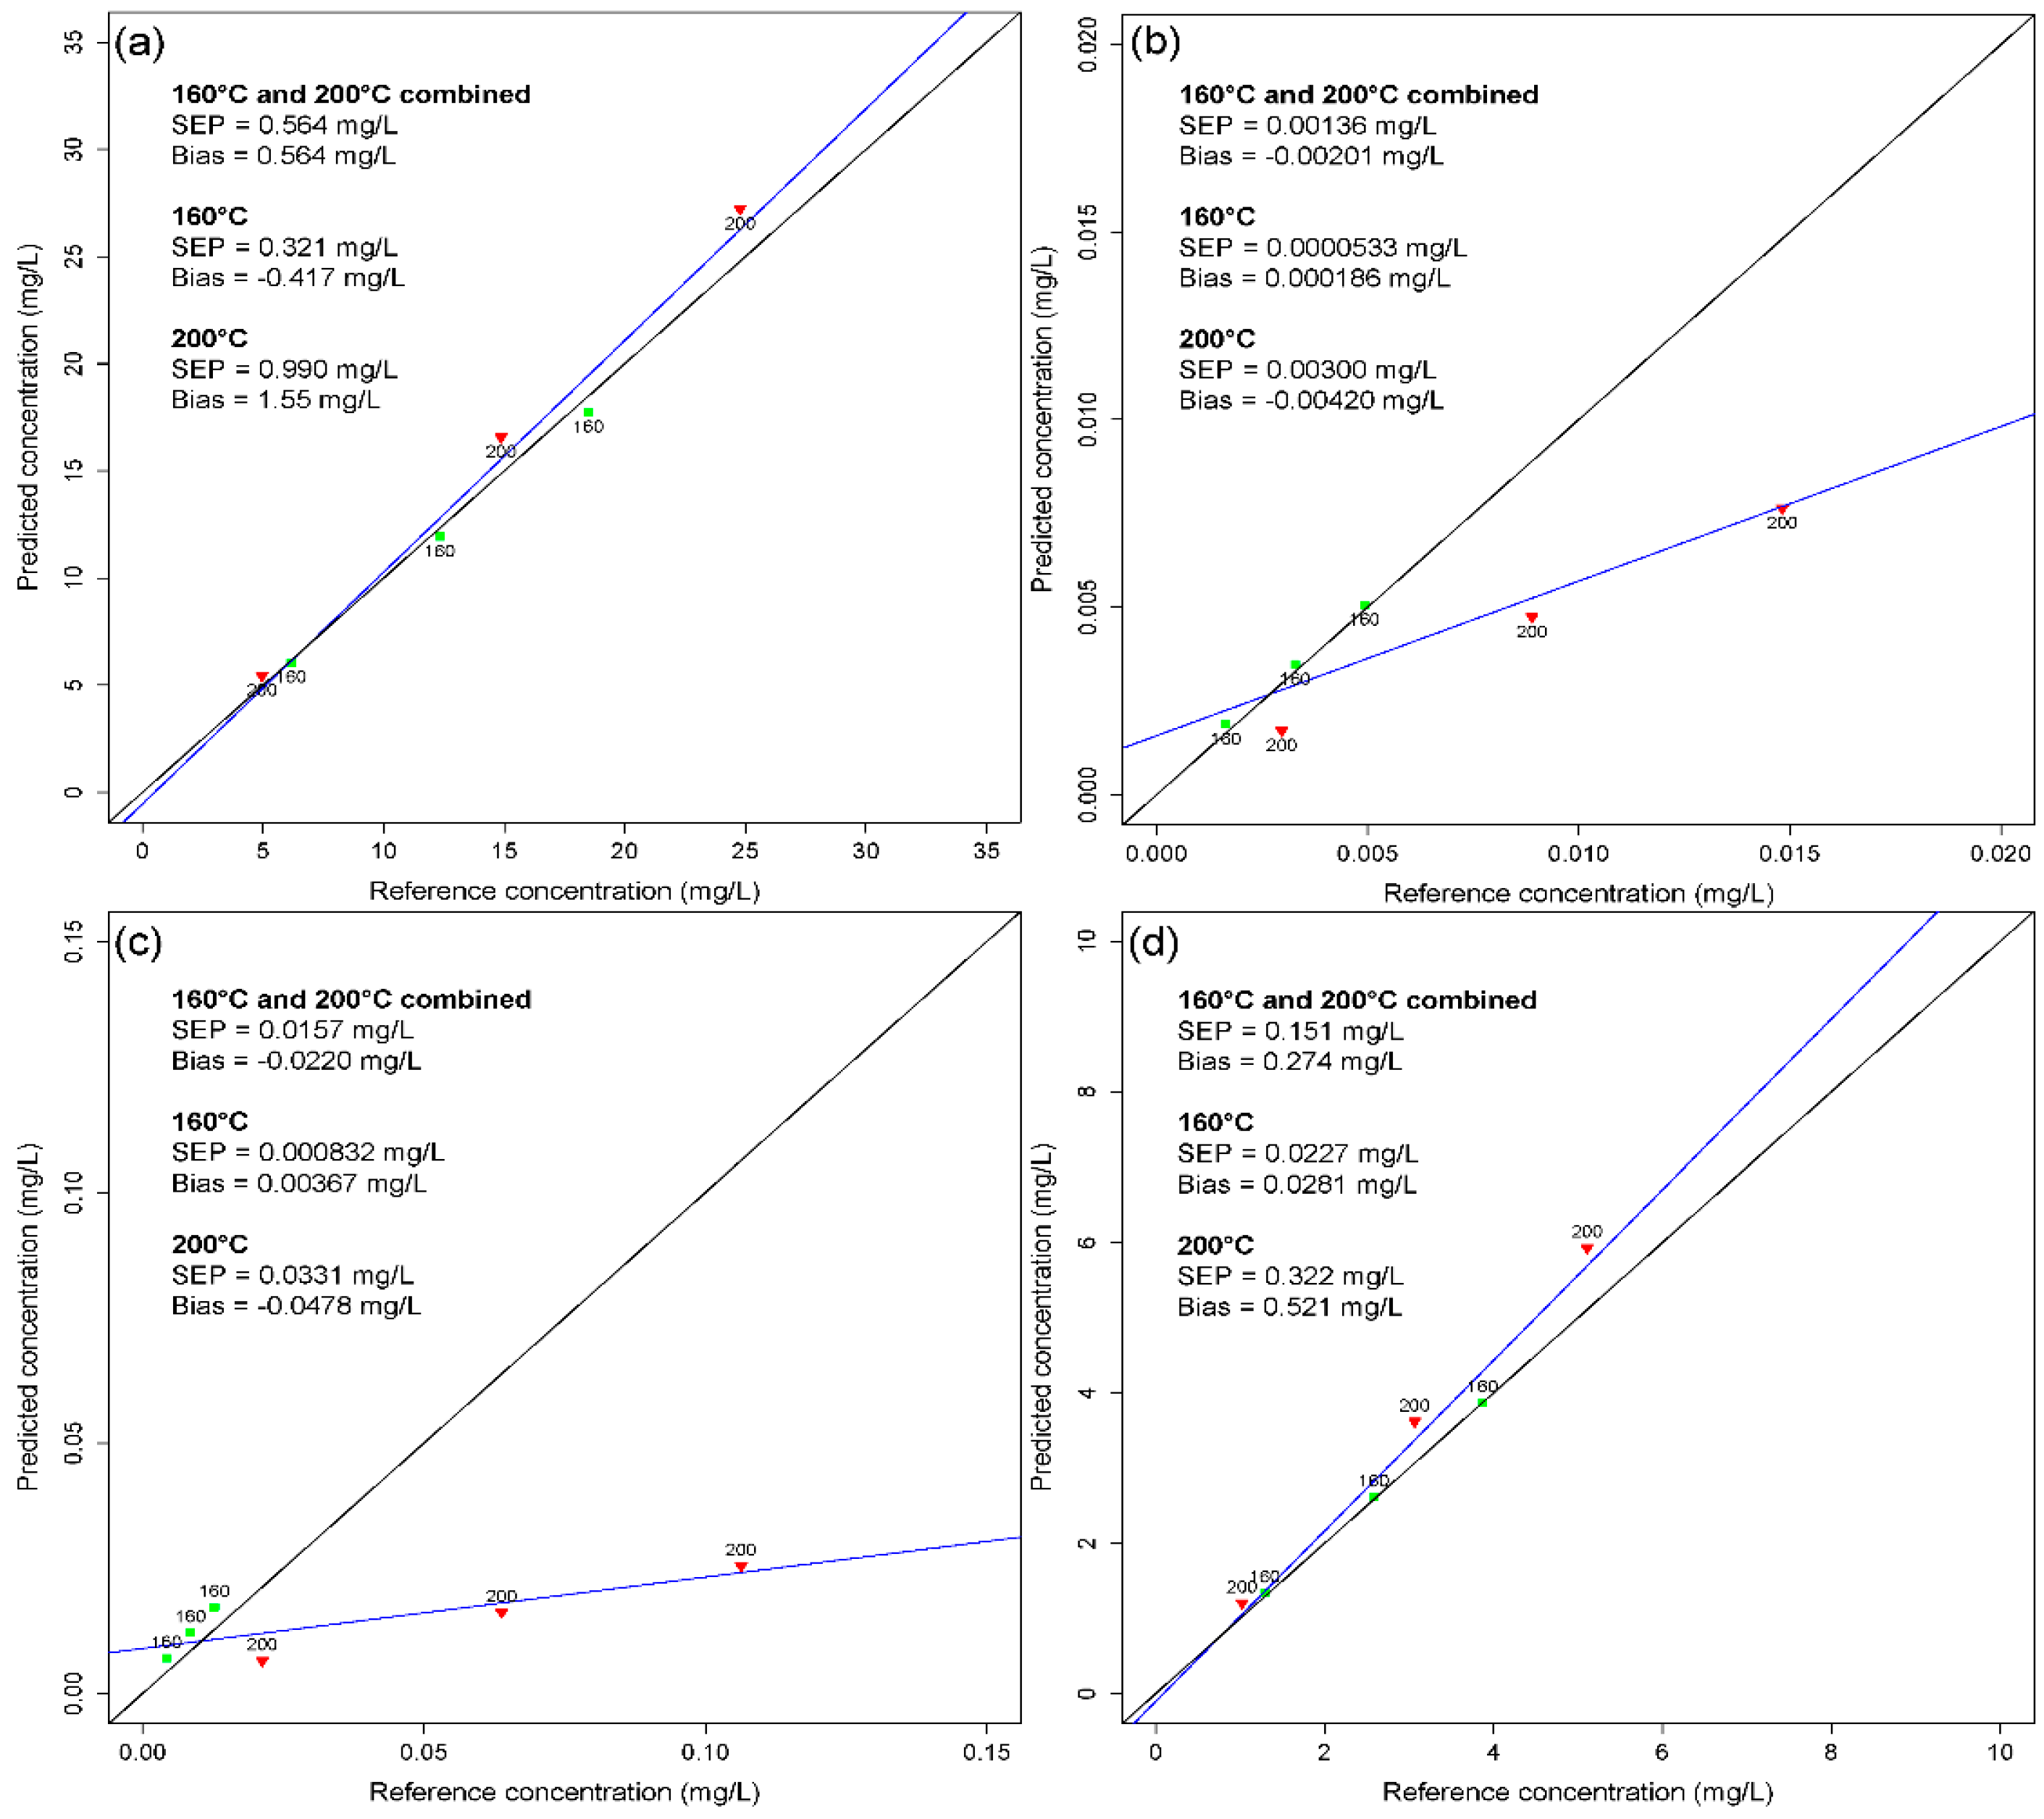
3.4. Influence of the Pretreatment Temperature
Changing pretreatment temperatures can strongly affect the concentrations and shares of the investigated components lignin, acetic acid, furfural, and HMF. Figure 8 shows the concentrations of the four components in the undiluted extract. Increasing pretreatment temperature shows a significant effect on the carbohydrate degradation products HMF and furfural. HMF increases from 1.64 mg/L to 5.93 mg/L when increasing the pretreatment temperature at a constant treatment time from 160 °C to 200 °C. Furfural shows a similar behavior, with the concentration increasing from 4.25 mg/L to 42.5 mg/L with increased treatment severity from 160 °C to 200 °C.
Ideally, a calibration model obtained from samples from a certain pretreatment temperature can be applied for a wide range of pretreatment temperatures. However, changing component concentrations and interferences might affect the prediction results. In order to investigate the limitations of the calibration obtained from samples at a pretreatment temperature of 180 °C, this calibration was applied to data block 5, which consists of samples from pretreatment temperatures 160 °C and 200 °C.
Figure 9 shows the reference vs. the predicted concentration values of lignin, HMF, furfural, and acetic acid. In organosolv extracts with a pretreatment temperature of 160 °C, all components can be predicted with an SEP of 0.321 mg/L, 0.0000533 mg/L, 0.000832 mg/L, and 0.0227 mg/L for lignin, HMF, furfural, and acetic acid, respectively. The 200°C samples in comparison show considerably higher SEP values of 0.990 mg/L, 0.00300 mg/L, 0.0331 mg/L, and 0.322 mg/L for lignin, HMF, furfural, and acetic acid, respectively. The determination of lignin and acetic acid is somewhat less influenced by the pretreatment temperature compared to HMF and furfural.
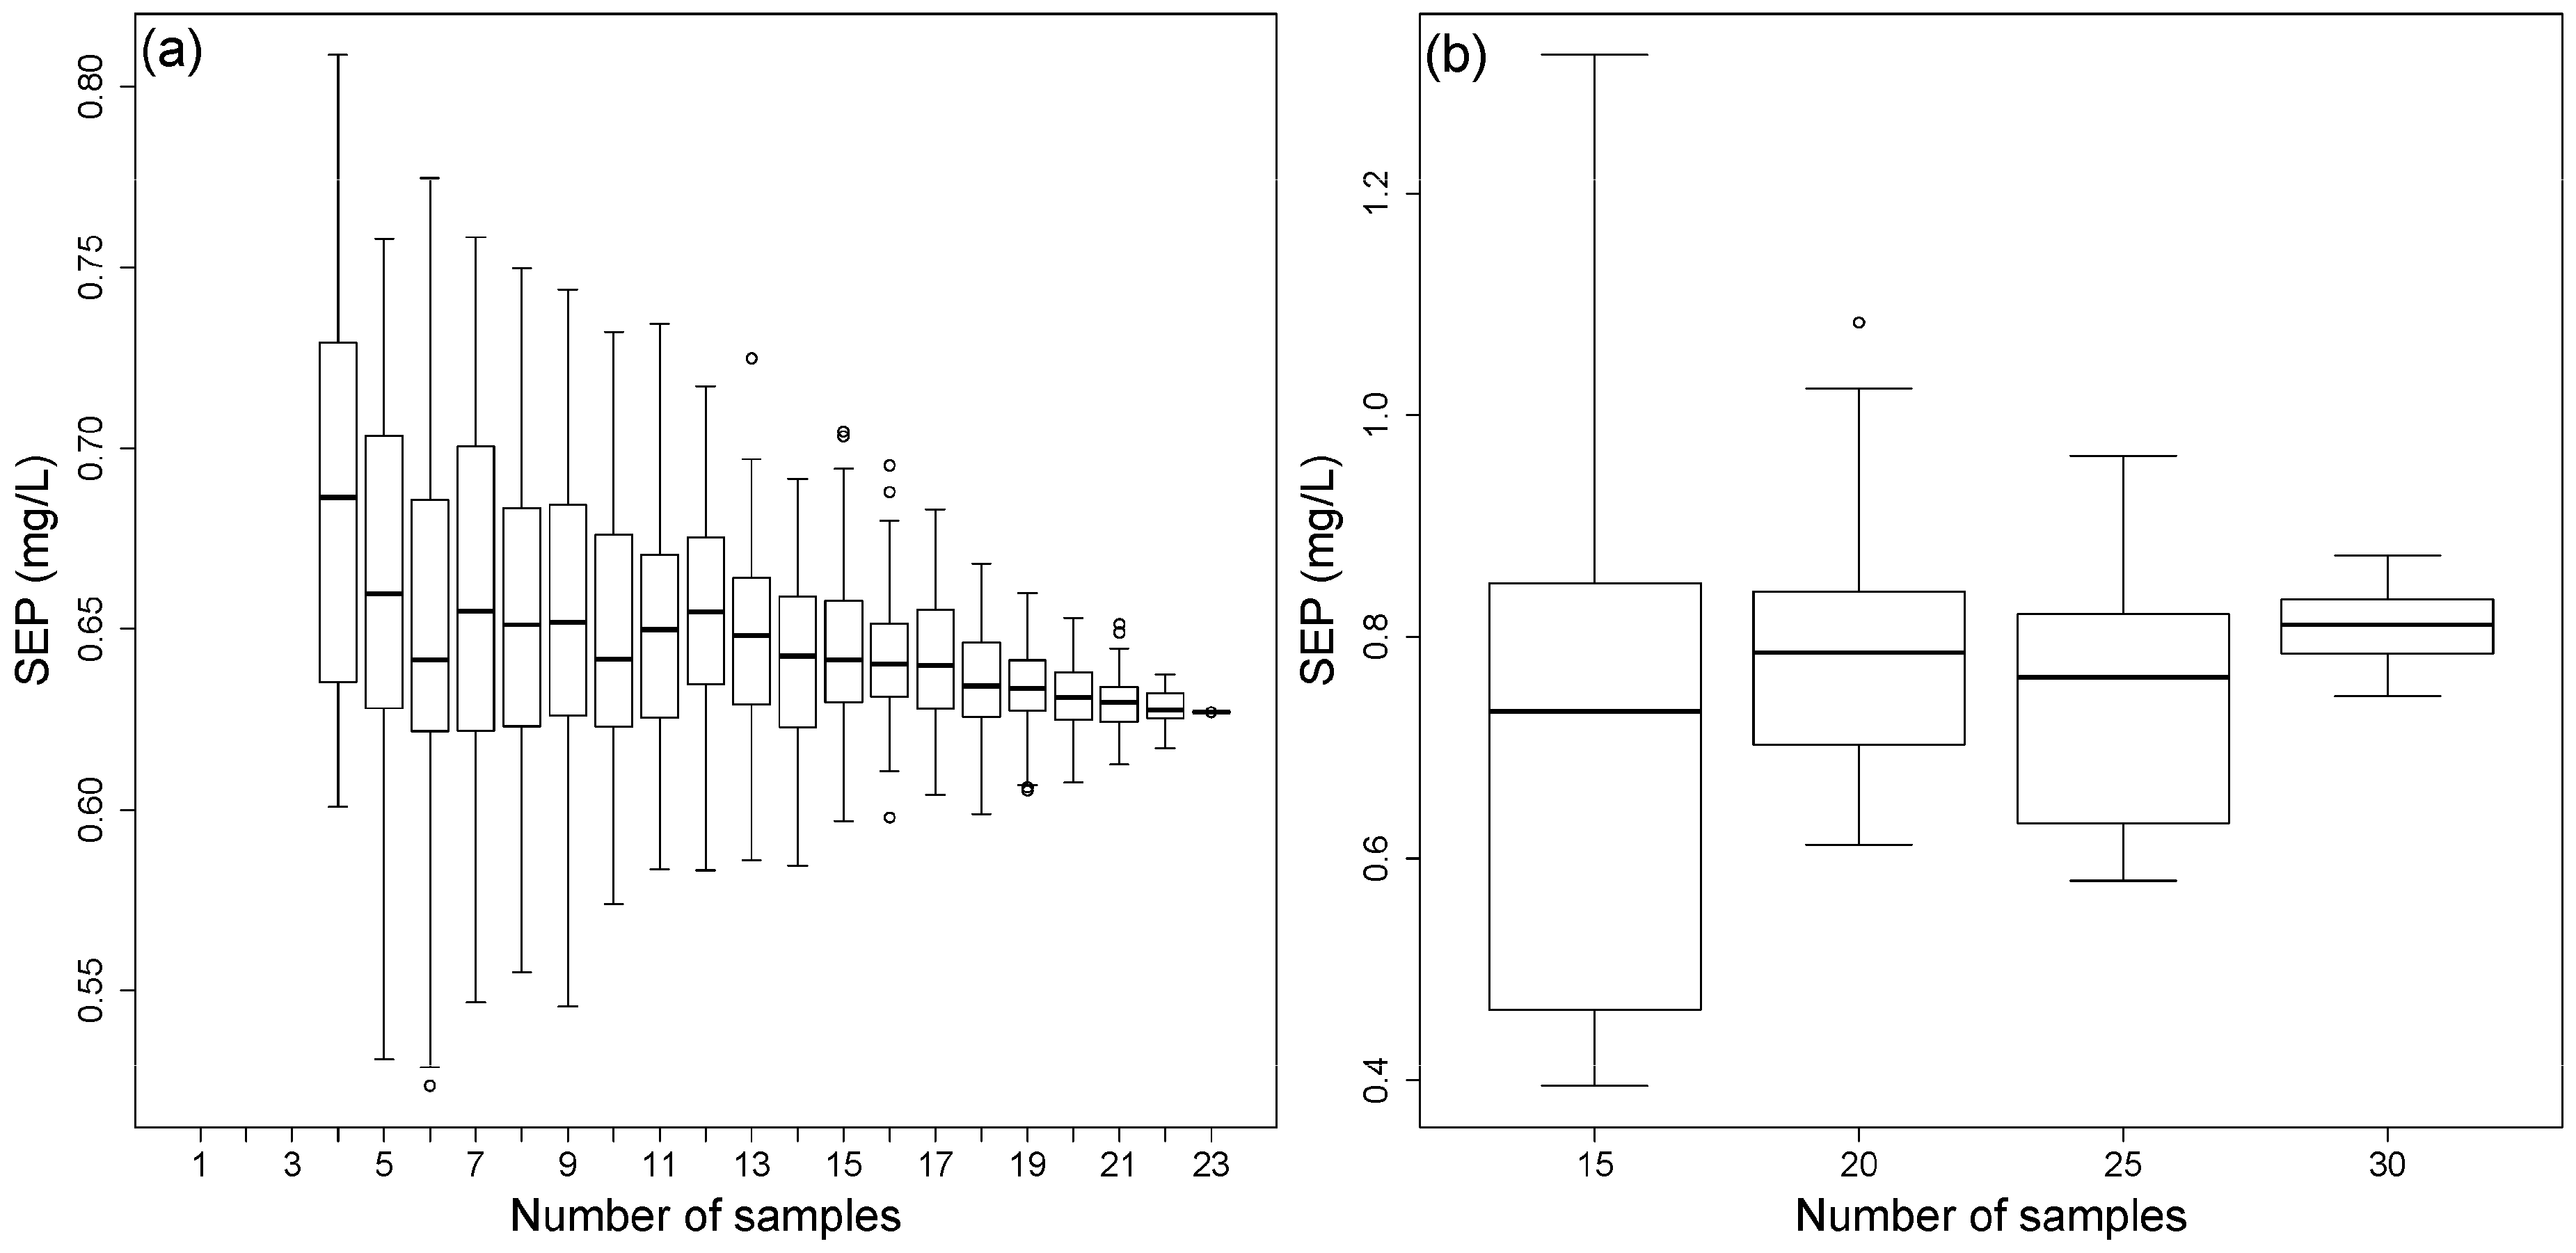
3.5. Reduction of the Calibration Effort
In case of alternative raw materials or strongly changing process conditions, a new calibration is unavoidable. Therefore, a minimal number of reference measurements and calibration efforts is favorable. In order to investigate the minimum amount of necessary calibration spectra, the number of used spectra was stepwise reduced and resulting calibration models were applied to data block 4.
Two approaches for a reduction of the effort of lignin calibration were chosen: (1) utilization of spectral data from block 3 and application to block 4; and (2) calibration with reference-analyzed samples from block 4 for calibration and application to the same block via rdCV. The first approach is preferred since only a single lignin reference analysis is necessary. However, the lignin must be precipitated and purified before spiking of the sample. The second approach does not require lignin precipitation, but a larger number of samples and lignin analyses.
The results of the two approaches are shown in Figure 10. A significant increase of the SEP range appears with a decreasing number of calibration samples. Approach one shows a lower average and range of the SEP compared to approach two. However, the second approach includes error of the reference analysis. In contrast, the first approach is only based on one lignin reference analysis and tends to display systematic errors. Therefore, the higher SEP span for the second approach might be based on the error of the reference analyses. However, both methods can be applied with a reduced number of calibration samples, depending on the prediction needs.
4. Conclusions
The combination of UV-Vis spectroscopy and partial-least squares regression was successfully used for the prediction of the components lignin, acetic acid, HMF, and furfural in organosolv pretreatment extracts from wheat straw in a lignocellulosic biorefinery. The focus was on the monitoring of the pretreatment process. Five different data blocks with increasing amounts of impurities were investigated in order to evaluate the influence of the inevitable impurities. Lignin showed a good prediction accuracy with SEPs ranging from 0.23 to 0.80 mg/L in concentration ranges of 2.83–23.6 mg/L to 0.2–30 mg/L. Impurities showed a low influence on the results when data from reference-analyzed and lignin-spiked extracts were evaluated. The considerably lower concentrated carbohydrate degradation products HMF and furfural show a lower prediction accuracy compared to lignin; however, they still exhibited a good potential for monitoring of the process. The SEPs for these two components were in the range of 0.00044 to 0.45 mg/L for a concentration range between 0.01 and 10 mg/L.
In order to investigate a possible simplification of the calibration procedure, different data blocks with an increasing reference analysis effort were applied to neat and reference-analyzed extracts, which resulted in a good predictability for lignin and acetic acid, but shows the necessity for a correction factor for HMF and furfural if the calibration is not conducted with reference-analyzed extracts. Furthermore, the validity range of the calibration was investigated in terms of different pretreatment temperatures which affect the concentrations, especially that for HMF and furfural, remarkably. While the predicted values obtained with a calibration developed with samples obtained from 180 °C pretreatment temperatures are in good agreement with samples from a 160 °C pretreatment, rather high deviations were found for samples from a 200 °C pretreatment.
Supplementary Materials
The following are available online at https://www.mdpi.com/2305-7084/2/4/45/s1, Table S1: Reference concentrations in data block 1, Table S2: Reference concentrations in data block 2, Table S3: Reference concentrations in data block 3, Table S4: Reference concentrations in data block 4, Table S5: Reference concentrations in data block 5, Table S6: Overview of datasets used for PLS modeling after different pre-processing methods of Block 1, Table S7: Overview of datasets used for chemometric modeling after different pre-processing methods of Block 2 to 5.
Author Contributions
S.B. conceived and designed the experiments. M.B. performed the experiments and analyzed the data. K.V. supported the chemometric calculations. S.B. wrote and edited the manuscript with significant input and editing from M.B., A.F., A.M., and K.V.
Funding
This research received no external funding.
Acknowledgments
The authors acknowledge the TU Wien University Library for financial support through its Open Access Funding Program.
Conflicts of Interest
The authors declare no conflict of interest.
References
- Kamm, B.; Kamm, M. Principles of biorefineries. Appl. Microbiol. Biotechnol. 2004, 64, 137–145. [Google Scholar] [CrossRef] [PubMed]
- Sánchez, Ó.J.; Cardona, C.A. Trends in biotechnological production of fuel ethanol from different feedstocks. Bioresour. Technol. 2008, 99, 5270–5295. [Google Scholar] [CrossRef] [PubMed]
- Tuck, C.O.; Perez, E.; Horvath, I.T.; Sheldon, R.A.; Poliakoff, M. Valorization of Biomass: Deriving More Value from Waste. Science 2012, 337, 695–699. [Google Scholar] [CrossRef] [PubMed]
- FitzPatrick, M.; Champagne, P.; Cunningham, M.F.; Whitney, R.A. A biorefinery processing perspective: Treatment of lignocellulosic materials for the production of value-added products. Bioresour. Technol. 2010, 101, 8915–8922. [Google Scholar] [CrossRef] [PubMed]
- Huijgen, W.J.J.; Smit, A.T.; de Wild, P.J.; den Uil, H. Fractionation of wheat straw by prehydrolysis, organosolv delignification and enzymatic hydrolysis for production of sugars and lignin. Bioresour. Technol. 2012, 114, 389–398. [Google Scholar] [CrossRef] [PubMed]
- Calvo-Flores, F.G.; Dobado, J.A. Lignin as Renewable Raw Material. ChemSusChem 2010, 3, 1227–1235. [Google Scholar] [CrossRef] [PubMed]
- Hames, B.R.; Thomas, S.R.; Sluiter, A.D.; Roth, C.J.; Templeton, D.W. Rapid biomass analysis. Appl. Biochem. Biotechnol. 2003, 105, 5–16. [Google Scholar] [CrossRef]
- Sluiter, A.; Hames, B.; Ruiz, R.O.; Scarlata, C.; Sluiter, J.; Templeton, D. Determination of Structural Carbohydrates and Lignin in Biomass; Denver: Golden, CO, USA, 2008. [Google Scholar]
- Palmqvist, E.; Grage, H.; Meinander, N.Q.; Hahn-Hägerdal, B. Main and interaction effects of acetic acid, furfural, andp-hydroxybenzoic acid on growth and ethanol productivity of yeasts. Biotechnol. Bioeng. 1999, 63, 46–55. [Google Scholar] [CrossRef] [Green Version]
- Boyer, L.J.; Vega, J.L.; Klasson, K.T.; Clausen, E.C.; Gaddy, J.L. The effects of furfural on ethanol production by saccharomyces cereyisiae in batch culture. Biomass Bioenergy 1992, 3, 41–48. [Google Scholar] [CrossRef]
- Rasmussen, H.; Sørensen, H.R.; Meyer, A.S. Formation of degradation compounds from lignocellulosic biomass in the biorefinery: Sugar reaction mechanisms. Carbohydr. Res. 2014, 385, 45–57. [Google Scholar] [CrossRef] [PubMed]
- Sluiter, A.; Hames, B.; Ruiz, R.; Scarlata, C. Determination of Sugars, Byproducts, and Degradation Products in Liquid Fraction Process Samples; Denver: Golden, CO, USA, 2008. [Google Scholar]
- Lee, R.A.; Bédard, C.; Berberi, V.; Beauchet, R.; Lavoie, J.M. UV-Vis as quantification tool for solubilized lignin following a single-shot steam process. Bioresour. Technol. 2013, 144, 658–663. [Google Scholar] [CrossRef] [PubMed]
- Dence, C.W. The Determination of Lignin. In Springer Series in Wood Science; Springer: Heidelberg/Berlin, Germany, 1992; pp. 33–61. ISBN 978-3-642-07768-5. [Google Scholar]
- Varmuza, K.; Filzmoser, P. Introduction to Multivariate Statistical Analysis in Chemometrics; CRC Press: Boca Raton, FL, USA, 2009; ISBN 978-1420059472. [Google Scholar]
- Filzmoser, P.; Liebmann, B.; Varmuza, K. Repeated double cross validation. J. Chemom. 2009, 23, 160–171. [Google Scholar] [CrossRef]
- R Development Core Team R. A Language and Environment for Statistical Computing; R Development Core Team, Foundation for Statistical Computing: Vienna, Austria, 2018; Available online: www.r-project.org.
- Filzmoser, P.; Varmuza, K. “R” Package “chemometrics”. Available online: https://CRAN.R-project.org/package=chemometrics (accessed on 15 March 2017).
- Stevens, A.; Ramirez-Lopez, L. “R” Package ‘Prospectr’. Available online: https://CRAN.R-project.org/package=prospectr (accessed on 3 April 2018).
- Mevik, B.-H.; Wehrens, R.; Liland, K.H. “R” Package “pls”. Available online: https://CRAN.R-project.org/package=pls (accessed on 23 April 2017).
- Martinez, A.; Rodriguez, M.E.; York, S.W.; Preston, J.F.; Ingram, L.O. Use of UV absorbance to monitor furans in dilute acid hydrolysates of biomass. Biotechnol. Prog. 2000, 16, 637–641. [Google Scholar] [CrossRef] [PubMed]
- Liebmann, B.; Friedl, A.; Varmuza, K. Applicability of near-infrared spectroscopy for process monitoring in bioethanol production. Biochem. Eng. J. 2010, 52, 187–193. [Google Scholar] [CrossRef]
- Hatfield, R.; Fukushima, R.S. Can lignin be accurately measured? Crop Sci. 2005, 45, 832–839. [Google Scholar] [CrossRef]
- Hastie, T.; Tibshirani, R.; Friedman, J. The Elements of Statistical Learning. In Springer Series in Statistics; Springer: New York, NY, USA, 2009; Volume 99, ISBN 978-0-387-84857-0. [Google Scholar]
Figure 1.
Details of the five data blocks used for the multivariate calibration.

Figure 2.
UV-Vis spectra of the pure components measured in 60 wt % aqueous ethanol. Spectra of lignin, HMF, and furfural were measured at concentrations of 10 mg/L and acetic acid at 1 g/L.
Figure 2.
UV-Vis spectra of the pure components measured in 60 wt % aqueous ethanol. Spectra of lignin, HMF, and furfural were measured at concentrations of 10 mg/L and acetic acid at 1 g/L.

Figure 3.
Box plots of SEPs obtained by rdCV (50 repetitions) for the raw data and the first and second derivative for all components using data block 3 and 4.
Figure 3.
Box plots of SEPs obtained by rdCV (50 repetitions) for the raw data and the first and second derivative for all components using data block 3 and 4.

Figure 4.
Average SEP values derived by rdCV divided by the standard deviation of the concentrations used in the calibration sets from raw data.
Figure 4.
Average SEP values derived by rdCV divided by the standard deviation of the concentrations used in the calibration sets from raw data.
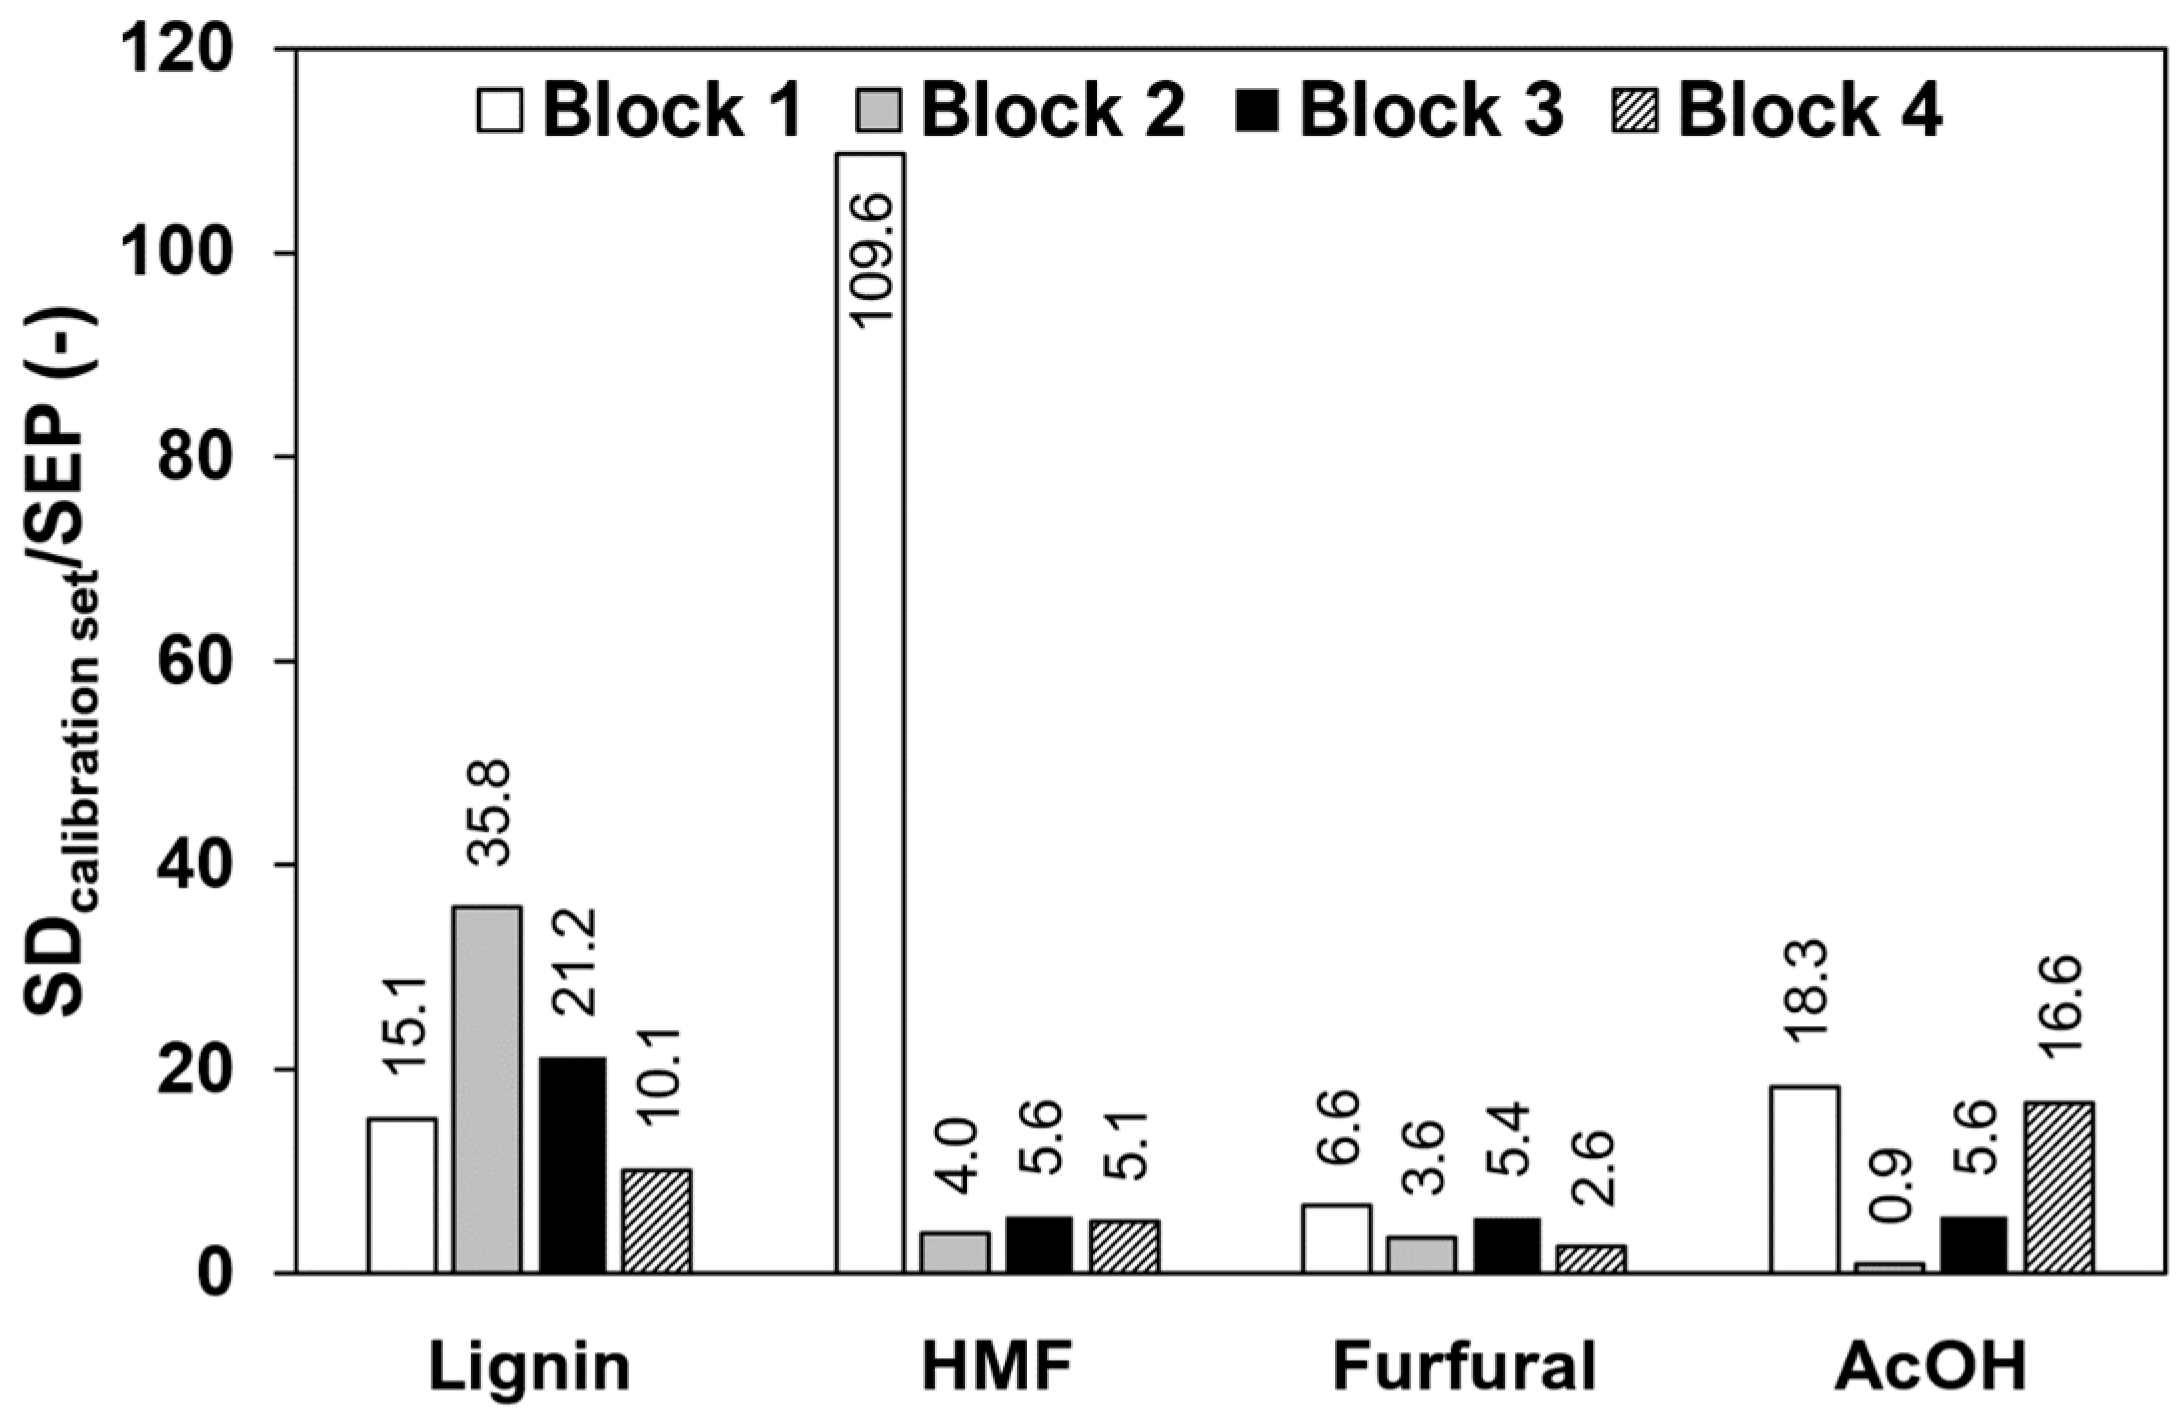
Figure 5.
Reference vs. predicted concentrations of HMF in (a) block 1, (b) block 2, and (c) block 3 obtained by rdCV. In gray are the results from the 50 repetitions in rdCV (very close together and therefore mostly hidden), and in black are the means of 50 predictions.
Figure 5.
Reference vs. predicted concentrations of HMF in (a) block 1, (b) block 2, and (c) block 3 obtained by rdCV. In gray are the results from the 50 repetitions in rdCV (very close together and therefore mostly hidden), and in black are the means of 50 predictions.

Figure 6.
Reference concentration vs. predicted concentrations of (a) lignin, (b) HMF, (c) furfural, and (d) acetic acid in Block 4 obtained by rdCV, using raw data. In gray are the results from the 50 repetitions in rdCV (very close together and therefore mostly hidden), and in black are the means of 50 predictions.

Figure 7.
Predicted vs. reference values of lignin PLS calibration models from raw data of (a) block 1, (b) block 2, and (c) block (3) applied to data block 4. The regression line is in a blue color, and the 45° line is shown in black.
Figure 7.
Predicted vs. reference values of lignin PLS calibration models from raw data of (a) block 1, (b) block 2, and (c) block (3) applied to data block 4. The regression line is in a blue color, and the 45° line is shown in black.

Figure 8.
Average concentrations and spans of the components lignin, acetic acid, HMF, and furfural in the undiluted organosolv extracts at different pretreatment temperatures.
Figure 8.
Average concentrations and spans of the components lignin, acetic acid, HMF, and furfural in the undiluted organosolv extracts at different pretreatment temperatures.
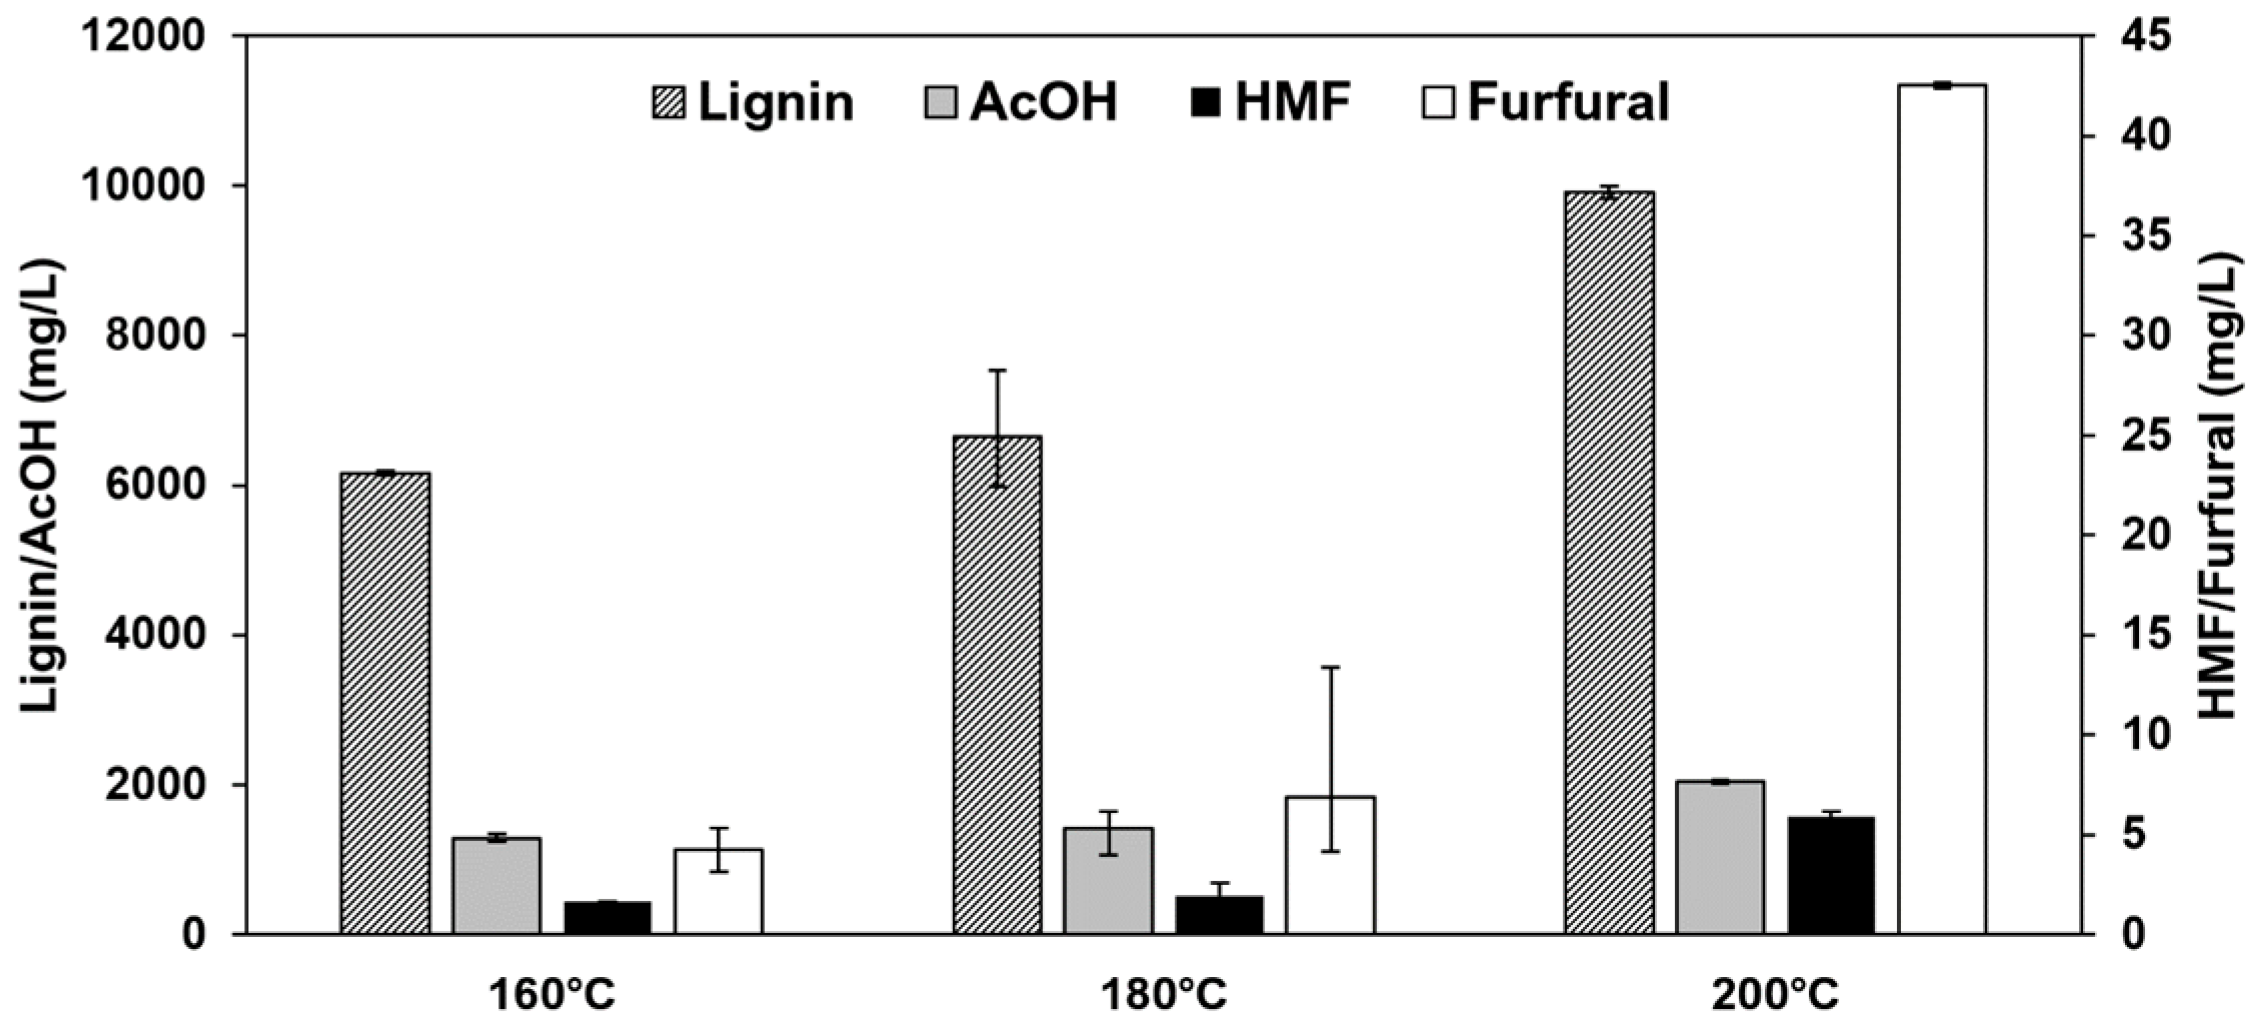
Figure 9.
Application of the calibration model of data block 4 to data block 5 for (a) lignin, (b) HMF, (c) furfural, and (d) acetic acid. The pretreatment temperatures are given. SEPs and bias values are given as combined values for 160 °C and 200 °C and individually for each temperature. The regression line is in a blue color, and the 45° line is shown in black.

Figure 10.
Lignin SEP vs. number of calibration samples of (a) repeated calibration with randomly chosen calibration samples of block 3 applied to block 4 and (b) rdCV applied to block 4 with repeated variation and reduction of the training set samples.
Figure 10.
Lignin SEP vs. number of calibration samples of (a) repeated calibration with randomly chosen calibration samples of block 3 applied to block 4 and (b) rdCV applied to block 4 with repeated variation and reduction of the training set samples.


Table 1.
Standard error of calibration of data blocks 1 to 4.
| Block No. | Component | Standard Deviation Calibration Set | Raw Data | 1st Derivative | 2nd Derivative | Δ284/320 nm |
|---|---|---|---|---|---|---|
| 1 | Lignin | 9.35 | 0.62 ± 0.075 | 0.56 ± 0.14 | 1.7 ± 0.30 | na 1 |
| HMF | 2.85 | 0.026 ± 0.0056 | 0.020 ± 0.0043 | 0.53 ± 0.43 | na 1 | |
| Furfural | 2.96 | 0.45 ± 0.36 | 0.46 ± 0.37 | 0.69 ± 0.54 | na 1 | |
| AcOH | 308 | 17 ± 7.0 | 43 ± 28 | 201 ± 51 | na 1 | |
| 2 | Lignin | 8.28 | 0.23 ± 0.018 | 0.26 ± 0.017 | 0.62 ± 0.075 | 6.5 ± 0.30 |
| HMF | 0.290 | 0.073 ± 0.0041 | 0.076 ± 0.0066 | 0.21 ± 0.030 | 0.30 ± 0.022 | |
| Furfural | 0.290 | 0.081 ± 0.0083 | 0.085 ± 0.0085 | 0.24 ± 0.033 | 0.31 ± 0.032 | |
| AcOH | 5.84 | 6.5 ± 0.38 | 6.6 ± 0.40 | 7.0 ± 0.36 | 6.5 ± 0.39 | |
| 3 | Lignin | 8.85 | 0.42 ± 0.041 | 0.57 ± 0.091 | 2.40 ± 0.81 | 5.2 ± 0.31 |
| HMF | 0.00291 | 0.00052 ± 0.00011 | 0.0025 ± 0.000090 | 0.0028 ± 0.00014 | 0.0026 ± 0.00015 | |
| Furfural | 0.00316 | 0.00058 ± 0.00014 | 0.0027 ± 0.00014 | 0.0033 ± 0.00052 | 0.0034 ± 0.00023 | |
| AcOH | 0.591 | 0.11 ± 0.022 | 0.50 ± 0.018 | 0.58 ± 0.028 | 0.53 ± 0.031 | |
| 4 | Lignin | 8.08 | 0.80 ± 0.048 | 0.85 ± 0.056 | 1.6 ± 0.32 | 7.3 ± 0.27 |
| HMF | 0.00223 | 0.00044 ± 0.000016 | 0.00045 ± 0.000015 | 0.00088 ± 0.00016 | 0.0021 ± 0.000073 | |
| Furfural | 0.00750 | 0.0028 ± 0.00011 | 0.0029 ± 0.00011 | 0.0035 ± 0.00031 | 0.0073 ± 0.00030 | |
| AcOH | 1.75 | 0.11 ± 0.0049 | 0.12 ± 0.0061 | 0.27 ± 0.045 | 1.6 ± 0.060 |
1 not applicable due to absorbance values of zero at 320 nm.
Table 2.
Optimal number of PLS components in block 1 to 4 for the components lignin, acetic acid, HMF, and furfural of the raw data derived by rdCV.
Table 2.
Optimal number of PLS components in block 1 to 4 for the components lignin, acetic acid, HMF, and furfural of the raw data derived by rdCV.
| Block No. | Lignin | AcOH | HMF | Furfural |
|---|---|---|---|---|
| 1 | 2 | 1 | 3 | 1 |
| 2 | 2 | 1 | 3 | 3 |
| 3 | 2 | 4 | 4 | 4 |
| 4 | 1 | 1 | 1 | 1 |
Table 3.
SEP and bias values of the application of calibrations from data blocks 1 to 4 to data block 4.
Table 3.
SEP and bias values of the application of calibrations from data blocks 1 to 4 to data block 4.
| Lignin | HMF | Furfural | AcOH | |||||
|---|---|---|---|---|---|---|---|---|
| Calibration Block | SEP (mg/L) | Bias (mg/L) | SEP (mg/L) | Bias (mg/L) | SEP (mg/L) | Bias (mg/L) | SEP (mg/L) | Bias (mg/L) |
| 1 | 0.779 | 0.467 | 0.767 | 1.35 | 0.134 | −0.197 | 1108 | 1954 |
| 2 | 0.874 | 0.603 | 0.0942 | −0.0378 | 0.305 | 0.628 | 1.81 | 4.89 |
| 3 | 1.16 | −1.80 | 0.00690 | 0.0128 | 0.00386 | 0.00420 | 0.160 | 0.336 |
© 2018 by the authors. Licensee MDPI, Basel, Switzerland. This article is an open access article distributed under the terms and conditions of the Creative Commons Attribution (CC BY) license (http://creativecommons.org/licenses/by/4.0/).
Share and Cite
MDPI and ACS Style
Beisl, S.; Binder, M.; Varmuza, K.; Miltner, A.; Friedl, A. UV-Vis Spectroscopy and Chemometrics for the Monitoring of Organosolv Pretreatments. ChemEngineering 2018, 2, 45. https://doi.org/10.3390/chemengineering2040045
AMA Style
Beisl S, Binder M, Varmuza K, Miltner A, Friedl A. UV-Vis Spectroscopy and Chemometrics for the Monitoring of Organosolv Pretreatments. ChemEngineering. 2018; 2(4):45. https://doi.org/10.3390/chemengineering2040045
Chicago/Turabian StyleBeisl, Stefan, Mathias Binder, Kurt Varmuza, Angela Miltner, and Anton Friedl. 2018. "UV-Vis Spectroscopy and Chemometrics for the Monitoring of Organosolv Pretreatments" ChemEngineering 2, no. 4: 45. https://doi.org/10.3390/chemengineering2040045