Article

A Multivariate Statistical Analyses of Membrane Performance in the Clarification of Citrus Press Liquor

1
Programa Institucional de Fomento a la Investigación, Desarrollo e Innovación, Universidad Tecnológica Metropolitana, Ignacio Valdivieso 2409 P.O. Box 8940577 San Joaquín, Santiago, Chile
2
Department of Chemistry, University of Calabria, via P. Bucci, 12/C, I-87030 Rende (CS), Italy
3
Institute on Membrane Technology, ITM-CNR, c/o University of Calabria, via P. Bucci, 17/C, I-87030 Rende (CS), Italy
*
Author to whom correspondence should be addressed.
ChemEngineering 2019, 3(1), 10; https://doi.org/10.3390/chemengineering3010010
Submission received: 19 October 2018 / Revised: 6 December 2018 / Accepted: 10 January 2019 / Published: 17 January 2019
(This article belongs to the Special Issue Membrane and Membrane Reactors Operations in Chemical Engineering)

Abstract

:
The orange press liquor is a by-product of the orange juice production containing bioactive compounds recognized for their beneficial implications in human health. The recovery of these compounds offers new opportunities for the formulation of products of interest in food, pharmaceutical and cosmetic industry. The clarification of orange press liquor by microfiltration (MF) and/or ultrafiltration (UF) processes is a valid approach to remove macromolecules, colloidal particles, and suspended solids from sugars and bioactive compounds. In this work the clarification of orange press liquor was studied by using three flat-sheet polymeric membranes: a MF membrane with a pore size of 0.2 μm and two UF membranes with nominal molecular weight cut-off (MWCO) of 150 and 200 kDa, respectively. The membrane performance, in terms of permeate flux and membrane rejection towards hesperidin and sugars, was studied according to a multivariate analyses approach. In particular, characteristics influencing the performance of the investigated membranes, such as molecular weight cut-off (MWCO), contact angle, membrane thickness, pore size distribution, as well as operating conditions, including temperature, and operating time, were analysed through the partial least square regression (PLSR). The multivariate method revealed crucial information on variables which are relevant to maximize the permeate flux and to minimize the rejection of hesperidin and sugars in the clarification of orange press liquor.

1. Introduction

Oranges contribute significantly to the bulk of world’s citrus fruit production accounting for more than 50% of the global citrus production. During the marketing year 2015/2016, the global orange production amounted to about 47.06 million metric tons, with Brazil producing 24% of the world total followed by China and India [1].
Although the juice is the main product derived from orange, various by-products are produced during the manufacturing process. The produced wastes consist mainly in wet peels and whole rejected fruits containing 82% of water [2].
Most of the waste residue from commercial juice extractors is shredded, limed, cured, and pressed into press liquors and press cakes which are then processed independently. Press liquors are semisolid wastes containing soluble sugars (sucrose, glucose, and fructose), insoluble carbohydrates, fiber, organic acids, essential oils, flavonoids, and carotenoids [3]. These residues have a considerable amount of organic matter leading to environmental and health problems due to water runoff and uncontrolled fermentation. At the same time, orange peels and pulp contain several bioactive compounds, such as flavonoids and phenolic acids, recognized for their beneficial implications in human health due to their antioxidant activity and free radical scavenging ability [4].
Recent research and development efforts have aimed at converting the potential of wastes into profitable products creating new segments of production and offsetting the disposal costs [5]. Indeed, polyphenolic compounds are used as raw materials in the production of dietary supplements and functional foods, as colouring and flavouring agents in food industries as well as in health and pharmaceutical industries due to their antibacterial, antiviral, anti-inflammatory, antiallergic, and vasodilatory action [6].
Conventional extraction techniques to recover polyphenolic compounds from agro-food waste matrixes usually rely on solid-liquid extraction (SLE) based on the use of volatile organic compounds, such as ethanol, methanol, or acetone solutions as extractants [7]. However, the use of solvents is characterized by serious problems for both consumers and environment due to their toxicity, high volatility, and non-renewable properties.
The growing interest in the biological activity of phenolic compounds has intensified research efforts to develop novel and sustainable procedures for their extraction, separation, and purification in an efficient and environmentally friendly manner without affecting their stability.
Membrane technologies have received great attention in the last years for the recovery of antioxidants from agricultural by-products due to their advantages over conventional methodologies which include mild operating conditions, low energy requirement, no additives, separation efficiency, and easy scale-up [8]. In particular, microfiltration (MF), ultrafiltration (UF), nanofiltration (NF), and reverse osmosis (RO) have been largely investigated, also in sequential design, for the recovery of phenolic compounds from a wide variety of agricultural products and by-products including olive mill wastewaters [9], artichoke wastewaters [10], wine by-products [11], and citrus by-products [12].
An interesting approach to recover and concentrate valuable compounds from orange press liquor is based on the sequential use of membrane operations including ultrafiltration (UF), nanofiltration (NF), and osmotic distillation (OD) [13]. As in the clarification of fruit juices, MF and UF processes allow to remove high molecular weight compounds like cellulose, hemicellulose, cell debris, pectins, and microorganisms from the raw press liquor overcoming typical drawbacks of conventional methods of clarification which include enzymatic treatment (depectinization), cooling, flocculation (gelatin, silica sol, bentonite and diatomaceous earth), decantation, centrifugation, and filtration [14].
These processes separate the flow from the press liquor into a permeate having a total soluble solids content and an acidity level similar to that of the press liquor and a retentate containing suspended solids such as proteins and fibers and high molecular weight carbohydrates, such as cloud pectins.
It is generally recognized that the performance of MF and UF membranes in term of productivity and selectivity is affected by different factors such as membrane characteristics (e.g., pore size, pore size distribution, and contact angle) [15], as well as by operating and fluid-dynamic conditions, including transmembrane pressure, temperature, and feed flowrate [16].
These parameters have to be carefully selected and optimized in order to control concentration polarization and membrane fouling phenomena due to the accumulation of rejected solutes on the membrane surface or within membrane pores.
Generally, the analysis of membrane performance is carried out by using the “one-factor-at-a-time” approach in which each parameter is studied independently of each other. However, it is crucial to take into account the multivariate nature of membrane processes in which the correlation between the variables is usually non-linear, and several factors affect the filtration phenomena simultaneously. Earlier studies on membrane filtration have shown that the utilization of multivariate analysis extends the information obtained from univariate analysis [17].
In previous studies, the response surface methodology (RSM) approach has been employed to investigate the interaction of different operating conditions, such as transmembrane pressure (TMP), temperature and feed flowrate on permeate flux [18] and the recovery of antioxidant compounds [19] in the clarification of orange press liquor by UF hollow fibre membranes.
Experimental data of permeate flux and fouling index, obtained in optimized operating conditions, resulted in a good agreement with the predicted values of the regression model. The optimized operating conditions to maximize permeate fluxes and the recovery of antioxidant compounds as well as to minimize fouling index were identified.
The present work aimed at investigating the effect of membrane characteristics such as membrane thickness, pore size distribution, contact angle as well as operating conditions, such as temperature and operating time, on the performance of three different flat-sheet MF and UF membranes in terms of permeate flux and rejection of hesperidin and sugars (glucose, fructose, and sucrose) in the treatment of orange press liquor. To accomplish that, the partial least squares regression (PLSR) was used as a multivariate tool, to correlate the membrane characteristics (grouped in an X matrix) with membrane performance (grouped in a Y matrix).

2. Theory

Partial least squares regression (PLSR), in its simplest form, can be defined as a statistical method for relating two data matrix, X and Y, to each other by a linear multivariate model [20,21,22,23]. The PLSR applications have been reported in three principal areas: quantitative structure-activity relationship (QSAR) modeling, multivariate calibration, and process monitoring and optimization [23].
As a historical note, PLSR or just named PLS approach was originated around 1975 by Herman Wold for the modeling of complex data [23]. PLS can be defined as a multivariate linear regression methodology, based on the decomposition of the data into a set of orthogonal components or latent variables (LVs) [23,24,25,26]. It is recognized as a robust method with a robust statistical basis able to analyze data with noisy, collinear, numerous variables and even missing data-points in both the input (X matrix) and output (Y matrix) data sets. An essential aspect of this technique is that the output data structure guides the decomposition of the input data in a way that the respective orthogonal components explain as much as possible of the covariance between the input and output [27].
As mentioned above, PLS links the input and the output matrices with “new” variables that are estimated as a linear combination of the original variables or their rotation. The following equation gives these new variables called X-scores and denoted by ta (a = 1, 2, … A):
t i a = k W k a * X i k ;   ( T   =   XW * )
where W is the weight matrix that relates the X-scores with each variable of X. On the other hand, the input matrix X can be obtained from the linear combination between the X-scores T and the loading P in order to minimize the X-residuals E:
X i k = a t i a p a k + e i k ;   ( X   =   TP   +   E )
Then, the output matrix Y can be obtained by means of the following equation:
Y i m = a c m a t i a + f i m ;   ( Y   =   TC   +   F )
where C is the weight matrix that relates the X-scores with each variable of Y, meanwhile fim represents the deviation between the observed and modeled responses, and comprises the elements of the Y-residuals matrix, F.
Finally, the multivariate regression model can be obtained combining Equations (1) and (3):
Y i m a c m a k w k a * x i k + f i m = k b m k x i k + f i m ;   ( Y   =   XW * C   +   F   =   XB   +   F )
The PLS regression coefficients, bmk (B) can be written as:
b m k = a c m a w k a * ;   ( B   =   W * C )
The line obtained by linear regression of that swarm of data points, in the direction of maximum variance, is the first latent variable or just factor. In other words, it captures the main trend in the data set. Then, another linear regression is performed in the second direction of maximum variance, but keeping in mind that this direction should be orthogonal to the first. This corresponds to the second factor. The remaining factors are obtained accordingly [27].

3. Materials and Methods

3.1. Feed Solution

Citrus press liquor was supplied by Gioia Succhi Srl (Rosarno, Reggio Calabria, Italy). Liquors were left overnight at room temperature to let the majority of the cloud particles settle out. Partially clear liquor was recovered by filtration with a nylon cloth. The physico-chemical characteristics of the resulting liquor are reported in Table 1.

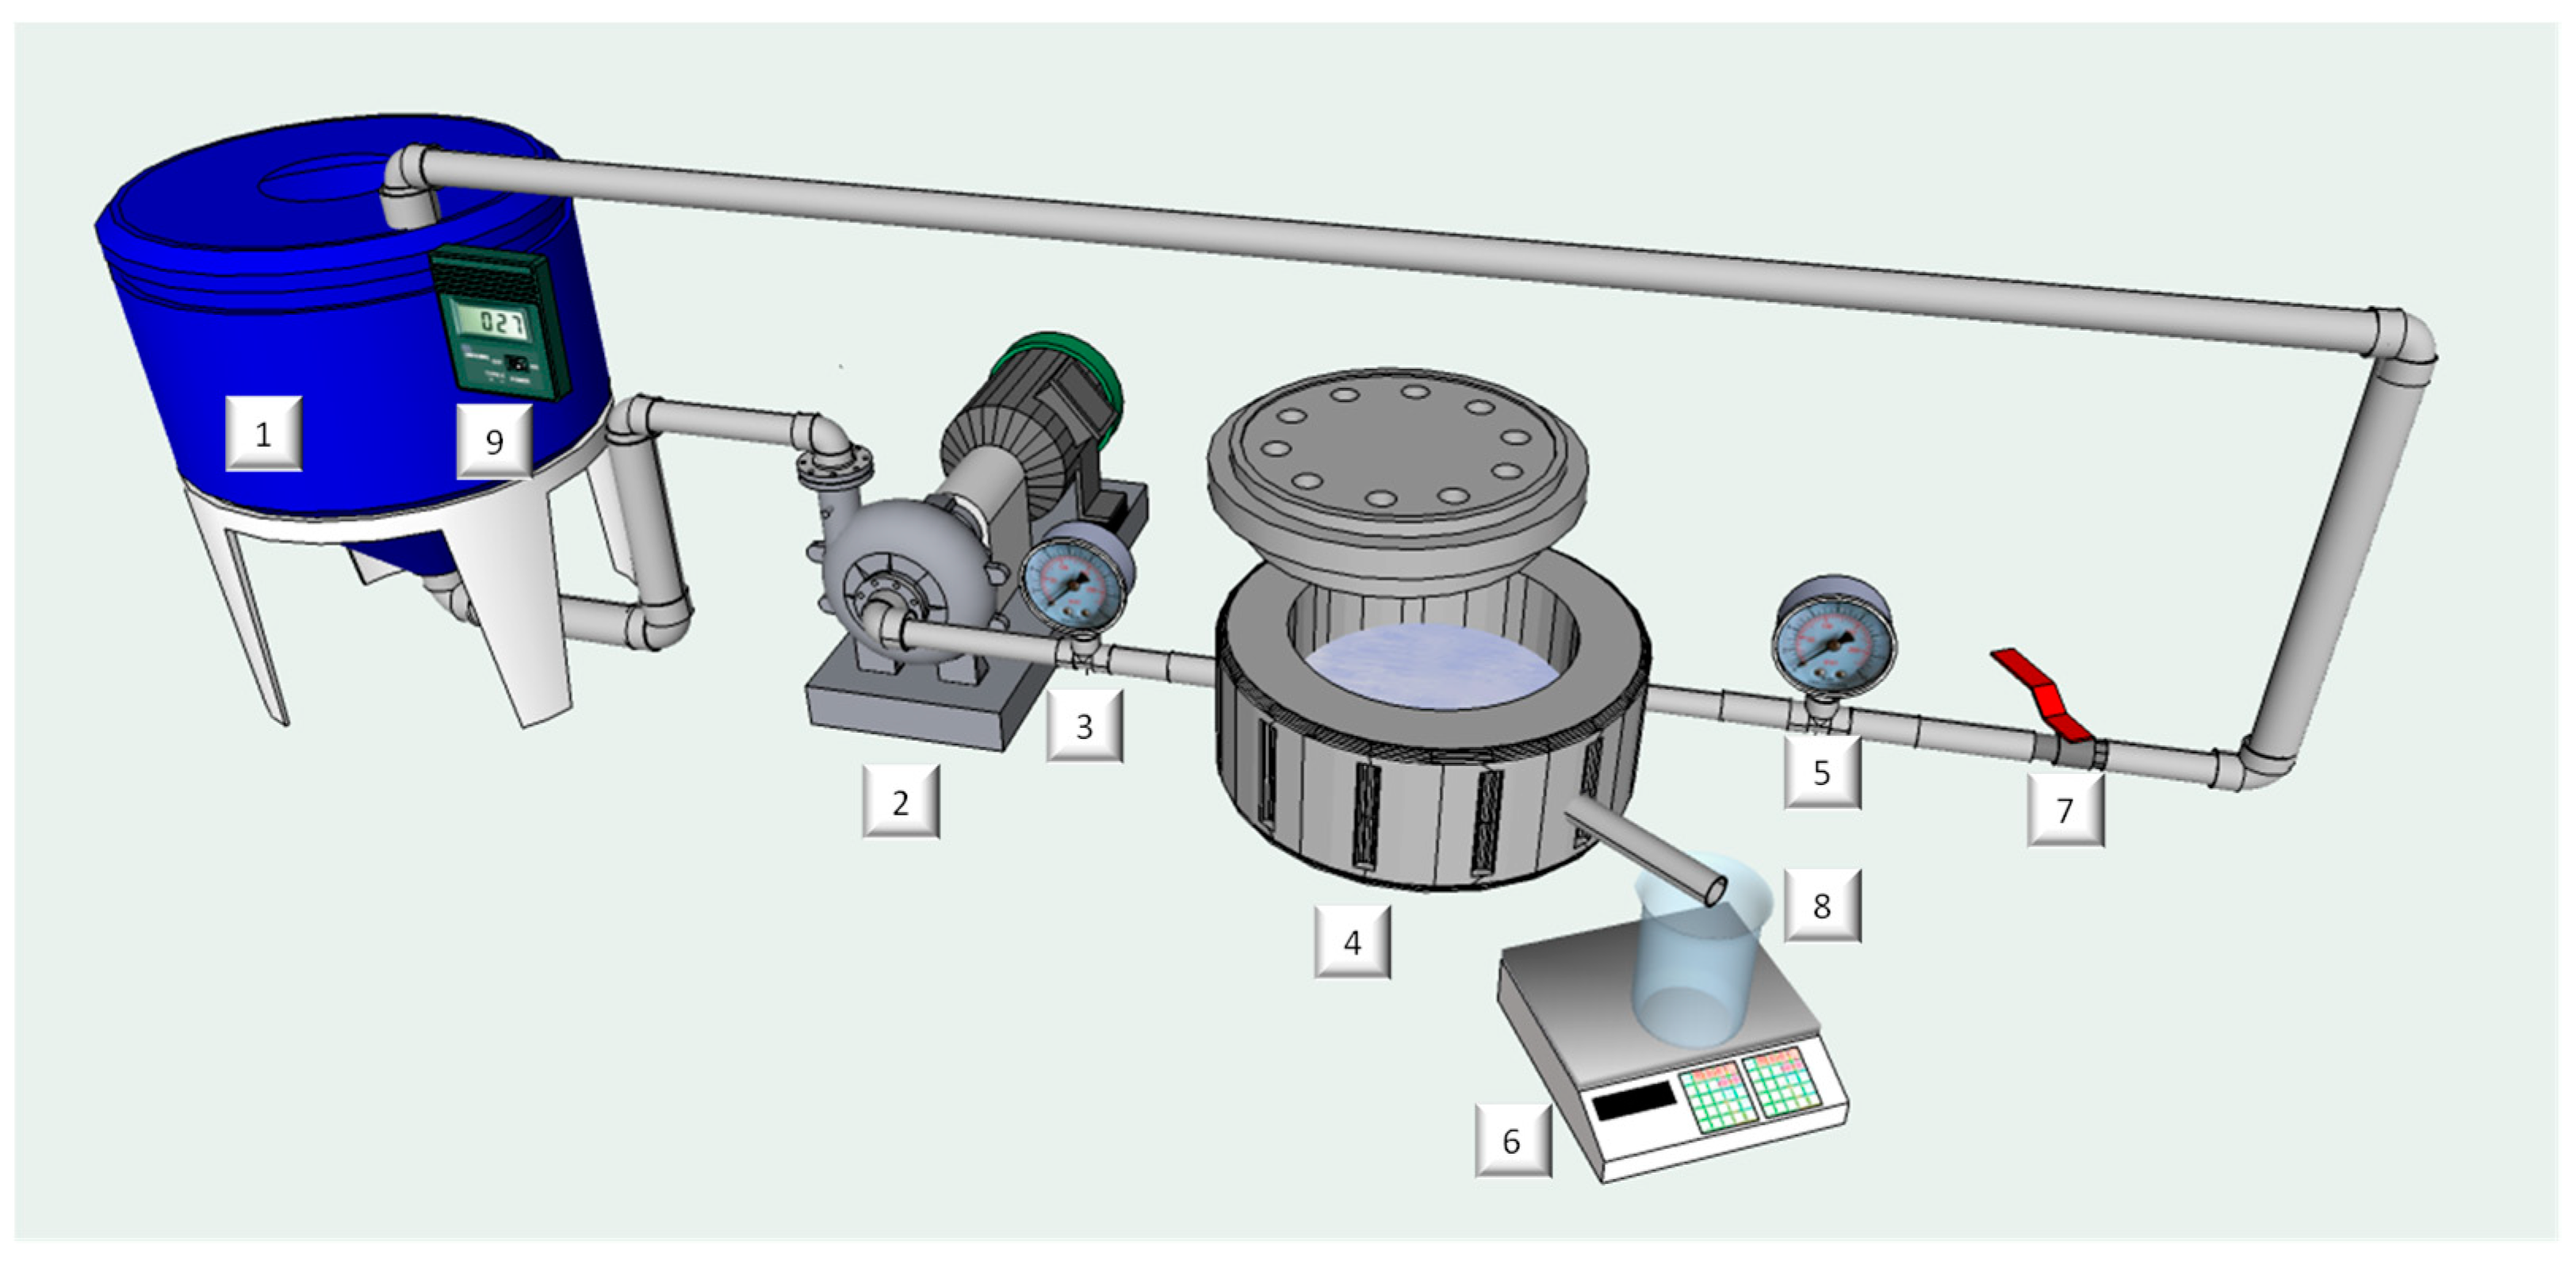
3.2. MF-UF Equipment and Procedures

MF and UF experiments were performed by using a laboratory bench plant (Figure 1) equipped with a stainless steel cell suitable to contain a flat-sheet membrane with a diameter of 47.2 mm. Experimental runs were performed by using three polyvinylidenfluoride (PVDF) flat-sheet membranes supplied by Microdyn-Nadir GmbH (Wiesbaden, Germany). Properties of selected membranes are reported in Table 2. Experimental runs were performed according to the total recycle (TR) configuration in which both permeate and retentate streams were continuously recycled back to the feed tank. This configuration ensured a steady-state in the volume and composition of the feed. In order to evaluate the effect of feed concentration on the membrane performance, experiments were also performed according to the batch concentration (BC) configuration in which the permeate stream was continuously removed. In both configurations operating conditions such as transmembrane pressure (TMP), temperature and feed flowrate were fixed at 1 bar, 26.0 ± 1.0 °C and 185 L/h, respectively. Each run was stopped after 180 min of operation. Experimental runs were performed in triplicate. Permeate flux data were expressed as average value ± SD.
The permeate flux (J) was determined by weighing the amount of permeate with a digital balance and calculated according to the following equation:
J = W p t · A p
where Wp is the permeate weight collected during the time interval t and Ap is the membrane surface area of permeation. The mass of permeate collected was measured with an accuracy of ± 0.1 g every 5 min.

3.3. Determination of Sugars

The quantitative determination of glucose, fructose and sucrose was carried out by an HPLC system (Agilent Technologies, Palo Alto, CA, USA) equipped with a Luna reverse phase C18 column (5 µ, 100 Å, 250 × 4.6 mm i.d. from Phenomenex (Torrance, CA, USA), an isocratic pump (model series 1100) and a refractive index detector (Series 200a).
Isocratic elution was used at a flow rate of 1 mL/min with two solvents: Solvent A, water/acetic acid (0.1% v/v), 80%, and Solvent B, methanol, 20%.
For each reference sugar, a set of calibration standards using stock and working reference standard solutions were prepared. Glucose, fructose, and sucrose were purchased from Sigma-Aldrich (Milan, Italy). Sugar standards were dried at 60 °C in a vacuum oven overnight and dissolved in 50% methanol (injection solvent). The resultant solutions were filtered using a syringe filter and injected into HPLC.
The injection volume was 20 µL. The peak areas in the chromatograms were plotted against calibration curves obtained from standard solutions (external standard method), in a concentration range of 0.5–2 mg/mL for each compound. Results were expressed as mean ± SD of three independent determinations.

3.4. Determination of Hesperidin

The quantitative determination of hesperidin was carried out by an HPLC system (Shimadzu LC-20AB, Kyoto, Japan) equipped with a binary pump, autosampler and a UV/vis detector (SPD-20A), monitored at 284 nm and 360 nm. Samples were centrifuged before injection. The column used was a Discovery C18 (25 cm × 4.6 mm, 5 μm from Supelco, Bellefonte, PA, USA). The mobile phase consisted of two solvents: Solvent A, water/phosphoric acid (0.1% v/v) and Solvent B, acetonitrile. Phenolic compounds were eluted under the following conditions: 1 mL/min flow rate and ambient temperature; gradient conditions from 0% to 5% B in 0.01 min, from 5% to 10% B in 19.9 min, from 10% to 20% B in 20 min, from 20% to 25% B in 20 min, from 25% to 35% B in 20 min, from 35% to 60% B in 15 min, from 60% to 5% B in 3 min, followed by washing and reconditioning of the column. The identification of hesperidin was obtained comparing the retention time by using authentic standard. Hesperidin was from Sigma-Aldrich (Milan, Italy). Results were expressed as mean ± SD of three independent determinations.

3.5. Pore size and Pore Size Distribution Measurement

Membranes pore size and pore size distribution were determined by using a PMI Capillary Flow porometer (Porous Materials Inc., Ithaca, NY, USA) according to the bubble point method [28,29]. A porewick solution (surface tension 16 dynes/cm) was used as a wetting liquid. Fully wetted samples were sealed in the cell and measurements were carried out by the wet up/dry down method using the software Capwin (Porous Materials Inc., USA). Data were processed and exported as an Excel file by the software Caprep (Porous Materials Inc., USA).

3.6. Thickness and Contact Angle Measurement

The thickness of each membrane was determined by a multiple-point measurement, using a digital micrometre Mahr 40E (Mahr GmbH, Esslingen, Germany). Contact angle measurement were carried out by using the sessile drop method with a CAM 200 contact angle meter (KSV instrument LTD, Helsinki, Finland). The droplets were deposited on the membrane surface by using a micro-syringe with automatic dispenser, while the images were captured by a digital camera allowing apparent static contact angles to be measured at different time. An average of 20 readings was obtained for each specimen and the respective mean value was calculated.

3.7. Data Analysis

3.7.1. Pre-Processing

Data were initially organized into dataset X-matrix (n × k) which is composed of 114 observations and five factors or predictors such as membrane thickness, diameter at maximum pore size distribution, contact angle, operating time, and temperature. On the other hand, Y-matrix (n × m), also called response, was composed of 114 observations and five responses: permeate flux and rejection towards hesperidin, glucose, fructose, and sucrose.
In any analytical application, data are usually processed before using PLSR. In this work, in which factors and responses are discrete variables, data were pre-processed in order to obtain the maximum information from the dataset. In general, pre-processing is but a minor modification of the dataset, with the aim of minimizing the impact from extraneous noise and also putting each variable both on an equal level with an equal scaling allowing to participate equally in the data modeling process [30]. Results of projection methods, such as PLSR, depend on the scaling of the data. With an appropriate scaling, one can focus the model on more important Y-variables, and use the experience to increase the weights of more informative X-variables [23,31]. In our case, the absence of knowledge about the relative importance of the variables and the fact that the factors and responses are in different units have forced to probe different techniques such as normalize and moving average.

3.7.2. Number PLSR Components or Factors and Model Validation

In any empirical modeling, it is essential to determine the real complexity of the model. Considering numerous and correlated X-variables, a substantial risk exists for “over-fitting” that means a well-fitting model with little predictive power [23]. Cross-validation (CV) is a practical and reliable way to test the predictive significance [20,32,33,34]. Basically, in CV the data are divided into groups followed by the development of parallel models that are evaluated with the differences between observed and predicted Y-values. In the evaluation, the observations are kept out of the developed model while the response values (Y) are predicted and compared with the observed values. The procedure is repeated several times until every observation has been kept out. The sum of squares of these differences is computed and collected from all the parallel models to form the predictive residual sum of squares (PRESS), which estimates the predictive ability of the model [23]. The ability of the model can be summarized using the R2 of the calibration and validation set, the root mean square error of calibration and validation (RMSE), the standard error of calibration and validation (SE is similar to RMSE except it is corrected for the bias) and the bias which is the mean value over all points that either lie systematically above (or below) the regression line (a value close to zero indicate a random distribution of point about the regression line).
All the statistical computations were performed using Unscrambler 10.4.1 software (CAMO AS, Oslo, Norway).

4. Results and Discussion

4.1. Membrane Characteristics

Measurements performed to characterize the selected membranes are shown in Table 2. The membranes used in this study, made of PVDF, are basically hydrophilic membranes with contact angle values lower than 90°. The FMU6R2 membrane showed the most hydrophilic surface, followed by UV150T and MV020T membranes. Thickness measurements showed no significant differences between the membranes studied. The main differences between the selected membranes are related with the pore size. The measurements carried out to evaluate the maximum pore size for each membrane showed differences with the data reported by the manufactures. In addition, significant differences related to the maximum pore size distribution were found. In particular, the FMU6R2 membrane showed the minimum frequency (40%); this means that only 40% of the membrane surface has a pore size of 0.2 µm, and the rest of surface could present higher or lower values. On the other hand, MV020T and UV150T membranes showed higher frequency of distribution: therefore, these membranes are more homogeneous in their pore size distributions. These factors will be strongly related with the type of fouling produced and, therefore, with the membrane performance in terms of permeate flux and rejection towards hesperidin and sugars.

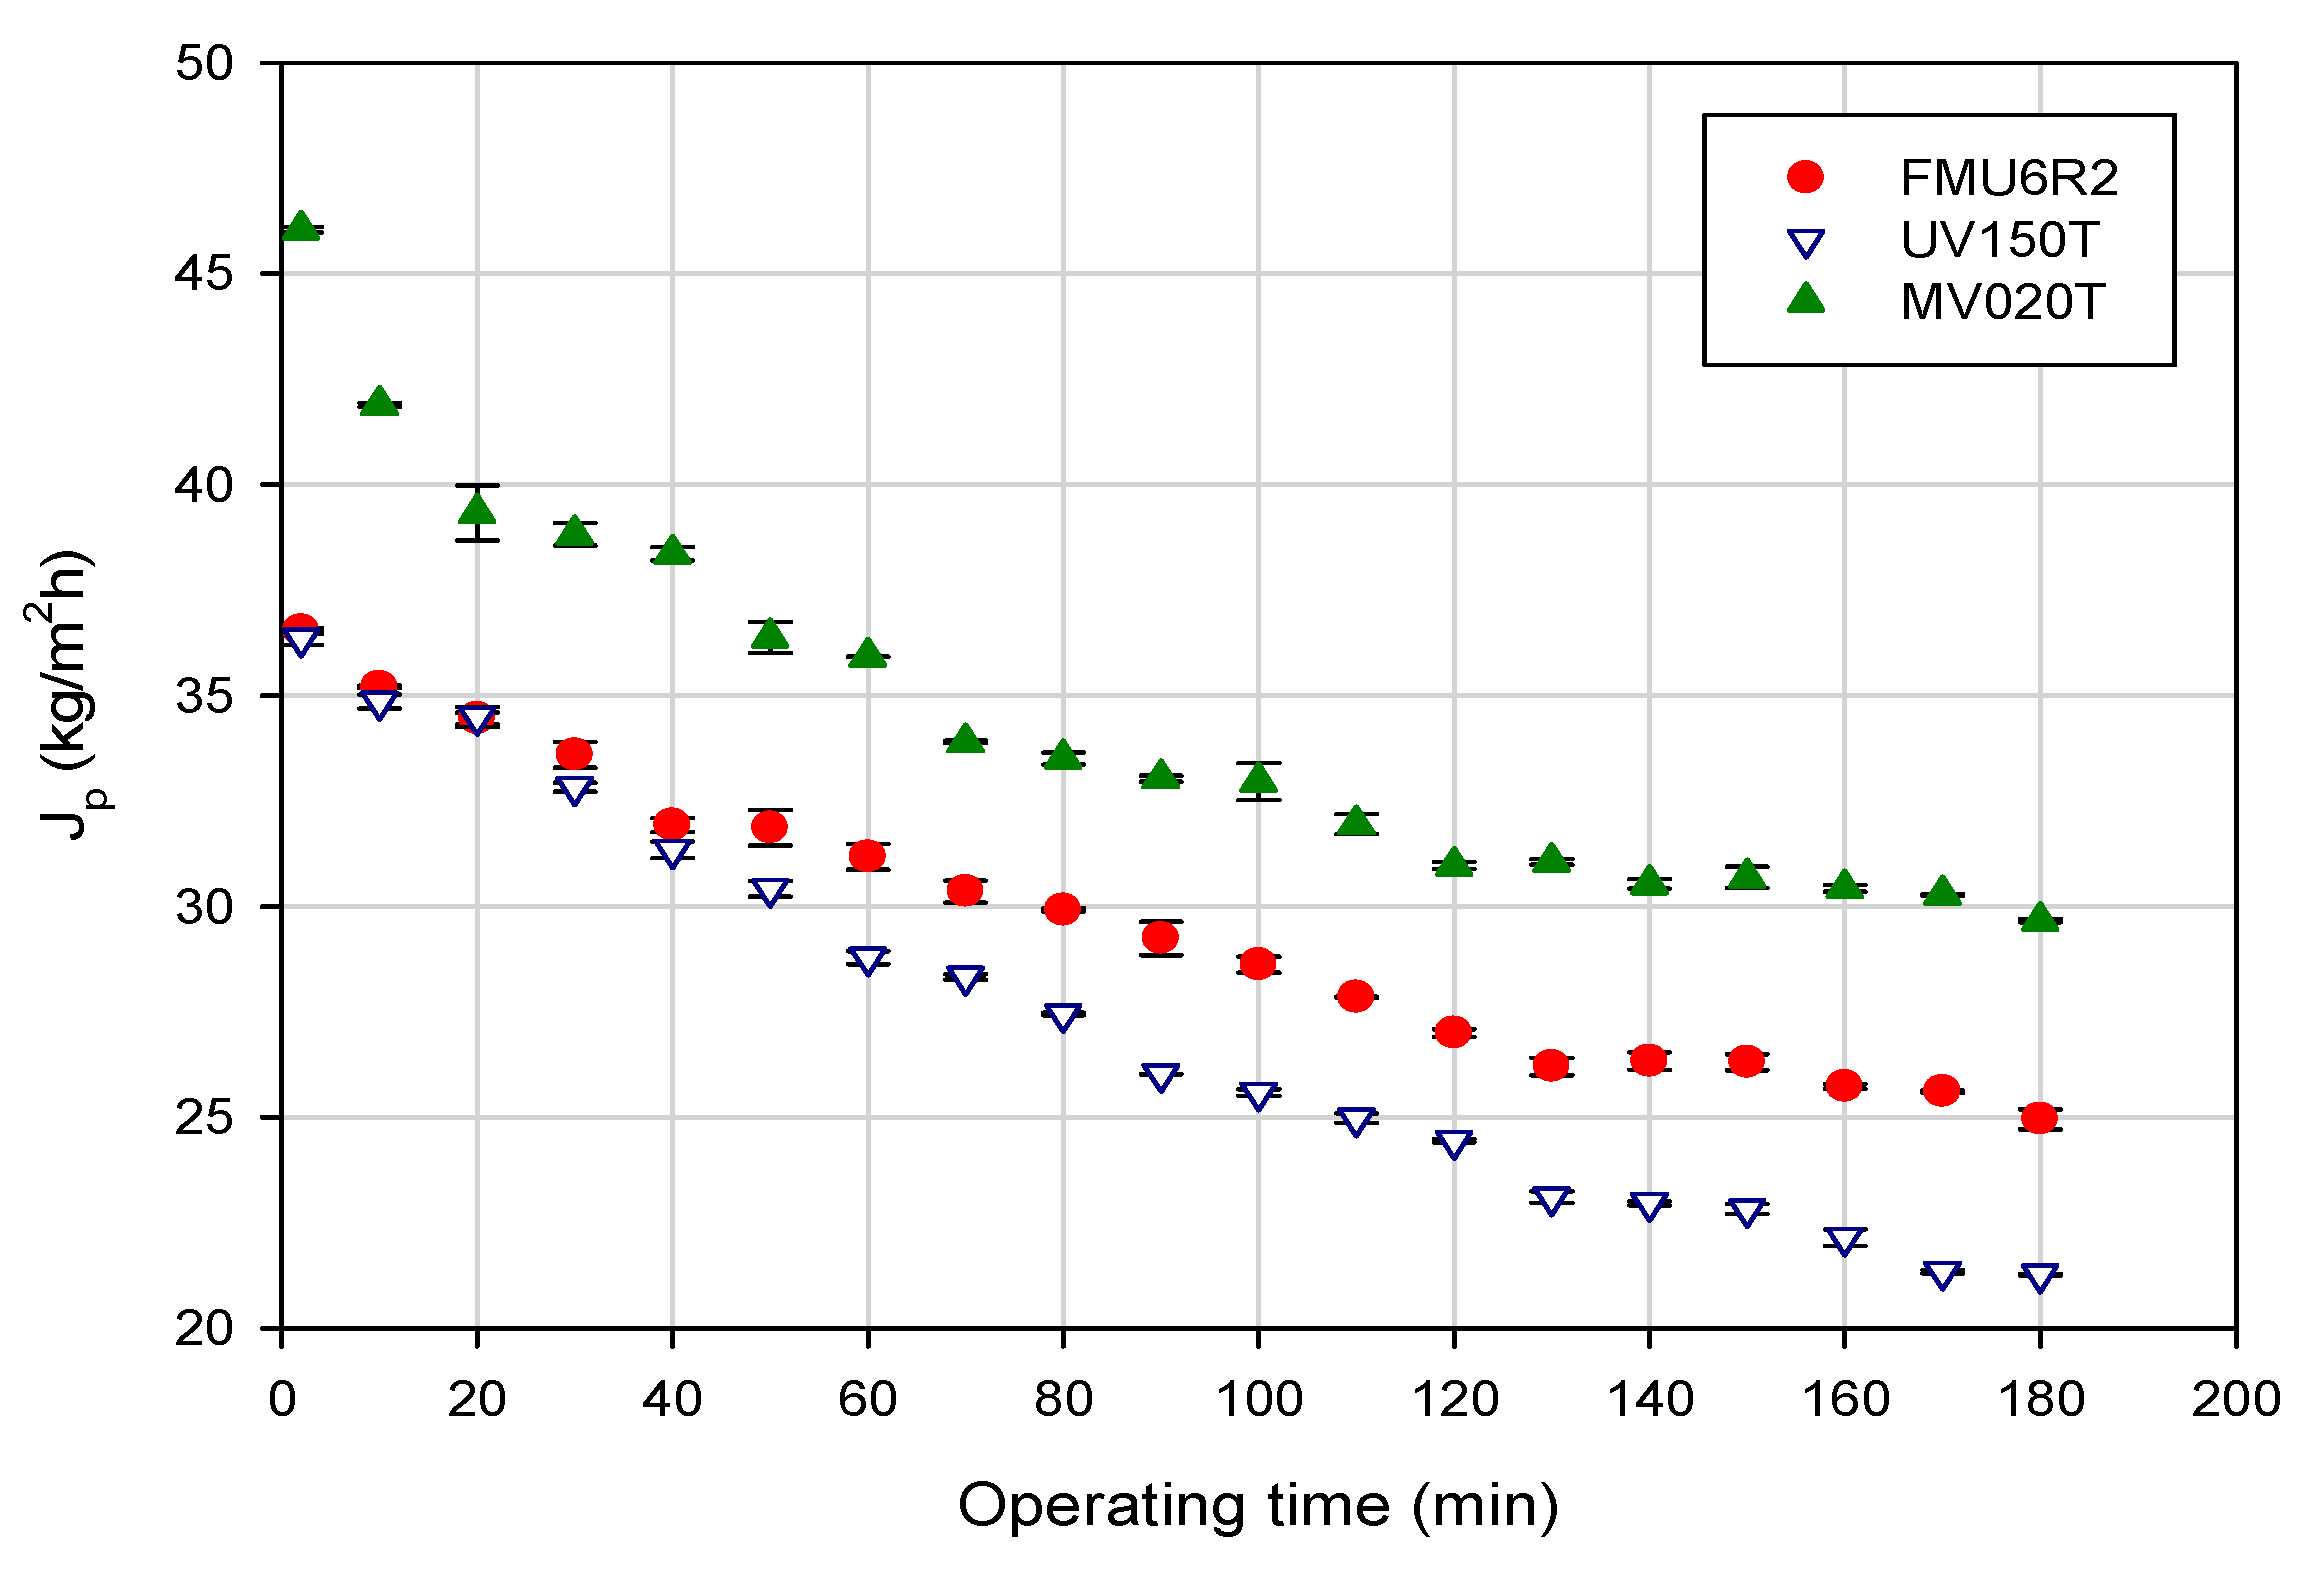
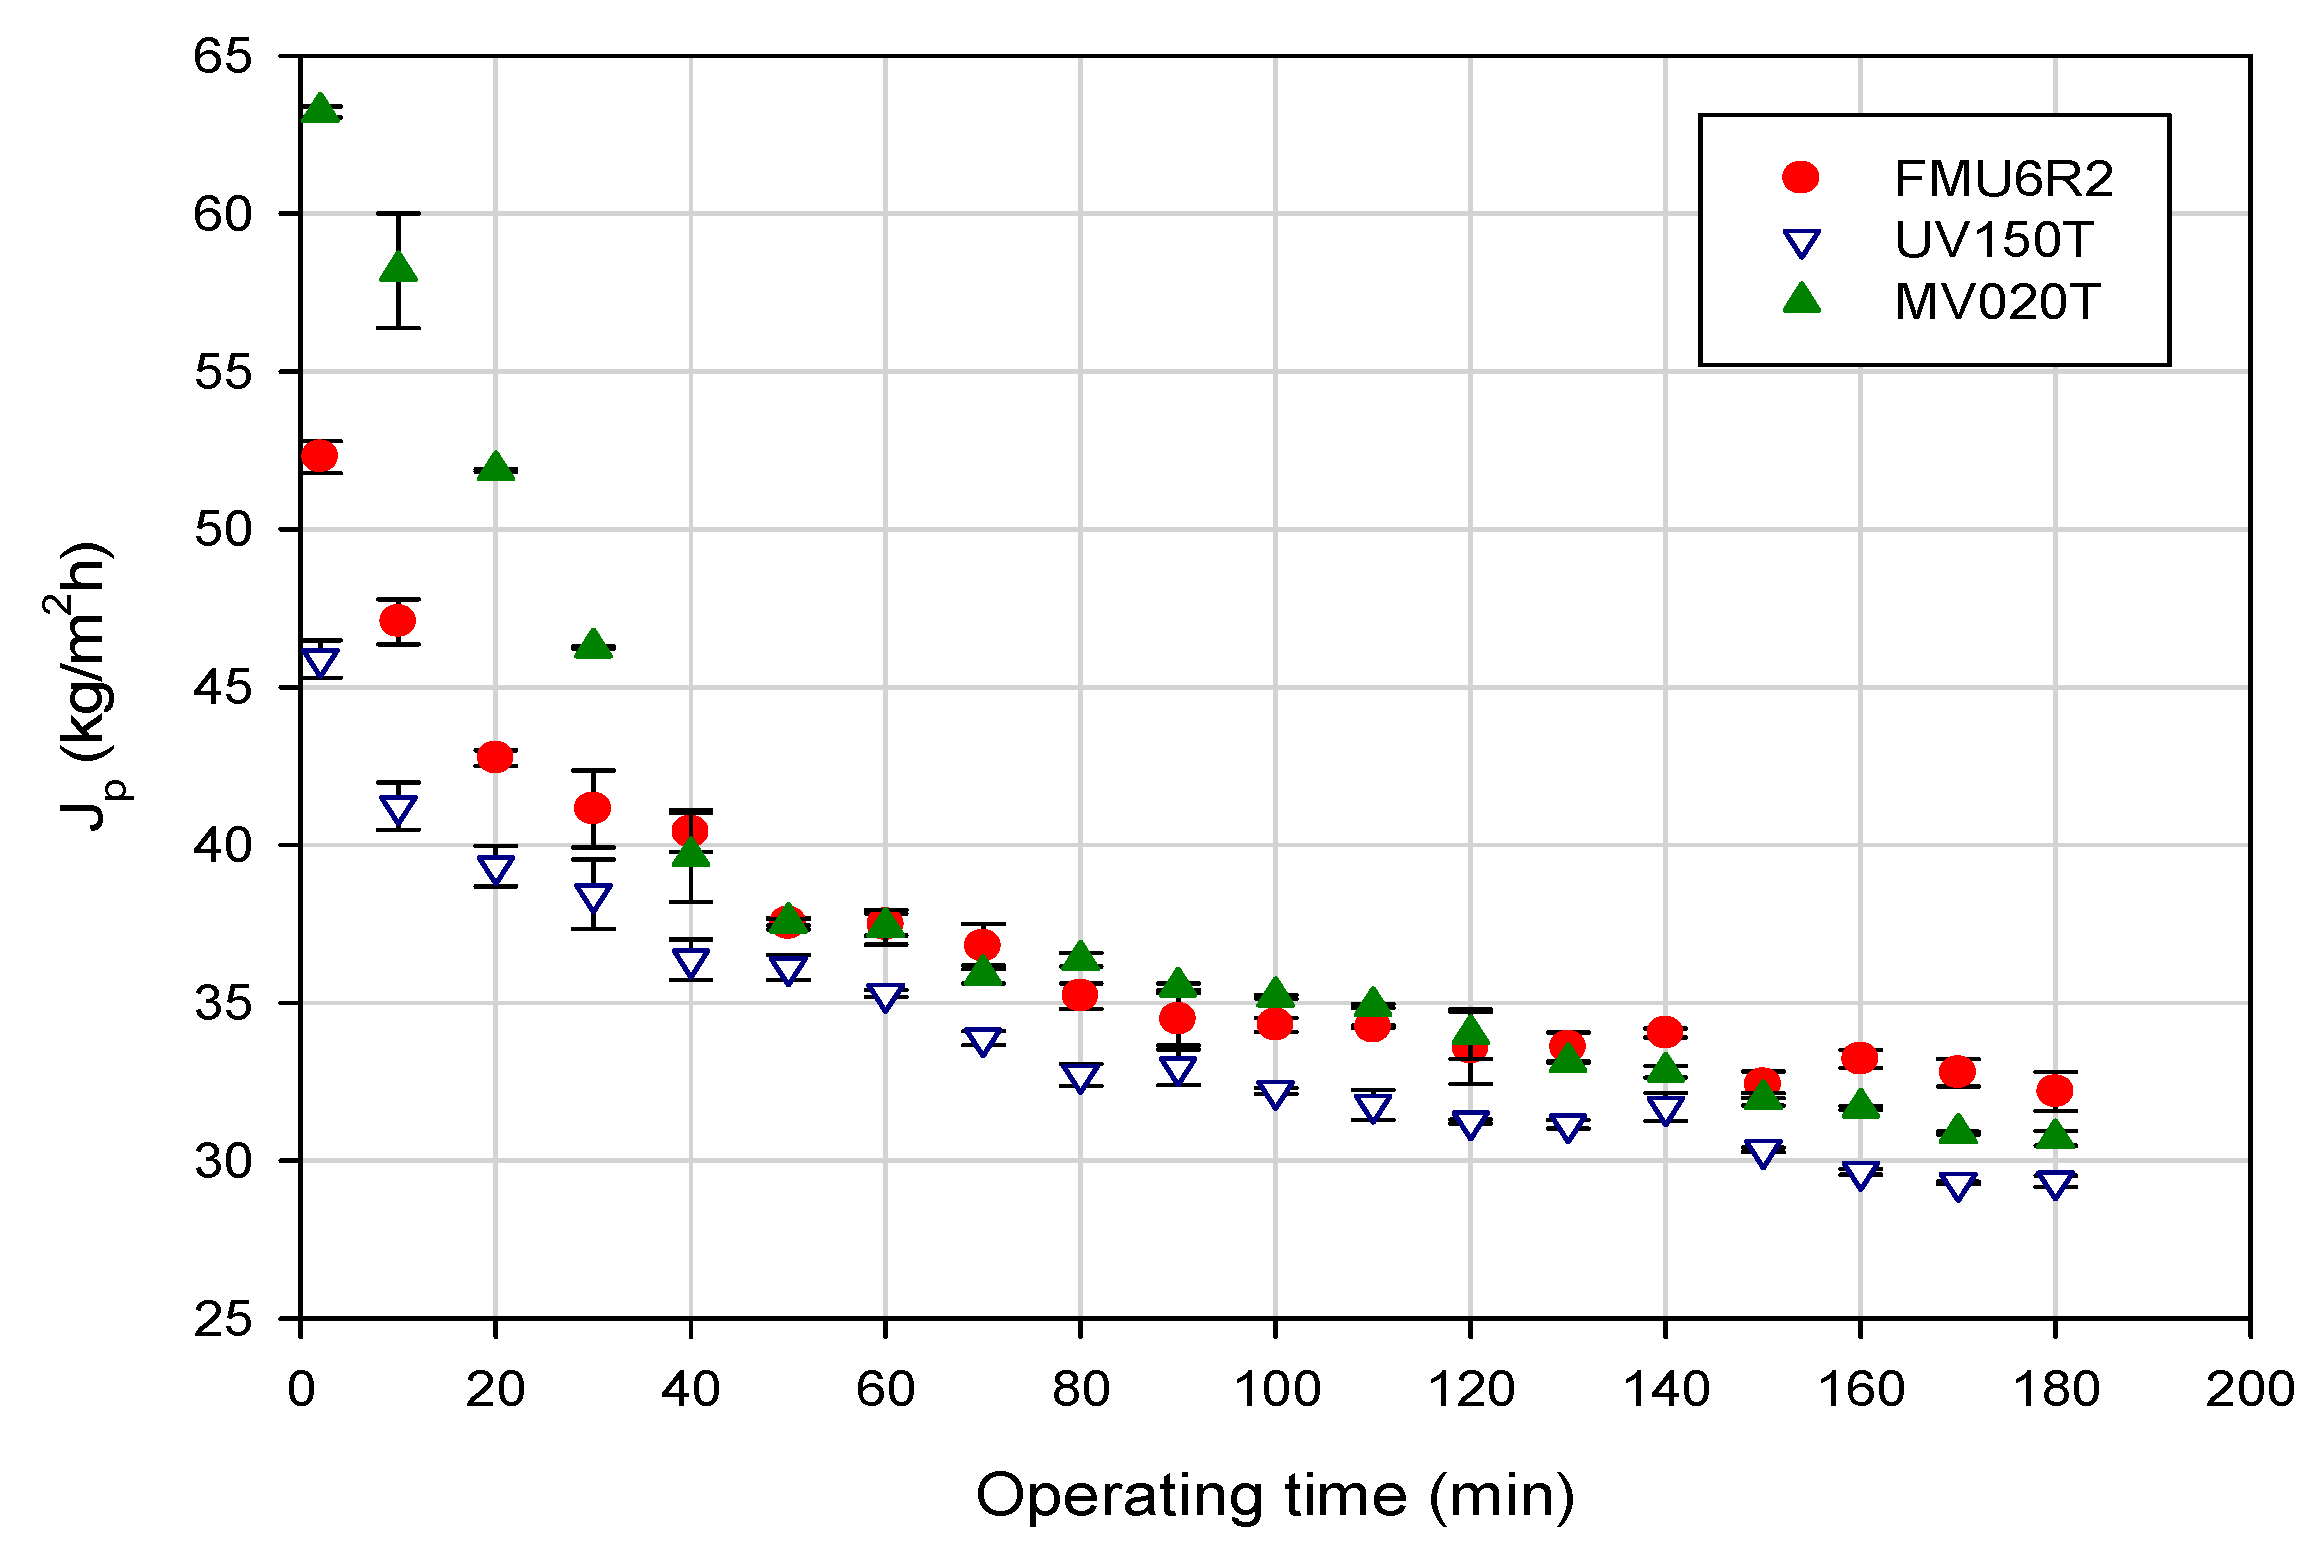
4.2. Time Evolution of Permeate Flux
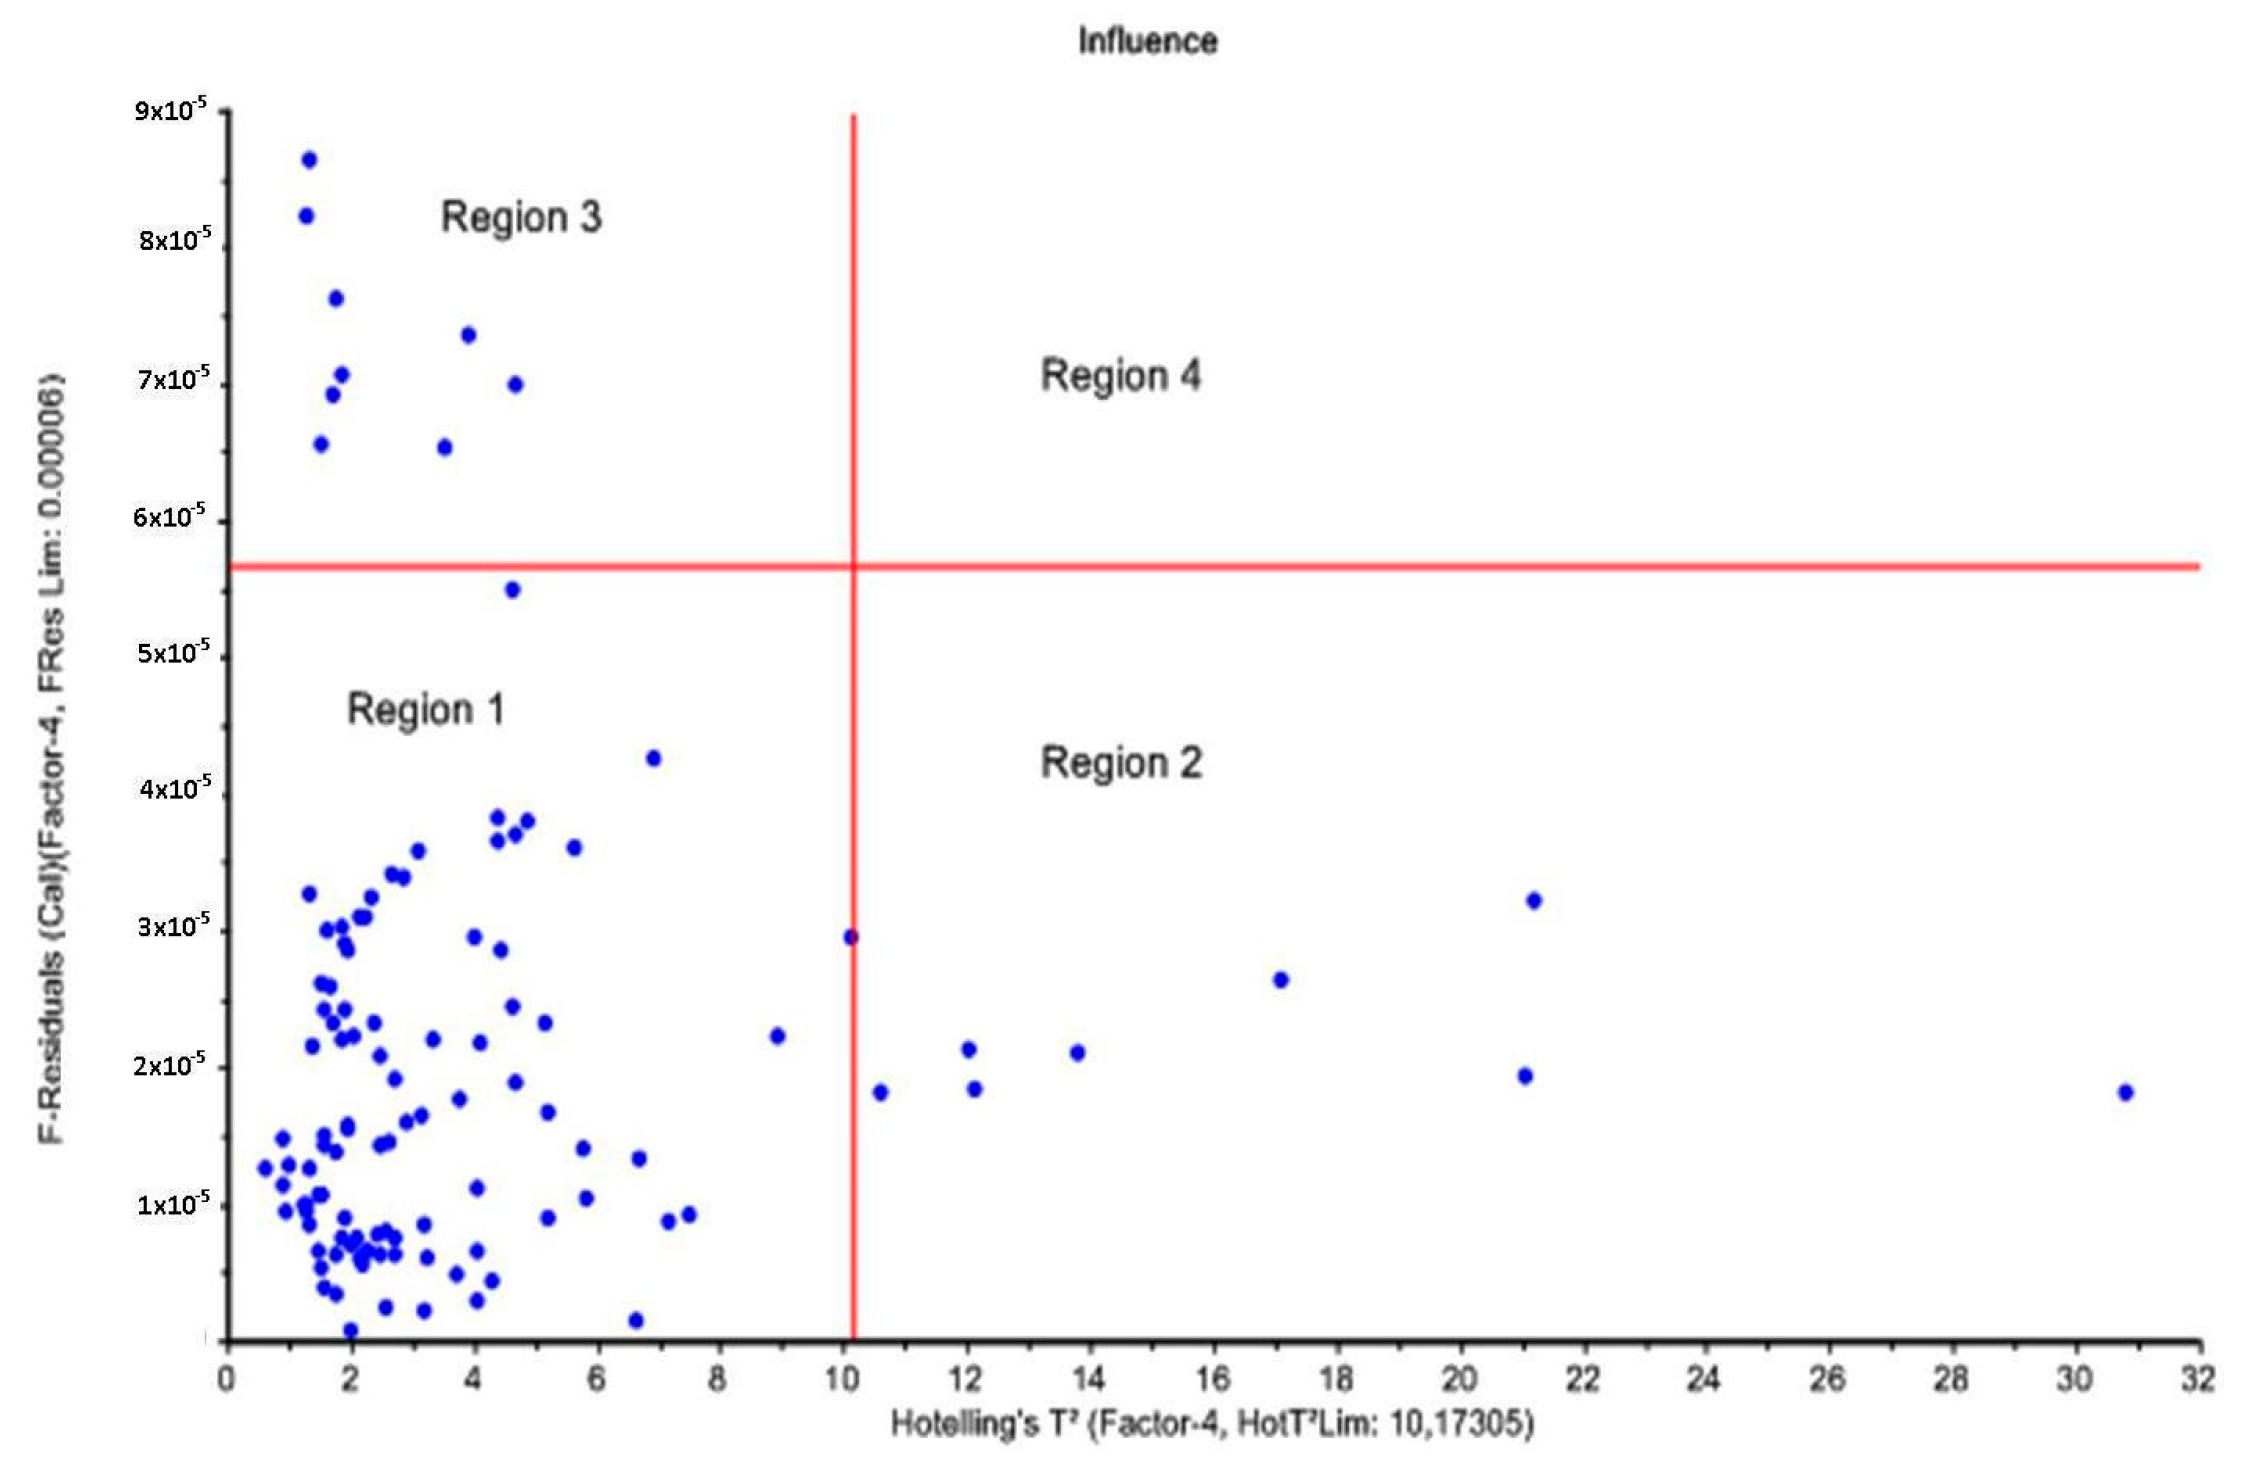
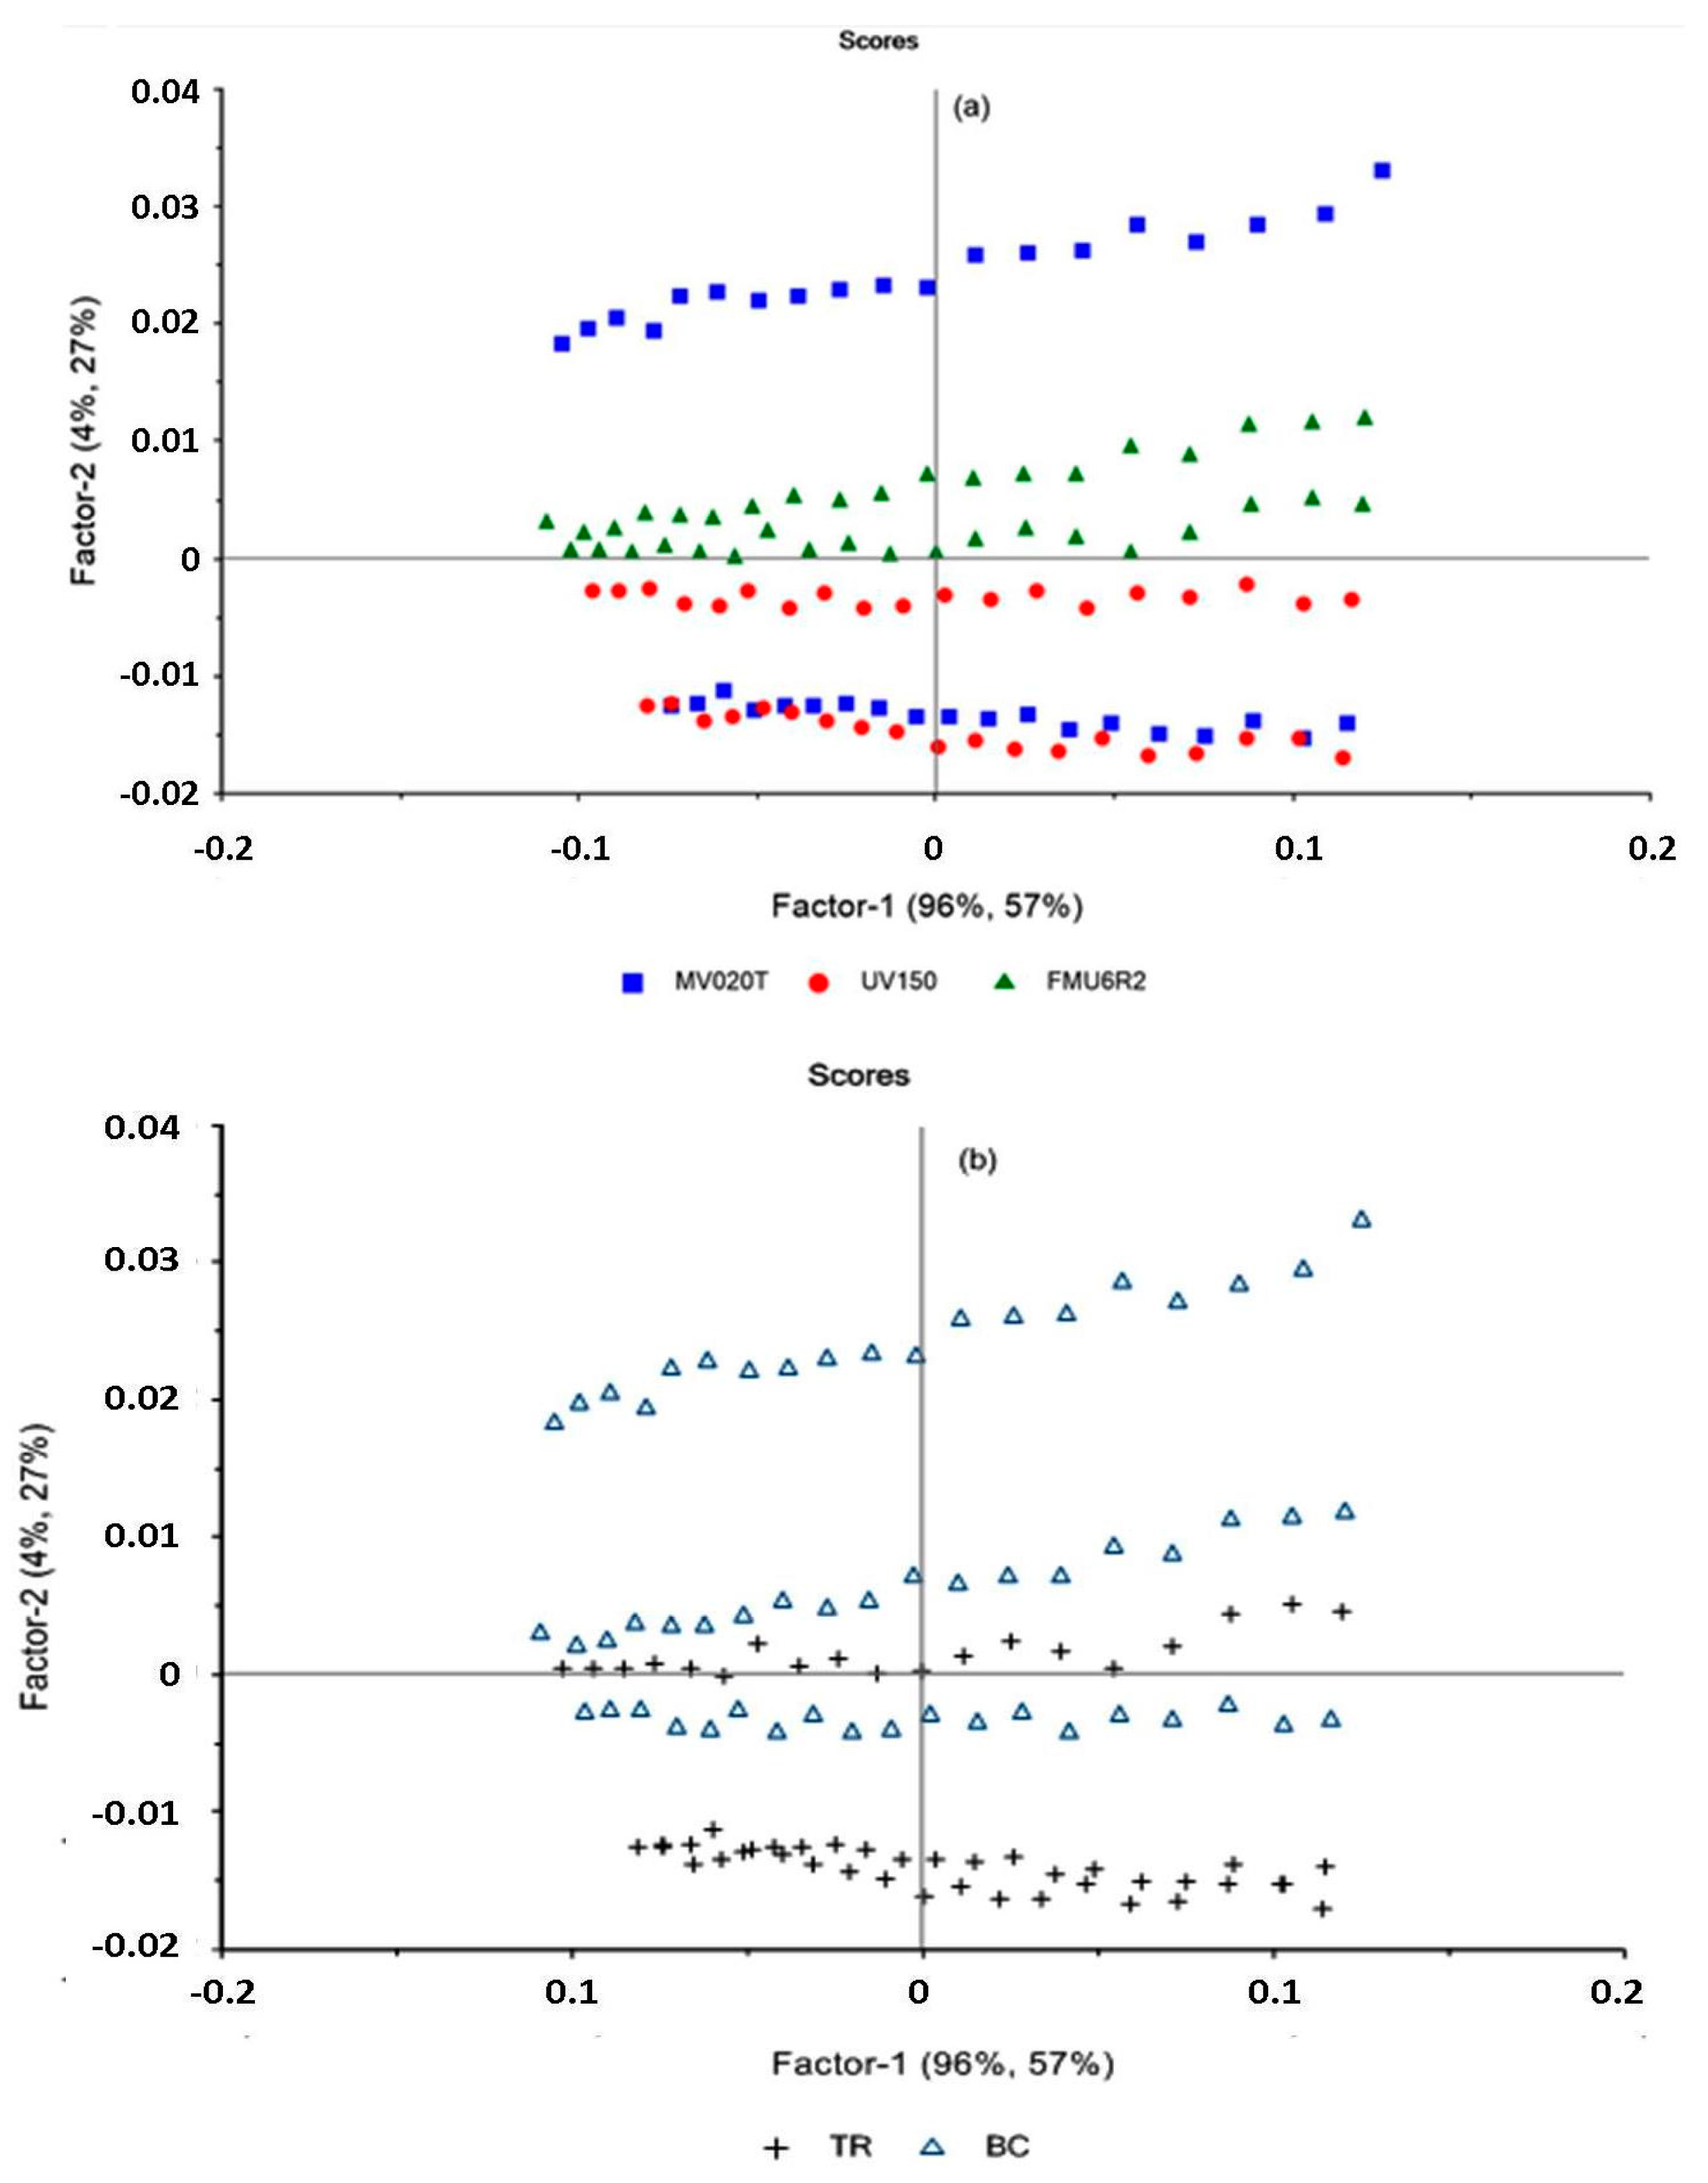
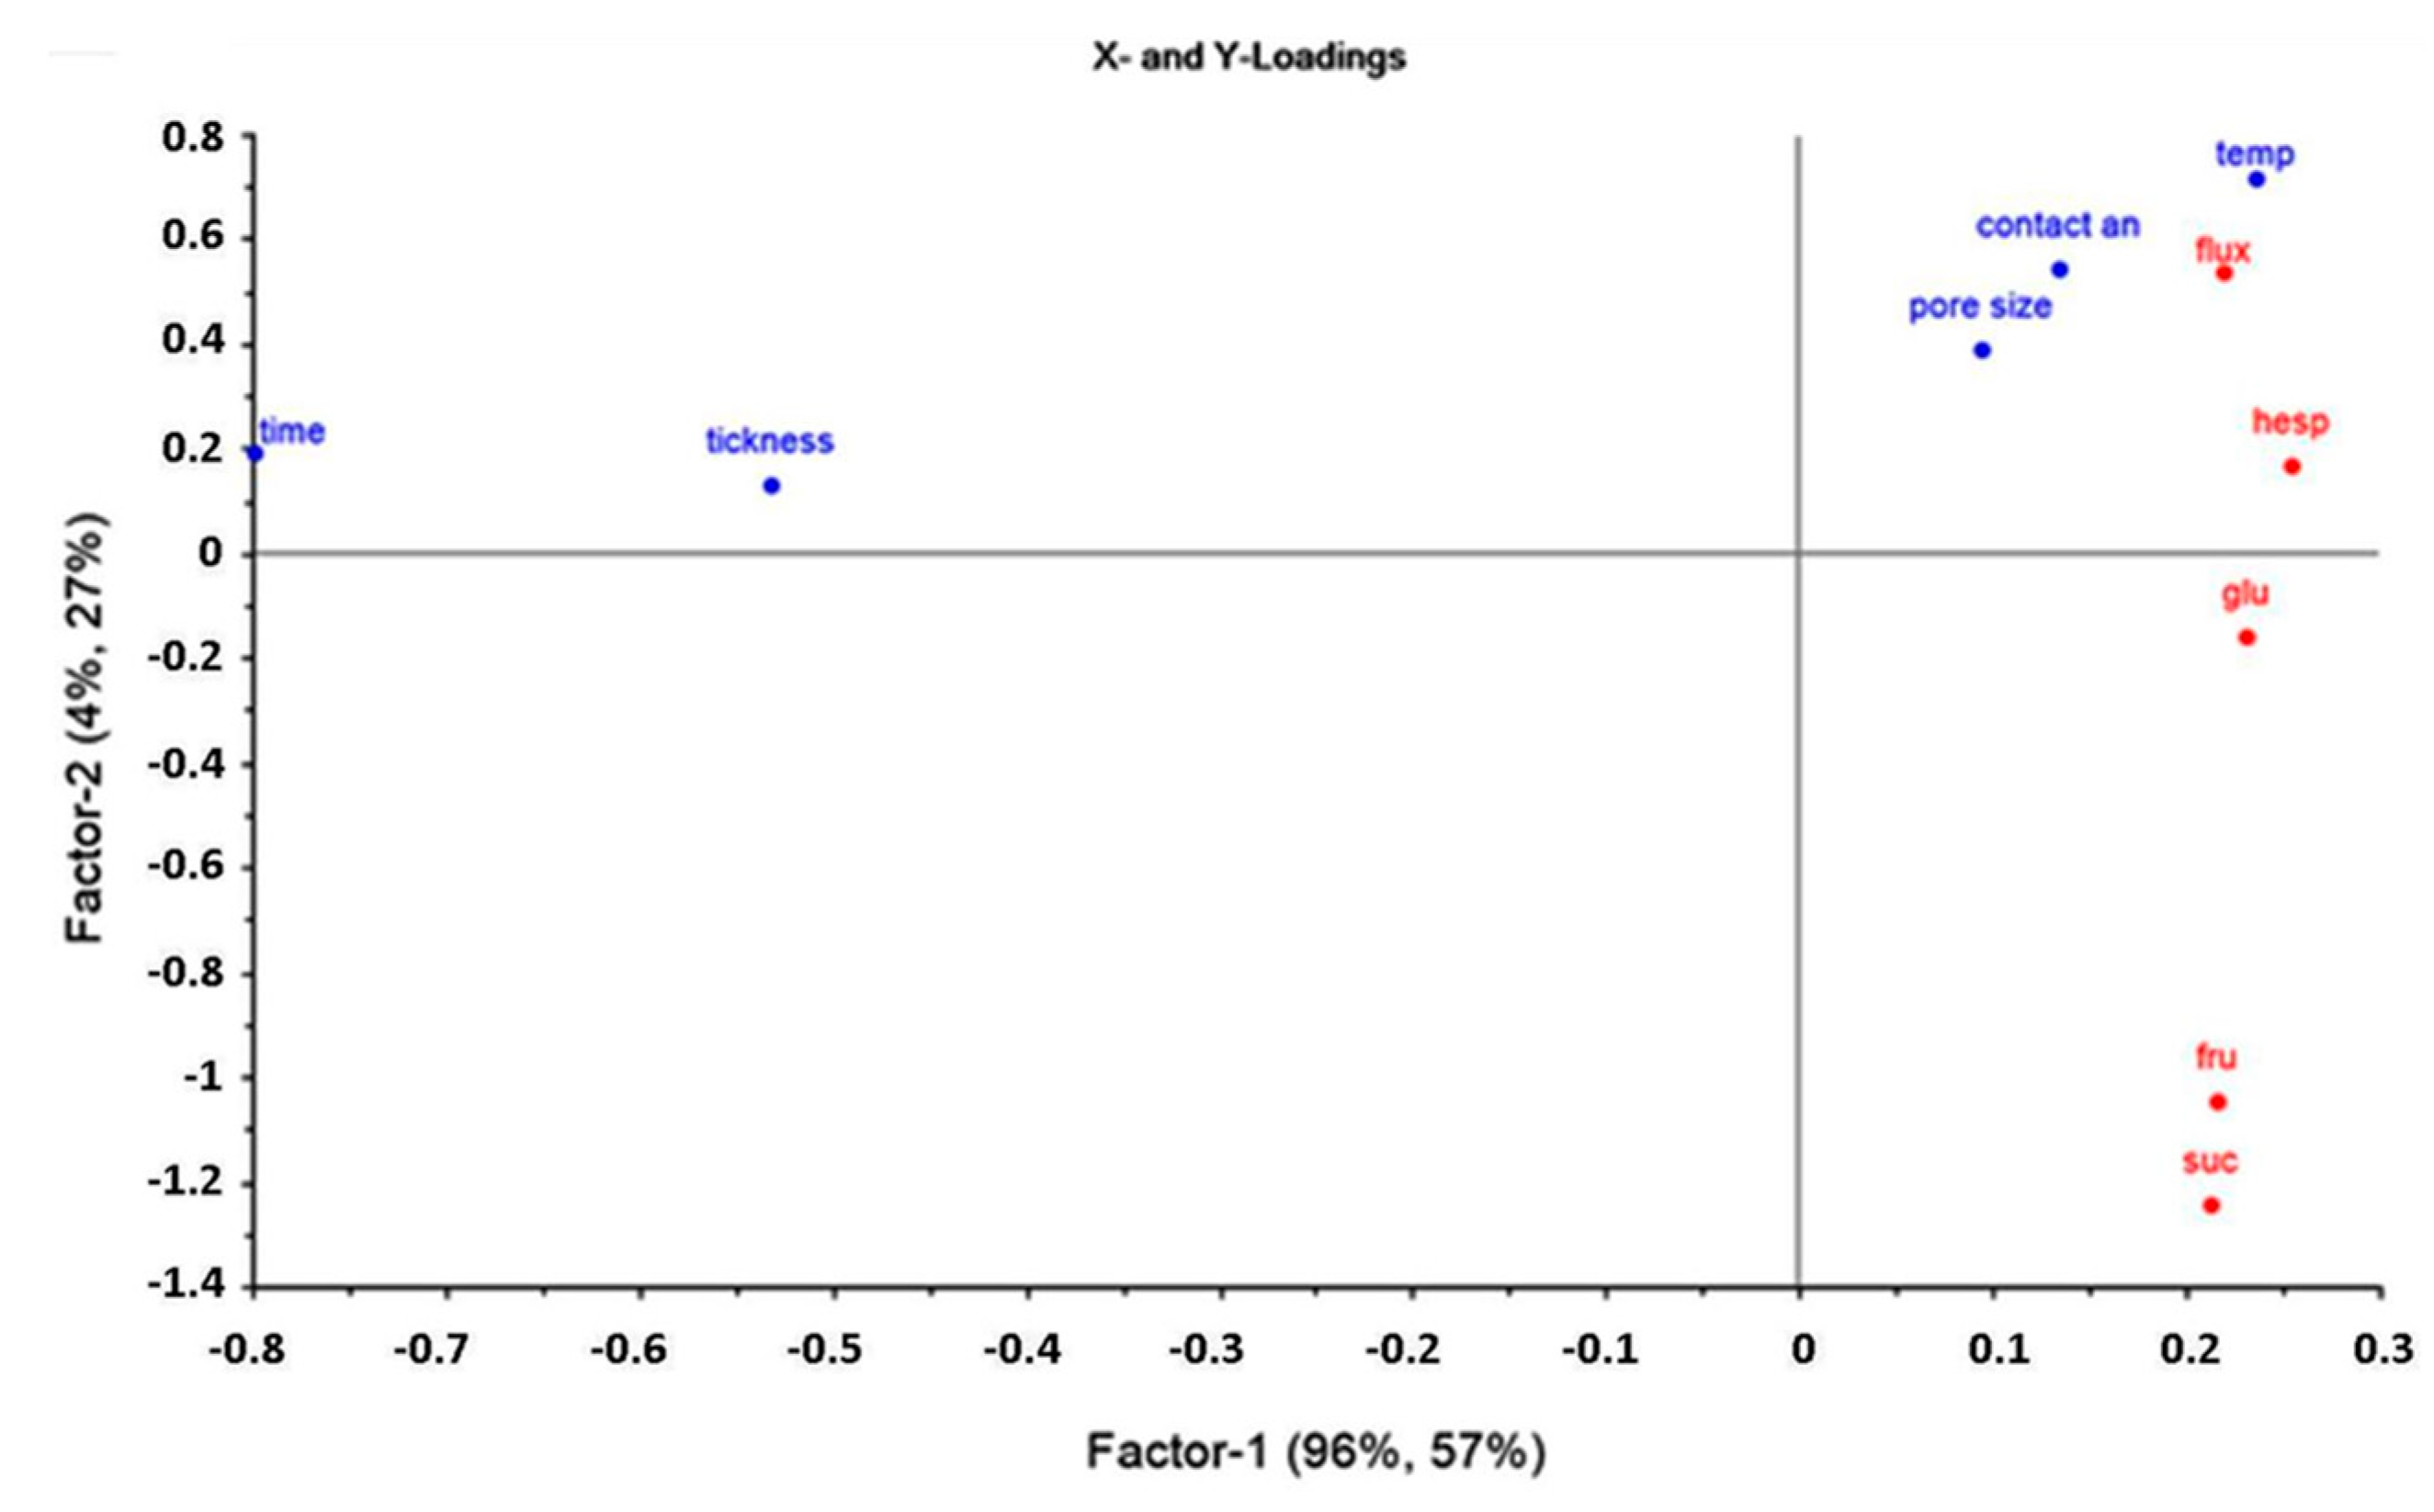
Figure 2 shows the time evolution of permeate flux under the TR configuration. For all selected membranes the permeate flux reduces constantly due to concentration polarization and fouling phenomena until to reach a uniform rate known as steady-state. In particular, the MV020T membrane and the FMU6R2 membrane showed a quite similar flux decay (35.6 and 31.6%, respectively); for the UV150T membrane the flux decay was of about 41.4%. These effects could be attributed to the type of fouling produced during the treatment of the orange press liquor. As expected, the MF membrane, with larger pore size, exhibited highest permeate flux values in comparison with UF membranes.
In the BC configuration the permeate stream is continuously removed from the system, while the retentate stream is recycled back to the feed reservoir leading to an increase of the feed concentration during the filtration process. The increased feed concentration results in a more severe concentration polarization and, consequently, in a more pronounced flux decline in comparison with the TC configuration (Figure 3). In these conditions the MF membrane with larger pores showed the maximum flux decay (51.4%), followed by FMU6R2 and UV150T membranes with flux decay values of 38.4% and 36.1%, respectively.

4.3. Data Analyses

The data were pre-processed by using several normalization tools and moving average. Table 3 shows the results obtained for the PLSR models, all of them with four components of factors. The pre-processing of area normalization, followed by moving average, was the once which obtained the highest values of R2 for the calibration and validation, as well as the minimum values of RSME, SE, and bias for all the responses studied. This PLSR model with four factors can explain the 95.64% of the total variance. Even though, there are differences in the capacity of prediction of the PLSR model for each response variable in all the cases the prediction was higher than 91% (R2), as shown in Table 3.
Figure 4 shows the analysis of the presence of outliers which were carried out by the use of Hotelling T2 statistic, a multivariate generalization of the student t-test [35]. In this figure, several points can be appreciated in the regions 1, 2, and 3. They represent samples similar to the majority of the calibration population, samples which fit the model but are extreme in properties and samples which differ from the average model population, respectively. On the other hand, samples which are different and extreme, those considered as outliers are placed in the region 4. Thus, none of the data was removed for the PLSR modelling.
The PLSR scores-plot shown in Figure 4 was used to evaluate the relationship between the samples. Factors 1 and 2, including 100% of the X-matrix data and explaining the 83% of the variability in the Y-matrix, demonstrate that there are differences in the membranes studied and can be grouped according to the tested membrane; this means that each membrane is characterized by specific parameters which discriminate it from each other leading to a specific performance. In particular, the FMU6R2 membrane showed similarities, and it is grouped clearly as a cluster, as well as UV150T membrane placed in the negative sector of factor 2 (Figure 5a). The MV020T membrane has not grouped, and it is placed in the positive and negative part of factor 2. On the other hand, regarding the type of process, the score-plot (Figure 5b) showed a grouping between the TR and BC configuration.
This group is not clearly observed for the FMU6R2 membrane placed in the origin of factor 2: for this membrane TRC and BC are not grouped. These results highlight the differences not only between the membrane characteristics but also between the type of configuration in which the principal difference is related to the increase of feed concentration which produces a variance in the type of fouling and, consequently, in the membrane performance.
The correlation among all membrane characteristics and operating conditions with the responses variables used to evaluate the membrane performance is illustrated in Figure 6. In this figure differences in the influence of membrane characteristics and operating conditions on the permeate flux and rejection of hesperidin and sugars can be appreciated. In particular, operating time and thickness play a significant role (they are far away from the responses) on the permeate flux and rejections: this means that higher values of thickness and operating time produce a lower value of permeate flux and rejection towards hesperidin and sugars. In this regard, it is well known that an increase in membrane thickness produces an additional resistance to the mass transfer across the membrane. Thus membranes with lower values of membrane thickness are preferred. On the other hand, higher operating times are related to a progressive membrane fouling leading to an increasing of membrane resistance. The decrease in the membrane rejection is related to the concentration polarization phenomena which produces an increase in the particle concentration at the membrane surface where the difference in the chemical potential produces a diffusion of hesperidin and sugars with a decreasing of membrane rejection.
The loading-plot also shows the positive correlation between temperature, contact angle, and pore size distribution with permeate flux and rejection of hesperidin since they are located in the positive quadrant of factors 1 and 2. Even though these variables have presented less importance in the model, their influences in the responses should not be neglected. According to the film model [36], an increase in temperature enhances permeate flux due to an increase of the mass-transfer coefficient. An increasing in MWCO produces an increase in the rejection towards hesperidin due to the type of fouling produced. In particular, in membranes with larger pores, such as MF membranes, a complete pore blocking or a partial pore blocking is the dominant fouling mechanism which produces a decrease in the pore size and a consequent increase in the rejection as is shown in Figure 7. The physical blockage of the pores also produces a more significant flux decline in comparison with membranes having tight pores. Similar results were obtained by Lin et al. [37] which evaluated the effects of dissolved organic matter retention and membrane pore size on membrane fouling and flux decline.
By referring to the sugars rejection, it is appreciated in factor 2 of the loading-plot that glucose, fructose, and sucrose are negatively related to pore size, contact angle, and temperature. According to results obtained by Jiraratananon and Chanachai [38] in the clarification of passion fruit juice by UF membranes, the operating temperature enhances the back diffusion of solutes into the bulk solution reducing the thickness of the concentration polarization layer. Fructose, glucose, and sucrose rejections showed a similar behavior because are closer in the negative quadrant of factors 1 and 2 in the loading plot.
The PLSR model built after data pre-treatment including four factors is suitable to predict the response variables by correlation of membrane characteristics and operating conditions. Table 3 shows that the model fits well the experimental data with R2 values of 96.2, 95.8, 91.7, 97.5, and 94.3 for permeate flux, hesperidin, glucose, fructose, and sucrose rejection, respectively. The obtained model can be used to predict the permeate flux, as well as hesperidin and sugars rejections, by using input data such as contact angle, membrane thickness, pore size distribution, as well as operating conditions, such as temperature and process time. The model is consistent with the knowledge obtained in early studies and supplies new information concerning membrane filtration in citrus juice processing.

5. Conclusions

Orange press liquor was clarified by using three flat-sheet MF and UF polymeric membranes in both total recycle and batch concentration configuration. A multivariate analyses approach was used to study the relationship between membrane characteristics and operating conditions and membrane performance in terms of permeate flux and membrane rejection towards hesperidin and sugars (glucose, fructose, and sucrose). In particular, the partial least squares regression (PLSR) model was used in order to predict the response variables by using input data such as contact angle, membrane thickness, pore size distribution as well as operating conditions, such as temperature and process time.
The model well fitted the experimental data with R2 values of 96.2, 95.8, 91.7, 97.5, and 94.3 for permeate flux, hesperidin, glucose, fructose, and sucrose rejection, respectively. Therefore, the capacity of prediction of response variables resulted higher than 91.7%.
The obtained results indicated that the multivariate method appears as an efficient tool in the examination of experimental results and reveals crucial information on which variables are relevant to maximize the permeate flux and to minimize the rejection of hesperidin and sugars in the clarification of orange press liquor, so maximizing the productivity of the process and the recovery of target compounds in the permeate stream.

Author Contributions

Conceptualization: A.C. and R.R.-F.; methodology: A.C., C.C., R.R.-F. and G.S.; software: R.R.-F.; analytical measurements: M.N.; data elaboration: R.R.-F.; writing—original draft preparation: A.C. and R.R.-F.; supervision: A.C.

Funding

This research received no external funding.

Acknowledgments

The authors wish to thank Silvia Simone from ITM-CNR for her valuable contribution in the characterization of flat-sheet membranes used in the present work.

Conflicts of Interest

The authors declare no conflict of interest.

References

  1. Statista. The Statistics Portal. Available online: https://www.statista.com/statistics/577398/world-orange-production (accessed on 12 October 2018).
  2. Goodrich, R.M.; Braddock, R.J. Major By-Products of the Florida Citrus Processing Industry, Document FSHN05–22, Series of the Food Science and Human Nutrition Department, Florida Cooperative Extension Service, Institute of Food and Agricultural Sciences, University of Florida, Original Publication Date October 2004. Available online: Ufdcimages.uflib.ufl.edu/IR/00/00/20/62/00001/FS10700.pdf (accessed on 12 October 2018).
  3. Garcia-Castello, E.M.; McCutcheon, J.R. Dewatering press liquor derived from orange production by forward osmosis. J. Membr. Sci. 2011, 372, 97–101. [Google Scholar] [CrossRef]
  4. Imeh, U.; Khokhar, S. Distribution of conjugated and free phenols in fruits: Antioxidant activity and cultivar variations. J. Agric. Food Chem. 2002, 50, 6301–6306. [Google Scholar] [CrossRef] [PubMed]
  5. Laufenberg, G.; Kunz, B.; Nystroem, M. Transformation of vegetable waste into value added products. Bioresour. Technol. 2003, 87, 167–198. [Google Scholar] [CrossRef]
  6. Marín, F.R.; Martínez, M.; Uribesalgo, T.; Castillo, S.; Frutos, M.J. Changes in nutraceutical composition of lemon juices according to different industrial extraction systems. Food. Chem. 2002, 78, 319–324. [Google Scholar] [CrossRef]
  7. Librán, C.; Mayor, L.; Garcia-Castello, E.; Vidal-Brotons, D. Polyphenol extraction from grape wastes: Solvent and pH effect. Agric. Sci. 2013, 4, 56–62. [Google Scholar] [CrossRef]
  8. Galanakis, C.M. Recovery of high added-value components from food wastes: Conventional, emerging technologies and commercialized applications. Trends Food Sci. Technol. 2012, 26, 68–87. [Google Scholar] [CrossRef]
  9. Cassano, A.; Conidi, C.; Giorno, L.; Drioli, E. Fractionation of olive mill wastewaters by membrane separation techniques. J. Hazard. Mater. 2013, 248–249, 185–193. [Google Scholar] [CrossRef] [PubMed]
  10. Conidi, C.; Cassano, A.; Garcia-Castello, E. Valorization of artichoke wastewaters by integrated membrane process. Water Res. 2014, 48, 363–374. [Google Scholar] [CrossRef] [PubMed] [Green Version]
  11. Giacobbo, A.; Bernardes, A.M.; de Pinho, M.N. Sequential pressure driven membrane operations to recover and fractionate polyphenols and polysaccharides from second racking wine lees. Sep. Purif. Technol. 2017, 173, 49–54. [Google Scholar] [CrossRef]
  12. Conidi, C.; Cassano, A.; Drioli, E. Recovery of phenolic compounds from orange press liquor by nanofiltration. Food Bioprod. Process. 2012, 90, 867–874. [Google Scholar] [CrossRef]
  13. Cassano, A.; Conidi, C.; Ruby-Figueroa, R. Recovery of flavonoids from orange press liquor by an integrated membrane process. Membranes 2014, 4, 509–524. [Google Scholar] [CrossRef]
  14. Rai, P.; Rai, C.; Majumdar, G.C.; DasGupta, S.; De, S. Storage study of ultrafiltered mosambi (Citrus sinensis L. Osbeck) juice. J. Food Process Preserv. 2008, 32, 923–934. [Google Scholar] [CrossRef]
  15. Alsalhy, Q.; Algebory, S.; Alwan, G.M.; Simone, S.; Figoli, A.; Drioli, E. Hollow fiber ultrafiltration membranes from poly(vinylchloride): Preparation, morphologies, and properties. Sep. Sci. Technol. 2011, 46, 2199–2210. [Google Scholar] [CrossRef]
  16. Girard, B.; Fukumoto, L.R.; Koseoglu, S.S. Membrane processing of fruit juices and beverages: A review. Crit. Rev. Biotechnol. 2000, 20, 109–175. [Google Scholar] [CrossRef] [PubMed]
  17. Kallioinen, M.; Reinikainen, S.P.; Nuortila-Jokinen, J.; Mänttäri, M.; Sutela, T.; Nurminen, P. Chemometrical approach in studies of membrane capacity in pulp and paper mill application. Desalination 2005, 175, 87–95. [Google Scholar] [CrossRef]
  18. Ruby-Figueroa, R.; Cassano, A.; Drioli, E. Ultrafiltration of orange press liquor: Optimization for permeate flux and fouling index by response surface methodology. Sep. Purif. Technol. 2011, 80, 1–10. [Google Scholar] [CrossRef]
  19. Ruby-Figueroa, R.; Cassano, A.; Drioli, E. Ultrafiltration of orange press liquor: Optimization of operating conditions for the recovery of antioxidant compounds by response surface methodology. Sep. Purif. Technol. 2012, 98, 255–261. [Google Scholar] [CrossRef]
  20. Höskuldsson, A. Prediction Methods in Science and Technology; Thor Publishing: Copenhagen, Denmark, 1996. [Google Scholar]
  21. Wold, S.; Ruhe, A.; Wold, H.; Dunn, W.J. The collinearity problem in linear regression, The partial least squares approach to generalized inverses. SIAM J. Sci. Stat. Comput. 1984, 5, 735–743. [Google Scholar] [CrossRef]
  22. Wold, S.; Sjöström, M.; Eriksson, L. PLS in chemistry. In The Encyclopedia of Computational Chemistry; Schleyer, P.V.R., Allinger, N.L., Clerk, T., Gasteiger, J., Kollman, P.A., Schaefer, H.F., III, Schreiner, P.R., Eds.; John Wiley & Sons: Chichester, UK, 1999; pp. 2006–2020. [Google Scholar]
  23. Wold, S.; Sjöström, M.; Eriksson, L. PLS-Regression: A basic tool of chemometrics. J. Chemom. 2001, 58, 109–130. [Google Scholar] [CrossRef]
  24. Kourti, T.; MacGregor, J.F. Process analysis, monitoring and diagnosis, using multivariate projection methods. Chemom. Intell. Lab. Syst. 1995, 28, 3–21. [Google Scholar] [CrossRef]
  25. MacGregor, J.F.; Yu, H.; Muñoz, S.G.; Flores-Cerrillo, J. Data-based latent variable methods for process analysis, monitoring and control. Comput. Chem. Eng. 2005, 29, 1217–1223. [Google Scholar] [CrossRef]
  26. Metsämuuronena, S.; Reinikainenb, S.; Nyström, M. Analysis of protein filtration data by PLS regression. Desalination 2002, 149, 453–458. [Google Scholar] [CrossRef]
  27. Santos, J.L.C.; Hidalgo, A.M.; Oliveira, R.; Velizarov, S.; Crespo, J.G. Analysis of solvent flux through nanofiltration membranes by mechanistic, chemometric and hybrid modelling. J. Membr. Sci. 2007, 300, 191–204. [Google Scholar] [CrossRef]
  28. Hernández, A.; Calvo, J.I.; Prádanos, P.; Tejerina, F. Pore size distributions in microporous membranes. A critical analysis of the bubble point extended method. J. Membr. Sci. 1996, 112, 1–12. [Google Scholar] [CrossRef]
  29. Yu, J.; Hu, X.; Huang, Y. A modification of the bubble-point method to determine the pore-mouth size distribution of porous materials. Sep. Purif. Technol. 2010, 70, 314–319. [Google Scholar] [CrossRef]
  30. Esbensen, K.H.; Swarbrick, B. Multivariate Data Analysis: An Introduction to Multivariate Analysis, Process Analytical Technology and Quality by Design, 6th ed.; CAMO Software AS: Oslo, Norway, 2018. [Google Scholar]
  31. Erikson, L.; Johansson, E.; Kettaneh-Wold, N.; Trygg, J.; Wikström, C.; Wold, S. Multi-And Megavariate Data Analysis: Basic Principles and Applications; Umetrics AB: Umeå, Sweden, 2006. [Google Scholar]
  32. Wold, H. Soft modelling, The basic design and some extensions. In Systems Under Indirect Observation, Causality-Structure-Prediction; Part 2; Jöreskog, K.G., Wold, H., Eds.; North-Holland Publishing Co.: Amsterdam, The Netherlands, 1982. [Google Scholar]
  33. Wold, S.; Albano, C.; Dunn, W.; Edlund, U.; Esbensen, K.; Geladi, P.; Hellberg, S.; Johanson, E.; Lindberg, W.; Sjöström, M. Multivariate data analysis in chemistry. In Mathematics and Statistics in Chemistry; Kowalski, B.R., Ed.; Reidel Publishing Company: Dordrecht, The Netherlands, 1984. [Google Scholar]
  34. Wold, S.; Johansson, E.; Cocchi, M. PLS-partial least squares projections to latent structures. In 3D QSAR in Drug Design, Theory, Methods, and Applications; Kubinyi, H., Ed.; ESCOM Science Publishers: Leiden, The Netehrlands, 1993; pp. 523–550. [Google Scholar]
  35. Hotelling, H. Analysis of a complex of statistical variables into principal components. J. Ed. Psychol. 1993, 24, 417–441. [Google Scholar] [CrossRef]
  36. Fane, A.G.; Fell, C.J.D. A review of fouling and fouling control in ultrafiltration. Desalination 1987, 62, 117–136. [Google Scholar] [CrossRef]
  37. Lin, C.F.; Lin, A.Y.C.; Chandana, P.S.; Tsai, C.Y. Effects of mass retention of dissolved organic matter and membrane pore size on membrane fouling and flux decline. Water Res. 2009, 43, 389–394. [Google Scholar] [CrossRef]
  38. Jiraratananon, R.; Chanachai, A. A study of fouling in the ultrafiltration of passion fruit juice. J. Membr. Sci. 1996, 111, 39–48. [Google Scholar] [CrossRef]
Figure 1. Schematic diagram of the experimental set-up: (1) feed tank; (2) feed pump; (3,5) pressure gauges; (4) flat-sheet cell; (6) digital balance; (7) retentate valve; (8) permeate tank; and (9) thermometer.
Chemengineering 03 00010 g001
Figure 2. Time course of permeate flux for selected membranes under total recycle configuration. Operating conditions: TMP, 1 bar; temperature, 26.0 ± 1.0 °C; feed flowrate, 185 L/h.
Chemengineering 03 00010 g002
Figure 3. Time course of permeate flux for selected membranes under batch concentration configuration. Operating conditions: TMP, 1 bar; temperature, 26.0 ± 2.0 °C; and feed flowrate, 185 L/h.
Chemengineering 03 00010 g003
Figure 4. Influence plot with Hotelling’s T2 statistic.
Chemengineering 03 00010 g004
Figure 5. PLS Score plot for the two principal factors. (a) Measurements griped by membrane studied, and (b) measurements by type of processing.
Chemengineering 03 00010 g005
Figure 6. PLS loading plot for the two principal factors.
Chemengineering 03 00010 g006
Figure 7. Rejections of sugars and hesperidin for selected membranes under batch concentration configuration. Operating conditions: TMP, 1 bar; temperature, 26.0 ± 1.0 °C; and feed flowrate, 185 L/h.
Chemengineering 03 00010 g007
Table 1. Physico-chemical characteristics of orange press liquor.
Hesperidin (mg/L)159.60 ± 14.42
Glucose (mg/mL)14.69 ± 0.19
Fructose (mg/mL)20.48 ± 0.11
Sucrose (mg/mL)2.11 ± 0.13
Total soluble solids (g/100 g)8.6 ± 0.1
Solid content, after lyophilisation (g/100 mL)4.94 ± 0.04
Density (kg/L)1.02835 ± 0.0005
pH3.58 ± 0.03
Viscosity (cp)15 °C1.60 ± 0.02
25 °C1.45 ± 0.01
35 °C1.31 ± 0.03
Table 2. Characteristics of selected membranes.
Membrane TypeMV020TUV150TFMU6R2
Membrane processMFUFUF
Membrane configurationflat-sheetflat-sheetflat-sheet
Membrane materialPVDFPVDFPVDF
pH range2–112–112–11
Processing temperature (°C)5–955–955–95
Thickness (mm)0.188 ± 0.005 b0.212 ± 0.004 b0.190 ± 0.003 b
MWCO (kDa)˗150 a200 a
Pore size (µm)0.2 a--
Maximum pore size distribution (frequency, %)93.21 b79.77 b40.47 b
Diameter at maximum pore size distribution (µm)0.488 ± 0.048 b0.195 ± 0.019 b0.212 ± 0.021 b
MWCO, molecular weight cut-off; PVDF, polyvinylidenfluoride (PVDF). a data from the manufacturer; b experimental data.
Table 3. Comparison of various pre-processing methods for the PLSR modeling. Pre-processing: A: Normalize (area normalization) and moving average; B: Normalize (unit vector normalization) and moving average; C: Normalize (mean normalization) and moving average (Cal: Calibration data set; Val: Validation data set).
ResponseParametersPre-Processing
NoneABC
CalValCalValCalValCalVal
Permeate fluxSlope0.5960.5760.9660.9590.9780.9730.9660.959
R20.5960.5640.9660.9620.9780.9750.9660.962
RMSE (C,P)4.3394.5210.0030.0030.0070.0080.0310.033
SE (C,P)4.3584.5410.0030.0030.0070.0080.0310.033
Bias0−0.0010−7.4 × 10−50−7.9 × 10−50−3.4 × 10⁻⁴
HesperidinSlope0.8640.8590.9630.9570.9620.9610.9630.956
R20.8640.8520.9630.9580.9620.9590.9630.958
RMSE (C,P)3.9064.0760.0030.0040.0110.0110.0350.038
SE (C,P)3.9234.0940.0030.0040.0110.0110.0360.038
Bias0−0.0320−7.1 × 10−504.9 × 10−50−4.4 × 10⁻⁴
GlucoseSlope0.2800.2570.9250.9210.8990.8990.9250.921
R20.2800.2450.9250.9170.8990.8940.9250.919
RMSE (C,P)7.5547.8530.0050.0050.0180.0190.0510.054
SE (C,P)7.5877.8870.0050.0050.0180.0190.0510.054
Bias0−0.0570−8.9 × 10−501.3 × 10−40−0.0006
FructoseSlope0.3090.2860.9780.9810.6750.6760.9780.981
R20.3090.2740.9780.9750.6750.6410.9780.975
RMSE (C,P)7.1337.4130.0030.0030.0370.0390.0310.033
SE (C,P)7.1647.4450.0030.0030.0380.0390.0310.033
Bias0−0.06007.4 × 10−500.000603.4 × 10−4
SucroseSlope0.0520.0220.9510.95460.6360.6370.9510.954
R20.0520.0010.9510.9430.6360.5950.9510.946
RMSE (C,P)18.46519.0740.0050.0060.0440.0470.0530.057
SE (C,P)18.54719.1590.0050.0060.0440.0470.0530.057
Bias0−0.05101.1 × 10−400.000800.0006

