Article

Effect of Chain Length and Functional Group of Organic Anions on the Retention Ability of MgAl- Layered Double Hydroxides for Chlorinated Organic Solvents

1
Grupo de Investigación Reconocido-Química del Estado Sólido, Materiales y Catálisis Heterogénea (GIR-QUESCAT), Departamento de Química Inorgánica, Universidad de Salamanca, 37008 Salamanca, Spain
2
Institute of Earth Sciences, University of Iceland, Sturlugata 7, 101 Reykjavík, Iceland
*
Author to whom correspondence should be addressed.
ChemEngineering 2019, 3(4), 89; https://doi.org/10.3390/chemengineering3040089
Submission received: 16 September 2019 / Revised: 11 November 2019 / Accepted: 18 November 2019 / Published: 28 November 2019
(This article belongs to the Special Issue Advanced Applications of Layered Double Hydroxides)

Abstract

:
Nowadays, the contamination of groundwater and soils by chlorinated organic solvents is a severe and worldwide problem. Due to their swelling properties, Layered Double Hydroxides (LDHs) are potentially excellent compounds to retain chlorinated organic solvents from aquifers. By intercalating organic anions, the polarity of the interlayer space can be changed from hydrophilic to hydrophobic, enhancing the adsorption of chloro-organic molecules onto the alkyl chains of intercalated organic anions. In this study, organically modified LDHs were synthesized and their efficiency was tested in batch experiments with three different chlorinated organic solvents, namely trichloroethylene, 1,1,2-trichloroethane and trichloromethane (chloroform), to examine the influence of the chain length and the functional group of the intercalated organic anion upon the retention ability of a LDH due to different electronic interactions and different sizes of the interlayer space. All synthesized and used samples were characterized using powder X-ray diffraction, thermal analysis coupled with mass spectrometry and Fourier-transform infrared spectroscopy; freshly synthesized materials were additionally analyzed regarding their particle size distribution and specific surface area. Results of the batch experiments showed that only LDHs with intercalated long-chain organic anions could be efficient adsorbents for the removal of chlorinated organic solvents from contaminated water. A selective efficiency towards 1,1,2-trichloroethane and trichloromethane can be proposed for these reactants.

Graphical Abstract

1. Introduction

Contamination of aquifers and soils by chlorinated organic solvents is a severe and global problem because of their toxicity and persistence. They have been widely used as degreasing agents, cleaning solutions, especially within dry cleaning processes, paint thinners, as well as pesticides. Once introduced into the environment they can deeply penetrate aquifers and accumulate in the subsurface as so-called dense non-aqueous phase liquids (DNAPLs), which are immiscible and heavier than water. Natural degradation products are often similar or even more harmful and tend to accumulate in the same way as the parental compound.
In the past years, Layered Double Hydroxides (LDHs) have been widely used for remediation processes as they can intercalate and adsorb contaminants and hence reduce their mobility [1,2,3,4]. LDHs, also known as hydrotalcite-like compounds, are composed of a layered structure similar to that of brucite, Mg(OH)2 [5]. The structure of brucite is formed by edge-sharing hydroxyl octahedra with a total occupancy of the octahedral holes by Mg2+ cations in every second interlayer; many divalent metal hydroxides adopt this structure [5,6]. The structure of LDHs is characterized by a partial divalent/trivalent substitution resulting in a net positive charge of the main layer, which is balanced by intercalated anions in the metal cation-free interlayers, where they coexist with water molecules [5,6]. Interlayer anions are linked to the main layer via weak bonds and additional intercalated water molecules provide hydrogen bonds involving the brucite-like layers and the interlayer anions [7]. The general formula of LDHs can be written as [MeII1-x MeIIIx(OH)2]x+[Am−x/m•nH2O]x−[5]. In LDHs, the most common divalent cations (MeII) are Mg, Ca, Mn, Fe, Ni, Cu, Zn, while Al, Mn, Fe, Co, Ni, Cr, Ga serve as common trivalent anions (MeIII) [5,6,7]. In natural systems the most abundant interlayer anions (Am−) are CO32−, OH, Cl, SO42− [5,6,7]. Studies showed that it is possible to intercalate anionic coordination compounds and polyoxometalates [5,8], biochemical molecules [9] or even large organic compounds [6,10,11,12,13] as well as neutral species such as ethylene glycol or glycerin, which are sometimes used to swell the structure of the LDH [14].
The present study focuses on LDHs related to the hydrotalcite sub-group, in which the cations in the main layer are Mg2+ and Al3+ in a 3:1 molar ratio, with carbonate anions in the interlayer. Figure 1 shows the structure of the natural mineral hydrotalcite Mg6Al2CO3(OH)16·4(H2O), which can be formulated as [Mg0.75Al0.25(OH)2](CO3)0.13·0.5H2O to emphasize its relation to the brucite structure.
LDHs provide a high anion exchange capacity, which is mainly used in common synthesis routes where first a precursor is produced, usually containing easily exchangeable anions like chloride or nitrate, whose interlayer anions are then replaced by the desired anion.
Due to their swelling properties, LDHs are potentially excellent compounds to retain chlorinated organic solvents from aquifers, if previously the polarity within the interlayer space is changed from hydrophilic to hydrophobic one to facilitate the adsorption of chloro-organic molecules. Such a change can simply be accomplished by intercalation of long-chain organic carboxylates, sulfates or sulfonates.
Here we present a facile synthesis of MgAl-LDHs with intercalated organic anions prepared by the direct co-precipitation route under supersaturated conditions. The selected synthesis is an easy, rather quick and economic route to directly synthesize the aimed materials without having to produce precursor materials. Many different methods have been described in the literature to prepare this sort of solids, most of them in an aqueous medium; other synthesis routes involve solid state reactions at high temperatures and pressure, liquid-assisted grinding or direct synthesis procedures without production of intermediate products [6,16,17,18,19,20,21]. Direct co-precipitation route was selected considering the potential commercial use of the here studied LDHs for in-situ remediation strategies addressing chlorinated organic solvents.
We have prepared samples with organic anions of different lengths and different functional groups (as mentioned above, carboxylate, sulfate or sulfonate), to study the effect of these two variables on the ability shown by these materials to retain chlorine-containing organic solvents from aqueous solutions; the selected contaminants were trichloroethylene (TCE), 1,1,2-trichloroethane (1,1,2-TCA) or trichloromethane (TCM).
In order to attain a complete characterization of the samples, several complementary experimental techniques were applied. Powder X-ray diffraction was applied to determine the crystalline phases existing in each sample and to detect the presence of amorphous components or impurities. Thermogravimetric analysis and differential thermal analysis were applied to determine the thermal stability of the samples, although it is well understood that they will never be used at high temperatures for organic anions retention. Fourier transform infrared spectroscopy was used to identify the anions existing in the interlayer of the solids. Nitrogen adsorption-desorption isotherms at 193 °C were measured to determine the specific surface area and pore size distribution, of outstanding importance to understand phenomena occurring at the surface of the particles; in this sense, laser dispersion was applied to determine the particle size distribution.

2. Materials and Methods

2.1. Preparation of Samples

All samples were synthesized by the co-precipitation method [16] under supersaturated conditions using sodium hydroxide (NaOH) as the precipitating agent. Chemicals and reagents were purchased from different producers with a minimum purity of 95% and were used without further purification; a complete list can be found in the Supplementary data section (Tables S1 and S2). Eight samples with intercalated organic anions were prepared, a sample containing carbonate in the interlayer was used as a reference sample.
To synthesize the samples, 1 M aqueous solutions of the metal cation nitrates were mixed in a Mg2+/Al3+ molar ratio of 3 and dropwise added, using a peristaltic pump (at a rate of 1 mL/min), to 100 mL of an aqueous solution containing the stoichiometric amount of the anion to be intercalated. Synthesizes were carried out at a pH of 9, which was maintained by adding the required amount of 1M NaOH using a Crison pH-burette 24. After completing the addition, the samples were aged in the parent solution for 24 h at room temperature under constant magnetic stirring. To avoid carbonation of the samples from atmospheric CO2, all solutions were prepared with decarbonated water, which was previously boiled and bubbled with nitrogen for several hours. Nitrogen atmosphere was maintained along all syntheses and ageing steps. The samples were then centrifuged and washed with decarbonated, distilled water. As preliminary studies revealed strong aggregation of the solids during drying, a portion of the slurry obtained was separated for particle size distribution analysis, whereas the remaining sample slurry was dried in an oven under ambient conditions at 40 °C for 24 h.
All synthesized samples were labeled as MgAl-X, where X stands for an abbreviation of the interlayer anion indicating the number of carbon atoms in the alkyl chain and the functional group; for instance, MgAl-11COO corresponds to the sample with intercalated dodecanoate. Samples, which were used for batch experiments, are henceforth called used samples. Those were labeled in the above described manner; a prefixed E indicates its state as an experimental sample, for example, E-MgAl-11COO corresponds to the used sample with intercalated dodecanoate.

2.2. Methods

To analyze the element chemical composition of synthesized as well as experimental samples, an inductively coupled plasma optical emission spectrometer (ICP-OES, Ciros Vision, Spectro) equipped with a semiconductor detector (CCD) was used. The instrument was calibrated with in-house standards (SEL-11, Spoi17). A portion of 20 mg of the sample was dissolved in 0.77 mL HNO3 (65%, Suprapur®, Merck, Darmstadt, Germany) and then filled up to 100 mL with ultrapure water (milliQ). Then, 2 mL of this solution were filtered using 0.2 µm pore size cellulose acetate membrane filters (Advantec®, Toyo Roshi Kaisha Ltd., Tokyo, Japan) and diluted with an additional 10 mL of the blank solution (ultrapure water with 0.5% HNO3). Measurements were carried out as two triplicates for each LDH-solution. Additional dilutions were carried out if necessary.
Crystalline phases were identified by powder X-ray diffraction (PXRD) using a D5000 X-ray diffractometer (Bruker, Billerica, MA, USA) with 2θ geometry equipped with 1200 W Ni-filtered copper X-ray anode (λ = 1.5406 Å/0.154 nm) in a range from 2–70° (2θ) and a step size of 0.05° (2θ) at a counting time of 1.5 s per step.
Thermogravimetric Analysis (TG) and Differential Thermal Analysis (DTA) curves were recorded parallel on a SDT Q600 (TA instruments), using γ-Al2O3, previously calcined overnight at 1200 °C in open air, as a reference material for the DTA measurements. All samples were heated up to 900 °C at a heating rate of 5° K/min under O2 flow (50 mL/min). The gases released during the heating process were simultaneously analyzed using a coupled mass spectrometer (MS, ThermoStar GSD 301 2, Pfeiffer Vacuum, Aßlar, Germany).
Fourier-transform infrared spectroscopy (FTIR) analysis was carried out using a FTIR Spectrometer (Spectrum Two, Perkin Elmer, Waltham, MA, USA) with Spectrum software. The KBr pellet method was used for the preparation of the samples. Measurements were carried out in the 4000–400 cm−1 range, averaging 20 scans to improve the signal-to-noise ratio, at a nominal resolution of 4 cm−1.
Particle size distribution of the synthesized samples was determined by laser diffraction (Mastersizer 2000, Malvern) with software provided by the manufacturer in guidance with ISO13320. The samples were dispersed in deionized water, stirred at 800 rpm and pumped (2050 rpm) to the measuring unit. There, the intensity of light scattered by particles in the dispersed sample is measured for red (He-Ne-laser, 632.8 nm) and blue (LED, 470 nm) wavelengths. This data is then analyzed to calculate the size of the particles that created the scattering pattern; all calculations are based on Frauenhofer and Mie theory [22,23]. Deagglomeration of the particles was attained by in situ ultrasonic treatment for 5, 10 or 15 min.
The specific surface area of the samples was assessed from the nitrogen adsorption-desorption isotherms at −196 °C in a Gemini VII 2390t apparatus (Micromeritics) previously calibrated with He. A portion of 0.1 g of each sample was pre-treated at 110 °C for 2 h under constant nitrogen flow (approx. 30 mL/min) in a sample degassing system (FlowPrep 060, Micromeritics) to remove adsorbed species. The specific surface area was determined based on the Brunauer-Emmett-Teller (BET) method [24].

2.3. Chlorinated Organic Solvents Retention—Batch Experiments

For each batch experiment, 1g of the dried LDH sample was dispersed by gentle stirring in 95 mL of deionized water. A final contaminant concentration of 4 mmol/L was set by adding the required volume of either trichloroethylene (TCE, 36 μL), 1,1,2-trichloroethane (TCA, 37 μL) or trichloromethane (TCM, 32 μL) using a Hamilton Microliter syringe. To enhance the miscibility of the chlorinated organic solvents with water, 5 mL ethanol were added to the solutions. Bottle necks were wrapped with Teflon tape and bottles (120 mL amber glass bottles, Sigma-Aldrich, Sigma-Aldrich, NI, USA) were securely closed using plastic caps with molded-in polytetrafluoroethylene (PTFE)-faced silicon septa (Sigma-Aldrich). To avoid the evaporation of the added chlorinated organic solvents, all bottles were stored upside down during the batch experiments. Constant agitation during the experiments was ensured by placing all bottles in an isothermal water bath (WNB 49, Memmert), coupled with an agitator (SV 49, Memmert) set at 105 strokes per minute.
After a reaction time of 30 days, all samples were filtered and the filter cake was stored on filtering paper in a desiccator for 2 days. A small portion of each experimental sample was then prepared for chemical analyses (see Section 2.2 ICP-OES analysis) whereas the main portion was securely stored until used for different characterization methods.

3. Results and Discussion

3.1. Characterization of Synthesized Material

Element chemical analysis data of Mg and Al for all samples are included in Table 1. Sodium and sulfur content are given for samples containing organic sulfates or sulfonates in the interlayer. The presence of sodium is not expected but it could be present in the samples if they have not been sufficiently washed after synthesis resulting in remaining sodium cations on the surface of the LDH crystallite. A similar effect could appear for alkyl sulfate or alkyl sulfonate species on the external surface of the LDHs. Hence, sulfur was analyzed to check for any deviations in sulfur content from the theoretical S:Al ratio of 1. Mg/Al and S/Al molar ratios for the samples, calculated from the element chemical analysis data, are also included in Table 1.
The Mg/Al molar ratio was close to 3, with a maximum deviation of 10% in all cases, which is within the range usually accepted to yield well-defined hydrotalcite-like structures [6]. In the case of sulfur-containing anions, the theoretical S/Al ratio is 1 if the monovalent organic anion is the only species in the interlayer to balance the positive charge of the Mg2+/Al3+ substituted main layer. A S/Al ratio of approximately 1 was calculated for the MgAl-8SO3 and MgAl-12SO3, despite having a slight sulfur defect in the former sample. On the contrary the S/Al molar ratio of the samples MgAl-18SO3 and MgAl-12SO4 is much higher than one. These two samples also contain appreciable amounts of sodium leading us to the assumption that there is a fraction of sodium sulfate or sulfonate (respectively, for samples MgAl-18SO3 and MgAl-12SO4) species adsorbed on the external surface of the crystallites, due to insufficient washing of the samples. The lack of match between the excess of sulfur and the amount of sodium can probably also be originated by residual amounts of sodium from the basic medium used to prepare the samples. Small amounts of sodium were also detected for some of the MgAl-COO samples.
Preliminary batch experiment tests on the organically modified LDHs showed that synthesized samples intercalated with organic anions having less than 10 carbon atoms in the alkyl chain are ineffective as retention materials. Consequently, the retention studies were limited to samples with more than ten carbon atoms in the alkyl chain of the organic interlayer anion. For systematic reasons, characterization was carried out on all synthesized samples.
The PXRD patterns of all synthetized samples are included in the Supplementary Materials Figures S1–S8; selected samples are shown in Figure 2. The diagrams for the fully recorded diffraction angle range are shown in the left hand side panel (a), while on the right side the 2–25° (2θ) range is shown for a clear identification of the diffraction by basal planes (b). All studied samples show diffraction patterns corresponding to layered materials. The pattern of MgAl-CO3, used as the reference sample, is typical for that of LDHs with intercalated carbonate [7,15].
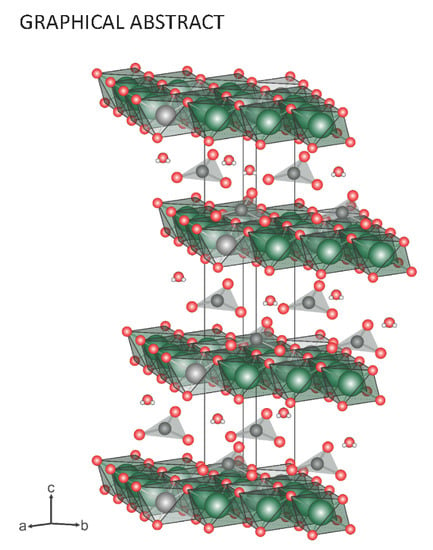
The first peak at 11.5° (2θ) (d = 7.7 Å) is due to the reflection of the (003) planes in the hydrotalcite-like structure with rhombohedral 3R stacking of the layers, for which the lattice parameter c corresponds to three times the spacing value for this reflection, c = 23.1 Å. The average distance between two neighbour cations in the brucite-like layers is given by lattice parameter a and can be calculated as twice the spacing of the diffraction maximum of the (110) planes, which correspond to the first peak of the doublet close to 60° (2θ); the a value for sample MgAl-CO3 is 3.1 Å. The second component of this doublet, a feature usually found in LDHs [25], is hardly visible for the organically modified samples. Lattice parameters a, c’ and c of all synthesized samples are given in Table 2.
The structural data of the carbonate-containing sample coincide with those reported in the literature [15]. As expected, insertion of organic anions in the interlayer leads to swelling of the layers, with an increase in parameter c. The largest swelling of the interlayer, by a factor of six compared to the reference sample MgAl-CO3 (7.7 Å), was detected in sample MgAl-17COO (47.7 Å). All values for the samples intercalated with organic anions agree with previously published data on LDHs with organic interlayer anions of similar length [10,25]. As expected, the height of the interlayer space increases with the length of the alkyl chain of the intercalated organic anion, confirming that these anions are not located parallel to the brucite-like layers but somewhat tilted. This free height was calculated assuming a width of 4.8 Å for the brucite-like layers [6,10,11,18] and adding the contour chain length, the distance between the ends of the organic molecule assuming it is streched out, of the organic molecule. Calculated contour chain lengths of all studied organic anions as well as their tilt angle can be found in Table S3 (Supplementary Materials). As mentioned in literature [10,11,18,26] organic molecules can be present in the interlayer of an LDH in three different ways—simple intercalation, interdigitated intercalation or as a double interlayer. In addition to that it has been reported that the organic chains can be tilted with respect to the perpendicular of the layers.
For sample MgAl-5COO the organic anions seem to be minimal tilted with respect to the perpendicular of the main layer; there is only an increase of less than 1 Å in the free height of the interlayer space with respect to the reference sample, while the molecule contains a (C11H23) chain in addition to the functional group. This leads to the assumption that both organic molecules are interdigitatedly intercalated. However, when the length of the chain increases the formation of tilted bilayers becomes more likely, as it seems to be formed for samples MgAl-11COO and MgAl-17COO. A bilayer seems also to exist for samples MgAl-12SO3 and MgAl-12SO4, while perpendicular single bilayers are formed for samples MgAl-8SO3 and MgAl-18SO3 [11,12,26]. In addition to the diffraction maxima typical of the hydrotalcite-like structure, sample MgAl-17COO showed weak extra peaks due to the presence of minor impurities of sodium nitrate, indicating an insufficient washing process for these samples; nevertheless, the presence of this impurity does not affect the capacity of these material for retention of chlorinated solvents.
The thermal decomposition of the solids prepared was studied by TG-DTA; the nature of the gases evolved was determined by MS. The curves for sample MgAl-CO3 are included in the Supplementary Materials section (Figure S9) and they show the expected mass losses [27,28]. A first mass loss up to ca. 200 °C, amounting in 15.49% of the initial sample mass, corresponds to removal of water from the interlayer or physisorbed on the external surface of the LDHs. This mass loss takes place in the same temperature range where a medium intensity endothermic peak is recorded in the DTA diagram. Quantitative analysis from the TG curves for all samples are summarized in Table 3.
A very weak peak is recorded in the MS spectra for the mass-to-charge-ratio (m/z) of 44 corresponding to CO2+. This derives from externally adsorbed carbonate species, formed by adsorption of atmospheric CO2 onto the strongly basic surface of the solid. A second mass loss is recorded up to ca. 400 °C, which corresponds to the removal of water through condensation of hydroxyl groups and of CO2, from decomposition of interlayer carbonate species. Both processes show two peaks in their MS spectra indicating a stepwise process with several reactions involved, as also concluded from the DTA curve. This agrees with results reported by Stanimirova et al. [29]. The whole decomposition process ends around 600 °C.
The curves for sample MgAl-5COO are included in Figure 3; those for all MgAl-XCOO samples are rather similar (See Supplementary Materials section, Figures S10–S14).
For sample MgAl-5COO a first mass loss is recorded up to ca. 200 °C; but no signal at m/z = 18 (H2O+) was recorded in the MS data. Comparing the TG curves for samples MgAl-CO3 and MgAl-5COO (as well as all other MgAl-XCOO samples) in this temperature range, it can be observed that the TG curve slope for sample MgAl-CO3 is clearly larger than for the other samples, suggesting that in the case of sample MgAl-CO3 removal of water takes place rather suddenly in a narrower temperature range. If this is the case, the more gradual water elimination on the MgAl-XCOO samples would give rise to a much weaker and broader signal in the MS curve, being thus not clearly detected. For the MgAl-XCOO samples the mass loss percentage in this temperature range is lower than that for sample MgAl-CO3, as expected due to the larger contribution of the organic anion than carbonate to the mass of the solid; it is ca. 11% of the initial mass loss for all samples. Then, an important mass loss, amounting to up to 60% of the initial mass (sample MgAl-17COO, Figure S12) is recorded in all cases; it should correspond to removal of the anion as water vapor and carbon dioxide through combustion of the organic anion, together with water released upon condensation of hydroxyl groups from the brucite-like layers. A very strong and sharp exothermic effect is recorded in all cases around 300 °C, probably due to the formation of CO2. Compared with the MS data, it is evident that the maximum CO2 evolution (signal at m/z = 44, CO2+) is precisely recorded at this temperature; slightly above this temperature, a minor amount of CO2 is also evolved, probably occluded within the channels and the pores of the solid. As expected, a signal at m/z = 18 (H2O+) is recorded in this temperature range, also very close to 300 °C, thus definitively confirming that the combustion process evolves CO2 and H2O.
For the MgAl-XSO3 samples we have additionally monitored the presence of SO2 during the mass spectrometry analysis of the released gases. Figure 4 exemplarily includes that for sample MgAl-8SO3, while those for the other sulfonate samples are included in the Supplementary Materials Section, Figures S13 and S14. A first mass loss occurs up to ca. 200 °C, probably due to removal of molecular water; although, as for the MgAl-XCOO samples, the signal at m/z = 18 (H2O+) is not recorded in the MS curves, probably because of the reason given above. Increasing temperature leads to an intense mass loss up to ca. 700 °C.
The second mass loss between 300–700 °C is due, according to the MS data, to removal of interlayer hydroxyl groups as water, combustion of the organic as water vapour and CO2. There is also a contribution due to the evolution of SO2. The relative intensity of the SO2 signal is extremely weak for sample MgAl-12SO3 but we have not found a reliable explanation for this result. However, it should be noticed that in this case the MS signal due to CO2 shows a shoulder at the high temperature side of the maximum, clearly noticeable for samples MgAl-8SO3 and MgAl-12SO3 and only recorded as an asymmetry for sample MgAl-18SO3; a second CO2 signal is recorded at 600–650 °C, a temperature range where a strong signal due to SO2 is also recorded, with small mass losses well. These results strongly suggest that decomposition of the alkyl sulfonates takes place in, at least, two steps, one around 300 °C, where most of the corresponding mass is lost and a second one at 600–650 °C, where residual species are probably removed. In all cases, the mass is constant from ca. 700 to 900 °C.
The thermal decomposition of sample MgAl-12SO4 is shown in Figure 5. Results are rather different to those above reported for the MgAl-XSO3 samples—The first mass loss, probably due to water release up to 200 °C, represents a very small percentage of the original sample mass and a strong exothermic effect is recorded, as in the MgAl-XSO3 samples, around 300 °C, for which release of water, CO2 and SO2 has been observed. However, no high temperature mass loss, nor high temperature evolution of gases or water vapor is recorded, contrary to what has been observed for the similar sample MgAl-12SO3 but the release of water and CO2 is observed at the high temperature side of the strongest MS signals. This means that, in this case, SO2 is released rather easily together with fragments of the organic chain, but leaving behind some other organic fragments, so combustion would be responsible for the shoulders recorded in the MS signals at m/z = 18 (H2O+) and 44 (CO2+).
The formula of the compounds prepared are given in Table 4. The content of magnesium and aluminium have been calculated based on element chemical analysis (see raw data in Table 1), the content of the anion has been determined assuming that it is the only responsible to balance the positive charge of the layers due to the presence of Al3+ cations and the water content in the interlayer has been calculated from the TG curves.
Altogether, we can conclude that the samples prepared, whichever the interlayer anion, have a similar thermal stability behavior, releasing water at low temperature and decomposing upon burning at around 300 °C. For the sulfonate (MgAl-XSO3) samples, a second decomposition effect is recorded around 600–650 °C. It should be mentioned that intercalation of the organic anions will provide more hydrophobic properties to the interlayer region, hence we would expect a lower interlayer molecular content in these samples than in the carbonate-one. Looking at the formula of the compounds (Table 4) it seems that the water content follows a rather random behavior. This might not be surprising if we accept that, although the more hydrophobic nature of the interlayer is expected to decrease the water content, as a result of the intercalation of these long-chain anions swelling the structure gives rise to more room in the interlayer, thus providing more space to accommodate water molecules. Probably both effects, together with minor differences in the drying processes, would account for the interlayer molecular water molecules number values calculated for each sample.
The Fourier transform infrared (FTIR) spectra of the studied materials show absorption bands due to the hydroxyl groups and water molecules, the interlayer anions and lattice vibrations within the layers. The spectrum for the reference sample is well known and throughly described by various authors [30,31,32,33,34,35]. The FTIR spectra of the reference sample and the most effective organo-LDHs are shown in Figure 6 (see supplementary data for spectra of all samples, Figures S15–S23). All studied samples show absorption bands characteristic of LDHs, which can be assigned to vibrations of the multiatomic species existing in the main layer and in the interlayer region.
In all cases, a broad absorption band is recorded between ca. 3800–3000 cm−1, which corresponds to the stretching mode of hydroxyl groups, both from the brucite-like layers and from the interlayer water molecules. The medium intensity absorption band close to 1650–1600 cm−1 corresponds to the bending mode of water molecules. The bands below 700 cm−1 correspond to metal-hydroxyl vibrations. All other bands recorded are due to the interlayer anion.
The shoulder at ca. 2930 cm−1 in the spectrum of sample MgAl-CO3 is due to the stretching mode of hydroxyl groups hydrogen-bonded to interlayer carbonate anions [30,33]. The sharp, very intense band at 1369 cm−1 is due to mode ν3 of interlayer carbonate anions. There is a sharp band overlapped to that one, recorded at 1384 cm−1, which is due to the ν3 mode of a nitrate impurity. Other carbonate bands are recorded at 865 cm−12) and 663 cm−14); it is worth noting that the band due to mode ν1, expected around 1070 cm−1, is not recorded. This band is forbidden in the IR spectrum for carbonate in a D3h geometry, indicating that no distortion of the carbonate structure exists upon its intercalation in the interlayer.
The spectra for the organically modified samples are rather different, although absorption bands corresponding to the brucite-like layers of the LDH are recorded at almost the same positions; the shift sometimes observed for the very broad absorption band in the 3500–3300 cm−1 is due to the different hydration degree of the samples. In addition, the sharp absorption at 1384 cm−1 of the nitrate impurity is recorded in most of the cases. Bands due to the organic components of the samples are usually sharp ones. Several bands due to the organic chain are also recorded below ca. 1500 cm−1. The three sets of samples (carboxylate, sulfonate and sulfate) can be identified by the characteristic bands of these functional groups. Carboxylate is characterized by two bands at ca. 1570 and 1470 cm−1, due to the antisymmetric and symmetric, respectively, vibration modes of the carboxylate group. The sulfonate group is mostly characterized by the very intense and sharp bands at 1180 cm−1 and 1050 cm−1 due to the antisymmetric and symmetric modes of the SO2 group, and, finally, the sulfate group is characterized by the bands at 1221 cm−1 and 1065 cm−1 (Supplementary Materials, Tables S4–S6).
The evaluation of the FTIR spectra confirms the presence of the organic anions in our samples and the lack (or very low intensity) of the carbonate-related bands confirms, together with the PXRD results discussed above, the insertion of the organic anions in the interlayer. The precise positions of the bands in all spectra recorded are given in Tables S4–S6 (Supplementary Materials).
The particle size distribution was measured for selected samples and significant differences were found among the dried samples and those kept in a slurry after preparation. Nevertheless, some degree of aggregation was observed in all cases and, for that reason, the samples were treated with ultrasound for 5, 10 and 15 min. All the diagrams are included in the Supplementary Materials Section, Figures S24–S37.
Within the dried carboxylate samples, the observed behavior was almost the same in all cases. The size extended in the 1–1000 μm range, with a maximum close to 300 μm; above this value, the curve decreased sharply but on the smaller particle size the decrease of the curve was more steadily and several shoulders seemed to exist. Application of ultrasounds up to 15 min gave raise to curves where the shoulders were more marked, such an effect being more evident as the length of the organic chain of the interlayer anion was increased. So, while for sample MgAl-5COO the intensity of the maximum somewhat decreased and weaker maxima at ca. 30 and 2 μm developed, some differences were found for sample MgAl-17COO, where the maximum for the untreated sample was recorded at ca. 100 μm, with a shoulder at ca. 300 μm; when the sample was submitted to ultrasound the maximum was now recorded at ca. 40 μm, with shoulders at 300 and 10 μm. A similar behavior was observed for the MgAl-XSO3 samples—no major differences were observed for sample MgAl-8SO3 as it was treated under ultrasound, with a maximum at 300 μm which intensity did not change upon ultrasound application, a treatment which gave rise to a weak but detectable, shoulder at ca. 70 μm. On the contrary, sample MgAl-18SO3 showed a maximum at ca. 300 μm which rapidly disappeared even after only 5 min ultrasound, the curve being now dominated by a main peak at ca. 30 μm, with minor shoulders at ca. 8 and 300 μm. According to the element chemical analysis results, see Table 1, this sample contains an appreciable amount of sodium sulfonate adsorbed on its external surface and this might be the origin of its easy deaggregation. Sample MgAl-12SO4 also shows a peak at ca. 300 μm which does not shift after ultrasound treatment, while a new shoulder at around 80 μm develops.
Concerning the samples that were kept in a slurry after preparation, their particle size distribution curves (Figures S33–S37 in the Supplementary Materials section) were rather different. First, the maxima in the curves for the original samples (not treated under ultrasound) were always at a lower value than those for the corresponding dried samples, confirming that drying enhances agglomeration. Within a given series, as the length of the organic chain was increased, deagglomeration was less marked. For sample MgAl-11COO the maximum was recorded at 5 μm, with a second, weaker one at 50 μm; upon ultrasound treatment three peaks were recorded at 350 μm, 70 μm and 10 μm, showing that agglomeration takes place. It is possible that ultrasound energy in some sort of way helps to agglomerate very small particles which are released during the treatment. On the contrary, sample MgAl-17COO showed an intense maximum at ca 50 μm, with a shoulder at 3 μm but upon ultrasound treatment only a shift towards lower values (25 μm) of the absolute maximum was observed. For the sulfonate samples also some differences could be observed as the length of the organic chain was changed. A bimodal particle size distribution with a double peak at 12 and 50 μm for the untreated sample MgAl-12SO3 was converted into a monomodal particle size distribution with a maximum around 10 μm. No change being further observed as the time of ultrasound treatment was extended. Sample MgAl-18SO3 showed a single maximum at 30 μm, with a medium intensity shoulder at 150 μm, being transformed to a single peak again at 30 μm and development of a weak peak at 900–1000 μm upon ultrasonic treatment. No change in the particle size distribution upon ultrasound treatment was observed for sample MgAl-12SO4, showing a monomodal particle size distribution with a maximum at 5 μm, probably due to the presence of sodium sulfate on its surface.
It can be concluded that drying of the samples gives rise to agglomeration of the particles and that such an agglomeration is less intense if the samples are kept in a slurry. This finding might be relevant concerning a probable usage of organically modified LDHs in remediation strategies adressing retention of chlorinated organic solvents. The samples seem to behave randomly concerning the change in the particle size distribution, as no clear relationship between the functional group (−COO, −SO3, −O-SO3) could be found, nor with the length of the organic chain. The d(0.9) values for all samples are included in Table 5.
Adsorption-desorption studies of N2 adsorption at −196 °C were conducted to determine the specific surface areas of the dried samples, as well as their surface texture. The isotherms are included in the Supplementary Materials Section (Figures S38–S46) and the values determined for the BET specific surface areas are given in Table 5. The reference sample MgAl-CO3 shows a value close to 100 m2/g, typical of carbonate-containing hydrotalcites which had been submitted to treatments as that for our sample [31]. The isotherm corresponds to type II in the International Union of Pure and Applied Chemistry (IUPAC) classification [36], due to adsorption on non-porous or macroporous surfaces, with unrestricted monolayer-multilayer adsorption [37]. A hysteresis loop is also recorded, its shape corresponds to type H3, typical for adsorbents formed by rigid aggregates of plate-like particles giving rise to slit-shaped pores [36,37]. The organically modified samples show clearly lower specific surface area values but no relationship seems to exist between the specific surface area and the chain of the organic anion; even the shape of the hysteresis loop does not follow any specific trend with the chain length. All four carboxylate samples show, as sample MgAl-CO3, type II isotherms, due to adsorption on non-porous or microporous solids. While for sample MgAl-11-COO the narrow hysteresis loop corresponds to type H3, due to adsorption on aggregates of plate-like particles forming slit-shaped pores, those for the other three samples of this series are markedly broader, approaching to type H2, typical for disordered materials with ill-defined distribution of shape and size of the pores. A similar behavior is observed for the sulfonate containing samples MgAl-XSO3. There, the isotherm for sample MgAl-8SO3 shows a type H3 hysteresis, while those for samples MgAl-7SO3 and MgAl-18SO3 are very narrow (actually, almost absent for the last sample), corresponding to type II. This last behavior is also observed for sample MgAl-12SO4. These findings suggest that the surface texture of the samples is probably a result of slight differences in the drying process, which can strength aggregation of the primary particles. Obviously, no measurements of this type were performed on samples, which were kept in slurry.

3.2. Retention Experiments

Results of the chemical analysis of the used samples are given in Table 6. All used samples turned out to be especially effective retaining 1,1,2-TCA and TCM from aqueous solutions with 1,1,2-TCA being the most preferred contaminant.
Trichloroethylene (TCE) proved to be the least retained contaminant by any investigated organically modified LDH. Highest amounts of 1,1,2-TCA were adsorbed by sample E-MgAl-17COO (73.7%) followed by E-MgAl-18SO3 (53.8%) and E-MgAl-11COO (19.4%). The sample with intercalated octadecane sulfonate turned out to be most efficient retaining TCM from aqueous solutions followed by carboxylate-LDHs. Unexpectedly, the LDH with intercalated dodecyl sulfate proved to be the least effective sample within this study. Several previous studies described this kind of sample as especially effective adsorbing chlorinated organic solvents from aqueous solutions [12,38,39,40]; differences probably arising from different experimental conditions used during the batch experiments. As the adsorption of 1,1,2-TCA was favored by the studied LDHs, further characterization of the experimental samples was exclusively carried out on these.
Powder X-ray diffraction patterns of experimental samples are included in the Supplementary Materials Section (Figures S47–S50). All experimental samples show diffraction patterns typical for layered materials and peak position, height and width are in mutual agreement with those of the corresponding synthesized samples. Lattice parameters, given in Table 7, of the experimental samples agree with the corresponding synthesized samples. It can be assumed that no structural changes occurred during the experiments. This confirms our assumption that the studied contaminants are solely adsorbed without influencing the main layer of the LDHs or increasing their interlayer space.
Results of thermal analyses coupled with mass spectrometry of sample E-MgAl-17COO are given in Figure 7, those for other used samples are included in the Supplementary Materials Section (Figures S51–S53). All studied experimental samples show a first mass loss until 100 °C and a second between 200–300 °C. LDHs with intercalated sulfur containing anions exclusively reveal a third mass loss at 600 °C.
The first mass loss is due to the loss of adsorbed water on the surface of the samples as they were measured without prior drying. Mass spectrometry data of the second mass at around 200–300 °C loss event reveal that water, carbon dioxide and chlorine are released simultaneously upon increasing temperatures. The release of carbon dioxide is due to the combustion of the alkyl chain of the intercalated organic anion. As the release of chlorine occurs simultaneously to that of CO2, thus it can be proposed that the adsorbed 1,1,2-TCA is attached to the alkyl chain of the anion and exclusively released upon its decomposition. For samples containing alkyl sulfonates or sulfates in the interlayer, the release of a portion of SO2 indicates the beginning decomposition of the functional group. Nevertheless, the main portion of SO2 is released during the third mass loss around 600 °C, surprisingly together with a portion of Cl2. These findings lead to two assumptions—a) the functional group is basically stable until around 600 °C although small parts of it may already decompose at lower temperatures and b) for samples with intercalated sulfur containing organic anions the chlorine, solely coming from adsorbed chlorinated organic solvents, is not only attached to the alkyl chain but additionally somehow to the functional group. As the functional group is bonded to the main layer of the LDH, the release of the chlorine gas at the third event at around 600 °C corresponds to the thermal decomposition of the functional group and the beginning thermal decomposition of the main layer, built up by Mg(OH)2 and Al(OH)3 groups.
FTIR measurements were carried out on the dried (in a desiccator over calcium chloride) reacted samples. A spectrum of the pure contaminant was recorded to compare its characteristic bonds with those occurring in the reacted samples (see Figure S58 in Supplementary Materials Section). Despite the relatively high absorption of 1,1,2-TCA in the samples no corresponding adsorption bands could be determined in any of the spectra of the used samples. See Supplementary Materials Section, Figures S54–S57, for all FTIR spectra of the used samples.

4. Conclusions

Generally speaking, the PXRD measurements carried out confirm results from previous studies [13,25,26] regarding the increase of the interlayer space due to the intercalation of long-chain organic anions and their orientation within the LDHs. Increasing the interlayer spacing by a factor of 4–6 facilitates the adsorption of the studied contaminants; samples MgAl-17COO and MgAl-18SO3 proved to be the most efficient ones within this study. The evaluation of the FTIR spectra verifies the presence of the organic anions in our samples; the presence of low intensity carbonate-related bands additionally confirms the insertion of the organic anions in the interlayer as carbonate anions in the interlayer would inhibit the intercalation of any other anion. Results on the particle size distribution of dried and undried samples show that the size of the LDHs can easily be tuned via different drying processes. Considering the probable usage of the studied LDHs as adsorbents in remediation strategies, a tunable particle size might increase their area of applications.
Results of the batch experiments using the different organically modified LDHs confirm that the decreasing hydrophilicity of the interlayer and its swelling due to the intercalation of long-chain organic anions enhances the retention ability of the studied LDHs. Based on the results here reported we propose that the chain length of the intercalated organic anion defines the effectiveness of the LDH; results indicate a proportional relation. Especially long-chain carboxylate and sulfonate intercalated LDHs are good adsorbents for trichloromethane and 1,1,2-trichloroethane and could be useful to immobilize these contaminants in aqueous environments. The thermal stability of the used samples indicates that the adsorbed chlorinated organic solvents are immobilized until the alkyl chain of the intercalated anion begins to burn. This limits the probable usability of the studied materials to a maximum temperature of around 150 °C.
To fully understand the role of the functional group of the intercalated organic anion towards the adsorption of chlorinated organic solvents, further systematic studies need to be carried out. The usage of high-resolution techniques, capable of investigating the environment of the functional group and that of the adsorbed chlorinated organic solvents, might be considered.

Supplementary Materials

The following are available online at https://www.mdpi.com/2305-7084/3/4/89/s1, Figure S1: Powder X-ray diffraction pattern of the sample MgAl-5COO; Figure S2: Powder X-ray diffraction pattern of the sample MgAl-7COO; Figure S3: Powder X-ray diffraction pattern of the sample MgAl-11COO; Figure S4: Powder X-ray diffraction pattern of the sample MgAl-17COO; Figure S5: Powder X-ray diffraction pattern of the sample MgAl-8SO3; Figure S6: Powder X-ray diffraction pattern of the sample MgAl-12SO3; Figure S7: Powder X-ray diffraction pattern of the sample MgAl-18SO3; Figure S8: Powder X-ray diffraction pattern of the sample MgAl-12SO4; Figure S9: TG-DTA-MS analysis of the reference sample MgAl-CO3; Figure S10: TG-DTA-MS analysis of the sample MgAl-7COO; Figure S11: TG-DTA-MS analysis of the sample MgAl-11COO; Figure S12: TG-DTA-MS analysis of the sample MgAl-17COO; Figure S13: TG-DTA-MS analysis of the sample MgAl-12SO3; Figure S14: TG-DTA-MS analysis of the sample MgAl-18SO3; Figure S15: FTIR spectrum of sample MgAl-CO3; Figure S16: FTIR spectrum of sample MgAl-5COO; Figure S17: FTIR spectrum of sample MgAl-7COO; Figure S18: FTIR spectrum of sample MgAl-11COO; Figure S19: FTIR spectrum of sample MgAl-17COO; Figure S20: FTIR spectrum of sample MgAl-8SO3; Figure S21: FTIR spectrum of sample MgAl-12SO3; Figure S22: FTIR spectrum of sample MgAl-18SO3; Figure S23: FTIR spectrum of sample MgAl-12SO4; Figure S24: Particle size distribution of the dried reference sample MgAl-CO3; Figure S25: Particle size distribution of the dried sample MgAl-5COO; Figure S26: Particle size distribution of the dried sample MgAl-7COO; Figure S27: Particle size distribution of the dried sample MgAl-11COO; Figure S28: Particle size distribution of the dried sample MgAl-17COO; Figure S29: Particle size distribution of the dried sample MgAl-8SO3; Figure S30: Particle size distribution of the dried sample MgAl-12SO3; Figure S31: Particle size distribution of the dried sample MgAl-18SO3; Figure S32: Particle size distribution of the dried sample MgAl-12SO4; Figure S33: Particle size distribution of the wet sample MgAl-11COO; Figure S34: Particle size distribution of the wet sample MgAl-17COO; Figure S35: Particle size distribution of the wet sample MgAl-12SO3; Figure S36: Particle size distribution of the wet sample MgAl-18SO3; Figure S37: Particle size distribution of the wet sample MgAl-12SO4; Figure S38: N2 adsorption-desorption isotherm of the refence sample MgAl-CO3; Figure S39: N2 adsorption-desorption isotherm of sample MgAl-5COO; Figure S40: N2 adsorption-desorption isotherm of sample MgAl-7COO; Figure S41: N2 adsorption-desorption isotherm of sample MgAl-11COO; Figure S42: N2 adsorption-desorption isotherm of sample MgAl-17COO; Figure S43: N2 adsorption-desorption isotherm of sample MgAl-8SO3; Figure S44: N2 adsorption-desorption isotherm of sample MgAl-12SO3; Figure S45: N2 adsorption-desorption isotherm of sample MgAl-18SO3; Figure S46: N2 adsorption-desorption isotherm of sample MgAl-12SO4; Figure S47: Powder X-ray diffraction pattern of sample E-MgAl-11COO after a batch experiment with 1,1,2-TCA; Figure S48: Powder X-ray diffraction pattern of sample E-MgAl-17COO after a batch experiment with 1,1,2-TCA; Figure S49: Powder X-ray diffraction pattern of sample E-MgAl-18SO3 after a batch experiment with 1,1,2-TCA; Figure S50: Powder X-ray diffraction pattern of the reference sample E-MgAl-12SO4 after a batch experiment with 1,1,2-TCA; Figure S51: TG-DTA-MS analysis of sample E-MgAl-11COO after a batch experiment with 1,1,2-TCA; Figure S52: TG-DTA-MS analysis of sample E-MgAl-18SO3 after a batch experiment with 1,1,2-TCA; Figure S53: TG-DTA-MS analysis of sample E-MgAl-12SO4 after a batch experiment with 1,1,2-TCA; Figure S54: FTIR spectrum of sample E-MgAl-11COO after a batch experiment with 1,1,2-TCA; Figure S55: FTIR spectrum of sample E-MgAl-17COO after a batch experiment with 1,1,2-TCA; Figure S56: FTIR spectrum of sample E-MgAl-18SO3 after a batch experiment with 1,1,2-TCA; Figure S57: FTIR spectrum of sample E-MgAl-12SO4 after a batch experiment with 1,1,2-TCA; S58: FTIR spectrum of 1,1,2-TCA; Table S1: List of the chemicals used within this study; Table S2: List of other lab material usedwithin this study; Table S3: band positions in the FTIR spectra of the reference sample MgAl-CO3 and MgAl-12SO4 with corresponding assignments; Table S4: band positions in the FTIR spectra of the MgAl-xCOO samples with corresponding assignments; Table S5: band positions in the FTIR spectra of the MgAl-xSO3 samples with corresponding assignments.

Author Contributions

Conceptualization, K.M.D. and V.R.; methodology, K.M.D. and V.R.; formal analysis, K.M.D. and T.L.; investigation, K.M.D.; resources, V.R.; data curation, K.M.D. and V.R.; writing—original draft preparation, K.M.D.; writing—review and editing, T.L., R.T. and V.R.; visualization, K.M.D.; supervision, V.R.; project administration, V.R.; funding acquisition, V.R.

Funding

This study is part of the project Metal-Aid, which has received funding from the European Union’s Horizon 2020 research and innovation program under the Marie Skłodowska-Curie grant agreement No. 675219. See http://metal-aid.eu/.

Conflicts of Interest

The authors declare no conflict of interest.

References

  1. Evans, D.G.; Slade, R.C.T. Structural Aspects of Layered Double Hydroxides. In Layered Double Hydroxides (Structure and Bonding); Duan, X., Evans, D.G., Eds.; Springer: Berlin/Heidelberg, Germany, 2005; Volume 119, pp. 1–87. [Google Scholar]
  2. Pöllmann, H. Immobilisierung von Schadstoffen Durch Speichermineralbildung (Berichte aus der Geowissenschaft); Shaker: Aachen, Germany, 2007; ISBN 978-3-8322-6377-5. [Google Scholar]
  3. Chaara, D.; Bruna, F.; Ulibarri, M.A.; Draoui, K.; Barriga, C.; Pavlovic, I. Organo/layered double hydroxide nanohybrids used to remove non ionic pesticides. J. Hazard. Mater. 2011, 196, 350–359. [Google Scholar] [CrossRef] [PubMed]
  4. Deng, L.; Zeng, H.; Shi, Z.; Zhang, W.; Luo, J. Sodium dodecyl sulfate intercalated and acrylamide anchored layered double hydroxides: A multifunctional adsorbent for highly efficient removal of Congo red. J. Colloid Interface Sci. 2018, 521, 172–182. [Google Scholar] [CrossRef] [PubMed]
  5. Bookin, A.S.; Drits, V.A. Polytype diversity of the hydrotalcite-like minerals—I. Possible polytypes and their diffraction features. Clays Clay Min. 1993, 41, 551–557. [Google Scholar] [CrossRef]
  6. De Roy, A.; Forano, C.; Besse, J.P. Layered Double Hydroxides: Synthesis and Post-Synthesis Modification. In Layered Double Hydroxides: Present and Future; Rives, V., Ed.; Nova Science Publishers: New York, NY, USA, 2001; pp. 1–39. ISBN 978-61209-289-8. [Google Scholar]
  7. Mills, S.J.; Christy, A.G.; Génin, J.-M.R.; Kameda, T.; Colombo, F. Nomenclature of the hydrotalcite supergroup: Natural layered double hydroxides. Mineral. Mag. 2012, 76, 1289–1336. [Google Scholar] [CrossRef]
  8. Rives, V.; Ulibarri, M.A. Layered Double Hydroxides (LDH) intercalated with metal coordination compounds and oxometalates. Coord. Chem. Rev. 1999, 181, 61–120. [Google Scholar] [CrossRef]
  9. Taviot-Guého, C.; Leroux, F. In Situ Polymerization and Intercalation of Polymers in Layered Double Hydroxides. In Layered Double Hydroxides (Structure and Bonding); Duan, X., Evans, D.G., Eds.; Springer: Berlin/Heidelberg, Germany, 2005; Volume 119, pp. 121–159. [Google Scholar] [CrossRef]
  10. Meyn, M.; Beneke, K.; Lagaly, G. Anion-exchange reactions of layered double hydroxides. Inorg. Chem. 1990, 29, 5201–5207. [Google Scholar] [CrossRef]
  11. Kopka, H.; Beneke, K.; Lagaly, G. Anionic surfactants between double metal hydroxide layers. Colloid Interface Sci. 1988, 123, 427–436. [Google Scholar] [CrossRef]
  12. You, Y.; Zhao, H.; Vance, G.F. Surfactant-enhanced adsorption of organic compounds by layered double hydroxides. Colloid Surf. A Physicochem. Eng. Asp. 2002, 205, 161–172. [Google Scholar] [CrossRef]
  13. Greenwell, H.C.; Jones, W.; Rugen-Hankey, S.L.; Holliman, P.J.; Thompson, R.L. Efficient synthesis of ordered organo-layered double hydroxides. Green Chem. 2010, 12, 688–695. [Google Scholar] [CrossRef]
  14. Ulibarri, M.A.; Labajos, F.M.; Rives, V.; Kagunya, W.; Jones, W.; Trujillano, R. Effect of Intermediates on the Nature of Polyvanadate-Intercalated Layered Double Hydroxides. Mol. Cryst. Liq. Cryst. Sci. Technol. Sect. A Mol. Cryst. Liq. Cryst. 1994, 244, 167–172. [Google Scholar] [CrossRef]
  15. Allmann, R.; Jepsen, H.P. Die Struktur des Hydrotalkits. Neues Jahrb. Für Mineral. Mon. 1969, 1969, 544–551. [Google Scholar]
  16. Miyata, S.; Okada, A. Synthesis of Hydrotalcite-Like Compounds and their Physico-Chemical Properties—The Systems Mg2+-Al3+-SO42− and Mg2+-Al3+-CrO42−. Clay Clay Min. 1977, 25, 14–18. [Google Scholar] [CrossRef]
  17. He, J.; Wie, M.; Li, B.; Kang, Y.; Evans, D.G.; Duan, X. Preparation of Layered Double Hydroxides. In Layered Double Hydroxides (Structure and Bonding); Duan, X., Evans, D.G., Eds.; Springer: Berlin/Heidelberg, Germany, 2005; Volume 119, pp. 121–159. [Google Scholar]
  18. Conterosito, E.; Croce, G.; Palin, L.; Pagano, C.; Perioli, L.; Viterbo, D.; Boccaleri, E.; Paul, G.; Milanesio, M. Structural characterization and thermal and chemical stability of bioactive molecule-hydrotalcite (LDH) nanocomposites. Phys. Chem. Phys. Chem. 2013, 15, 13418–13433. [Google Scholar] [CrossRef] [PubMed]
  19. Toson, V.; Conterosito, E.; Palin, L.; Boccaleri, E.; Milanesio, M.; Gianotti, V. Facile Intercalation of Organic Molecules into Hydrotalcites by Liquid-Assisted Grinding: Yield Optimization by a Chemometric Approach. Cryst. Growth Des. 2015, 15, 5368–5374. [Google Scholar] [CrossRef]
  20. Conterosito, E.; Milanesio, M.; Palin, L.; Gianotti, V. Rationalization of liquid assisted grinding intercalation yields of organic molecules into layered double hydroxides my multivariate analysis. RSC Adv. 2016, 6, 108431–108439. [Google Scholar] [CrossRef]
  21. Palin, L.; Milanesio, M.; van Beek, W.; Conterosito, E. Understanding the Ion Exchange Process in LDH Nanomaterials by Fast In Situ XRPD and PCA-Assisted Kinetic Analysis. J. Nanomater. 2019, 2019, 4612493. [Google Scholar] [CrossRef]
  22. Xu, R. Particle Characterization: Light Scattering Method (Particle Technology Series); Springer: Haarlem, The Netherlands, 2002; Volume 13, pp. 11–181. [Google Scholar] [CrossRef]
  23. Rawle, A.; Kippax, P. Setting New Standards for Laser Diffraction Particle Size Analysis (Technical Article) 2010. Available online: http://www.analyticjournal.de/downloads_fachreport/malvern_iso13320_laser_rawle_%20kippax.pdf (accessed on 6 November 2019).
  24. Brunauer, S.; Emmett, P.H.; Teller, E. Adsorption of Gases in Multimolecular Layers. J. Am. Chem. Soc. 1938, 60, 309–319. [Google Scholar] [CrossRef]
  25. Newman, S.P.; Jones, W. Synthesis, characterization and applications of layered double hydroxides containing organic guests. New J. Chem. 1998, 22, 105–115. [Google Scholar] [CrossRef]
  26. Meyn, M.; Beneke, K.; Lagaly, G. Anion-exchange reactions of hydroxy double salts. Inorg. Chem. 1993, 32, 1209–1215. [Google Scholar] [CrossRef]
  27. Rives, V. Study of Layered Double Hydroxides by Thermal Methods. In Layered Double Hydroxides: Present and Future; Rives, V., Ed.; Nova Science Publishers: New York, NY, USA, 2001; pp. 127–151. ISBN 978-61209-289-8. [Google Scholar]
  28. Rives, V. Comment on “Direct observation of Metastable Solid Phase of Mg/Al/CO3-Layered Double Hydroxide by Means of High Temperature in Situ Powder XRD and DTA/TG. Inorg. Chem. 1999, 38, 406–407. [Google Scholar] [CrossRef]
  29. Stanimirova, T.S.; Vergilov, I.; Kirov, G.; Petrova, N. Thermal decomposition products of hydrotalcite-like compounds: Low-temperature metaphases. J. Mater. Sci. 1999, 34, 4153–4161. [Google Scholar] [CrossRef]
  30. Hernandez-Moreno, M.J.; Ulibarri, M.A.; Rendon, J.L.; Serna, C.J. IR Characteristics of Hydrotalcite-like Compounds. Phys. Chem. Miner. 1985, 12, 34–38. [Google Scholar] [CrossRef]
  31. Labajos, F.M.; Rives, V.; Ulibarri, M.A. Effect of hydrothermal and thermal treatments on the physicochemical properties of Mg-AI hydrotalcite-like materials. J. Mater. Sci. 1992, 27, 1546–1552. [Google Scholar] [CrossRef]
  32. Kloprogge, J.T.; Frost, R.L. Infrared and Raman Spectroscopic Studies of Layered Double Hydroxides (LDHs). In Layered Double Hydroxides: Present and Future; Rives, V., Ed.; Nova Science Publishers: New York, NY, USA, 2001; pp. 127–151. ISBN 978-61209-289-8. [Google Scholar]
  33. Kloprogge, J.T.; Frost, R.L. FT-Raman and FT-IR spectroscopic study of synthetic Mg/Zn/Al-hydrotalcites. J. Raman Spectros. 2004, 35, 967–974. [Google Scholar] [CrossRef]
  34. Richardson, M.C.; Braterman, P.S. Infrared Spectra of Oriented and Nonoriented Layered Double Hydroxides in the Range from 4000 to 250 cm−1, with Evidence for Regular Short-Range Order in a Synthetic Magnesium-Aluminum LDH with Mg:Al = 2:1 but not with Mg:Al = 3:1. J. Phys. Chem. C 2007, 111, 4209–4215. [Google Scholar] [CrossRef]
  35. Gates, W.; Kloprogge, J.T.; Madejova, J.; Bergaya, F. Infrared and Raman Spectroscopies of Clay Minerals, (Developments in Clay); Elsevier: Amsterdam, The Netherlands, 2017; Volume 8, ISBN 9780081003558. [Google Scholar]
  36. Thommes, M.; Keneko, K.; Neimark, A.V.; Olivier, J.P.; Rodriquez-Reinoso, F.; Rouquerol, J.; Sing, K.S.W. Physisorption of Gases, with special reference to the evaluation of surface area and pore size distribution (IUPAC Technical Report). Pure Appl. Chem. 2015, 87, 1051–1069. [Google Scholar] [CrossRef]
  37. Lowell, S.; Shields, J.E.; Thomas, M.A.; Thommes, M. Characterization of Porous Solids and Powders: Surface Area, Pore Size and Density; Springer: Haarlem, The Netherlands, 2004. [Google Scholar]
  38. Zhao, H.; Nagy, K.L. Dodecyl sulfate–hydrotalcite nanocomposites for trapping chlorinated organic pollutants in water. J. Colloid Interface Sci. 2004, 274, 613–624. [Google Scholar] [CrossRef]
  39. Chuang, Y.H.; Tzou, Y.M.; Wang, M.K.; Liu, C.H.; Chiang, P.N. Removal of 2-chlorophenol from aqueous solution by Mg/Al layered double hydroxide (LDH) and modified LDH. Ind. Eng. Chem. Res. 2008, 47, 3813–3819. [Google Scholar] [CrossRef]
  40. Zubair, M.; Daud, M.; McKay, G.; Shehzad, F.; Al-Harthi, M.A. Recent progress in layered double hydroxides (LDH)-containing hybrids as adsorbents for water remediation. Appl. Clay Sci. 2017, 143, 279–292. [Google Scholar] [CrossRef]
Figure 1. Schematic illustration of the structure of hydrotalcite. Magnesium as green, aluminum as grey, carbon as black, oxygen as red and hydrogen as white balls. Black lines indicate the unit cell of the hydrotalcite crystal. Hydrogen atoms of the main layer are not shown for better clarity. Structural data based on Allman and Jepsen [15].
Chemengineering 03 00089 g001
Figure 2. Powder X-ray diffraction patterns of the reference sample MgAl-CO3 and the effective organo-layered double hydroxides (LDHs) (a). Expanded 2–25° 2θ range on the right-hand side (b). Graphs stacked for better visibility. (*) impurification of the sample with sodium nitrate.
Chemengineering 03 00089 g002
Figure 3. Thermogravimetric Analysis-Differential Thermal Analysis-Mass Spectrometry (TG-DTA-MS) analysis of the sample MgAl-5COO.
Chemengineering 03 00089 g003
Figure 4. TG-DTA-MS analysis of sample MgAl-8SO3.
Chemengineering 03 00089 g004
Figure 5. TG-DTA-MS analysis of the sample MgAl-12SO4.
Chemengineering 03 00089 g005
Figure 6. Overlay of the Fourier transform infrared (FTIR) spectra of the most effective organo-LDHs (upper five) and the reference sample MgAl-CO3.
Chemengineering 03 00089 g006
Figure 7. TG-DTA-MS analysis of the sample E-MgAl-17COO after a batch experiment using 1,1,2-TCA.
Chemengineering 03 00089 g007
Table 1. Element chemical data provided as mass percentage of the synthesized samples. All values rounded to two decimal places.
SampleNaMgAlSMg/AlS/Al
MgAl-CO3 22.237.94 3.13
MgAl-5COO0.1510.494.14 2.77
MgAl-7COO0.319.063.40 2.92
MgAl-11COO0.247.372.56 3.15
MgAl-17COO0.685.172.09 2.77
MgAl-8SO30.1614.675.415.793.010.90
MgAl-12SO31.5811.874.215.563.131.11
MgAl-18SO31.988.152.855.753.171.70
MgAl-12SO40.1413.144.586.723.141.22
Table 2. Lattice parameters (Å) of the synthesized samples.
SampleaC’c
MgAl-CO33.067.723.1
MgAl-5COO3.058.325.0
MgAl-7COO3.0716.449.3
MgAl-11COO3.0536.0108.0
MgAl-17COO3.0547.7143.2
MgAl-8SO33.0521.363.7
MgAl-12SO33.0636.2108.6
MgAl-18SO33.0631.795.0
MgAl-12SO43.0637.9113.7
Table 3. Quantitative analysis of the thermogravimetric (TG) curves. Theoretical values are calculated from the ideal chemical composition of the LDH. Experimental mass loss is calculated using the exact chemical composition of the LDH (see Table 4). All values rounded to two decimal places.
SampleTheoretical Mass Loss (%)Experimental Mass Loss (%)
AnionInterlayer WaterCrystal WaterAnionInterlayerCrystal Water
MgAl-CO39.9411.9323.869.7910.7724.27
MgAl-5COO29.749.3118.6132.464.7419.16
MgAl-7COO30.479.2118.4231.716.7418.79
MgAl-11COO42.297.6415.2945.058.6614.13
MgAl-17COO51.036.4912.9755.424.5412.22
MgAl-8SO341.547.7415.4940.574.3116.83
MgAl-12SO347.836.9113.8251.854.1613.43
MgAl-18SO355.085.9511.9053.071.8313.78
MgAl-12SO449.396.7013.4149.396.7013.41
Table 4. Chemical formulae of the synthesized samples. All values rounded to two decimal places.
SampleChemical Formula
MgAl-CO3[Mg0.76Al0.24(OH)2.00] (CO3)0.12·0.44H2O
MgAl-5COO[Mg0.73Al0.27(OH)2.00] (C5H11COO)0.27·0.25H2O
MgAl-7COO[Mg0.75Al0.25(OH)2.00] (C7H15COO)0.25·0.36H2O
MgAl-11COO[Mg0.76Al0.24(OH)2.00] (C11H23COO)0.24·0.83H2O
MgAl-17COO[Mg0.75Al0.25(OH)2.00] (C17H35COO)0.25·0.37H2O
MgAl-8SO3[Mg0.75Al0.25(OH)2.00] (C8H17SO3)0.23·0.25H2O
MgAl-12SO3[Mg0.74Al0.26(OH)2.00] (C12H25SO3)0.27·0.31H2O
MgAl-18SO3[Mg0.76Al0.24(OH)2.00] (C18H37SO3)0.21·0.13H2O
MgAl-12SO4[Mg0.76Al0.24(OH)2.00] (C12H25SO4)0.34·0.42H2O
Table 5. BET specific surface area (m2/g) and d (0.9) values of particle distribution measurements of the synthesized dried samples.
SampleBET Area (m2/g)Particle Size Distribution (µm)
d(0.9) Aggregatedd(0.9) De-aggregated
MgAl-CO39747527
MgAl-5COO20790650
MgAl-7COO34760650
MgAl-11COO14730625
MgAl-17COO5730560
MgAl-8SO37685650
MgAl-12SO324470320
MgAl-18SO31012550
MgAl-12SO416620590
Table 6. Element chemical analysis of the used samples together with the amount of chlorine adsorbed by different organic LDHs during batch experiments.
SampleContaminant (0.04 mmol in 100 mL)Reaction Time (Days)Na (mol)Mg (mol)Al (mol)S (mol)Cl (mol)Cl Retained (%)
E-MgAl-11COOTCE300.00290.82970.17030.00250.27956.99
TCM300.00320.73160.26840.00330.33398.35
1,1,2-TCA300.00400.72900.27100.00650.775219.38
E-MgAl-17COOTCE300.00320.83810.16190.00270.12223.05
TCM300.00160.83250.16750.00340.28997.25
1,1,2-TCA300.00060.82810.17190.00242.946673.67
E-MgAl-18SO3TCE300.14650.76820.23180.00730.445411.13
TCM300.14220.76460.23540.01090.734718.37
1,1,2-TCA300.08890.75990.24010.00702.153253.83
E-MgAl-12SO4TCE0.160.00830.7580.2420.43510.00060.02
TCE20.00330.75730.24270.45460.0030.08
TCE300.00880.82940.17060.90400.39429.86
TCM300.00600.73800.26201.36520.42351.62
1,1,2-TCA300.00380.82880.17120.74621.311610.59
Table 7. Lattice parameters (Å) of the used samples after the batch experiments. All values rounded to two decimal places.
Sampleac’c
E-MgAl-11COO3.0636.0108.1
E-MgAl-17COO3.0546.5139.5
E-MgAl-18SO33.0632.095.9
E-MgAl-12SO43.0638.8116.4

