
Drought in the Breadbasket of America and the Influence of Oceanic Teleconnections
1
School of Natural Resources, University of Nebraska-Lincoln, Lincoln, NE 68588, USA
2
Department of Earth, Environmental, and Atmospheric Sciences, Western Kentucky University, Bowling Green, KY 42101, USA
*
Author to whom correspondence should be addressed.
Hydrology 2023, 10(12), 215; https://doi.org/10.3390/hydrology10120215
Submission received: 23 September 2023
/
Revised: 14 November 2023
/
Accepted: 18 November 2023
/
Published: 21 November 2023
Abstract
:From 1980 to 2020, drought events accounted for only 11.4% of the billion-dollar disasters in the United States (U.S.), yet caused the second-highest total amount in damages, at USD 236.6 billion. With the average cost of a drought being upwards of USD 9.5 billion, these natural disasters can create serious problems in agriculture. Drought is defined as a period of below-average precipitation that causes damage to agriculture and water supplies. Previous research has linked drought events in the U.S. Great Plains to oceanic teleconnections in the Pacific and Atlantic basins, indicating the influence of El Niño—Southern Oscillation (ENSO), the Pacific Decadal Oscillation (PDO), and the Atlantic Multidecadal Oscillation (AMO). This study looks to identify areas of the Great Plains where drought, as measured by PDSI, has the strongest relationship to ENSO, PDO, and AMO from 1950 to 2019. The states studied are Iowa, Illinois, Minnesota, Texas, Nebraska, and Kansas because these rank as the second through seventh most agriculturally productive states in terms of crop and livestock production. Results show that most of this region displays a relationship between drought and the ENSO and PDO, with less of the region displaying a relationship with the AMO.
1. Introduction
Unlike single-day disasters like tornadoes and hurricanes, the slow, steady, and increasingly intense nature of drought is what gives this natural disaster its costly edge. Since 1980, drought events have accounted for only 25 of the 219 billion-dollar weather and climate disasters in the United States (11.4%), yet caused a total of USD 236.6 billion in damages, second only to tropical cyclones (USD 850.5 billion). The average cost of drought ranks at USD 9.5 billion, again second only to tropical cyclones (USD 22.4 billion) [1]. Three drought events, in 1980, 1988, and 2012, even surpassed the average tropical cyclone cost at a whopping USD 33.5 billion, USD 45.0 billion, and USD 34.5 billion, respectively [2]. In California, the year 2014 alone racked up USD 4 billion in damage due to extensive drought [3]. However, severe drought events are not exclusive to the last forty years. The drought of the 1950s hit especially hard in the southern and central Great Plains, ranking as the worst Texas drought on record [4]. At the time, people described it as not having a “public rain” for five or six years. The notorious 1930s drought gave rise to the “Dust Bowl” and affected nearly two-thirds of the country [5]. Conditions like these can create major problems for many parts of society, including economics, hydrology, and tourism, but especially agriculture [6]. Farmer’s losses from extreme drought can be upwards of 20% of the production value for corn and wheat, while soybean losses can reach 35%. Furthermore, the 2012 drought in the Midwest resulted in a loss of more than one-quarter of United States corn production by volume. These losses are largely from diminished yields and lower production during drought episodes [3]. Being able to better predict when droughts occur, especially severe ones, will help reduce the widespread impact of these costly natural disasters.
Drought, put simply, is characterized by a period of below-average precipitation that causes damage to agriculture, ecosystems, and water supplies [7]. This persistent deficit of precipitation is usually a slowly evolving phenomenon that takes several months to reach its peak intensity and spatial extent and is not always associated with extreme heat. However, factors such as anomalously warm surface temperatures and persistent sunshine can work to quicken the evaporation process and trigger drought onset more quickly [8]. A region particularly sensitive to drought is the American Great Plains because of its national agricultural importance. What makes this region so sensitive is that the rainy season is coincident with its growing season [9]. Lack of rainfall during this period can create serious problems like those seen in 1980, 1988, and 2012. A study focusing on the 2012 drought in the Great Plains found that the key meteorological driver of drought in this region was soil moisture deficits driven by the lack of precipitation, in which soil moisture depletion was expedited by the record-setting hot spring. Another potential driver of these meteorological conditions is oceanic teleconnections [9].
Defined by the National Centers for Environmental Information (NCEI), a teleconnection is “a spatially and temporally large-scale anomaly that influences the variability of the atmospheric circulation” [10]. The most prominent global teleconnection is El Niño—Southern Oscillation (ENSO). It is an interannual, quasiperiodic, coupled mode of the tropical Pacific Ocean and the atmosphere, meaning fluctuations in sea surface temperatures (SSTs) and atmospheric pressure shift on a nearly periodic timescale within a year. The two phases of ENSO are El Niño, characterized by abnormally warm SST in the tropical Pacific, and La Niña, characterized by abnormally cooler SSTs in the same region [11]. Both phases exhibit strong seasonality and tend to develop in the late Northern Hemisphere spring/early summer and peak towards early winter. However, there is evidence that El Niño decays a lot faster after its peak than La Niña, which can persist through the following year and reintensify in the subsequent winter [12]. Other teleconnections have also been identified as modulating the U.S. climate: the Atlantic Multidecadal Oscillation (AMO) and the Pacific Decadal Oscillation (PDO). The AMO is a temporally longer teleconnection than ENSO with a 65-to-80-year cycle in North Atlantic SSTs. It oscillates between anomalously warm and cold temperatures, which mark the positive and negative phases, respectively. The PDO is like the AMO in that it has a longer time scale of around 50 years and represents a low-frequency variability in SST in the northern Pacific. Alternatively, the warm phase of the PDO is associated with cooler sea temperatures in the north-central Pacific and warmer temperatures along the western coast of North America, while the cold phase displays an opposite pattern [4]. Interestingly, these teleconnections can also modulate and influence each other. Cole and Overpeck [13] found that when the PDO is negative, La Niña phases are stronger and more stable. There is also evidence of AMO amplification from the PDO [4]. This modulation is important because it affects how the climate in various parts of the world is influenced by these teleconnections.
It has been found that regional drought likely reflects a consistent response to large-scale climate patterns, like those of teleconnections, meaning the nature of drought can change depending on the signals produced by these large-scale drivers. Researchers have identified strong relationships between ENSO and U.S. seasonal mean temperatures and precipitation, which are the two major factors in drought initiation [11]. More specifically, drier conditions in the Great Plains are associated with negative SST anomalies in the tropical central and eastern Pacific [14], which indicates ENSO and PDO influences. The PDO, independently, has been found to be covariable with U.S. summertime precipitation, but U.S. surface temperatures are covariable with the entirety of the Pacific Basin’s SSTs [5]. Interestingly, this joint influence of ENSO and PDO on soil wetness anomalies is most noticeable and robust in the Great Plains. Moreover, climate anomalies in this region have been found to be intensified when the two teleconnections are in phase; La Niña and a cold PDO are more likely to display anomalously dry conditions. Out-of-phase ENSO and PDO (La Niña and a warm PDO or El Niño and a cold PDO) therefore weakens the Great Plains relationship, and it has been found that without ENSO, PDO does not significantly alter climate in the Great Plains region. Because of the poor sampling of the PDO at interdecadal timescales (it has had only one positive and negative phase from 1950–2005), it is still unclear what impact PDO alone has on soil wetness conditions in the Great Plains [14]. In addition to La Niña and a cold PDO, the AMO has been found to have a relationship between warmer SSTs (positive phase) and below-average precipitation in the central U.S. [15,16]. The seasonality of teleconnections can also influence temperature and precipitation more in some seasons than in others. Previous studies found that the AMO–precipitation relationship is strongest in the summer. La Niña has also been linked to precipitation deficits in both the winter [12] and the summer [14] over the southern and central U.S., respectively. Consequently, Veres and Hu [16] found that very dry conditions in the central and south-central U.S. are present with La Niña and the positive phase of the AMO. The temporal timescale of teleconnections can further create problems with regard to dryness. Because of the more persistent nature of La Niña, multiyear events tend to exacerbate dry soil moisture anomalies in subsequent years due to precipitation deficits in the winter and spring [4]. The AMO positive phase has also been linked to precipitation deficits in the fall and spring, in addition to summer, meaning Atlantic SSTs are influential in forcing multiyear dry periods [15].
In fact, the extensive and severe 1930s and 1950s multiyear droughts occurred during the warm phase of the AMO [4]. Veres and Hu [16] explain that the AMO accounts for 28% of the variation in U.S. drought, yet Nigam et al. [15] found that in the 1930s drought, the AMO alone accounted for 55% of the observed anomalies. However, in the 1950s drought, the PDO accounted for over 50% of the observed signal. Together, these two teleconnections have been found to account for over half of the spatial and temporal variance in multidecadal drought frequency [14,17]. Furthermore, many modeling studies have found that the joint effects of combined cold pan-Pacific SSTs and a warm North Atlantic have a stronger impact on droughts in the Great Plains than either SST region by themselves [18,19]. Multiyear Niña events can also contribute to multiyear droughts due to soil moisture feedback deficits that build over successive warm and cold seasons [13]. The dependence of Great Plains drought on La Niña is only significant in the winter, yet because of the longevity La Niña can exhibit and the occasional reinforcement from the cold phase of the PDO, the decrease in precipitation, particularly in the winter and spring, can be maintained by other teleconnections and feedbacks until La Niña can exert a more defined influence again.
Previous research has investigated the relationships of teleconnections to precipitation in the Great Plains by sampling PDSI during years of El Niño and La Niña, or warm and cold PDO/AMO [14,15,20]. The purpose of this research is to further explore the relationship between teleconnections and drought in the Great Plains by comparing the means of teleconnection indices during years of drought versus years of non-drought. Specifically, we hope to address the following questions: (1) How does drought vary spatially and temporally in the Great Plains? (2) Which teleconnections have the strongest relationships to drought in the most agriculturally productive states, since these areas are the most susceptible to severe drought impacts?
2. Materials and Methods
2.1. Data
2.1.1. Teleconnection Data
Because of the well-defined relationship found in the literature, the teleconnections used in this study are ENSO, PDO, and AMO. ENSO data was retrieved from the Climate Prediction Center [21], PDO data was retrieved from the National Centers for Environmental Information [22], and AMO data was retrieved from NOAA’s Physical Sciences Laboratory [23]. ENSO is confined to the equatorial Pacific Ocean, and values are derived from the Niño 3.4 region, which is roughly between 120° W and 170° E [24]. A Niño is defined as SST values greater than or equal to 0.5 °C for three consecutive months in the Niño 3.4 region, while La Niña is defined as three consecutive months with values less than or equal to −0.5 °C. The PDO index is defined as the leading mode of variability in the north Pacific SST poleward of 20° N. The warm phase displays warmer-than-average temperatures along the North American Coast and cooler-than-average temperatures in the interior Pacific, whereas the cold phase shows an opposite pattern. The AMO index is the leading mode of variability in the detrended North Atlantic basin SST from 0°–80° N. A correlation matrix of the teleconnections is shown in Table 1.
2.1.2. Drought Data
To identify drought periods, the Palmer Drought Severity Index (PDSI) was used [25]. The PDSI was the first comprehensive drought index to be used in the United States and is widely used in historical drought analyses [26,27]. Unlike precipitation-based drought indices, the PDSI uses temperature and precipitation data as well as other terms in the basic water balance equation to estimate dryness [28]. It is calculated using a water balance model that also takes evapotranspiration, runoff, recharge, and the effect of time into account [29]. The index spans from +10 to −10, indicating extreme wetness and extreme dryness, respectively [30], although nearly all climate divisions will have values between +6 to −6. While this index is useful for determining multi-month wet and dry spells, it is not as suitable for detecting short-term events. Using this dataset, a period of dryness (PDSI < 0) is considered a moderate drought when the PDSI drops below −2.0 for three consecutive months, while a major drought is six consecutive months of an PDSI below −2.0. The drought ends when the PDSI becomes positive again [7,17,31]. To classify drought events, they were categorized based on when the drought started: in the boreal warm season or the boreal cool season. The boreal warm season is defined as April to September, while the cool season is from October to March; these dates also coincide with the typical growing season in the Great Plains [19,32]. Additionally, any drought that lasted longer than twelve months was classified as a multiyear drought. While the PDSI was developed for use in the Great Plains, it does come with some limitations, including arbitrary severity classifications and the tendency to underestimate short-term drought [33]. These limitations are mitigated in this study by our choice of methodology.
2.2. Study Area
Within the Great Plains and Midwest regions, six states (Figure 1) were chosen based on their agricultural productivity: Illinois (IL), Iowa (IA), Kansas (KS), Minnesota (MN), Nebraska (NE), and Texas (TX). In terms of total farm output, encompassing both crop and livestock output, these six states rank as the second through seventh most productive states in the U.S. as of 2005 (IA, TX, IL, MN, NE, KS, respectively). California ranked number one overall but was left out due to the widespread use of irrigation as a main water source, rather than rainfall. The climate of the Midwest and Great Plains is continental with warm and humid summers and cold winters, although winters in Kansas and Texas are moderate compared to the northerly states in this study. Precipitation peaks during the early part of the growing season and annual precipitation gradually decreases from east to west across the region, ranging from well over 1000 mm in southeastern TX to less than 400 mm in western NE [25]. There is also a spatial inconsistency compared to the rest of the states studied. Looking specifically at livestock production, Iowa and Texas rank first and second in productivity, with Nebraska, Minnesota, and Kansas at fifth, sixth, and seventh place, respectively. Total crop output has all states but Kansas in the rankings at second through sixth: IA, IL, MN, TX, and NE, respectively [34].
2.3. Statistical Methods
Monthly drought data from 1950 to 2019 was downloaded for each climate division in the states listed above and entered into Excel. Climate division data was used because of the availability of long-term time series data for popular drought indices, including the PDSI [35]. Data from each of the climate divisions are made of an unweighted average from all long-term stations within that division [36]. Climate divisions are areas of homogeneous climate with boundaries shaped by a variety of factors including topography, county lines, crop types, and politics [37].
- (1)
- For each climate division, drought periods were first identified based on their respective PDSI values. For each period, the average strength, maximum strength, and duration were calculated.
- (2)
- Next, monthly teleconnection indices for ENSO, PDO, and AMO were introduced, and positive and negative phases were identified.
- (3)
- To determine the relationships between drought and teleconnection phases, the difference in means test (t-test) was used. Monthly PDSI values and their associated monthly teleconnection values were then sorted into two sections: drought and non-drought, meaning all months of drought and months of non-drought from 1950 to 2019 were separated into two sections. The two-sample t-test assuming unequal variances in Excel was used to determine if the mean teleconnection value for ENSO, AMO, and PDO, respectively, were different during periods of drought versus non-drought.
The two-sample t-test is a statistical method of comparing the means of two independent groups when the assumption of equal variances is not met. The difference between the two means of the two groups is divided by the standard error, which accounts for the variability in each group. The null hypothesis was that there is no difference between the average teleconnection value during months of drought and non-drought, while the alternative hypothesis stated that there is a difference. If the two-tailed p-value was less than 0.05, then the null hypothesis was rejected, and we could assume there was a difference in the mean teleconnection value between periods of drought and non-drought.
3. Results
3.1. Drought
The first step in the analysis is to examine drought occurrence in each state from 1950 to 2019. This gives us a look at how drought varies spatially across the study area and the characteristics of drought within the region. For each climate division (CD), the total number of droughts, the average strength and duration of the droughts, a running tally of the season in which droughts initiated, and the number of multiyear droughts were recorded from PDSI data.
3.1.1. Illinois
Table 2 displays the drought statistics for the nine climate divisions in Illinois. The average strength has PDSI values between −2.77 and −3.30. The strongest droughts on average were found in CD2, in the northeast corner of the state, at −3.30, which, interestingly, is also the location of the shortest average duration and on the lower end of the multiyear drought totals. The average duration, collectively, is also more variable across the state, ranging from 8.58 months to 16.90 months. Shown in Figure 1 and Table 2, the highest durations are consistently found in climate divisions that border the Mississippi River: CD3, CD6, and CD8. CD6, which had the highest average duration at 16.90 months, had the most multiyear droughts as well at five events; however, it also had the third lowest average strength of drought at −2.82, indicating longer but weaker droughts overall in this region. The number of droughts initiated in each season is nearly even except for CD4, which had 70% of its droughts begin in the cool season.
3.1.2. Iowa
Iowa had a similar number of total droughts to Illinois at around ten droughts, as seen in Table 2. The total number of droughts remained consistent across the state, hovering at around ten droughts over the 70-year period. The average strength also remained relatively consistent, with PDSI values ranging from −2.85 to −3.60. The average duration of droughts in Iowa lasted about 12 months, but droughts in CD9 and CD1 lasted three and five months longer, respectively. Interestingly, these two climate divisions also had the highest number of multiyear drought events at five and seven, respectively. They are also found at opposite corners of the state, as seen in Figure 1. CD1, located in the northwest corner of the state, with both the largest average duration and most multiyear droughts, also recorded the highest average strength at a PDSI of −3.60. Drought initiation in the boreal warm and cool seasons remained relatively even across the climate divisions, with only CD2 in the north-central part of the state showing a much larger portion (66.67%) of droughts initiating in the cool season.
3.1.3. Kansas
From Table 2, we can see that drought characteristics began to change in Iowa and Illinois. Total droughts remained similar, with an average of around eleven drought events since 1950. The exception is CD7, located in the southwest corner of the state, with only seven droughts. Their average strength ranged from −2.71 in CD2 to −3.23 in CD9. Kansas also displays the widest range in drought duration of all the states analyzed: 11.17 to 25.14 months. Interestingly, the climate division with the longest duration of droughts is also the same as the one with the smallest number of total droughts: CD7. This climate division also records the second-weakest average strength of droughts at −2.73. CD7 also had the most multiyear droughts of all the climate divisions at five. This makes sense, because, climatologically, the western half of Kansas is drier than the eastern half of the state. This environment makes it conducive for droughts to persist longer than droughts in the rest of the state. Longer-lived droughts will reduce the total number of droughts that occur, simply because they persist longer over time. On the other hand, the climate division with the shortest average duration, CD6, also recorded the most total droughts in the state at twelve. However, there was only one multiyear drought recorded for the climate division. CD6 is found in the far eastern part of the state, opposite CD7. As previously mentioned, the eastern half of Kansas is climatologically wetter, and this explains why droughts do not last as long but develop more often. These droughts lack persistence over time, giving the opportunity for more individual drought events to develop. Looking at the seasonality of drought initiation, Kansas droughts show a strong favor towards warm season initiation, with six out of nine climate divisions having had more than 75% of their droughts start in this season. CD7 specifically sticks out as having had 0% of droughts occur in the boreal cool season during the entire 70-year period.
3.1.4. Minnesota
Minnesota began to show more variance in total drought across the state than the previous three. In fact, it had more variability in drought occurrence than any other state, with a range of seven droughts, as seen in Table 3. CD8, in the southernmost part of the state, held the fewest events, at seven, while CD3, in the far northeast corner of the state, had the most, at fourteen. Similarly to Kansas, CD3 ended up with the shortest average drought duration at just under nine months, while CD8 had the longest average duration at almost sixteen months. Even more interestingly, CD8 had fewer multiyear droughts than CD3, at three and four, respectively. Even then, five multiyear events was the maximum for Minnesota, with two being the minimum. As for average strength, CD8 displayed the strongest droughts at an average PDSI value of −3.28. The weakest droughts were found in CD5 at −2.93. The seasonality of drought initiation also showed some interesting characteristics. Most climate divisions had an about equal split between boreal warm and cool season initiation, but CD5 only had 33% of droughts start in the boreal warm season, indicating that most droughts started in the cool season. CD7 had a similar pattern, with only 36% of droughts materializing during the warm season. These two climate divisions were the only two out of nine that had the majority of droughts begin in the cool season, and they are both found in the southern half of the state.
3.1.5. Nebraska
Nebraska displayed similar characteristics to that of Kansas, shown in Table 3. Total droughts averaged around ten, while the average strength ranged from −2.82 to −3.63. The average duration, however, was consistently longer than the droughts we have studied so far. All eight climate divisions had drought durations of thirteen months or longer, with the longest being twenty-two months in CD5. Interestingly, CD5 did not have the most multiyear droughts: it only had four events, while CD1 had the most, at seven. However, CD1’s average duration was only the third longest, at just over 18.5 months. Its seasonality closely resembled Kansas’, with five climate divisions recording more than 70% of their droughts initiating in the warm season. Moreover, CD5 had 100% of droughts occur in the warm season. The rest showed an about equal distribution between the two.
3.1.6. Texas
Texas, being somewhat of an outlier geography-wise from the rest of the states in this study, displayed some different characteristics than the rest. Table 3 displays those characteristics. Texas climate divisions consistently had the most droughts, with the fewest being eleven and the most being sixteen. However, the average strength of those droughts were consistently the weakest among the six states, with six climate divisions seeing an average strength below a PDSI of −3. The strongest droughts occurred in CD7, in the south-central part of the state, with a PDSI value of −3.47, however. This division also recorded the longest average duration of drought events at a little over twenty-two months. Interestingly, CD7 also had the lowest number of total droughts at eleven. There were also six multiyear events in CD7, which is tied for the third most, but is beaten by seven events in CD9 and eight events in CD10, both in the southernmost part of the state. Additionally, the climate division with the shortest average duration, CD3, in the north-central part of the state, also recorded the most droughts overall, at sixteen. Contrasting with the rest of the states, the seasonality of drought initiation favored the cool season rather than the warm season: five out of the ten total climate divisions recorded more than 60% of droughts being initiated in the boreal cool season. Only one climate division, CD9, had the majority of droughts beginning in the warm season, at 64% of events. The remaining four had an about equal split.
3.2. Teleconnections
The teleconnection analysis was done to determine if there was a significant difference in the teleconnection values of ENSO, PDO, and AMO between periods of drought and non-drought (ND) and to determine the relationship between states that had droughts starting in the warm season vs. the cold season.
3.2.1. Illinois
Table 4 shows that five out of nine climate divisions in Illinois had significant p-values for ENSO: CD2, CD5, CD6, CD8, and CD9. The mean ENSO phase value for months of drought in each of these five divisions averaged around −0.20, indicating that during periods of drought, it is more likely to be during the Niña phase. ND months in these same climate divisions had mean values in the positive-neutral ENSO range. This means that periods of ND are more likely to occur with neutral ENSO and Niño phases. As for the PDO, again, five climate divisions had significance: CD1, CD5, CD6, CD8, and CD9. Four of those climate divisions also had a significant relationship with ENSO. The means for both periods of drought and ND are below 0 because the negative phase of the PDO was more prevalent during the period of study; however, what makes the difference significant is the fact that droughts are more often seen during periods of strongly negative PDO. The AMO, however, is a much different story compared to ENSO and PDO; only one climate division had significance: CD6. Here, the mean AMO values for both drought and ND periods were right around zero, suggesting that AMO is not strongly related to drought in Illinois.
3.2.2. Iowa
Table 4 shows the teleconnection results for Iowa. Upon first glance, we can see that there are more climate divisions with significant relationships compared to Illinois. All nine climate divisions have significant p-values with the ENSO phase, with the means of drought and ND periods similar to that of Illinois, with droughts associated most often with La Niña. The PDO showed significant relationships with all climate divisions except for one: CD8. Much like in Illinois, each significant climate division had both periods of drought and ND with teleconnection means associated with a negative PDO, but drought periods had much stronger negative PDO means: all values were near −0.60, while ND values were half that, near −0.30. There were only two climate divisions with significant AMO relationships: CD8 and CD9. Again, the AMO relationship in Iowa was very weak.
3.2.3. Kansas
Table 4 shows that all nine climate divisions in Kansas have significant relationships to all three teleconnections studied here. All climate divisions are significant with ENSO and PDO, and all but two are significant with AMO. Looking first at ENSO, each drought period for all nine climate divisions had ENSO values trending towards La Niña, while ND periods had values again showing tendencies towards the weak Niño range. PDO values for all nine climate divisions during drought once again fell to very strong negative PDO values, with the southernmost climate divisions having means values as low as −0.90. ND periods had much weaker negative PDO values, around the −0.30 point. As for the AMO, most of the climate divisions have mean AMO values during drought trending towards the neutral-to-very-weak positive phase, while ND AMO values trend towards the neutral-to-very-weak negative phase. However, CD3 shows the opposite. Here, during periods of drought, the mean AMO value shows tendencies towards the very weak negative phase at −0.04, while the ND AMO value is very neutral at 0.01.
3.2.4. Minnesota
Minnesota displays results similar to that of Illinois, with sparse significance among the three teleconnections. Table 5 shows that only four climate divisions have significance with ENSO and PDO, and the AMO has even less with two divisions. ENSO values during periods of drought continue to display Niña tendencies, while ND periods show Niño tendencies. CD7 shows this to an extreme, with a drought ENSO value of –0.37, and an ND value of 0.12. PDO displays similar traits to those we have seen previously, with drought period PDO means at −0.60 or less and ND period means much weaker, around −0.30. The AMO-significant climate divisions do not show as clear a picture. CD3 has the drought AMO mean trending towards the weak positive phase at 0.06, but CD7 shows the opposite, with a drought AMO mean trending towards the neutral-to-weak negative phase at −0.04. Both ND periods keep the AMO mean in the neutral phase, however.
3.2.5. Nebraska
As seen in Table 5, Nebraska displays widespread significance across the state with ENSO and PDO, but less so with AMO. All eight climate divisions show ENSO significance. ENSO means during drought vary more than those in previous states, from −0.08 in CD1 to −0.35 in CD3, but all show Niña tendencies as the predominant phase. ND periods vary much less and remain trending in the neutral ENSO phase. All climate divisions but CD1 also show significance with the PDO. Periods of drought consistently display strong negative PDO values ranging from −0.59 to −0.78, with ND periods continuing to show weaker negative PDO phases around the common value of −0.3. The AMO only showed significance in CD5, CD7, and CD8. All three are once again consistent, with drought period mean values showing tendencies towards the neutral-to-weak positive phase, with the strongest mean being in CD5 at 0.08. ND periods remained neutral.
3.2.6. Texas
With regard to all three teleconnections, Table 5 shows that nearly the entire state of Texas has significant relationships with all three. Only CD4 lacks a significant relationship with the AMO. Similarly to CD9 in Nebraska, Texas ENSO values display vast differences between drought and ND periods. Drought ENSO means show tendencies to be steady in the Niña phase, with values ranging from −0.18 to −0.35. ND periods, however, all have ENSO means trending in the Niño phase, ranging from 0.12 to 0.18, which are the strongest Niño values in this study. In a similar fashion, PDO values are more defined between drought and ND periods. Drought period PDO means record the strongest negative PDO values seen thus far, ranging from −0.91 to −1.04. ND periods still record a negative PDO value, but they are much weaker than what we have seen so far, at around −0.12. The AMO, on the other hand, does not show as drastic a difference compared to other AMO values in other states. Drought periods continue to show AMO value tendencies in the weak positive phase. ND periods are continuously in the neutral-to-weak negative phase, revolving around a zero point.
4. Discussion
Figure 2, Figure 3 and Figure 4 all show the climate divisions that have a p-value of 0.05 or less when it comes to drought and ENSO, PDO, and AMO, respectively. This allows us to look at the spatial orientation of where drought occurrence has a significant relationship with each of the teleconnections. Looking first at the ENSO significance map (Figure 2), we see that the entirety of Iowa, Nebraska, and Kansas are significant, Texas is also entirely significant, but Illinois is more sporadic, and only the southern half of Minnesota is significant. From Table 4 and Table 5, we see that during drought periods for all significant climate divisions, the ENSO phase tends towards La Niña. What this tells us is that when droughts occur in these areas, they are more often seen during La Niña than any other phase, but can still occur in any phase. Research supports this by showing that during La Niña, when sea surface temperatures are cooler than average, drier conditions are more likely in the central Great Plains [14]. This is because ENSO can modulate temperature and precipitation in this region [11], the two main drivers of drought. During La Niña, particularly in the winter, research has found that the cooler waters in the equatorial Pacific create anomalous sinking air over the equatorial Pacific. Another region of sinking air is also found near the American Southeast. This causes the Pacific jet stream to shift further north towards Alaska and to cut down through the western U.S. before shifting back northward through the Northeast over the anomalous high in the Southeast. This pattern typically keeps anomalously warm air confined to the southern U.S., and, more importantly, redirects storm systems away from the area and towards the Upper Midwest [38]. This pattern helps explain the widespread significance of Texas drought and the more sporadic nature of Illinois drought’s significance with La Niña; storms are redirected away from Texas, leading to anomalously dry conditions in the state, especially during the winter, while precipitating storms are sent towards Illinois, as seen in Figure 4. This is further supported by the drought statistics found in Table 3, which shows that half of the Texas climate divisions saw most of the droughts initiate during the cool season.
Furthermore, Jong et al. [38] found that during the summers that had a developing Niña, the poleward shift of the jet stream is accompanied by a larger, continental-scale anticyclone over the central U.S. This creates a barotropic environment over the region and is conducive to the development of hot and dry summers across the Great Plains due to the shifting of precipitating systems to the north and east. This setup helps explain the widespread significance we see in Iowa, Kansas, and Nebraska during the summer. Table 2 and Table 3 show that most climate divisions in Iowa, Kansas, and Nebraska saw most droughts initiate during the warm season, with some even having all drought occurrences start in the warm season. Moreover, Jong et al. [38] emphasize that this setup usually occurs when El Niño is transitioning into La Niña or when the La Niña is developing. For example, looking at CD1, CD5, and CD7 from Nebraska in Table 3, they all had at least 80% of their droughts initiate in the warm season. Looking at the corresponding Table 5, teleconnection analysis results show that these same climate divisions have the weakest Niña tendency values during drought in the table (and even of all the climate divisions studied). These weaker Niña values could be explained by the idea that during the summers in which these droughts occur, La Niña is merely developing and not yet at its peak strength [12,13]. A similar occurrence can be found in Kansas in CD6 and CD7.
Next, Figure 3 focuses on the spatial significance pattern of the PDO and drought occurrence. PDO significance shows a similar spatial pattern to that of ENSO, which makes sense, knowing that research has shown strong ties between the two teleconnections. All of Kansas is significant, Nebraska and Iowa are mostly significant save CD1 in Nebraska and CD8 in Iowa, the bottom half of Minnesota remains significant, and Illinois is still sporadic. The entirety of Texas is significant as well (Table 5). It is important to reiterate here that research has found that the PDO and ENSO tend to “work together” when modulating climate in North America, including drought. The results in Table 4 and Table 5 show that both drought and non-drought periods occur during the negative phase of the PDO; however, drought periods continuously occurred during strong negative PDO events. This can be explained by the fact that over the 70-year period in this study, there have been two cold phases (over 60% of months from 1950–2019 were cold PDO), but only one extended warm period, from about 1977 to 1999. With this in mind, the “strong” PDO values found during drought periods tell us that drought favors the negative phase, and that ND periods may favor a phase closer to neutral or even slightly positive.
It has been shown that without ENSO, the PDO does not significantly alter North American climate [14]. However, research has shown that the PDO can influence the “strength and character of ENSO” [39]. Hu and Huang [14] explain that both the ENSO and PDO generate a similar atmospheric circulation pattern across the Pacific and North America, meaning the phase of the PDO can suppress or enhance the effects of the ENSO phase. For example, the negative (or cold) PDO reinforces La Niña, which creates a cold tropical and extra-tropical Pacific and enhances the atmospheric pattern La Niña can produce. This is important with regard to drought, because, as Schubert et al. [5] found, U.S. summer precipitation is covariable with the PDO on decadal timescales, but they also found that U.S. temperatures are covariable with the entire Pacific basin. This means that negative PDO and La Niña are conducive to drought development in the Great Plains in both the warm and cool seasons. So much so, that it is during these phases that long-lived, multiyear droughts are most likely to occur, due to the overlap in the Niña and PDO areas of influence [5]. In terms of our results, this can be seen particularly well in Texas. Table 5 shows that both ENSO and PDO drought means are the strongest of all the states, and Table 2 shows that Texas had the most multiyear droughts of any state.
AMO results, as seen in Figure 4, tell a much different story. AMO significance is not as spatially coherent as with ENSO and PDO, with the most widespread significance in Kansas and Texas (Table 5). Similarly to the PDO, the AMO is multidecadal, and there have only been about two complete cycles since the beginning of the instrumentation record [16]. Additionally, over long periods of time, the AMO has displayed little variability, which explains why both the drought and ND averages for the AMO are so close together compared to the other teleconnections. However, the consistency of drought periods displaying a positive AMO value shows that drought, specifically in the southern Plains, does favor the positive, warm phase of the AMO. Research supports this and tells us that during the positive phase, the atmosphere below about 750 mb dries out during the summer. This leads to enhanced static stability in the atmosphere and makes it harder for convection to occur. Additionally, it has been found that negative vorticity is often found over this region, further inhibiting precipitation development [16]. The results align with this by displaying the most widespread significance in Kansas and Texas.
However, there are caveats to how well these teleconnections can be used as a predictor of drought in the Great Plains and Midwest, specifically with multidecadal teleconnections like the PDO and AMO. Mann et al. [40] discusses the lack of consistent evidence for long-term oscillatory signals that are more than just climatic noise. In simulations, they find no significant features within bi-decadal or multidecadal timescales that are not expected to simply be random noise. However, in historical observations, there is evidence of a narrowband AMO signal around a 50-year period, but still no evidence for a bi-decadal PDO peak at around 15–20 years. Historical simulations also emphasize the North Atlantic, which is consistent with the AMO signature, but they found that the pattern is similar to the estimated response to aerosols produced though anthropogenic means. Positive and negative AMO peaks align with the positive and negative peaks of aerosol concentrations. ENSO, on the other hand, shows up clearly in simulations and observations, further confirming its existence as a teleconnection.
5. Conclusions
The purpose of this research is to further explore the relationship between teleconnections and drought in the most agriculturally productive states in the Great Plains and Midwest by comparing the means of teleconnection indices during years of drought versus years of non-drought. Using the difference of means t-test, drought, in the form of the PDSI, for each climate division, was tested against monthly teleconnection values from 1950 to 2019 to identify which phases are significant with regard to drought occurrence. Results showed that drought favors the Niña phase of ENSO, the negative phase of the PDO, and the positive phase of the AMO. The ENSO signal was strongest across TX, KS, NE, and IA, with each climate division in those states showing a statistically significant relationship with the PDSI. The PDSO showed a similar spatial pattern to that of ENSO. The AMO demonstrated the weakest relationship between drought in the Great Plains and Midwest, with TX and KS having the most consistent spatial relationship. These results align with the findings of previous research.
Future work on this topic will further explore the relationships between coupled teleconnection effects on drought to see how teleconnection phases work together to modulate drought. Additionally, further studies will focus more on agricultural productivity by looking at how yields respond to drought driven by teleconnections versus drought driven by other processes, such as land–atmosphere feedback.
Author Contributions
Conceptualization, G.B.G.; Data curation, O.G.C.; Investigation, O.G.C.; Methodology, O.G.C.; Supervision, G.B.G.; Writing—original draft, O.G.C.; Writing—review and editing, G.B.G. All authors have read and agreed to the published version of the manuscript.
Funding
This research received no external funding.
Data Availability Statement
This work has been developed upon public databases as described in the manuscript.
Conflicts of Interest
The authors declare no conflict of interest.
References
- The High Cost of Drought. Available online: https://www.drought.gov/news/high-cost-drought (accessed on 19 June 2023).
- U.S. Billion-Dollar Weather & Climate Disasters 1980–2020. Available online: https://www.ncdc.noaa.gov/billions/summary-stats/US/1980-2020 (accessed on 19 June 2023).
- Rodziewiez, D.; Dice, J. Drought risk to the agriculture sector. Econ. Rev. 2020, 105, 61–86. [Google Scholar]
- Quiring, S.M.; Goodrich, G.B. Nature and causes of the 2002 to 2004 drought in the southwestern United States compared with the historic 1953 to 1957 drought. Clim. Res. 2008, 36, 41–52. [Google Scholar] [CrossRef]
- Schubert, S.D.; Suarez, M.J.; Pegion, P.J.; Koster, R.D.; Bachmeister, J.T. Causes of long-term drought in the U.S. Great Plains. J. Clim. 2004, 17, 485–503. [Google Scholar] [CrossRef]
- Craft, K.E.; Mahmood, R.; King, S.A.; Goodrich, G.B.; Yan, J. Drought and corn in Kentucky. Appl. Geogr. 2013, 45, 353–362. [Google Scholar] [CrossRef]
- Goodrich, G.B.; Thompson, J.K.; Wingard, S.D.; Batson, K.J. The 2007 Mid-South summer drought and heat wave in historical perspective. Southeast Geogr. 2011, 51, 411–421. [Google Scholar] [CrossRef]
- Wang, L.; Yuan, X. Two types of flash drought and their connections with seasonal drought. Adv. Atmos. Sci. 2018, 35, 1478–1490. [Google Scholar] [CrossRef]
- Livneh, B.; Hoerling, M.P. The physics of drought in the U.S. Central Great Plains. J. Clim. 2016, 29, 6783–6804. [Google Scholar] [CrossRef]
- Teleconnections. Available online: https://www.ncdc.noaa.gov/teleconnections/ (accessed on 19 June 2023).
- Rajagopalan, B.; Cook, E.; Lall, U.; Ray, B.K. Spatiotemporal variability of ENSO and SST teleconnections to summer drought over the United States during the Twentieth Century. J. Clim. 2000, 13, 4244–4255. [Google Scholar] [CrossRef]
- Okumura, Y.M.; DiNezio, P.; Deser, C. Evolving impacts of multiyear La Niña events on atmospheric circulation and U.S. drought. Geophys. Res. Lett. 2017, 44, 11614–11623. [Google Scholar] [CrossRef]
- Cole, J.E.; Overpeck, J.T. Multiyear La Niña events and persistent drought in the contiguous United States. Geophys. Res. Lett. 2002, 29, 25-1–25-4. [Google Scholar] [CrossRef]
- Hu, Z.-Z.; Huang, B. Interferential impact of ENSO and PDO on dry and wet conditions in the U.S. Great Plains. J. Clim. 2009, 22, 6047–6065. [Google Scholar] [CrossRef]
- Nigam, S.; Guan, B.; Ruiz-Barradas, A. Key role of the Atlantic Multidecadal Oscillation in 20th century drought and wet periods over the Great Plains. Geophys. Res. Lett. 2011, 38, L16713. [Google Scholar] [CrossRef]
- Veres, M.C.; Hu, Q. AMO-forced regional processes affecting summertime precipitation. J. Clim. 2013, 26, 276–290. [Google Scholar] [CrossRef]
- Goodrich, G.B. Multidecadal climate variability and drought in the United States. Geogr. Compass 2007, 1, 713–738. [Google Scholar] [CrossRef]
- McCabe, G.J.; Palecki, M.A.; Betancourt, J.L. Pacific and Atlantic Ocean influences on multidecadal drought frequency in the United States. Proc. Natl. Acad. Sci. USA 2004, 101, 4136–4141. [Google Scholar] [CrossRef] [PubMed]
- Pu, B.; Fu, R.; Dickinson, R.E.; Fernando, D.N. Why do summer droughts in the Southern Great Plains occur in some La Niña years but not others? J. Geophys. Res. Atmos. 2016, 121, 1120–1137. [Google Scholar] [CrossRef]
- Goodrich, G.B.; Walker, J.M. The influence of the PDO on winter precipitation during high- and low-index ENSO conditions in the eastern United States. Phys. Geogr. 2011, 32, 295–312. [Google Scholar] [CrossRef]
- El Niño–Southern Oscillation (ENSO). Available online: https://www.cpc.ncep.noaa.gov/products/precip/CWlink/MJO/enso.shtml (accessed on 19 June 2023).
- Pacific Decadal Oscillation. Available online: https://www.ncdc.noaa.gov/teleconnections/pdo/ (accessed on 19 June 2023).
- Linear Correlations in Atmospheric Seasonal/Monthly Averages. Available online: https://psl.noaa.gov/data/correlation/ (accessed on 19 June 2023).
- Equatorial Pacific Sea Surface Temperatures. Available online: https://www.ncdc.noaa.gov/teleconnections/enso/indicators/sst/ (accessed on 19 June 2023).
- Create a Monthly or Seasonal Time Series of Climate Variables. Available online: https://psl.noaa.gov/data/timeseries/ (accessed on 19 June 2023).
- Heim, R.R., Jr. A review of twentieth-century drought indices used in the United States. Bull. Am. Meteorol. Soc. 2002, 83, 1149–1165. [Google Scholar] [CrossRef]
- Svoboda, M.; Le Comte, D.; Hayes, M.; Heim, R.; Gleason, K.; Angel, J.; Rippey, B.; Tinker, R.; Palecki, M.; Stooksbury, D.; et al. The drought monitor. Bull. Am. Meteorol. Soc. 2002, 83, 1181–1190. [Google Scholar] [CrossRef]
- Keyantash, J.; Dracup, J.A. The quantification of drought: An evaluation of drought indices. Bull. Am. Meteorol. Soc. 2002, 83, 1167–1180. [Google Scholar] [CrossRef]
- Palmer, W.C. Meteorological Drought; U.S. Department of Commerce: Washington, DC, USA, 1965; pp. 1–56. [Google Scholar]
- Palmer Drought Severity Index. Available online: https://climatedataguide.ucar.edu/climate-data/palmer-drought-severity-index-pdsi (accessed on 19 June 2023).
- Craft, K.E.; Mahmood, R.; King, S.A.; Goodrich, G.B.; Yan, J. Twentieth century droughts and agriculture: Examples from impacts on soybean production in Kentucky, USA. Ambio 2015, 44, 557–568. [Google Scholar] [CrossRef] [PubMed]
- Field Crops Usual Planting and Harvesting Dates. Available online: https://www.nass.usda.gov/Publications/Todays_Reports/reports/fcdate10.pdf (accessed on 19 June 2023).
- Alley, W.M. The Palmer Drought Severity Index: Limitations and assumptions. J. Appl. Meteorol. 1984, 23, 1100–1109. [Google Scholar] [CrossRef]
- Agricultural Productivity in the U.S. Available online: https://ers.usda.gov/data-products/agricultural-productivity-in-the-us/ (accessed on 19 June 2023).
- Balling, R.C., Jr.; Goodrich, G.B. Analysis of drought determinants for the Colorado River Basin. Clim. Chang. 2007, 82, 179–194. [Google Scholar] [CrossRef]
- Guttmann, N.B.; Quayle, R.G. A historical perspective of U.S. climate divisions. Bull. Am. Meteorol. Soc. 1996, 77, 293–303. [Google Scholar] [CrossRef]
- Karl, T.R.; Riebsame, W.E. The identification of 10- to 20-year temperature and precipitation fluctuations in the contiguous United States. J. Appl. Meteorol. 1984, 23, 950–966. [Google Scholar] [CrossRef]
- Jong, B.-T.; Ting, M.; Seager, R.; Anderson, W.B. ENSO teleconnections and impacts on U.S. summertime temperature during a multiyear La Niña life cycle. J. Clim. 2020, 33, 6009–6024. [Google Scholar] [CrossRef]
- Birk, K.; Lupo, A.R.; Guinan, P.; Barbieri, C.E. The interannual variability of midwestern temperatures and precipitation as related to the ENSO and PDO. Atmosfera 2010, 23, 95–128. [Google Scholar]
- Mann, M.E.; Steinman, B.A.; Miller, S.K. Absence of internal multidecadal and interdecadal oscillations in climate model simulations. Nat. Commun. 2020, 11, 49. [Google Scholar] [CrossRef]
Figure 1.
A map showing the location of each climate division (numbered) for each state in the study.
Figure 1.
A map showing the location of each climate division (numbered) for each state in the study.
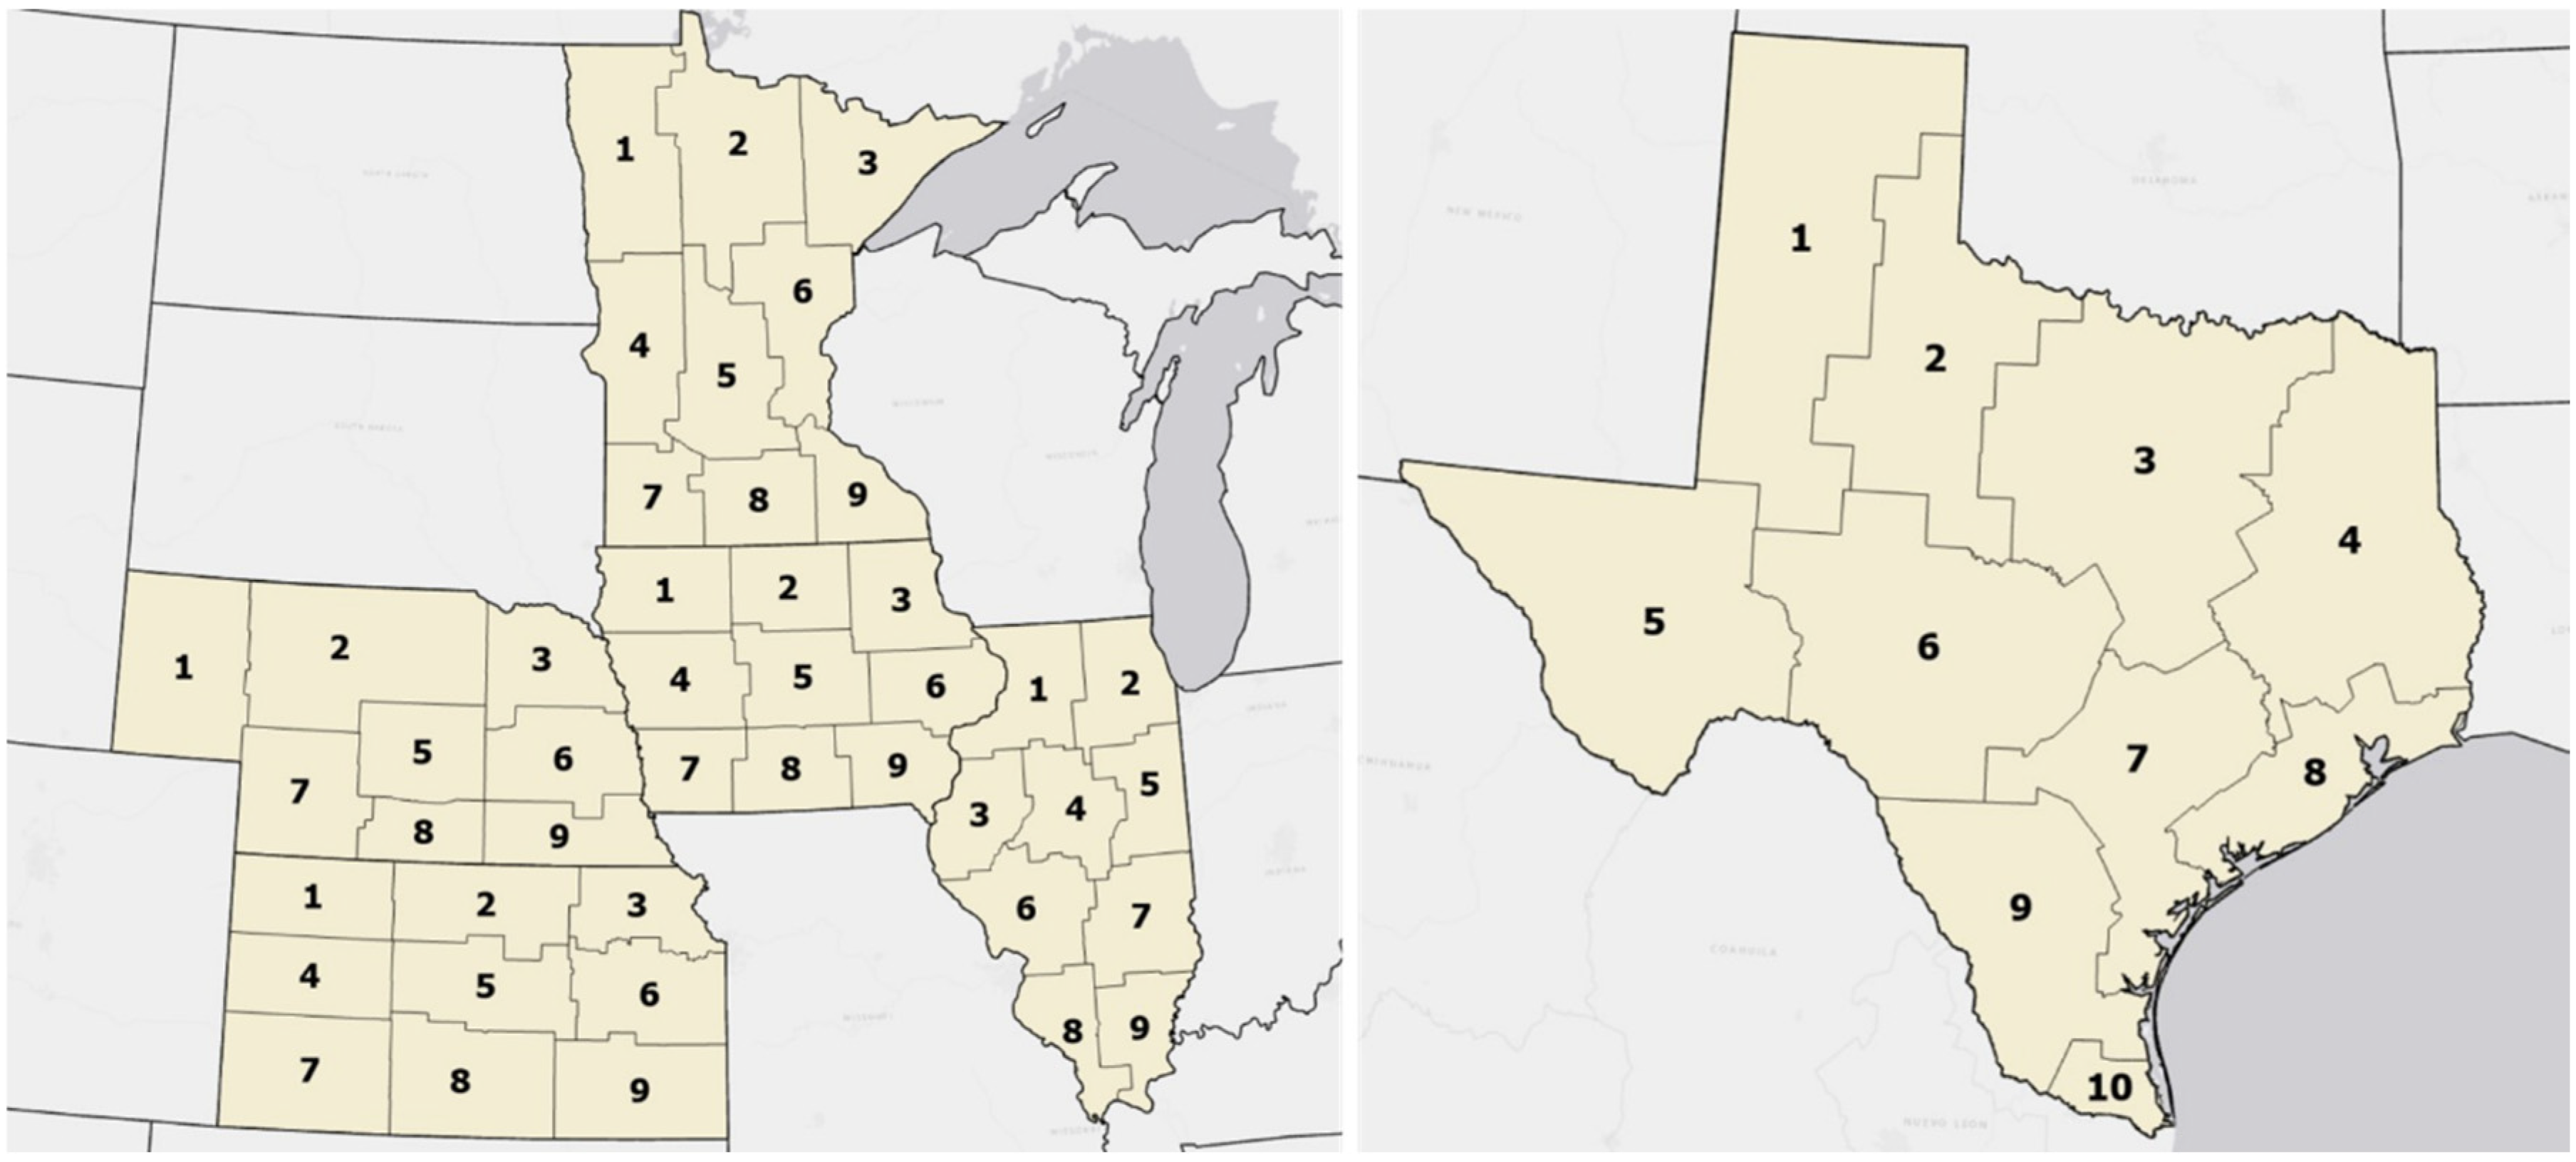
Figure 2.
A map depicting the climate divisions with a p-value ≤ 0.05 for ENSO (shaded green).

Figure 3.
A map depicting the climate divisions with a p-value ≤ 0.05 for PDO (shaded green).
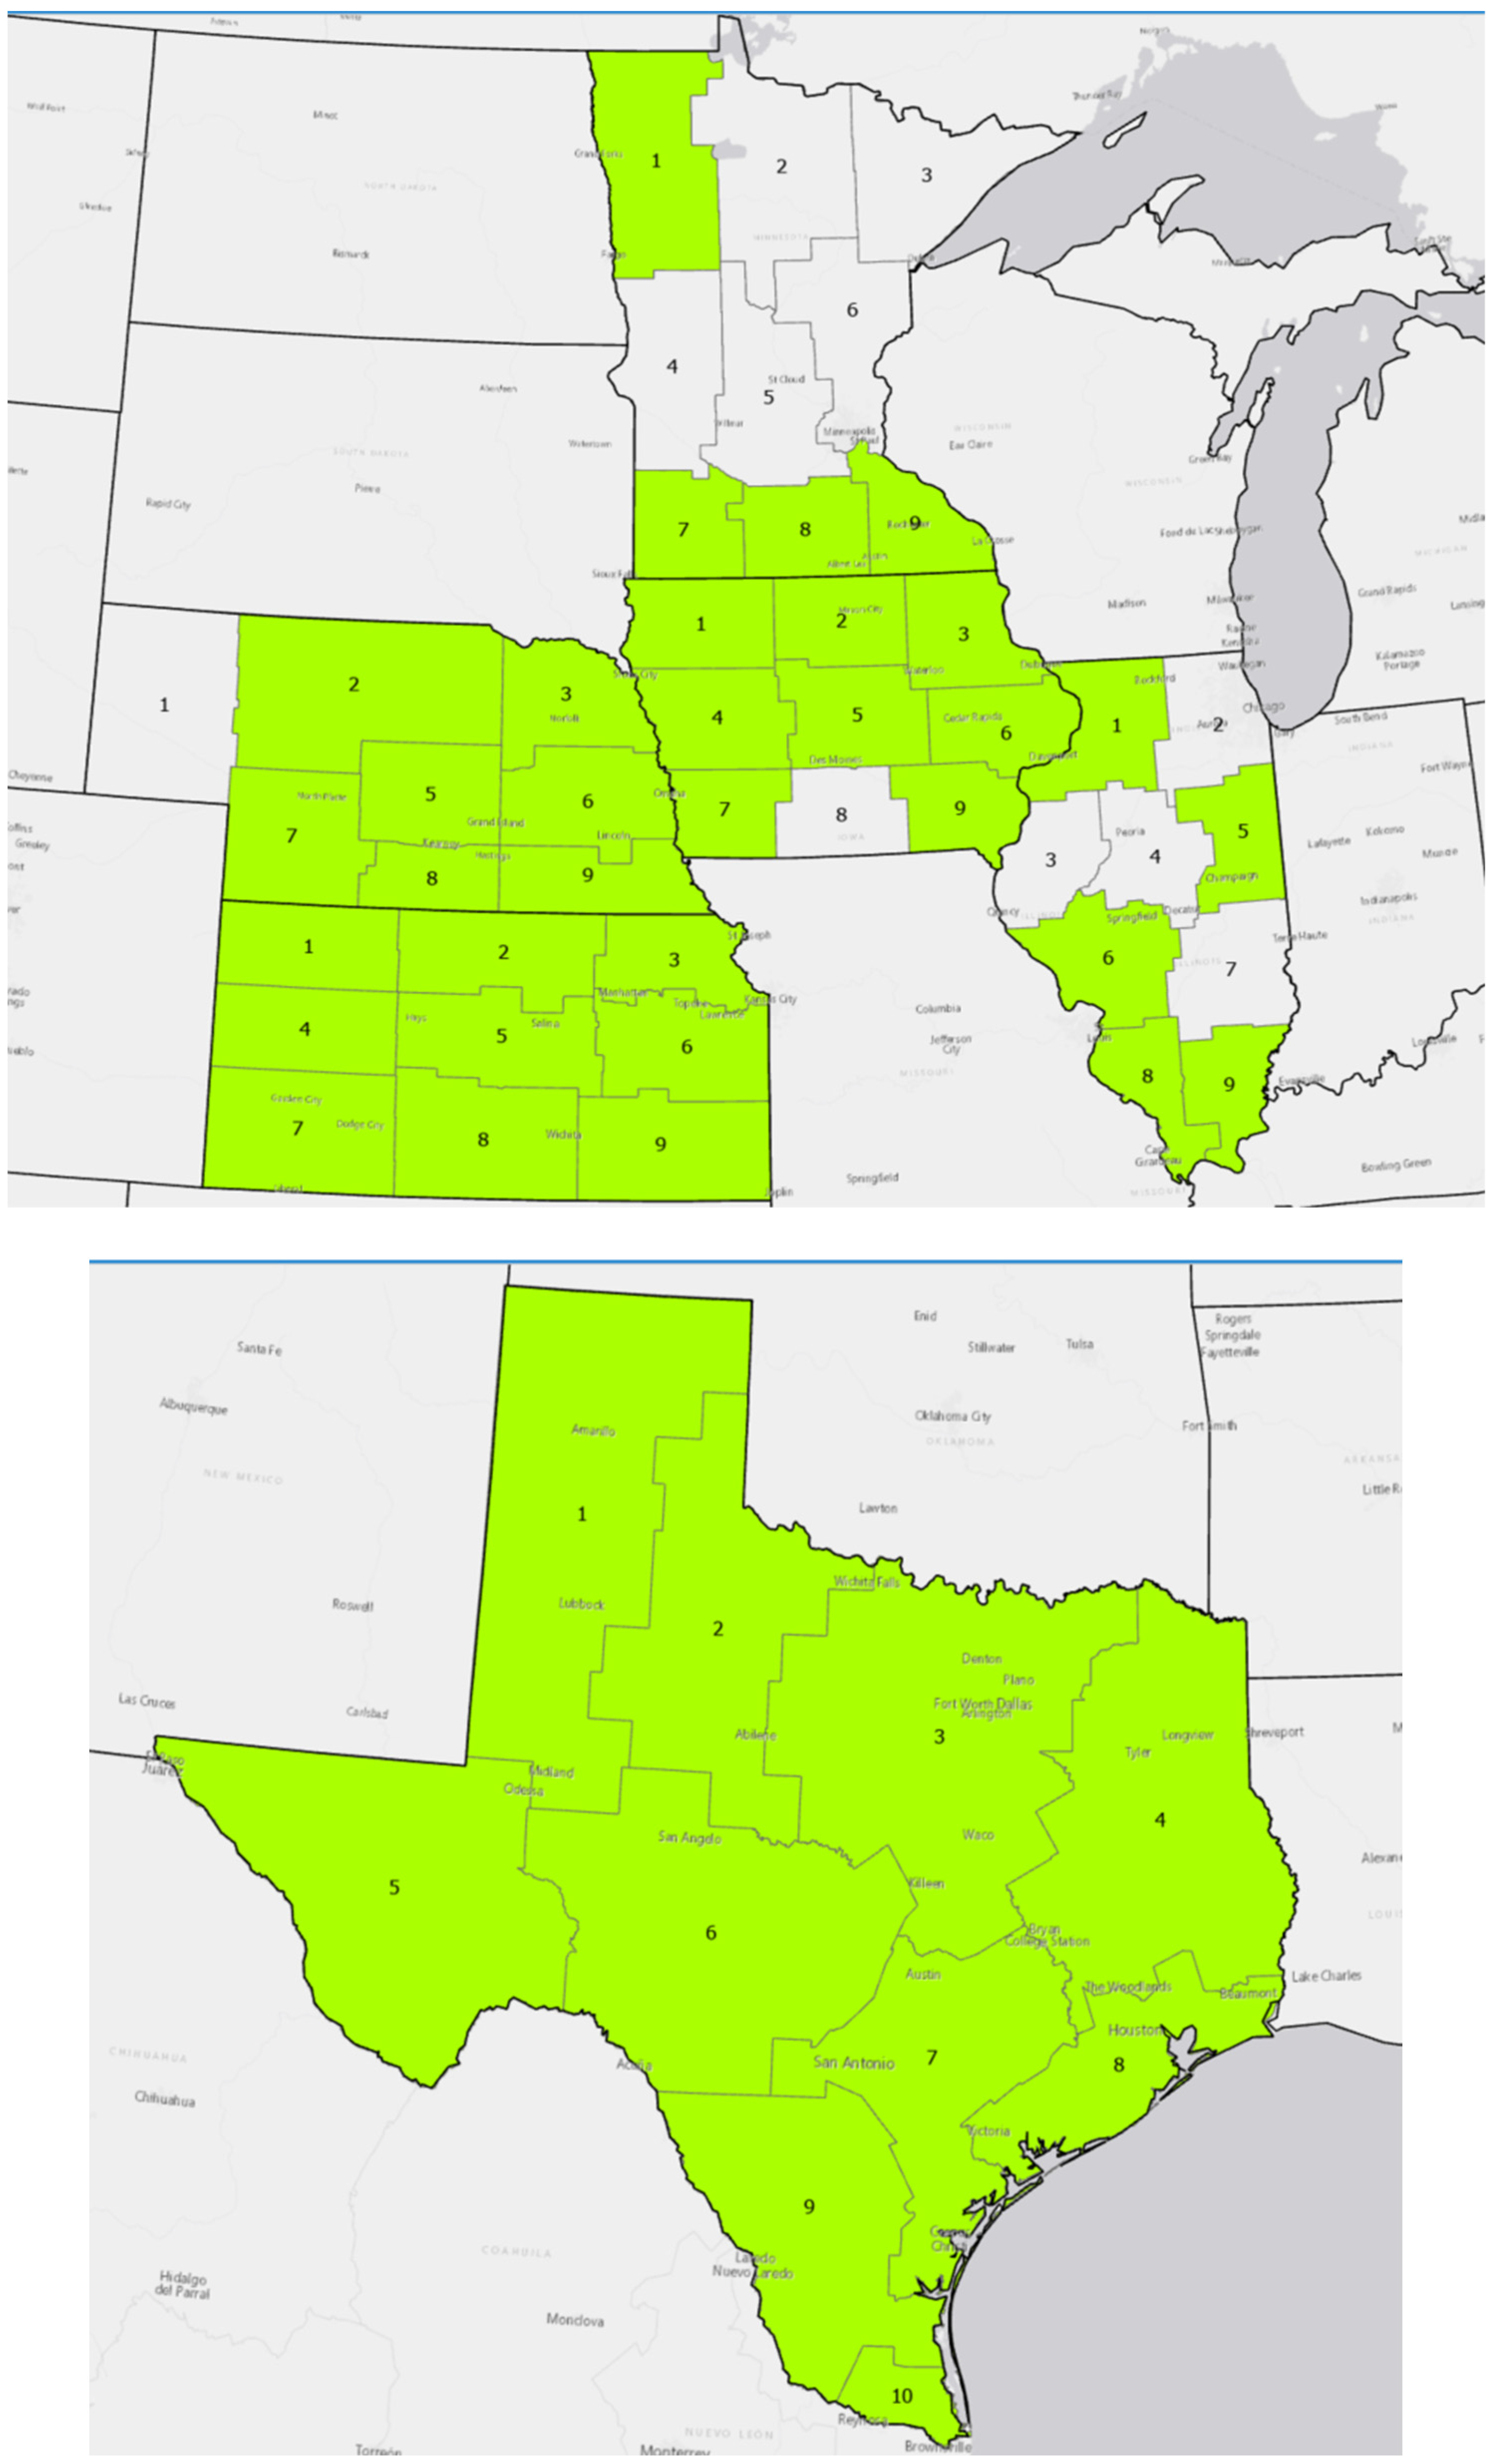
Figure 4.
A map depicting the climate divisions with a p-value ≤ 0.05 for AMO (shaded green).


Table 1.
Correlation matrix of teleconnections.
| PDO | AMO | NIÑO 3.4 | |
|---|---|---|---|
| PDO | 1.00 | −0.09 | 0.44 |
| AMO | 1.00 | 0.05 | |
| NIÑO 3.4 | 1.00 |
Table 2.
Drought statistics for Illinois, Iowa, and Kansas. Duration is in months.
| Illinois | ||||||
|---|---|---|---|---|---|---|
| Total Droughts | Avg. Strength | Avg. Duration | Cool Season | Warm Season | Multiyear | |
| CD1 | 11 | −3.17 | 10.82 | 5 | 6 | 3 |
| CD2 | 12 | −3.30 | 8.58 | 6 | 6 | 3 |
| CD3 | 12 | −2.91 | 13.92 | 6 | 6 | 4 |
| CD4 | 10 | −2.95 | 11.40 | 7 | 3 | 3 |
| CD5 | 10 | −2.96 | 11.50 | 5 | 5 | 2 |
| CD6 | 10 | −2.82 | 16.90 | 5 | 5 | 5 |
| CD7 | 12 | −2.80 | 10.50 | 6 | 6 | 2 |
| CD8 | 9 | −2.89 | 14.00 | 5 | 4 | 3 |
| CD9 | 9 | −2.77 | 12.89 | 5 | 4 | 2 |
| Iowa | ||||||
| Total Droughts | Avg. Strength | Avg. Duration | Cool Season | Warm Season | Multiyear | |
| CD1 | 9 | −3.60 | 17.11 | 5 | 4 | 7 |
| CD2 | 9 | −3.11 | 14.44 | 6 | 3 | 3 |
| CD3 | 10 | −2.85 | 12.30 | 5 | 5 | 4 |
| CD4 | 10 | −3.20 | 12.00 | 5 | 5 | 4 |
| CD5 | 12 | −3.25 | 11.08 | 5 | 7 | 4 |
| CD6 | 12 | −3.13 | 11.67 | 6 | 6 | 4 |
| CD7 | 11 | −2.86 | 11.18 | 6 | 5 | 3 |
| CD8 | 10 | −3.09 | 13.60 | 6 | 4 | 2 |
| CD9 | 11 | −2.85 | 15.09 | 5 | 6 | 5 |
| Kansas | ||||||
| Total Droughts | Avg. Strength | Avg. Duration | Cool Season | Warm Season | Multiyear | |
| CD1 | 10 | −3.04 | 14.90 | 2 | 8 | 4 |
| CD2 | 11 | −2.71 | 18.55 | 2 | 9 | 4 |
| CD3 | 11 | −3.12 | 14.82 | 5 | 6 | 5 |
| CD4 | 11 | −2.60 | 16.82 | 2 | 9 | 4 |
| CD5 | 12 | −3.10 | 12.67 | 3 | 9 | 3 |
| CD6 | 12 | −3.09 | 11.17 | 2 | 10 | 1 |
| CD7 | 7 | −2.73 | 25.14 | 0 | 7 | 5 |
| CD8 | 10 | −2.93 | 15.40 | 5 | 6 | 4 |
| CD9 | 10 | −3.23 | 13.40 | 5 | 5 | 2 |
Table 3.
Drought statistics for Minnesota, Nebraska, and Texas. Duration is in months.
| Minnesota | ||||||
|---|---|---|---|---|---|---|
| Total Droughts | Avg. Strength | Avg. Duration | Cool Season | Warm Season | Multiyear | |
| CD1 | 12 | −3.17 | 11.17 | 6 | 6 | 5 |
| CD2 | 13 | −3.02 | 10.23 | 7 | 6 | 5 |
| CD3 | 14 | −3.14 | 8.93 | 5 | 9 | 4 |
| CD4 | 8 | −3.13 | 11.63 | 3 | 5 | 2 |
| CD5 | 9 | −2.93 | 14.44 | 6 | 3 | 4 |
| CD6 | 12 | −3.03 | 11.00 | 6 | 6 | 4 |
| CD7 | 11 | −2.98 | 15.64 | 7 | 4 | 5 |
| CD8 | 7 | −3.28 | 15.86 | 3 | 4 | 3 |
| CD9 | 9 | −3.11 | 12.67 | 4 | 5 | 4 |
| Nebraska | ||||||
| Total Droughts | Avg. Strength | Avg. Duration | Cool Season | Warm Season | Multiyear | |
| CD1 | 11 | −3.05 | 18.64 | 2 | 9 | 7 |
| CD2 | 10 | −3.20 | 14.80 | 3 | 7 | 5 |
| CD3 | 7 | −3.63 | 15.86 | 3 | 4 | 2 |
| CD5 | 7 | −3.24 | 22.00 | 0 | 7 | 4 |
| CD6 | 10 | −3.08 | 13.00 | 4 | 6 | 3 |
| CD7 | 10 | −2.93 | 16.40 | 2 | 8 | 5 |
| CD8 | 7 | −2.86 | 20.00 | 2 | 5 | 4 |
| CD9 | 12 | −2.82 | 14.17 | 5 | 7 | 5 |
| Texas | ||||||
| Total Droughts | Avg. Strength | Avg. Duration | Cool Season | Warm Season | Multiyear | |
| CD1 | 14 | −2.73 | 15.14 | 9 | 5 | 4 |
| CD2 | 15 | −2.87 | 15.73 | 10 | 5 | 3 |
| CD3 | 16 | −3.06 | 13.56 | 11 | 5 | 5 |
| CD4 | 13 | −2.90 | 16.46 | 6 | 7 | 6 |
| CD5 | 13 | −2.70 | 22.15 | 8 | 5 | 5 |
| CD6 | 14 | 3.04 | 16.86 | 8 | 6 | 5 |
| CD7 | 11 | −3.47 | 22.27 | 7 | 4 | 6 |
| CD8 | 11 | −3.06 | 17.55 | 6 | 5 | 5 |
| CD9 | 14 | −2.88 | 20.00 | 5 | 9 | 7 |
| CD10 | 15 | −2.85 | 19.87 | 8 | 7 | 8 |
Table 4.
Difference of means tests for ENSO, PDO, and AMO in climate divisions for Illinois, Iowa, and Kansas for months of drought and non-drought (ND). p-Value is a measure of statistical significance.
Table 4.
Difference of means tests for ENSO, PDO, and AMO in climate divisions for Illinois, Iowa, and Kansas for months of drought and non-drought (ND). p-Value is a measure of statistical significance.
| Illinois | |||||||||
|---|---|---|---|---|---|---|---|---|---|
| ENSO | PDO | AMO | |||||||
| Drought | ND | p-Value | Drought | ND | p-Value | Drought | ND | p-Value | |
| Mean | Mean | Mean | Mean | Mean | Mean | ||||
| CD1 | 0.12 | −0.55 | −0.33 | 0.05 | 0.39 | ||||
| CD2 | −0.13 | 0.06 | 0.03 | 0.21 | 0.96 | ||||
| CD3 | 0.12 | 0.10 | 0.06 | ||||||
| CD4 | 0.20 | 0.75 | 0.65 | ||||||
| CD5 | −0.23 | 0.07 | 0.00 | −0.57 | −0.33 | 0.04 | 0.64 | ||
| CD6 | −0.21 | 0.09 | 0.00 | −0.54 | −0.32 | 0.03 | 0.04 | −0.02 | 0.00 |
| CD7 | 0.75 | 0.19 | 0.23 | ||||||
| CD8 | −0.19 | 0.07 | 0.00 | −0.76 | −0.29 | 0.00 | 0.40 | ||
| CD9 | −0.17 | 0.06 | 0.01 | −0.77 | −0.30 | 0.00 | 0.13 | ||
| Iowa | |||||||||
| ENSO | PDO | AMO | |||||||
| Drought | ND | p-Value | Drought | ND | p-Value | Drought | ND | p-Value | |
| Mean | Mean | Mean | Mean | Mean | Mean | ||||
| CD1 | −0.22 | 0.09 | 0.00 | −0.62 | −0.31 | 0.00 | 0.08 | ||
| CD2 | −0.12 | 0.06 | 0.04 | −0.63 | −0.32 | 0.01 | 0.17 | ||
| CD3 | −0.17 | 0.07 | 0.01 | −0.61 | −0.32 | 0.01 | 0.56 | ||
| CD4 | −0.28 | 0.08 | 0.00 | −0.65 | −0.31 | 0.00 | 0.95 | ||
| CD5 | −0.32 | 0.10 | 0.00 | −0.67 | −0.30 | 0.00 | 0.20 | ||
| CD6 | −0.19 | 0.08 | 0.00 | −0.58 | −0.31 | 0.01 | 0.77 | ||
| CD7 | −0.26 | 0.09 | 0.00 | −0.61 | −0.32 | 0.01 | 0.26 | ||
| CD8 | −0.13 | 0.07 | 0.01 | 0.12 | 0.05 | −0.02 | 0.00 | ||
| CD9 | −0.16 | 0.08 | 0.00 | −0.64 | −0.30 | 0.00 | 0.02 | −0.02 | 0.03 |
| Kansas | |||||||||
| ENSO | PDO | AMO | |||||||
| Drought | ND | p-Value | Drought | ND | p-Value | Drought | ND | p-Value | |
| Mean | Mean | Mean | Mean | Mean | Mean | ||||
| CD1 | −0.18 | 0.08 | 0.00 | −0.66 | −0.30 | 0.00 | 0.03 | −0.02 | 0.01 |
| CD2 | −0.17 | 0.08 | 0.00 | −0.67 | −0.29 | 0.00 | 0.20 | ||
| CD3 | −0.15 | 0.08 | 0.00 | −0.55 | −0.32 | 0.02 | −0.04 | 0.01 | 0.00 |
| CD4 | −0.13 | 0.07 | 0.00 | −0.72 | −0.27 | 0.00 | 0.02 | −0.02 | 0.03 |
| CD5 | −0.20 | 0.09 | 0.00 | −0.86 | −0.24 | 0.00 | 0.04 | −0.02 | 0.00 |
| CD6 | −0.12 | 0.07 | 0.01 | −0.68 | −0.29 | 0.00 | 0.20 | ||
| CD7 | −0.11 | 0.06 | 0.01 | −0.90 | −0.24 | 0.00 | 0.03 | −0.02 | 0.01 |
| CD8 | −0.16 | 0.09 | 0.00 | −0.83 | −0.24 | 0.00 | 0.02 | −0.02 | 0.03 |
| CD9 | −0.16 | 0.07 | 0.00 | −0.83 | −0.27 | 0.00 | 0.04 | −0.02 | 0.00 |
Table 5.
Difference of means test for ENSO, PDO, and AMO in climate divisions for Minnesota, Nebraska, and Texas for months of drought and non-drought (ND). p-Value is a measure of statistical significance.
Table 5.
Difference of means test for ENSO, PDO, and AMO in climate divisions for Minnesota, Nebraska, and Texas for months of drought and non-drought (ND). p-Value is a measure of statistical significance.
| Minnesota | |||||||||
|---|---|---|---|---|---|---|---|---|---|
| ENSO | PDO | AMO | |||||||
| Drought | ND | p-Value | Drought | ND | p-Value | Drought | ND | p-Value | |
| Mean | Mean | Mean | Mean | Mean | Mean | ||||
| CD1 | 0.09 | −0.59 | −0.32 | 0.01 | 0.39 | ||||
| CD2 | 0.75 | 0.21 | 0.09 | ||||||
| CD3 | 0.12 | 0.83 | 0.06 | −0.02 | 0.00 | ||||
| CD4 | −0.15 | 0.06 | 0.01 | 0.58 | 0.06 | ||||
| CD5 | 0.30 | 0.60 | 0.80 | ||||||
| CD6 | 0.78 | 0.98 | 0.23 | ||||||
| CD7 | −0.37 | 0.12 | 0.00 | −0.74 | −0.28 | 0.00 | −0.04 | 0.00 | 0.05 |
| CD8 | −0.24 | 0.07 | 0.00 | −0.81 | −0.29 | 0.00 | 0.62 | ||
| CD9 | −0.23 | 0.07 | 0.00 | −0.71 | −0.31 | 0.00 | 0.31 | ||
| Nebraska | |||||||||
| ENSO | PDO | AMO | |||||||
| Drought | ND | p-Value | Drought | ND | p-Value | Drought | ND | p-Value | |
| Mean | Mean | Mean | Mean | Mean | Mean | ||||
| CD1 | −0.08 | 0.06 | 0.01 | 0.51 | 0.28 | ||||
| CD2 | −0.14 | 0.07 | 0.00 | −0.64 | −0.30 | 0.00 | 1.00 | ||
| CD3 | −0.35 | 0.09 | 0.00 | −0.78 | −0.30 | 0.00 | 0.21 | ||
| CD5 | −0.09 | 0.06 | 0.02 | −0.69 | −0.29 | 0.00 | 0.08 | −0.02 | 0.00 |
| CD6 | −0.26 | 0.09 | 0.00 | −0.59 | −0.32 | 0.01 | 0.93 | ||
| CD7 | −0.11 | 0.07 | 0.00 | −0.73 | −0.28 | 0.00 | 0.03 | −0.02 | 0.00 |
| CD8 | −0.14 | 0.07 | 0.00 | −0.77 | −0.28 | 0.00 | 0.04 | −0.02 | 0.00 |
| CD9 | −0.29 | 0.10 | 0.00 | −0.68 | −0.30 | 0.00 | 0.08 | ||
| Texas | |||||||||
| ENSO | PDO | AMO | |||||||
| Drought | ND | p-Value | Drought | ND | p-Value | Drought | ND | p-Value | |
| Mean | Mean | Mean | Mean | Mean | Mean | ||||
| CD1 | −0.26 | 0.13 | 0.00 | −0.99 | −0.16 | 0.00 | 0.03 | −0.02 | 0.00 |
| CD2 | −0.26 | 0.14 | 0.00 | −0.97 | −0.15 | 0.00 | 0.05 | −0.03 | 0.00 |
| CD3 | −0.23 | 0.12 | 0.00 | −0.94 | −0.17 | 0.00 | 0.03 | −0.02 | 0.00 |
| CD4 | −0.35 | 0.16 | 0.00 | −0.91 | −0.19 | 0.00 | 0.08 | ||
| CD5 | −0.18 | 0.14 | 0.00 | −0.92 | −0.10 | 0.00 | 0.05 | −0.03 | 0.00 |
| CD6 | −0.27 | 0.16 | 0.00 | −0.95 | −0.12 | 0.00 | 0.05 | −0.03 | 0.00 |
| CD7 | −0.32 | 0.18 | 0.00 | −0.98 | −0.11 | 0.00 | 0.04 | −0.03 | 0.00 |
| CD8 | −0.32 | 0.14 | 0.00 | −1.04 | −0.16 | 0.00 | 0.02 | −0.02 | 0.04 |
| CD9 | −0.26 | 0.17 | 0.00 | −0.87 | −0.12 | 0.00 | 0.05 | −0.04 | 0.00 |
| CD10 | −0.16 | 0.13 | 0.00 | −0.90 | −0.09 | 0.00 | 0.07 | −0.05 | 0.00 |
Disclaimer/Publisher’s Note: The statements, opinions and data contained in all publications are solely those of the individual author(s) and contributor(s) and not of MDPI and/or the editor(s). MDPI and/or the editor(s) disclaim responsibility for any injury to people or property resulting from any ideas, methods, instructions or products referred to in the content. |
© 2023 by the authors. Licensee MDPI, Basel, Switzerland. This article is an open access article distributed under the terms and conditions of the Creative Commons Attribution (CC BY) license (https://creativecommons.org/licenses/by/4.0/).
Share and Cite
MDPI and ACS Style
Campbell, O.G.; Goodrich, G.B. Drought in the Breadbasket of America and the Influence of Oceanic Teleconnections. Hydrology 2023, 10, 215. https://doi.org/10.3390/hydrology10120215
AMA Style
Campbell OG, Goodrich GB. Drought in the Breadbasket of America and the Influence of Oceanic Teleconnections. Hydrology. 2023; 10(12):215. https://doi.org/10.3390/hydrology10120215
Chicago/Turabian StyleCampbell, Olivia G., and Gregory B. Goodrich. 2023. "Drought in the Breadbasket of America and the Influence of Oceanic Teleconnections" Hydrology 10, no. 12: 215. https://doi.org/10.3390/hydrology10120215
Note that from the first issue of 2016, this journal uses article numbers instead of page numbers. See further details here.