

A Simulation–Optimization Model for Optimal Aquifer Remediation, Using Genetic Algorithms and MODFLOW


School of Civil Engineering, Aristotle University of Thessaloniki, 54124 Thessaloniki, Greece
Hydrology 2024, 11(5), 60; https://doi.org/10.3390/hydrology11050060
Submission received: 8 March 2024
/
Revised: 21 April 2024
/
Accepted: 21 April 2024
/
Published: 24 April 2024
(This article belongs to the Special Issue Groundwater Pollution: Sources, Mechanisms, and Prevention)
Abstract
:This paper investigates the optimal remediation process in an aquifer using Modflow 6 software and genetic algorithms. A theoretical confined aquifer has been polluted over a long period of time by unnoticed leakage in a pipeline conveying leachate from an adjacent landfill to a wastewater treatment plant. When the extended leakage and groundwater pollution are discovered, the optimal planning of the remediation strategy is investigated using the pump-and-treat method or/and hydrodynamic control of the pollution. The practical goal is to find the optimal locations and flow rates of two additional pumping wells, which will pump the polluted water or/and control pollution, protecting an existing drinking water pumping well, securing its fully operational mode even during the remediation process with the minimum possible cost, simply represented by the pumped water volume of the additional wells. The remediation process is considered complete when the maximum concentration in the aquifer drops below a certain limit. The Modflow software (handled by the Flopy Python package) simulates the flow field and advective–dispersive mass transport, and a genetic algorithm is used as the optimization tool. The coupled simulation–optimization model, Modflow-GA, complemented by a sophisticated post-processing results analysis, provides optimal and alternate sub-optimal remediation strategies for the decision makers to select from.
1. Introduction
1.1. Groundwater Pollution
Groundwater pollution poses a significant global water quality issue. It arises from diverse sources, such as agriculture, industry, urban and municipal waste, landfills, or poorly designed/constructed septic systems. Groundwater is then introduced with nitrate, heavy metals, organic chemicals, pathogens, and emerging pollutants. Approximately 20% of globally recorded 2000–2013 disease outbreaks (GIDEON; [1]) were water-related diseases, mainly caused by contaminated drinking water supplies and often associated with private/household wells and small groundwater supplies [2,3]. Disposal of municipal solid waste poses a global challenge; landfills are the primary method for waste storage due to their simplicity and cost-effectiveness [4]. In many countries, waste management practices are often unscientific and unplanned, leading to significant environmental issues [5]. This paper deals with the optimal remediation of a theoretical aquifer polluted by leachate from a similar case. Landfills function as biological reactors where refuse undergoes transformation, resulting in gas and leachate production, the latter being a liquid stream carrying soluble products from waste [6]. Leachate composition varies but typically contains dissolved organics, inorganic salts, ammonia, heavy metals, and xenobiotic organic compounds from various sources [7]. Monitoring landfill leachate and tools for the production of optimal remediation strategies are crucial to ensure that landfill operations do not harm human health or the environment.
1.2. Remediation of Aquifers Polluted by Household and Municipal Waste
The treatment and remediation of various types of waste, particularly household and municipal solid waste, require diverse technologies due to their heterogeneous nature. Composting and anaerobic digestion, permeable reactive barriers, electrokinetic technology, micro and nanobubbles, and solubilizing agents have been developed for different waste materials. Biologically enhanced degradation, employing fungi, bacteria, and actinomycetes, is another approach for treating contaminated soils and landfill leachates. These methods are expensive and require highly experienced and specialized personnel and equipment/materials. Often, optimal remediation and effective management of contaminated aquifers demand sophisticated approaches for pollution control or remediation [8]. These methods often involve setting up and operating a network of wells to either manage the dispersion of contaminants through altering groundwater levels and flow paths (hydraulic control—HC) or to lessen the concentration of pollutants by partial or complete extraction, aiming to achieve predetermined concentration levels or overall mass reduction, followed by appropriate treatment (pump-and-treat—PAT) [9]. Pollution control strategies can be further categorized based on the manner in which pollution plumes are intercepted or contained [10], including concentration control (adhering to maximum allowable concentration at specific checkpoints) [11], hydraulic control (maintaining certain head difference, gradient, or velocity at designated points) [12], and advective control [13].
Optimal aquifer remediation problems belong to the class of constrained, nonlinear, stochastic, multi-objective optimization problems. State-of-the-art optimization methods include analytical approaches [14], metaheuristics, such as harmony search algorithms [15], and genetic algorithms (GAs) [16,17,18]. Moreover, chromatic graphs [19] and even game theory are used [20], while the rapid development of machine learning is also mirrored [21]. The current methodology is based on our own previous similar work concerning optimal pollution control and pump-and-fertilize strategies in a nitro-polluted aquifer, using GAs and Modflow [22].
1.3. Current Research Problem
This paper deals with the optimal management of a theoretical polluted aquifer, specifically, the optimal remediation of a confined aquifer. The aquifer is assumed to have been polluted over a long period of time by unnoticed leakage in two sections of an underground pipeline conveying leachate from a landfill to a wastewater treatment plant. Upon delayed discovery of the extended pollution leak, it is decided to immediately shutdown the landfill’s drainage network operation. Simulation of the pollution’s spread is needed in order to predict the aquifer’s current state, and an optimal remediation strategy must be planned. Optimal remediation refers to the investigation of the optimal locations and flow rates of two additional pumping wells (AWs) to protect an existing freshwater supply pumping well. AWs should secure the water supply well’s fully operational mode throughout the remediation process at minimum cost. Optimization entails minimization of the operational cost of the AWs’ system; simply represented here by the total volume of water pumped by AWs. The protection of the existing supply well means that the pollutant concentration does not exceed a certain threshold. Another constraint derives from relevant rules in effect at certain regions of the Greek district, e.g., the Regional Unit of Chalkidiki, Prefecture of Macedonia; these dictate a minimum distance of any well to another or the landfill. The remediation process is assumed to be concluded when the maximum pollutant concentration of the study field drops below a certain threshold. The Modflow software [23] simulates the flow field and advective–dispersive mass transport, while a simple binary elitist GA handles optimization, namely minimization of the pumped volume of water during the variable per solution remediation period. The coupled simulation–optimization (S–O) model, “Modflow-GA”, complemented by a sophisticated post-processing results analysis, produces optimal and alternate sub-optimal remediation strategies for the decision makers to select from. These strategies may feature pump-and-treat (PAT), hydraulic pollution control (HC), or a combination of the two remediation techniques. The methodology that is implemented in the current research is graphically presented step-by-step in Figure 1. Figure 1 should not be seen as a typical graphical abstract, as it is not a general summary of the methodology proposed, but a rather over-detailed delineation of the proposed process that the reader could fully comprehend only after reading through all the sections of this paper.
2. Materials and Methods
2.1. Theoretical Problem
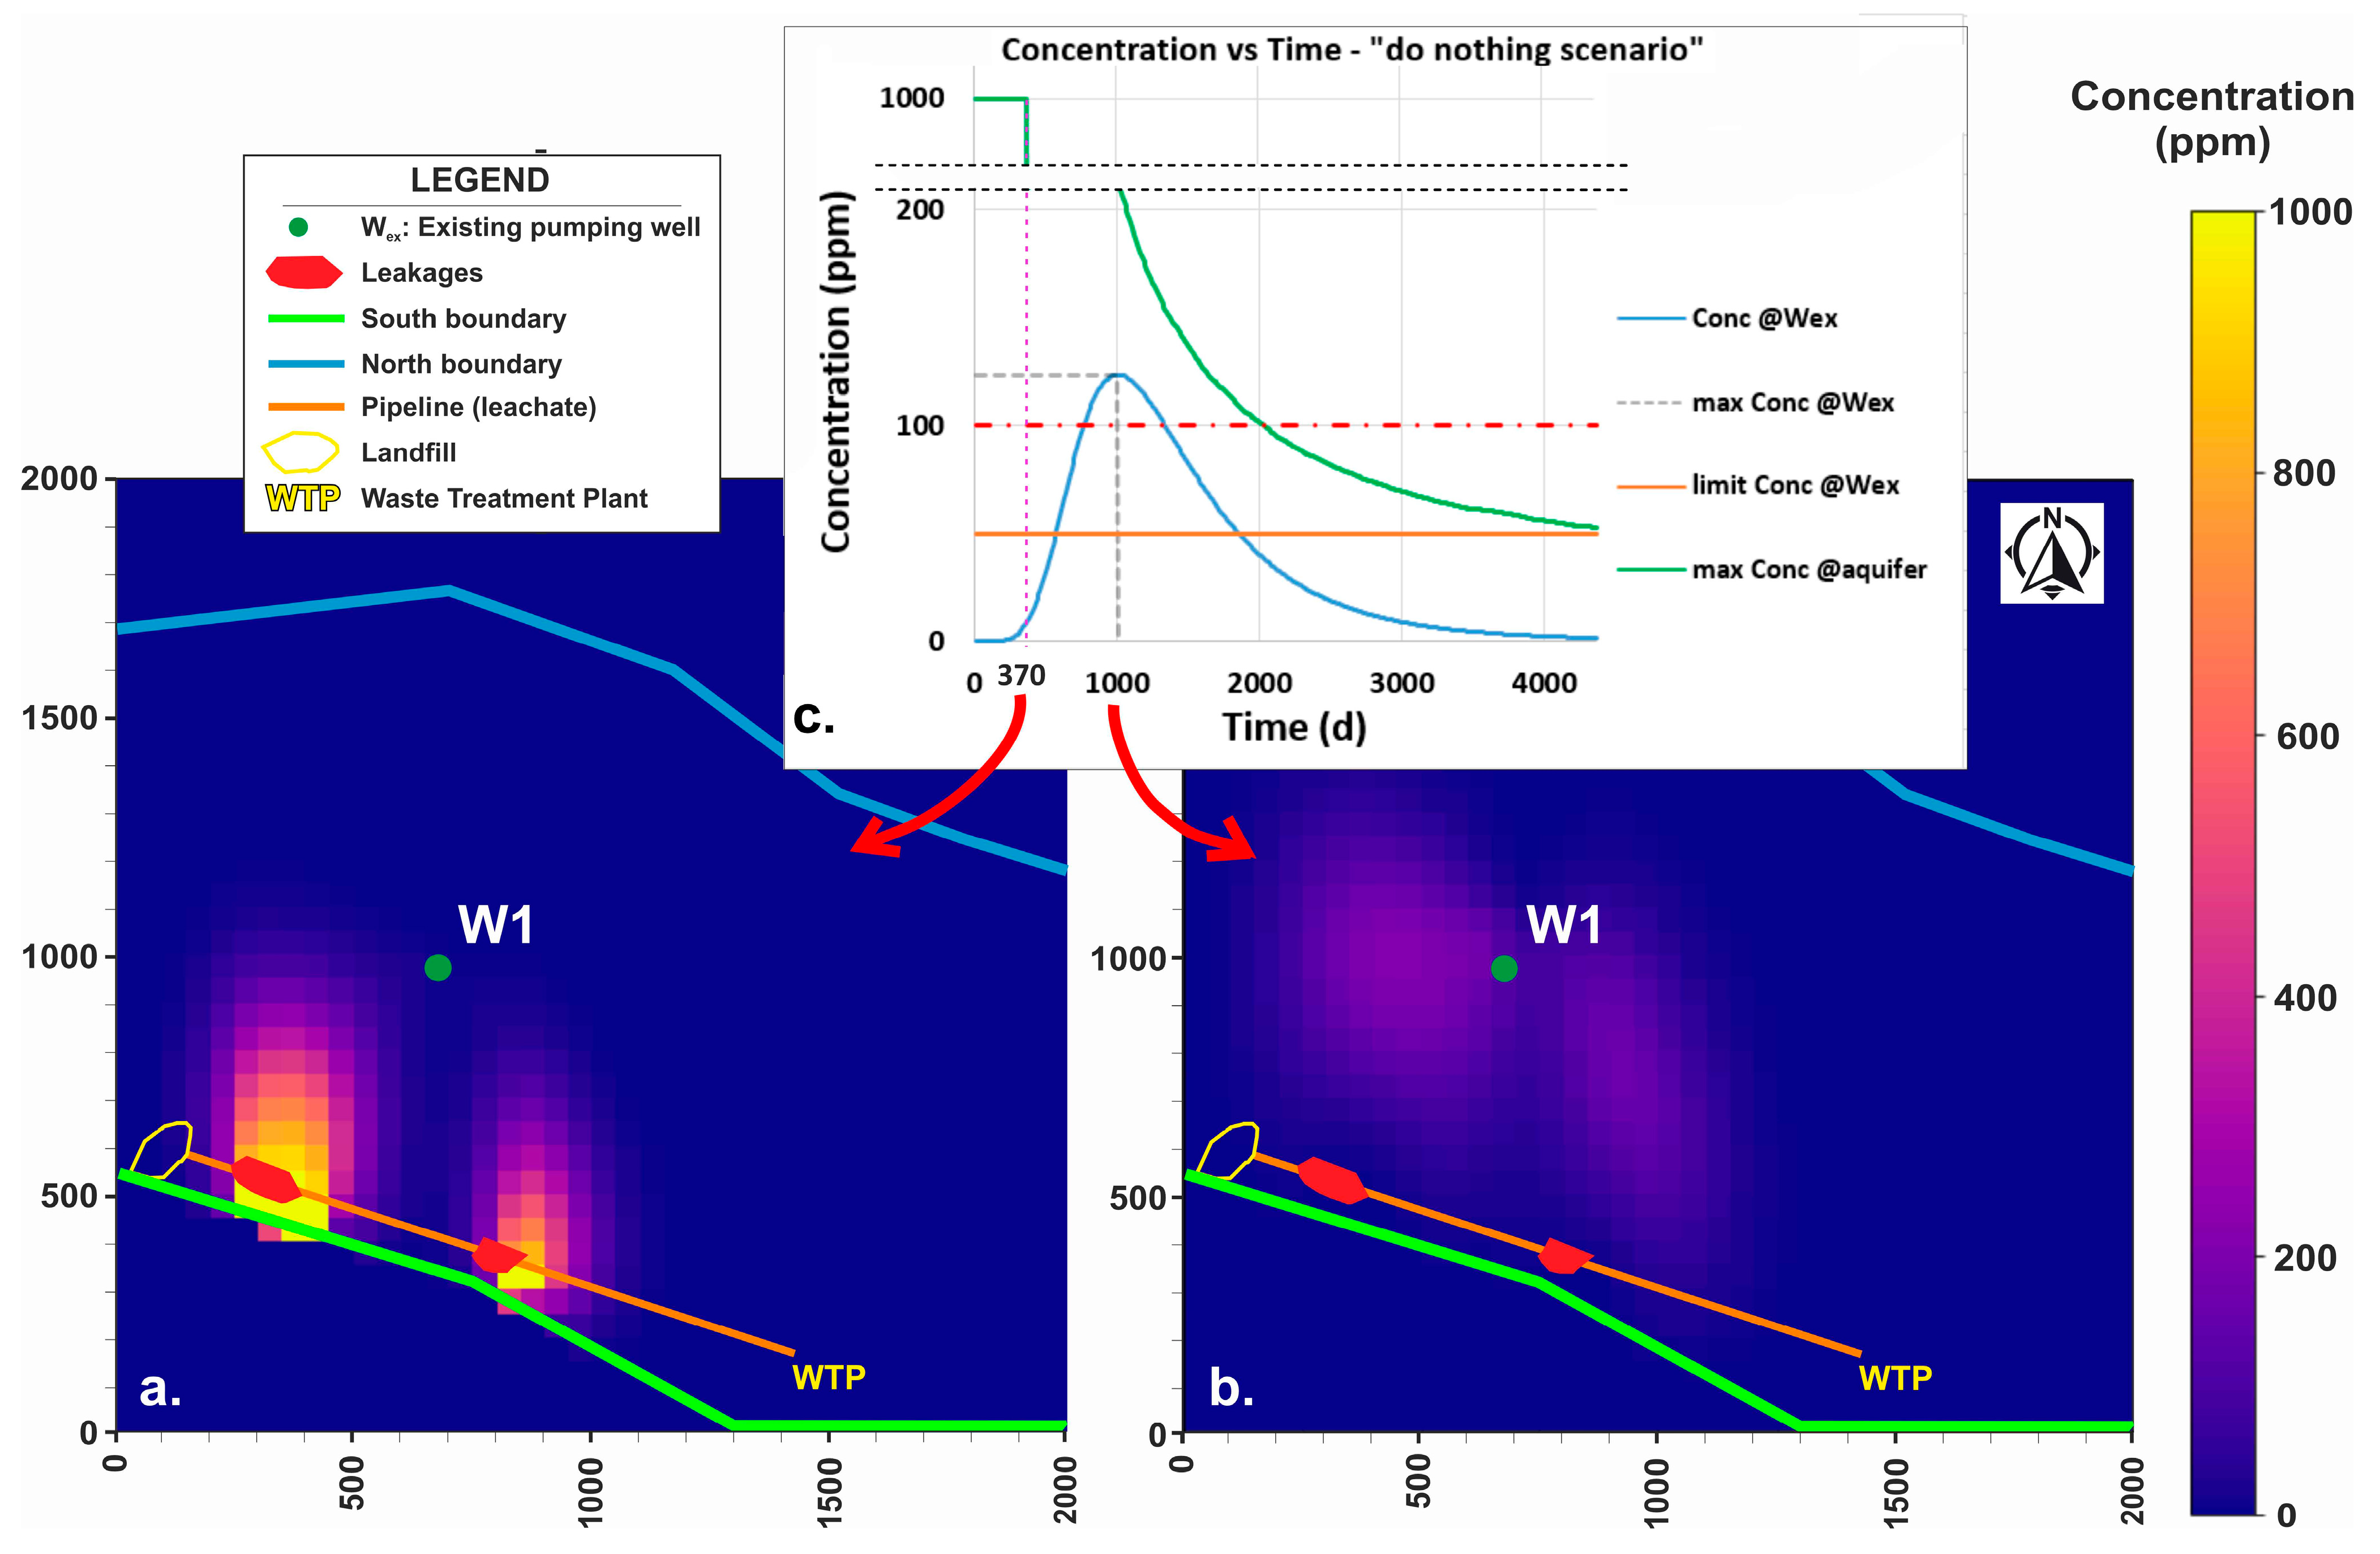
The 2 km × 2 km top view of the theoretical flow field is presented in Figure 2. It includes an existing fresh water supply well (Wex), a landfill (LF), a pipeline conveying leachate from the LF to the wastewater treatment plant (WTP) that is positioned deep enough to leak directly in the confined aquifer, and two leaking sections of the pipe (Leak 1 and Leak 2). It also includes the southern boundary with a constant hydraulic head of 135 m and the northern boundary with a constant head of 124 m. These two boundaries combined define a south-to-north natural hydraulic gradient and flow. Finally, the field includes the western and eastern no-flow impermeable boundaries. The aquifer is assumed to be directly polluted by constant concentration load leaks (1000 ppm) by two sources, Leak 1 and Leak 2 in the pipeline, respectively. The leaks assumedly persisted unnoticed for approximately 1 year (370 d). Wex should uninterruptedly supply fresh drinking water to an adjacent settlement at a constant flow rate of 950 m3/d. For this purpose, the solution of the construction and operation of two AWs is promoted by the authorities/decision makers. The two wells should employ PAT or HC or a combination of the two to protect Wex while also remediating the polluted aquifer.
The practical goal is to find the locations and flow rates of the AWs (max possible flow rate = 2500 m3/d) so that the management (protection and remediation) cost is minimal. The cost is simplistically represented here by the volume of water pumped by the AWs. The Wex is assumedly protected provided that the pollutant concentration does not exceed Clim = 50 ppm. Aquifer remediation is assumed to be concluded when the aquifer’s maximum pollutant concentration, Caq,max, is lower than Crem = 100 ppm.
The computationally greedy nature of GAs dictates a certain balance between computational accuracy and efficiency [24]. Thus, a simplified 2D flow field is studied in a homogenous, isotropic, confined aquifer with a plane, single-phase, steady-state (per stress period) flow. The hydraulic conductivity of the aquifer is assumed to be Kx = Ky = Kz = 8 m/d; aquifer thickness is b = 17 m, efficient porosity is ne = 0.2, longitudinal dispersivity is aL = 70 m, and transverse dispersivity is aV = 7 m, throughout its extent. Diffusion is not considered significant and, hence, is not included in the conceptual model. As this is clearly a theoretical problem and this paper focuses on the coupling of Modflow with the optimization method of GAs, the hydrogeological configuration of the assumed studied aquifer is quite simplistic. However, the proposed methodology can easily address any complex hydrogeological setup; Modflow is capable of doing so, as documented in numerous scientific papers. In real case studies, well-log and/or stratigraphic information should be utilized in order to address possible heterogeneity of the aquifer, at least in the proximity of the wells and the pipeline [25,26].
The prediction of the leaked pollution’s spread in the assumed current state (a year after the leaks’ initiation), simulated in a way presented in Section 2.2, is presented in Figure 3a (see Supplementary Material SM1 for the respective video of the full spread progression; SM0 is a list of all Supplementary Material Files together with a relevant description). If no countermeasures or remediation strategies are implemented, the pollution plumes will spread and pollute, and be at least partially pumped by, Wex. Assuming that the detection threshold for declaring a well polluted is CWex > 1 ppm, in the “do nothing scenario”, Wex is polluted approximately 240 d after the leaks’ discovery (see SM1). The maximum (max) pollutant concentration in the aquifer would be detected at approximately day 1000 (Figure 3b). The diagram in Figure 3c presents the temporal predicted evolution of pollutant concentration at Wex and the max aquifer concentration in the “do nothing” scenario.
2.2. Simulation Model Based on Modflow 6
The simulation of the flow field and mass transport are handled by the Modflow 6 software of USGS [23]. It is an established finite differences tool. The automated call of recurring simulations due to the coupling of the simulation model with an optimization tool (GAs) of an iterative nature dictates the use of the “Flopy: Python Package for creating, running, and post-processing MODFLOW-Based Models” [27,28,29,30,31]. The 2 km × 2 km flow field is discretized in a square grid of 40 × 40 cells (2D top view), each with a 50 m side. The 17 m thick confined aquifer comprises a single layer; hence, a simplified 2D model is simulated (see Figure 2).
The initial piezometric surface is assumed to be 129.5 m high. The western and eastern boundaries are assumed to be impermeable, while the southern and northern ones (see Figure 2) are assumed to be constant head boundaries (135 m and 124 m, respectively) simulated in Modflow as constant head boundaries (CHD; [31]). This way, a south–north (S–N) natural flow is defined due to the hydraulic gradient of approximately (135 m − 124 m)/2000 m = 5.5 ‰.
2.3. Optimization Tool—Genetic Algorithms
This is a typical, constrained, nonlinear, stochastic, multi-objective optimization problem [8]. It is formed as a minimization of the fitness value (FV) problem. FV stands for the aquifer remediation cost of each solution, here simplistically represented by the total pumped volume of water by the AWs. The constraints include the following:
- C1.
- Concentration at Wex must always be lower than 50 ppm;
- C2.
- All wells and the landfill must retain a distance of more than 300 m between them;
- C3.
- All AWs’ coordinates (X2, Y2, X3, Y3) must retain values from 0 to 2000 m;
- C4.
- The values of the flow rates of the AWs must vary between −2500 m3/d and 0 (pumping wells’ flow rates are negative in Modflow).
2.3.1. Objective Function
Mathematically, the objective function to be minimized can be stated as:
Find: Xi, Yi, Qi, i = 2, 3 so that FV = Vtot + Penalty = Min
Subject to the constraints:
given that:
where Xi, Yi are the coordinates of the ith AW (m; i = 2, 3); Qi is the flow rate of the ith AW (m3/d; i = 2, 3); FV is the fitness value to be minimized, here, simplistically represented by Vtot (m3; see Equation (6)), the total volume of water pumped by the AWs throughout the varying-per-solution duration of remediation trem (see Equation (7)); Penalty is the total penalty comprised by the separate constraint-specific penalties imposed on solutions that violate one or more of the four constraints C1–C4 (see Section 2.3.3); CWex,Δti is the concentration at Wex during timestep Δti; N is the last timestep of the remediation period; QAWS is the sum of the flow rate of the additional wells; Caq,max is the max concentration anywhere in the aquifer at any timestep of the remediation period (which varies with the solution); Crem is the concentration threshold below which the remediation is considered complete.
C1: CWex,Δti < Clim = 50 ppm for any Δti, i = 1, 2,…, N
C3: 0 ≤ Xi, Yi ≤ 2000 (m), i = 2, 3
C4: −2500 ≤ Qi ≤ 0 (m3/d), i = 2, 3
As far as constraint C3 is concerned, the decision variables are not actually coordinates but rather column (col) and row numbers since the numerical simulation model is based on finite differences (Modflow); the col/row numbers refer to the 2D top view grid. Hence, C3 can be written:
C3′: 1 ≤ coli, rowi ≤ 40, i = 2, 3
2.3.2. Genetic Algorithm Configuration
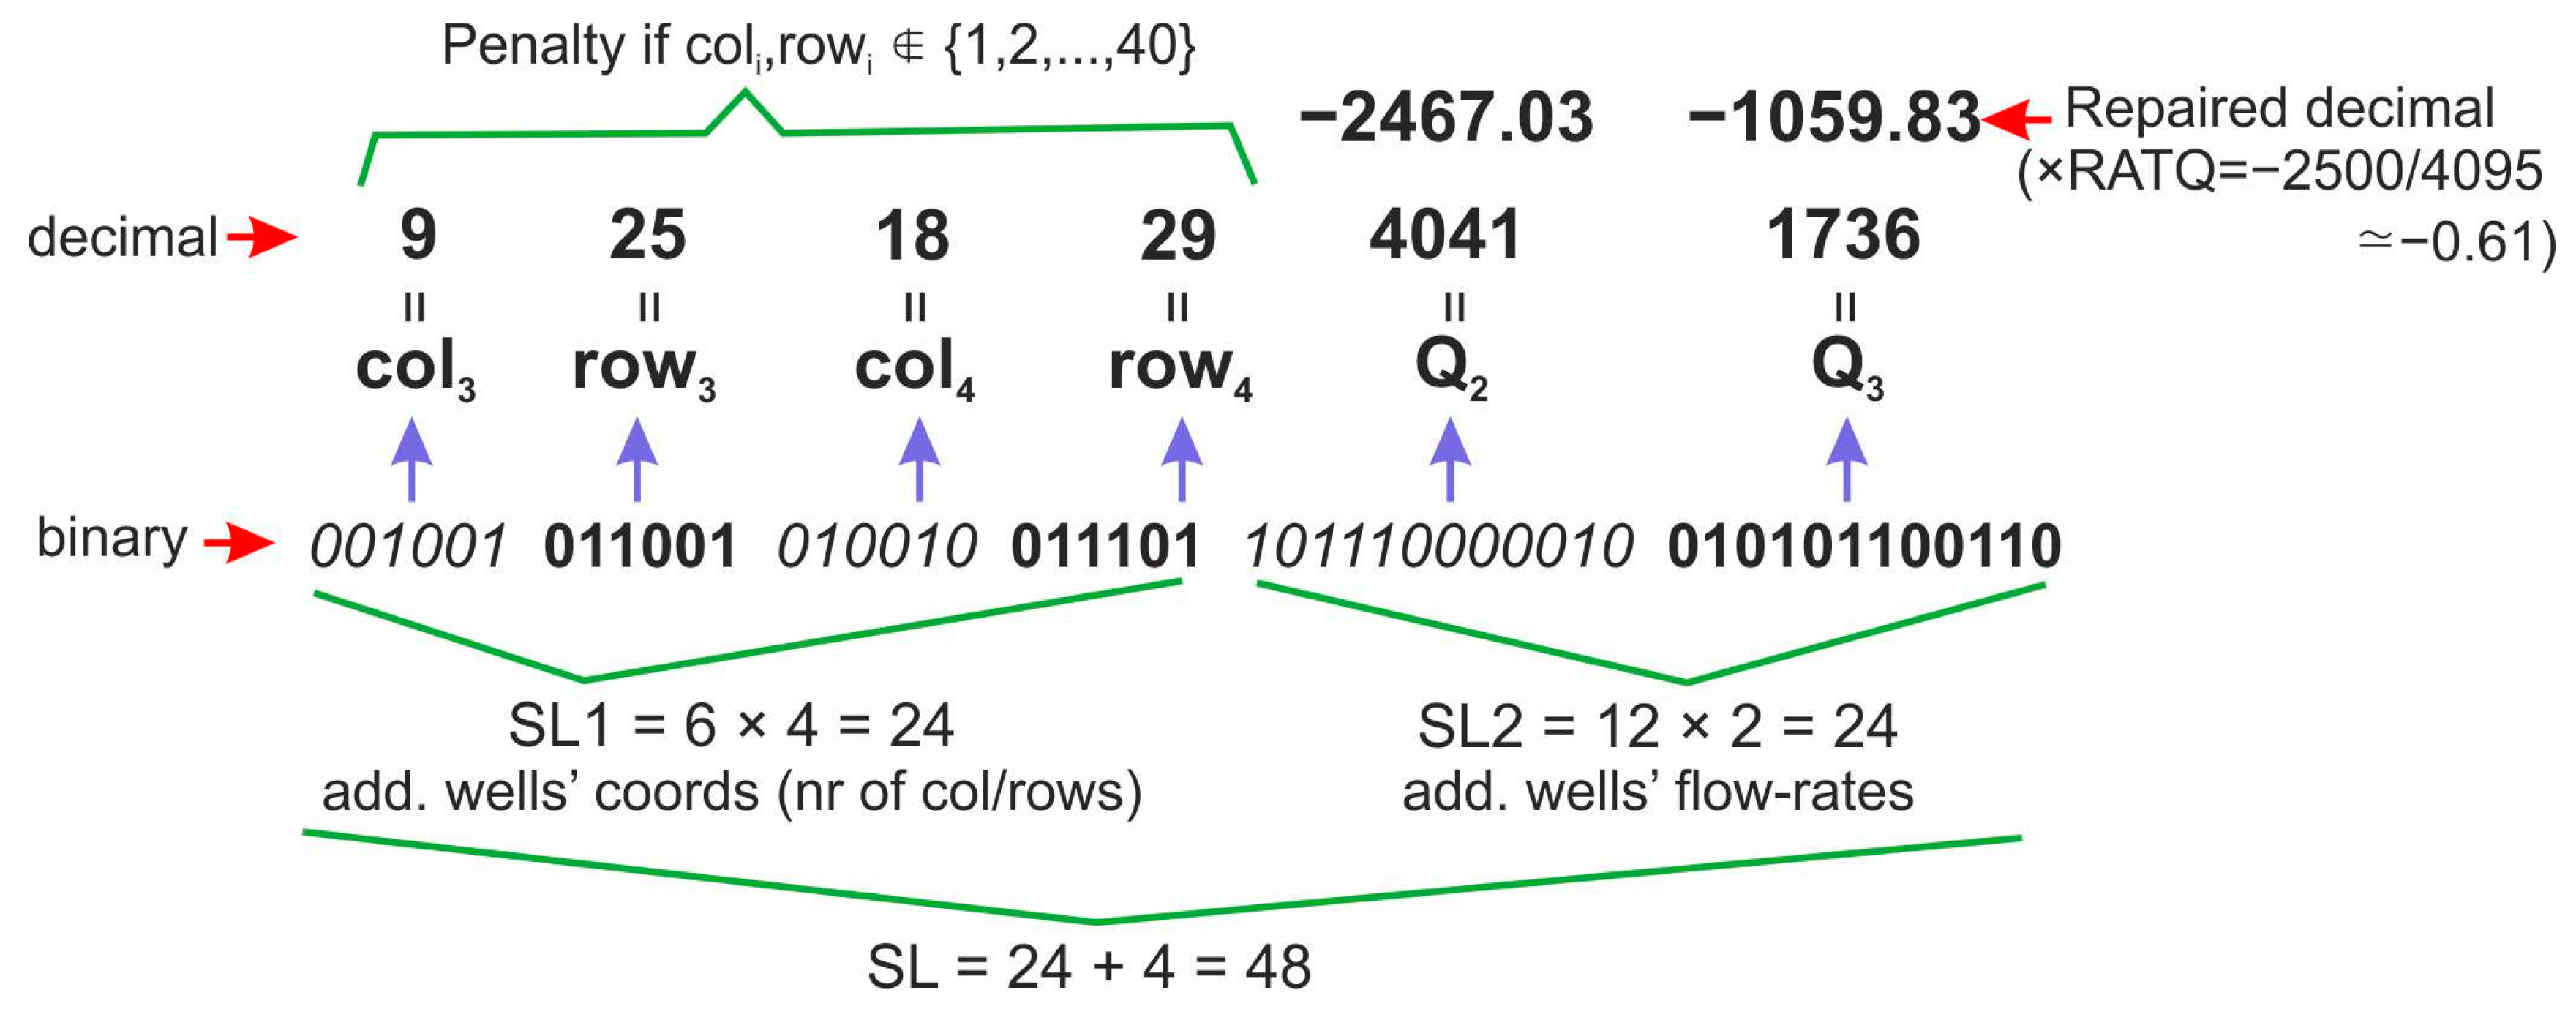
Simple GAs are utilized with a binary genetic representation. That means that chromosomes, namely proposed solutions, are encoded as binary strings. Each chromosome represents the AWs’ coordinates (practically, the respective col and row numbers) and flow rates. Coordinates and flow rates can obtain certain max values in the decimal numeral system; their binary form dictates the max number of digits (string length) each chromosome part requires. The total number of digits (total chromosome/string length) can be calculated. According to C3′ and C4, for AWs it is 1 ≤ coli, rowi ≤ 40 (nominal; i = 2, 3) and 0 ≤ |Qj| ≤ 2500 (m3/d; j = 3, 4).
Table 1 presents the max values of the decision variables in decimal and binary numeral form, the string length of the chromosome part that represents each decision variable, and the decimal value of the max binary number that the specific string part can obtain. The length of each string part that represents the consecutive number of a column/row of an AW is SLX = 6. Thus, the length of the part of all coordinates of AWs is SL1 = 4 · SLX = 24. The length of each part that represents the flow rate of an AW is SLQ = 12. Thus, the length of the part of all flow rates of AWs is SL2 = 2 · SLQ = 24. The total length of a typical binary chromosome is SL = SL1 + SL2 = 24 + 24 = 48. Its structure is presented in Figure 4.
The genetic operators used are (a) selection, featuring the tournament procedure and elitism for the fittest chromosome, (b) crossover, and (c) mutation. The chromosome population is PS = 50, the number of generations is NG = 1000, the selection constant is SC = 3, and the crossover probability is CRP = 0.4. Mutation probability MP values used are based on our previous research [16]. It suggests that values ranging from 2/SL to 2.5/SL (here, 2/48 ≈ 0.042 to 2.5/48 ≈ 0.052) are more efficient in converging to the optimal solution. Since the goal of the optimization process is the identification of several alternative good (sub-optimal) solutions and strategies that may constitute local minima, a broader range of MP values are tested: MP = 0.020–0.045 with a step of 0.005. Thus, six separate runs of the GA are carried out (Run1–Run6).
2.3.3. Constraint Handling
There are several known techniques to handle constraints in GAs. They can be classified as methods of (a) penalization, (b) repair of infeasible solutions, (c) preservation of feasibility, and (d) hybrid techniques [32]. Here, constraints C1–C4 (Equations (2), (3), (5), and (6)) are handled as follows.
C1: The existing well (Wex) must not pump polluted water of a concentration higher than Clim = 50 ppm. This constraint is handled by a category (a) constraint handling technique: during each timestep Δti, the algorithm checks the concentration of the pollutant CWex,Δti in the respective cell of Wex. If it exceeds Clim, a dynamic penalty (Pen1) is imposed. Pen1 is proportional to the concentration excess over the limit and includes a constant term () and a variable term. The latter is the sum of all excessive concentration values over Clim during the study period, multiplied by the constant coefficient . Pen1 is:
where is the constant part of Pen1; is the constant coefficient of the variable part of Pen1; NS is the number of timesteps (it varies from solution to solution as the remediation completion criterion is temporally dynamic: remediation is assumed to conclude when concluded when the aquifer max pollutant concentration Caq,max < Crem = 100 ppm); CWex,t is the pollutant concentration in the existing water supply well during timestep t; Clim is the concentration threshold that should not be exceeded at Wex; δt is a coefficient that is equal to 1 or 0, depending on whether CWex,t > Clim or not, respectively.
C2: All distances between the existing and additional wells and the landfill, in all combinations, should not exceed 300 m. This constraint is also handled by constraint handling technique (a), penalty imposition. The dynamic penalty depends on the number of C3 violations (number of distances larger than 300 m) and on the magnitude of the violation (remaining of each distance after subtraction by Dmin = 300 m):
where N is the number of distances calculated; is the constant part of Pen2; is the constant coefficient of the variable part of Pen2; Di is the ith out of the N total distances calculated; δi is a coefficient that is equal to 1 or 0, depending on whether Di < 300 or not, respectively. ND = 4 is actually the number of all combinations of distances without repetition between Wex, the two AWs (W2 and W3), and the landfill. In the general case, where there are N wells and landfills:
where Nex is the number of existing wells; Naw is the number of AWs; NL is the number of landfills, it is:
N = Nex + Naw + NL
ND = (N − 1)!
C3: Each coordinate (nominal number, consecutive number of col/row in Modflow 40 × 40 grid top view) of AWs should obtain an integer value of 1 to 40. However, after the decoding (binary to decimal) of the binary chromosome, it can obtain integer values from 0 to 63 (Table 1). For this constraint, constraint handling technique (a), penalization, is again utilized: if any coordinate acquires a value equal to zero (0), it instantly converts to a random integer number Ni > 40. Subsequently, for each solution that includes several coordinates with a value of Ni > 40, a dynamic penalty (Pen3) is imposed. Pen3 is proportional to the number of C3 constraint violations:
where CPEN3 = 500,000 is a coefficient for adjusting Pen1 values to reach the order of magnitude of other penalty items in the total penalty function (see Equation (12)); Naw is the number of AWs (nominal); Xj and Yj are the abscissa (col number in the 80 × 80 Modflow top view grid) and the ordinate (row number in the Modflow grid) of AWj (j = 3, 4), respectively (nominal); maxX and maxY are the max physical value of Xi and Yj, respectively (nominal; here, 40).
C4: Each flow rate of AWs (W2, W3) should obtain a maximum physical value of 2500 m3/d. However, after the decoding (binary to decimal) of the binary chromosome, it can reach 4095 m3/d (Table 1). This possible constraint violation is handled via a category (b) handling technique, repairing infeasible chromosomes/solutions: each Qj ∊ [0,1,2,…,4095] (i = 2, 3) value decoded by the chromosome is multiplied by the RATQ = − 2500/4095 ratio, repairing its value, so that Qj,repair ∊ [0,1,2,…,2500] (j = 2, 3). The negative sign is used as Modflow assigns pumping wells with negative flow rates. Figure 4 actually presents the repair of the flow rates of the AWs in the best solution produced in the six runs.
The total penalty of each solution violating at least one constraint of C1, C2, C3, is given:
where Pen1 is the Penalty item concerning solutions that entail a violation of constraint C3; Pen2 is the Penalty item relating to solutions that involve a violation of constraint C4; Cf1 and Cf2 are weighting factors of Pen1 and Pen2 in the total penalty, respectively (here, Cf1 = 15; Cf2 = 30; Cf3 = 30).
Penalty = Cf1·Pen1 + Cf2·Pen2 + Cf3·Pen3
The optimal assignment of the values of the penalty function parameters (; ; ; ; CPEN3; Cf1; Cf2; Cf3) entails a large set of tests. The criteria that need to be fulfilled are:
- Pen1 parameters’ values (; ) must ensure that the penalty term imposed on solutions violating constraint C1 (no pollution of Wex) is of a dynamic nature and, hence, proportional to the extent of the violation, sorting C1-related unacceptable (“bad”) solutions fairly.
- Pen2 parameters’ values (; ) value must ensure that the penalty term that deals with solutions violating constraint C2 (no distance between wells or a well and the landfill must be less than Dmin) is of a dynamic nature and, hence, proportional to the extent of the violation, sorting C2-related bad solutions fairly.
- Pen3 parameter (CPEN3) value must ensure that the penalty term that deals with solutions violating constraint C3 (no AW’s coordinate out of range) is of a similar order of magnitude as the other penalty terms (Pen1 and Pen2).
- Parameters that are related to the relevant weightings of Pen1, Pen2, and Pen3 in the total Penalty function (Cf1; Cf2; Cf3) as well as the penalty term-specific parameters (; ; ; ) including CPEN3 should be set in such a way that individual penalties (Pen1, Pen2, and Pen3), hence constraints’ importance, are prioritized. Solutions that violate C4 are infeasible and unrealistic due to out-of-range coordinates. They are less welcome than feasible but bad solutions, namely solutions that allow wells to be closer than 300 m to each other or to the landfill (violating C2) or solutions that allow Wex to be polluted (violating C1). The latter two are unfavorable but could occur in a real physical scenario.
- Parameters that are related to the relevant weightings of Pen1, Pen2, and Pen3 in the total Penalty function (Cf1; Cf2; Cf3) as well as the penalty term-specific parameters (; ; ; ) including CPEN3 must be assigned values that also favor acceptable but not optimal solutions (exhibiting high fitness value, namely expensive groundwater resources’ management solutions) over unacceptable (violating C1 or C2) solutions and over infeasible (violating C3) solutions.
- Finally, the minimum penalty rule must apply: the most suitable is the minimum penalty function that can lead to penalty-free optimal solutions in a quick and consistent fashion (e.g., [33]).
3. Results and Discussion
The software application created and used here, “Modflow-GA”, is written in Python, utilizing the “Flopy” package for controlling Modflow. It is part of the “OptiManage” v4 suite for optimal groundwater resources management. “Modflow-GA” is implemented six times (Run 1–6). Each simulation needs 7–8 s. For a population of 50 chromosomes and 1000 generations, the average computational time of each run is approximately 100 h (Intel Core i7 7700 @3.60 GHz; 16 GB RAM @1197 MHz).
The algebraically best solutions of Runs 1–6 (MP values from 0.020 to 0.045, step 0.005) are presented in Table 2. The overall best solution (FV1) is produced by Run 2 (identified solution Nr 19; see Supplementary Material SM4, Sheet 6) in generation 425 of the algorithm. It proposes the operation of two AWs, one positioned at (425 m, 775 m) pumping Qw ≈ 2467.0 m3/d and the other one at (875 m, 575 m) pumping Qe ≈ 1059.8 m3/d with a ratio of Qw/Qe = 2.3/1. All AWs are from now on referred to as “western” and “eastern” instead of Wex or W2 in order not to misidentify identical solutions that only differ in the enumeration of AWs as different. The duration of the remediation process is 310 d (370 + 310 = 680 d after the start of the leak, at the start of the 69th 10-day timestep). The fitness value (FV) of the best solution is FV1 = (2467.033 m3/d + 1059.829 m3/d) × 310 d ≈ 1,093,327 m3. The algebraically optimal solution is not the solution with the lowest total flow rate pumped by additional wells (RUN4; identified solution Nr 24; ΣQ = 2373.6 m3/d) but deviates by +48.66% (+1153.3 m3/d). It is, however, the solution with the lowest remediation duration.
Figure 5a graphically presents the overall best solution. The graph (Figure 5b) presents the temporal progression of the max pollutant concentration CWex at the existing water supply well (Wex) against the limit CWex must not exceed (50 ppm), as well as the max aquifer pollutant concentration Caq,max against the remediation completion threshold Crem = 100 ppm. Supplementary Material SM2 presents the respective video of the full spread progression concerning the algebraically optimal (overall best) solution.
Supplementary Materials SM3 includes all raw result files of all six Modflow_GA applications concerning Runs 1–6 (three “.txt” files per run). Supplementary Materials SM4 presents the same results in an Excel file (sheets 1, 4, 7, 10, 13, and 16 for Runs 1, 2, 3, 4, 5, and 6, respectively), also including relevant FV-generations, ΣQ-generations, and Dur-generations graphs (sheets 2, 5, 8, 11, 14, and 17 for Runs 1, 2, 3, 4, 5, and 6, respectively). The respective graphs for Run 2 that produced the optimal solution are presented in Figure 6. SM4 also includes acceptable only solutions, namely solutions without penalties (sheets 3, 6, 9, 12, 15, and 18 for Runs 1, 2, 3, 4, 5, and 6, respectively).
Further study of all results reveals various versions/alterations of the optimal solution, as well as other management concepts. For example, solution Run2-Nr 18 (see SM4, sheet 6 or SM5, sheet 1), which is actually the 2nd best solution of Run 2 and in general (FV2), exhibits FV2 = 1,093,516 m3 (+189 m3 or +0.02% compared to FV1), identical AWs’ locations, and a trivially higher Qw by 0.6 m3/d, leading to the same remediation duration = 310 d. While this is a meaningless variation of FV1, other variations actually constitute alternative interesting versions of FV1, e.g., Run2-Nr 9, 11th best Run 2, and overall solution (FV11). It exhibits FV11 = 1,107,692 m3 (+14,365 m3 or +2.32% compared to FV1), eastern AW (We) positioned 50 m northern compared to FV1, pumping 1.56% less (−38.5 m3/d), western AW (Ww) in the same location as FV1, pumping 2.53% less (−26.9 m3/d). Total pumping is 1.85% reduced (−65.3 m3/d), while the flow rate distribution between AWs is similar to FV1 Qw/Qe = 2.4 instead of 2.3, and the remediation duration is only 10 d higher (320 instead of 310 d). This is just a small variation of FV1. It could be useful if stored, though, as it would be a great alternative solution if, for example, the proposed location for the construction of Ww was not available due to a posteriori changes (e.g., problems in expropriating or using specific private land). Other solutions are even more diverse and can be thought to constitute different concepts/strategies. For example, Run2-Nr 7, which is the 13th best Run 2 and 45th best overall solution, while retaining the AWs’ locations of FV1, exhibits a 10% reduction in the total pumping flow rate by AWs, with a highly more uneven distribution of flow rates (Qw/Qe = 3.3 instead of 2.3), leading to 100 more days of remediation and a 20% increase in FV (and hence, approximate cost). This solution, which may be classified as a different strategy, also holds value. Unforeseen future constraint variations may occur, e.g., an additional constraint concerning low preferred hydraulic head drawdown in the eastern part of the study area may restrict max pumping flow rates in that area; hence, solutions with lower Qe will be favored.
The above dictates the need for a systematic investigation of all “acceptable” (no penalties) and “good” (e.g., here, exhibiting FV < median) solutions. This way, different management strategies are given explicitly stated criteria that can be identified in various alternative algebraical versions. A detailed post-processing of solutions is presented in Section 3.1 and Section 3.2.
3.1. Systematic Investigation of Solutions
Run 1 produced 41 acceptable solutions (SM4, sheet 3), Run 2 produced 19 (SM4, sheet 6), Run 3 produced 22 (SM4, sheet 9), Run 4 produced 24 (SM4, sheet 12), Run 5 produced 39 (SM4, sheet 15), and Run 6 produced 23 (SM4, sheet 18). In total, Runs 1–6 produced 168 different acceptable (no penalty) solutions. Figure 7 presents the proposed locations of all the additional pumping wells of all 168 acceptable solutions (see SM5, sheet 2), classified only regarding their west–east spatial feature. The radius of each well is proportional to the respective flow rate.
In order to investigate the impact of each decision variable (Xw, Yw, Xe, Ye, Qw, Qe) and total AWs’ flow-rate ΣQ, as well as the remediation duration Dur, the Pearson correlation coefficient (Cc) of each one against FV is calculated together with their standard statistics, median, mean, min, max, standard deviation (Table 3). This is calculated based on all acceptable solutions (Figure 8) and then based on the “best” solutions (Figure 9); these are assumed to be the solutions that exhibit FV < median FV.
3.2. From Solutions to Strategies
Depending on the criteria set, various management strategies for the contaminated aquifer can emerge. If, for example, one compares the best overall solution FV1 with the 13th best overall solution (see SM4 and SM5), that is, to compare the best of Run 2 with the best of Run 5, it is recognized that they are likely different strategies. On the other hand, by comparing the best overall solution with the 11th best overall solution, which are essentially the best (1st) and 11th solution of RUN 2, one observes that they belong to the same strategy; it makes sense to store many different solutions even of the same assumed strategy, as they have, e.g., variations in the location of the additional wells.
The process of identifying different strategies in complex management optimization problems is not straightforward and cannot be easily a priori planned or/and generalized. The various different solutions certainly do not constitute different strategies, while local minima do not necessarily represent different strategies. Even standard classification methods that may identify clusters of solutions based on specific rules do not guarantee a categorization process that reflects real logical management diverse strategies. The critical skill of an expert’s post-processing of results and solutions is required. The systematic investigation of all acceptable, or at least “best” or “good” solutions, irrelevant to the way they are selected, is a required step-by-step process [22].
- Generally identify different strategies;
- Propose the criteria for the initial classification of solutions into strategies;
- Identify the management strategies;
- Re-evaluate the criteria and classification ID needed (e.g., if a strategy includes only a single solution or if some solutions are practically very similar);
- Ultimately, classify solutions into the final strategies.
This process may vary from expert to expert and can be quite objective, but the final result of storing diverse solutions remains unchangeable and is the most important. The studied problem with the current configuration does not offer very diverse optimal solutions and, hence, strategies. The criteria for the strategy identification set here concern the size of the total AWs’ flow rate (ΣQ) and its distribution to the AWs (Qw/Qe), while the locations of the wells, given that they are not very different (see Figure 7), are considered to simply slightly alter the version of each general strategy.
SM5 presents the results of the effort to identify strategies from the solutions that emerged from the series of runs. The 6 runs produced 168 identified different solutions, which are classified as variants of 7 polluted aquifer remediation strategies. SM5 sheet 1 presents the strategies of all 168 acceptable solutions per run, while sheet 2 presents all acceptable solutions stacked. SM5 sheet 3 presents all 168 acceptable solutions classified per strategy. Table 4 (and SM5, sheet 2) presents the best solution for each one of the 7 identified strategies. The best solution is actually the best of Run 2 and is classified as the best Strategy A version. Each solution in Table 4 corresponds to a video of the pollution mass spread (mass transport) and the remediation process’s temporal progression (Supplementary Materials SM2, SM6–SM11). Figure 10 presents the locations of AWs of all solutions that are presented in Figure 7 but classified per strategy. The radius of each well is proportional to its flow rate, while the coupled AWs per solution are connected with a line. Overall statistics per strategy are presented in Table 5, while the frequency of occurrence of each strategy and the run during which it appeared are graphically presented in Figure 11.
3.3. Discussion of Results
From the results and their post-processing, it is evident that the positioning of the additional wells (AWs) is key for the protection of the existing water supply well Wex. Each AW is carefully positioned along the flow paths connecting each leak to Wex, with a deviation to the external direction (especially the western Ww to the west and the eastern We lightly to the east) so that the operation of the AWs does not accelerate the plumes directly towards Wex, also accounting for the given south to north natural groundwater flow. Specifically, Ww is of great importance, as expected, since the western leakage is more extensive. The position of Ww does not vary greatly in the various solutions, as indicated by the value of the standard deviation (see Table 3 and Table 5 and Supplementary Materials SM4 and SM5). The position of We has its own high but lower than Ww significance and, therefore, shows a greater deviation of its coordinate values in the produced solutions (see Table 3 and Table 5 and Supplementary Materials SM4 and SM5). This is also particularly evident in Figure 7.
A similar situation occurs with the flow rates of AWs, but when studying the results of the Pearson correlation coefficient values (Cc or r), one must be careful in their interpretation (Table 3 and Figure 8 and Figure 9). Cc or r for FV-Qw is 0.10995 for all solutions and 0.27564 for the “best” selected ones (FV < median FV). Therefore, there is an absence of a unilateral correlation of the FV value with Qw in both cases. On the other hand, Cc or r for FV-Qe is calculated to be 0.48574 and −0.47675 for all solutions and the “best” ones, respectively. This means that in the full solutions dataset, FV tends to decrease relatively proportionally with Qe, but in the best solutions dataset, FV tends to be relatively inversely proportional to the Qe value. To avoid misinterpretation of these results, the correlation values must be studied under the following perspective: the values used to calculate the correlation coefficients are not random and do not represent the entire search space, hence the full domain of the definition of each variable. These are a group of solutions, each one being the best solution of each generation of the six runs. That is, they are acceptable solutions but relatively poor quality-wise at the beginning (with a large FV in a minimization optimization problem), while later, there are solutions around a local minimum until a new local minimum is found. In this context, the odd conflicting values mentioned indicate the complex nature of the optimization problem with the highly entangled variables. The odd correlations can also be explained by the fact that the problem’s configuration (western leakage larger and differently positioned against Wex than the eastern leak) leaves no room for many locations’ testing for Ww, while the algorithm can more easily test more locations for We (see Figure 7).
Regarding ΣQ and its correlation with FV, it is r(FV-ΣQ) = 0.40204 and −0.10505 for all solutions and the “best”, respectively. No serious conclusion emerges, and only with indirect assumptions/hypotheses, as above, could one interpret these results. On the other hand, the duration of the remediation process (Dur) seems to exhibit higher importance than ΣQ in the hunt for minimized FV. The respective correlation coefficient for FV-Dur is calculated to be 0.66275 and 0.67096 for all solutions and the “best”, respectively. This indicates a consistency for the remediation duration to affect the FV value proportionally in the entire spectrum of directed randomness tests of the GA.
Regarding the values of MP and the degree it affects the convergence to the optimal solution, or at least to the best algebraic solution found in the series of runs of this thesis, no safe conclusions can be drawn, as an extensive series of runs was not performed. However, the best solution emerged for RUN 2 with MP = 0.025, i.e., approximately equal to 1.7/SL, where SL is the chromosome length, supporting our previous research [16] that proposed values of 2–2.5/SL as the best approximations of MP value.
In order for anyone to replicate the results or adjust the methodology in similar or more complex problems, some final remarks are needed. The complexity of the multi-objective optimization problem is proposed to be reduced by the simplification of the representation of the remediation cost by simply linking it to the groundwater volume pumped by additional wells. This converts the problem into a single-objective one. Even simplified, the minimization problem still requires the simplification of the groundwater flow and mass transport model due to the computationally greedy nature of metaheuristic algorithms, like genetic algorithms. This is why a simplified 2D flow and advection–dispersion model is simulated in Modflow (Flopy).
Simple elitist binary genetic algorithms may be used, but they are complemented by a sophisticated post-processing of results/solutions that delivers alternative management strategies. The full proposed methodology includes:
- Conceptual model setup (i.e., steady-state flow, 2D flow field, boundary conditions, advection–dispersion mass transport mechanisms);
- Numerical model set up (Flopy controlling Modflow model in Python);
- Decision variables’ definition (coordinates and flow rates of additional wells);
- The objective function to be minimized delineation (total groundwater volume pumped by additional wells);
- Identification of physical, numerical, and other constraints and selection of suitable constraint handling techniques (penalty imposition, repair of infeasible solutions etc.);
- Development of the simulation–optimization model coupling a metaheuristic optimization method (here, simple elitist genetic algorithms with the Flopy-controlled Modflow groundwater flow and mass transport numerical model);
- Execution of a series of test simulations to find the fittest Penalty parameters;
- Execution of final simulations storing all results/solutions.
- Post-processing of results, defining and selecting “acceptable” and “good” or “best” solutions (e.g., solutions exhibiting FV < median FV);
- General identification of various strategies in the selected solutions’ dataset;
- Proposal of criteria for the initial classification of solutions into strategies and identification of management strategies. Re-evaluation of criteria and classification as much as needed, and classification of solutions into final strategies.
Constrained, nonlinear, stochastic, multi-objective water resources management optimization problems, like the one studied here, are extremely complex. Thus, state-of-the-art metaheuristic methods cannot guarantee that the algebraically optimal solution will be discovered. Moreover, the necessary simplification of the conceptual and numerical models, due to the computation load metaheuristics entail, adds more uncertainties. These are further enhanced by the sensitivity of optimization results to external environmental, socioeconomic, political, and geopolitical factors, e.g., climate change, political unrest, conflicts, poor or non-existent management policies, and lack of central planning. Thus, the search for the algebraically optimal solution is myopic.
In this context, the real practical goal of this research and similar strategy-based environmental management problems is not just to find a single optimal solution shadowed by the intrinsic and acquired uncertainties mentioned above but to create a pool of viable alternative (sub)optimal strategies. This approach provides a robust optimization and decision support tool for management authorities, especially useful in the design phase of pollution control measures but also to be prepared in case of emergency remediation planning due to sudden pollution detection. The methodology developed here generates numerous algebraic variations of pollution control and pump-and-treat strategies, offering decision-makers a broad spectrum of choices, varying in remediation duration, positioning of additional pumping wells, and their operation (flow rates) in a simplified but inclusive and easy-to-comprehend fashion. This variety is particularly advantageous when initial design parameters change, such as modifications in constraints or budget alterations, allowing for adaptive and flexible management without the need for initiating new costly and time-consuming investigations. Examples of such variations in external factors in the studied problem could be the following (for more, investigate SM5, sheet 2):
- Constructing a pumping well at the location proposed by the optimal solution (FV1; Strategy A; see Supplementary Materials SM5, sheet 2) in the east (W3 in Figure 3) could be prohibited. The reasons could be problems in expropriating or using specific private land or false geological data of specific locations. In this situation, the managing authorities could easily select another solution with the eastern well We in a different area, like the solution of Run2-Nr11, which is a Strategy A identical solution with the only exception of We positioned 50 m to the east, with an additional burden of FV +1.31% and a prolonged remediation period of just 10 days while practically retaining the flow rates of additional wells. If this is not enough, the decision makers can select a more diverse solution, e.g., the solution of Run5-Nr24, which is a Strategy G solution with +5.92 FV value and We positioned 50 m to the north and 100 m to the east (see SM5, sheet 2).
- Solution Run5-Nr24 also features Ww positioned 50 m to the west and 100 m to the north, exhibiting lower flow rates of additional wells (−18% in ΣQ values). Thus, it could serve as an alternative solution/strategy if the construction of a well in the west area that FV1 suggests is prohibited or if additional hydraulic head drawdown constraints or an energy cost increase (like the one experienced in recent years) dictated decreased pumping costs and, hence, flow rates.
4. Conclusions
Current research demonstrates that genetic algorithms can effectively optimize the location and operation of additional pumping wells in a confined aquifer remediation scenario. This optimization significantly reduces the remediation cost while maintaining the operational integrity of existing water resources. The simulation–optimization Modflow_GA modeling approach provides valuable insights into the dynamics of pollutant dispersion in confined aquifers, highlighting the critical factors influencing remediation effectiveness and efficiency in pump-and-treat or/and hydraulic pollution control. The research confirms the practical applicability of simulation–optimization models in real-world scenarios, where decision-makers can utilize these strategies to plan and execute aquifer remediation with optimized resource utilization. Findings indicate that using advanced simulation techniques combined with genetic algorithms can substantially lower the costs associated with extensive groundwater remediation projects by simply minimizing the volume of water that needs to be treated. Research illustrates that the adoption of simulation–optimization frameworks in environmental policy and management strategies can ensure the sustainable and cost-effective remediation of polluted aquifers. It also produces the benefits of using sophisticated post-processing analyses of simulation-optimization results to identify optimal and sub-optimal remediation strategies, offering a robust decision-support tool for complex environmental management problems.
As far as future research is concerned, the methodology of the coupled simulation–optimization model, complemented by detailed expert-based post-processing and meta-analysis of results/solutions, creating a pool of (sub)optimal solutions classified into strategies can be updated and enhanced. The simplified objective function to be minimized can be more realistic, representing the real remediation cost, including additional pumping well construction and operation cost and the pipe network conveying the pumped polluted water to the wastewater treatment facility. An investigation could be carried out concerning the energy cost and how its variation can affect the optimal and sub-optimal solutions and strategies. Also, there could be a provision for the return of a part of the treated/filtered water to the aquifer to prevent a significant drop in water levels, using recharging wells, where the positions and flows of these should be subject to optimization. Additionally, constraints can be added concerning the max limit of hydraulic head drawdown in the aquifer, while solutions could be filtered by testing them in emergency potential scenarios of sudden short interruptions in the operation of one of the additional pumping wells so that solutions are cost-effective but also safe. The simulation of a complex coupled shallow and confined leaky aquifer (divided by a semi-permeable layer) or the addition of fractures would also add to the realism and, of course, the complexity of the problem. Moreover, further research should be carried out into integrating more complex hydrogeological variables into the modeling process to enhance the accuracy and applicability of the results in diverse geological settings. Finally, it would be beneficial to explore the application of multi-objective optimization algorithms, such as NSGA-II [33], as a means to evaluate their performance in comparison to the current methodology within the context of this intricate aquifer management problem.
Supplementary Materials
The supporting information can be downloaded at: https://drive.google.com/drive/folders/13WP_Our3w_YeX3R_PMf0LahHkAMfisMp?usp=sharing (accessed on 7 March 2024), SM0: List of Supplementary Materials with titles and descriptions.pdf; SM1: Video1-do_nothing_scenario.wmv; SM2: Video2-Best_sol_Strategy_A.wmv; SM3: raw output files of Modflow_GA runs.zip; SM4: Runs_1-6_raw_results.xlsx; SM5: Post-processed_results.xlsx; SM6: Video3-Best_sol_Strategy_B.wmv; SM7: Video4-Best_sol_Strategy_C.wmv; SM8: Video5-Best_sol_Strategy_D.wmv; SM9: Video6-Best_sol_Strategy_E.wmv; SM10: Video7-Best_sol_Strategy_F.wmv; SM11: Video8-Best_sol_Strategy_G.wmv.
Funding
This research received no external funding.
Data Availability Statement
All data used in this paper are synthetically simulated as the studied problem and aquifer are theoretical. All parameters and relevant input variable values are cited in the paper.
Conflicts of Interest
The author declare no conflicts of interest.
References
- GIDEON: Global Infectious Diseases and Epidemiology Online Network. Available online: www.gideononline.com (accessed on 1 April 2024).
- Kulinkina, A.V.; Shinee, E.; Guzmán Herrador, B.R.; Nygård, K.; Schmoll, O. The Situation of Water-Related Infectious Diseases in the Pan-European Region; World Health Organization. Regional Office for Europe: Copenhagen, Denmark, 2016; Available online: https://apps.who.int/iris/handle/10665/329534 (accessed on 2 April 2024).
- Craun, G.F.; Brunkard, J.M.; Yoder, J.S.; Roberts, V.A.; Carpenter, J.; Wade, T.; Calderon, R.L.; Roberts, J.M.; Beach, M.J.; Roy, S.L. Causes of outbreaks associated with drinking water in the United States from 1971 to 2006. Clin. Microbiol. Rev. 2010, 23, 507–528. [Google Scholar] [CrossRef]
- Williams, P.T. Waste Treatment and Disposal; John Wiley & Sons: Hoboken, NJ, USA, 2005. [Google Scholar]
- Gupta, S.; Mohan, K.; Prasad, R.; Gupta, S.; Kansal, A. Solid waste management in India: Options and opportunities. Resour. Conserv. Recycl. 1998, 24, 137–154. [Google Scholar] [CrossRef]
- Renou, S.; Givaudan, J.; Poulain, S.; Dirassouyan, F.; Moulin, P. Landfill leachate treatment: Review and opportunity. J. Hazard. Mater. 2008, 150, 468–493. [Google Scholar] [CrossRef]
- Tatsi, A.A.; Zouboulis, A.I. A field investigation of the quantity and quality of leachate from a municipal solid waste landfill in a Mediterranean climate (Thessaloniki, Greece). Adv. Environ. Res. 2002, 6, 207–219. [Google Scholar] [CrossRef]
- Mayer, A.S.; Kelley, C.T.; Miller, C.T. Optimal design for problems involving flow and transport phenomena in saturated subsurface systems. Adv. Water Resour. 2002, 25, 1233–1256. [Google Scholar] [CrossRef]
- Medina, M.A., Jr. Modeling ground water contamination and surface-subsurface interactions. In Ground Water Pollution: Proceedings of the International Conference on Water and Environment (WE-2003), December 15–18, 2003, Bhopal, India; Singh, V.P., Yadava, R.N., Eds.; Allied Publishers: Bhopal, India, 2003; p. 401e18. [Google Scholar]
- Mulligan, A.E.; Ahlfeld, D.P. Advective control of groundwater contaminant plumes: Model development and comparison to hydraulic control. Water Resour. Res. 1999, 35, 2285–2294. [Google Scholar] [CrossRef]
- Guan, J.; Aral, M.M. Optimal remediation with well locations and pumping rates selected as continuous decision variables. J. Hydrol. 1999, 221, 20–42. [Google Scholar] [CrossRef]
- Gorelick, S.M. Sensitivity analysis of optimal groundwater contaminant capture curves: Spatial variability and robust solutions. In Proceedings of the National Water Well Association Conference: Solving Groundwater Problems with Models, Denver, CO, USA, 10–12 February 1987; National Water Well Association: Westerville, OH, USA, 1987; p. 133e46. [Google Scholar]
- Bayer, P.; Finkel, M.; Teutsch, G. Reliability of hydraulic performance and cost estimates of barrier-supported pump-and-treat systems in heterogeneous aquifers. In Proceedings of the Calibration and Reliability in Groundwater Modelling: A Few Steps Closer to Reality, Prague, Czech Republic, 17–20 June 2002; Ka, K., Hrkal, Z., Eds.; IAHS Publisher: Oxon, UK, 2002. no 227. p. 331e8. [Google Scholar]
- Nagkoulis, N.; Katsifarakis, K.L. Cost minimization of groundwater supply to a central tank. Water Supply 2021, 22, 2055–2066. [Google Scholar] [CrossRef]
- Antoniou, M.; Theodosiou, N.; Karakatsanis, D. Coupling groundwater simulation and optimization models, using MODFLOW and Harmony Search Algorithm. Desalination Water Treat. 2017, 86, 297–304. [Google Scholar] [CrossRef]
- Kontos, Y.N.; Katsifarakis, K.L. Optimization of Management of Polluted Fractured Aquifers Using Genetic Algorithms. Eur. Water 2012, 40, 31–42. [Google Scholar]
- Kontos, Y.N.; Katsifarakis, K.L. Optimal Management of a Theoretical Coastal Aquifer with Combined Pollution and Salinization Problems, Using Genetic Algorithms. Energy 2017, 136, 32–44. [Google Scholar] [CrossRef]
- Kontos, Y.N.; Katsifarakis, K.L. Genetic Algorithms in Polluted Aquifers’ Management. Transactions on Information Science and Applications. World Sci. Eng. Acad. Soc. 2017, 14, 190–200. [Google Scholar]
- Nagkoulis, N.; Kontos, Y.N.; Katsifarakis, K.L. Pumping schedule assignment using chromatic graphs to reduce groundwater pumping energy consumption. Water Supply 2022, 22, 7618–7634. [Google Scholar] [CrossRef]
- Nagkoulis, N.; Katsifarakis, K.L. Using Alternate Pumping and Cooperative Game Theory to Reduce Sea Water Intrusion. Groundwater 2023, 61, 35–43. [Google Scholar] [CrossRef] [PubMed]
- Kontos, Y.N.; Kassandros, T.D.; Perifanos, K.; Karampasis, M.; Katsifarakis, K.L.; Karatzas, K.D. Machine Learning for Groundwater Pollution Source Identification and Monitoring Network Optimization. Neural Comput. Appl. 2022, 34, 19515–19545. [Google Scholar] [CrossRef] [PubMed]
- Kontos, Y.N.; Rompis, I.; Karpouzos, D. Optimal pollution control and pump-and-fertilize strategies in a nitro-polluted aquifer, using Genetic Algorithms and Modflow. Agronomy 2023, 13, 1534. [Google Scholar] [CrossRef]
- Langevin, C.D.; Hughes, J.D.; Banta, E.R.; Provost, A.M.; Niswonger, R.G.; Panday, S. MODFLOW 6 Modular Hydrologic Model Version 6.2.2; U.S. Geological Survey Software Release; U.S. Geological Survey: Reston, VA, USA, 2021.
- Katsifarakis, K.L. Flow Simulation and Optimal Management of Groundwater Resources. The Balance between Accuracy and Computational Efficiency. Groundw. Model. Manag. Contam. 2008, 10, 291–308. [Google Scholar]
- Janetti, E.B.; Guadagnini, L.; Riva, M.; Guadagnini, A. Global sensitivity analyses of multiple conceptual models with uncertain parameters driving groundwater flow in a regional-scale sedimentary aquifer. J. Hydrol. 2019, 574, 544–556. [Google Scholar] [CrossRef]
- Schiavo, M. The role of different sources of uncertainty on the stochastic quantification of subsurface discharges in heterogeneous aquifers. J. Hydrol. 2023, 617, 128930. [Google Scholar] [CrossRef]
- USGS. Python Package for Creating, Running, and Post-Processing MODFLOW-Based Models. USGS Flopy. 2021. Available online: https://www.usgs.gov/software/flopy-python-package-creating-running-and-post-processing-modflow-based-models (accessed on 20 August 2022).
- USGS. Flopy Documentation 3.3.4. 2021. Available online: https://flopy.readthedocs.io/en/3.3.4/index.html (accessed on 20 August 2022).
- Bakker, M.; Post, V.; Langevin, C.D.; Hughes, J.D.; White, J.T.; Starn, J.J.; Fienen, M.N. FloPy: Python Package for Creating, Running, and Post-Processing MODFLOW-Based Models; U.S. Geological Survey: Reston, VA, USA, 2016.
- Bakker, M.; Post, V.; Langevin, C.D.; Hughes, J.D.; White, J.T.; Starn, J.J.; Fienen, M.N. Scripting MODFLOW Model Development Using Python and FloPy. Groundwater 2016, 54, 733–739. [Google Scholar] [CrossRef]
- Bakker, M.; Post, V.; Langevin, C.D.; Hughes, J.D.; White, J.T.; Leaf, A.T.; Paulinski, S.R.; Larsen, J.D.; Toews, M.W.; Morway, E.D.; et al. FloPy v3.3.4. USGS 2021. Available online: https://doi.org/10.5066/F7BK19FH (accessed on 10 November 2023).
- Le Riche, R.; Knopf-Lenoir, C.; Haftka, R.T. A segregated genetic algorithm for constrained structural optimization. In Proceedings of the 6th International Conference on Genetic Algorithms, San Francisco, CA, USA, 15–19 July 1995; Morgan Kaufmann Publishers Inc.: Burlington, MA, USA, 1995; pp. 558–565. [Google Scholar]
- Deb, K.; Pratap, A.; Agarwal, S.; Meyarivan, T. A fast and elitist multiobjective genetic algorithm: NSGA-II. IEEE Trans. Evol. Comput. 2002, 6, 182–197. [Google Scholar] [CrossRef]
Figure 1.
An extremely detailed graphical abstract of the proposed methodology to investigate optimal remediation strategies of a polluted aquifer via a proposed simulation–optimization model, coupling a genetic algorithm and MODFLOW.
Figure 1.
An extremely detailed graphical abstract of the proposed methodology to investigate optimal remediation strategies of a polluted aquifer via a proposed simulation–optimization model, coupling a genetic algorithm and MODFLOW.

Figure 2.
Theoretical study field including the top view of the aquifer and its layering and characteristics, the existing pumping well, the landfill, the pipeline conveying the leachate to the wastewater treatment plant, the leaks, and the boundaries.
Figure 2.
Theoretical study field including the top view of the aquifer and its layering and characteristics, the existing pumping well, the landfill, the pipeline conveying the leachate to the wastewater treatment plant, the leaks, and the boundaries.

Figure 3.
(a) Concentration (C) map of the last day of leaks (370d; simulation video as Supplementary Materials SM1). (b) Concentration map of the predicted day of max C at Wex (1000th). (c) CWex and max Caquifer vs. Time.
Figure 3.
(a) Concentration (C) map of the last day of leaks (370d; simulation video as Supplementary Materials SM1). (b) Concentration map of the predicted day of max C at Wex (1000th). (c) CWex and max Caquifer vs. Time.

Figure 4.
The chromosome of the best-produced solution, representing col/row Nr (coords) and flow rates of additional wells corresponding to certain decimal values. Not acceptable coords entail a penalty while flow rates are repaired; see Section 2.3.3).
Figure 4.
The chromosome of the best-produced solution, representing col/row Nr (coords) and flow rates of additional wells corresponding to certain decimal values. Not acceptable coords entail a penalty while flow rates are repaired; see Section 2.3.3).

Figure 5.
(a) Best solution of all runs (Strategy A); simulated concentration (C) map of the predicted day of max C at Wex (840d; simulation video as Supplementary Materials SM2). (b) CWex and max Caquifer vs. Time.
Figure 5.
(a) Best solution of all runs (Strategy A); simulated concentration (C) map of the predicted day of max C at Wex (840d; simulation video as Supplementary Materials SM2). (b) CWex and max Caquifer vs. Time.

Figure 6.
(a) FV vs. generations for Run 2 (produced overall best solution). (b) Flow rates of western and eastern additional wells and their sum vs. generations. (c) Remediation duration vs. generations.
Figure 6.
(a) FV vs. generations for Run 2 (produced overall best solution). (b) Flow rates of western and eastern additional wells and their sum vs. generations. (c) Remediation duration vs. generations.

Figure 7.
Proposed locations of all additional wells of the 168 acceptable solutions (see Supplementary Materials SM5, sheet 2; radius of each well is proportional to the respective flow rate).
Figure 7.
Proposed locations of all additional wells of the 168 acceptable solutions (see Supplementary Materials SM5, sheet 2; radius of each well is proportional to the respective flow rate).

Figure 8.
Pearson correlation coefficients of decision variables and FV for all 168 acceptable solutions of all runs (Runs 1–6; see SM5, sheet 5).
Figure 8.
Pearson correlation coefficients of decision variables and FV for all 168 acceptable solutions of all runs (Runs 1–6; see SM5, sheet 5).

Figure 9.
Pearson correlation coefficients of decision variables and FV for “best” (FV < median FV) solutions of all runs (Runs 1–6; see Supplementary Materials SM5, sheet 6).
Figure 9.
Pearson correlation coefficients of decision variables and FV for “best” (FV < median FV) solutions of all runs (Runs 1–6; see Supplementary Materials SM5, sheet 6).

Figure 10.
Proposed locations of all additional wells of the 168 acceptable solutions (Figure 7) classified per strategy (see SM5, sheet 4). Wells radii are proportional to their flow rates, while coupled AWs per solution are connected with a line.
Figure 10.
Proposed locations of all additional wells of the 168 acceptable solutions (Figure 7) classified per strategy (see SM5, sheet 4). Wells radii are proportional to their flow rates, while coupled AWs per solution are connected with a line.

Figure 11.
Frequency of occurrence of each strategy and number of appearances per run.


Table 1.
Max values of decision variables in decimal form; number of digits of each decision variable (string part length); decimal value of max binary number of respective length.
Table 1.
Max values of decision variables in decimal form; number of digits of each decision variable (string part length); decimal value of max binary number of respective length.
| Decision Variable | Decimal Form | Binary Form | String Length (SL) | Max Decimal Value for SL |
|---|---|---|---|---|
| Max coli/rowi (i = 2, 3; nominal) | 40 | 101000 | 6 | 63 |
| Max Qj (j = 2, 3; m3/d) | 2500 | 100111000100 | 12 | 4095 |
Table 2.
Best solutions of Runs 1–6.
| Run | Gen | FV (m3) | Xw (m) | Yw (m) | Xe (m) | Ye (m) | Qw (−m3/d) | Qe (−m3/d) | ΣQ (−m3/d) | Qw/Qe | Dur (d) |
|---|---|---|---|---|---|---|---|---|---|---|---|
| 1 | 975 | 1,326,984 | 325 | 875 | 875 | 625 | 2389.5 | 626.4 | 3015.9 | 3.8 | 440 |
| 2 | 425 | 1,093,327 | 425 | 775 | 875 | 575 | 2467.0 | 1059.8 | 3526.9 | 2.3 | 310 |
| 3 | 993 | 1,327,521 | 325 | 875 | 875 | 625 | 2391.9 | 625.2 | 3017.1 | 3.8 | 440 |
| 4 | 880 | 1,329,231 | 325 | 925 | 875 | 675 | 427.4 | 1946.3 | 2373.6 | 0.2 | 560 |
| 5 | 682 | 1,115,409 | 375 | 875 | 875 | 625 | −2134.3 | −801.0 | 2935.3 | 2.7 | 380 |
| 6 | 936 | 1,326,716 | 325 | 875 | 875 | 625 | −2389.5 | −625.8 | 3015.3 | 3.8 | 440 |
Abbreviations: gen: generation of solution; FV: fitness value; Xw, Yw, Xe, Ye: coordinates of west and east additional wells; Qw, Qe: flow rates of west and east additional well; ΣQ: total flow rate of additional wells; Dur: remediation duration.
Table 3.
Pearson correlation coefficients (Cc) for all scenarios between FV and variables.
| Statistics | FV (m3) | Xw (m) | Yw (m) | Xe (m) | Ye (m) | Qw (−m3/d) | Qe (−m3/d) | ΣQ (−m3/d) | Dur (d) |
|---|---|---|---|---|---|---|---|---|---|
| median | 1,355,913 | 325 | 875 | 875 | 625 | 2340.0 | 875.5 | 3055.6 | 440 |
| mean | 1,390,516 | 348 | 875 | 892 | 615 | 2275.0 | 840.6 | 3115.9 | 449 |
| min | 1,093,327 | 325 | 775 | 775 | 475 | 1798.6 | 427.4 | 2373.6 | 310 |
| max | 2,221,325 | 425 | 1025 | 975 | 725 | 2498.8 | 1782.1 | 3882.8 | 590 |
| st.dev | 211,091 | 34 | 45 | 34 | 57 | 207.9 | 247.1 | 355.4 | 67 |
| * r(FV vs. ?) all | N/A | N/A | N/A | N/A | N/A | 0.10995 | 0.48574 | 0.40204 | 0.66275 |
| ** r(FV vs. ?) best | N/A | N/A | N/A | N/A | N/A | 0.27564 | −0.47675 | −0.10505 | 0.67096 |
* for all solutions of RUN 1–6, ** for all solutions with FV < median FV, Abbreviations: Xw, Yw, Xe, Ye: coordinates of west and east additional wells; Qw, Qe: flow rates of west and east additional wells; ΣQ: total flow-rate of additional wells; Dur: remediation duration.
Table 4.
Best solution of each one of the seven strategies (A–G). See respective videos of the solutions’ corresponding remediation process in Supplementary Materials SM2 and SM6–SM11.
Table 4.
Best solution of each one of the seven strategies (A–G). See respective videos of the solutions’ corresponding remediation process in Supplementary Materials SM2 and SM6–SM11.
| RUN | Nr | FV (m3) | Rank (of 168) | Xw (m) | Yw (m) | Xe (m) | Ye (m) | Qw (–m3/d) | Qe (–m3/d) | ΣQ (–m3/d) | Qw/Qe | Dur (d) | Strategy |
|---|---|---|---|---|---|---|---|---|---|---|---|---|---|
| 2 | 19 | 1,093,327 | 1 | 425 | 775 | 875 | 575 | 2467.0 | 1059.8 | 3526.9 | 2.3 | 310 | A |
| 2 | 7 | 1,302,589 | 45 | 425 | 775 | 875 | 575 | 2431.0 | 746.0 | 3177.0 | 3.3 | 410 | B |
| 2 | 6 | 1,418,388 | 112 | 425 | 775 | 875 | 575 | 1803.4 | 685.0 | 2488.4 | 2.6 | 570 | C |
| 1 | 22 | 1,610,269 | 140 | 325 | 875 | 925 | 525 | 2493.3 | 1251.5 | 3744.8 | 2.0 | 430 | D |
| 3 | 5 | 1,628,700 | 147 | 325 | 925 | 925 | 575 | 2175.8 | 1017.7 | 3193.5 | 2.1 | 510 | Ε |
| 4 | 24 | 1,329,231 | 59 | 325 | 925 | 875 | 675 | 1946.3 | 427.4 | 2373.6 | 4.6 | 560 | F |
| 5 | 39 | 1,115,409 | 12 | 375 | 875 | 875 | 625 | 2134.3 | 801.0 | 2935.3 | 2.7 | 380 | G |
Abbreviations: FV: fitness value; Xw, Yw, Xe, Ye: coordinates of west and east additional wells; Qw, Qe: flow rates of west and east additional wells; ΣQ: total flow rate of additional wells; Dur: remediation duration.
Table 5.
Overall statistics per strategy.
| 7 Strategies (168 Versions) | Stats | FV (m3) | Xw (m) | Yw (m) | Xe (m) | Ye (m) | Qw (–m3/d) | Qe (–m3/d) | ΣQ (–m3/d) | Qw/Qe | Dur (d) |
|---|---|---|---|---|---|---|---|---|---|---|---|
| Strategy A (17 versions) | mean | 1,234,592 | 396 | 810 | 890 | 581 | 2459.6 | 1044.4 | 3504.1 | 2.4 | 352 |
| median | 1,104,957 | 425 | 775 | 875 | 575 | 2467.6 | 1037.2 | 3511.0 | 2.3 | 320 | |
| min | 1,093,327 | 325 | 775 | 875 | 575 | 2422.5 | 1016.5 | 3448.1 | 2.3 | 310 | |
| max | 1,739,621 | 425 | 975 | 925 | 625 | 2498.2 | 1068.4 | 3535.4 | 2.5 | 500 | |
| st.dev | 214,194 | 46 | 59 | 23 | 16 | 25.8 | 19.0 | 31.2 | 0.1 | 61 | |
| Strategy B (69 versions) | mean | 1,443,741 | 325 | 896 | 888 | 600 | 2411.1 | 744.0 | 3155.1 | 3.5 | 458 |
| median | 1,396,319 | 325 | 875 | 875 | 625 | 2434.1 | 784.5 | 3154.8 | 3.6 | 440 | |
| min | 1,326,716 | 325 | 875 | 875 | 525 | 2160.0 | 625.2 | 2952.4 | 2.5 | 420 | |
| max | 1,870,427 | 325 | 1025 | 925 | 625 | 2487.2 | 882.2 | 3340.0 | 4.0 | 560 | |
| st.dev | 145,411 | 0 | 43 | 22 | 29 | 79.5 | 88.5 | 123.6 | 0.4 | 40 | |
| Strategy C (6 versions) | mean | 1,495,433 | 425 | 775 | 875 | 558 | 1801.8 | 829.7 | 2631.5 | 2.2 | 568 |
| median | 1,508,938 | 425 | 775 | 875 | 575 | 1803.4 | 872.4 | 2670.9 | 2.1 | 570 | |
| min | 1,418,388 | 425 | 775 | 875 | 475 | 1798.5 | 685.0 | 2488.4 | 2.0 | 560 | |
| max | 1,568,620 | 425 | 775 | 875 | 575 | 1803.4 | 901.1 | 2704.5 | 2.6 | 580 | |
| st.dev | 47,998 | 0 | 0 | 0 | 37 | 2.3 | 85.1 | 84.3 | 0.2 | 7 | |
| Strategy D (22 versions) | mean | 1,730,032 | 325 | 875 | 884 | 543 | 2388.6 | 1322.6 | 3711.3 | 1.8 | 467 |
| median | 1,668,437 | 325 | 875 | 925 | 525 | 2459.7 | 1281.1 | 3739.6 | 1.9 | 445 | |
| min | 1,610,269 | 325 | 875 | 775 | 525 | 1982.9 | 1251.5 | 3457.9 | 1.1 | 430 | |
| max | 2,221,325 | 325 | 875 | 925 | 625 | 2498.8 | 1782.1 | 3882.8 | 2.0 | 590 | |
| st.dev | 159,148 | 0 | 0 | 58 | 39 | 151.0 | 122.4 | 89.0 | 0.2 | 49 | |
| Strategy E (4 versions) | mean | 1,731,232 | 325 | 938 | 925 | 575 | 2169.4 | 1022.3 | 3191.7 | 2.1 | 543 |
| median | 1,729,780 | 325 | 950 | 925 | 575 | 2180.7 | 1017.7 | 3198.4 | 2.1 | 540 | |
| min | 1,628,700 | 325 | 875 | 925 | 575 | 2130.6 | 1017.7 | 3166.7 | 2.1 | 510 | |
| max | 1,836,667 | 325 | 975 | 925 | 575 | 2185.6 | 1036.0 | 3203.3 | 2.1 | 580 | |
| st.dev | 86,375 | 0 | 41 | 0 | 0 | 22.7 | 7.9 | 15.0 | 0.0 | 29 | |
| Strategy F (11 versions) | mean | 1,333,812 | 325 | 925 | 875 | 675 | 1960.4 | 433.3 | 2393.7 | 4.5 | 557 |
| median | 1,332,308 | 325 | 925 | 875 | 675 | 1946.9 | 432.2 | 2379.1 | 4.5 | 560 | |
| min | 1,329,231 | 325 | 925 | 875 | 675 | 1946.3 | 427.4 | 2373.6 | 4.5 | 550 | |
| max | 1,339,408 | 325 | 925 | 875 | 675 | 1992.7 | 442.6 | 2435.3 | 4.6 | 560 | |
| st.dev | 3576 | 0 | 0 | 0 | 0 | 20.0 | 5.2 | 25.0 | 0.0 | 4 | |
| Strategy G (39 versions) | mean | 1,216,487 | 375 | 881 | 906 | 658 | 2075.6 | 837.8 | 2913.4 | 2.5 | 418 |
| median | 1,159,719 | 375 | 875 | 925 | 675 | 2091.0 | 821.1 | 2912.1 | 2.5 | 390 | |
| min | 1,115,409 | 375 | 875 | 825 | 575 | 1929.2 | 784.5 | 2714.3 | 2.2 | 380 | |
| max | 1,609,737 | 375 | 925 | 975 | 725 | 2164.2 | 907.8 | 3062.9 | 2.7 | 530 | |
| st.dev | 131,585 | 0 | 17 | 39 | 51 | 78.9 | 45.0 | 99.5 | 0.1 | 51 |
Abbreviations: FV: fitness value; Xw, Yw, Xe, Ye: coordinates of west and east additional wells; Qw, Qe: flow rates of west and east additional wells; ΣQ: total flow rate of additional wells; Dur: remediation duration.
Disclaimer/Publisher’s Note: The statements, opinions and data contained in all publications are solely those of the individual author(s) and contributor(s) and not of MDPI and/or the editor(s). MDPI and/or the editor(s) disclaim responsibility for any injury to people or property resulting from any ideas, methods, instructions or products referred to in the content. |
© 2024 by the author. Licensee MDPI, Basel, Switzerland. This article is an open access article distributed under the terms and conditions of the Creative Commons Attribution (CC BY) license (https://creativecommons.org/licenses/by/4.0/).
Share and Cite
MDPI and ACS Style
Kontos, Y.Ν. A Simulation–Optimization Model for Optimal Aquifer Remediation, Using Genetic Algorithms and MODFLOW. Hydrology 2024, 11, 60. https://doi.org/10.3390/hydrology11050060
AMA Style
Kontos YΝ. A Simulation–Optimization Model for Optimal Aquifer Remediation, Using Genetic Algorithms and MODFLOW. Hydrology. 2024; 11(5):60. https://doi.org/10.3390/hydrology11050060
Chicago/Turabian StyleKontos, Yiannis Ν. 2024. "A Simulation–Optimization Model for Optimal Aquifer Remediation, Using Genetic Algorithms and MODFLOW" Hydrology 11, no. 5: 60. https://doi.org/10.3390/hydrology11050060
Note that from the first issue of 2016, this journal uses article numbers instead of page numbers. See further details here.