
Total Water Storage Change in Cameroon: Calculation, Variability and Link with Onset and Retreat Dates of the Rainy Season


Abstract
:1. Introduction
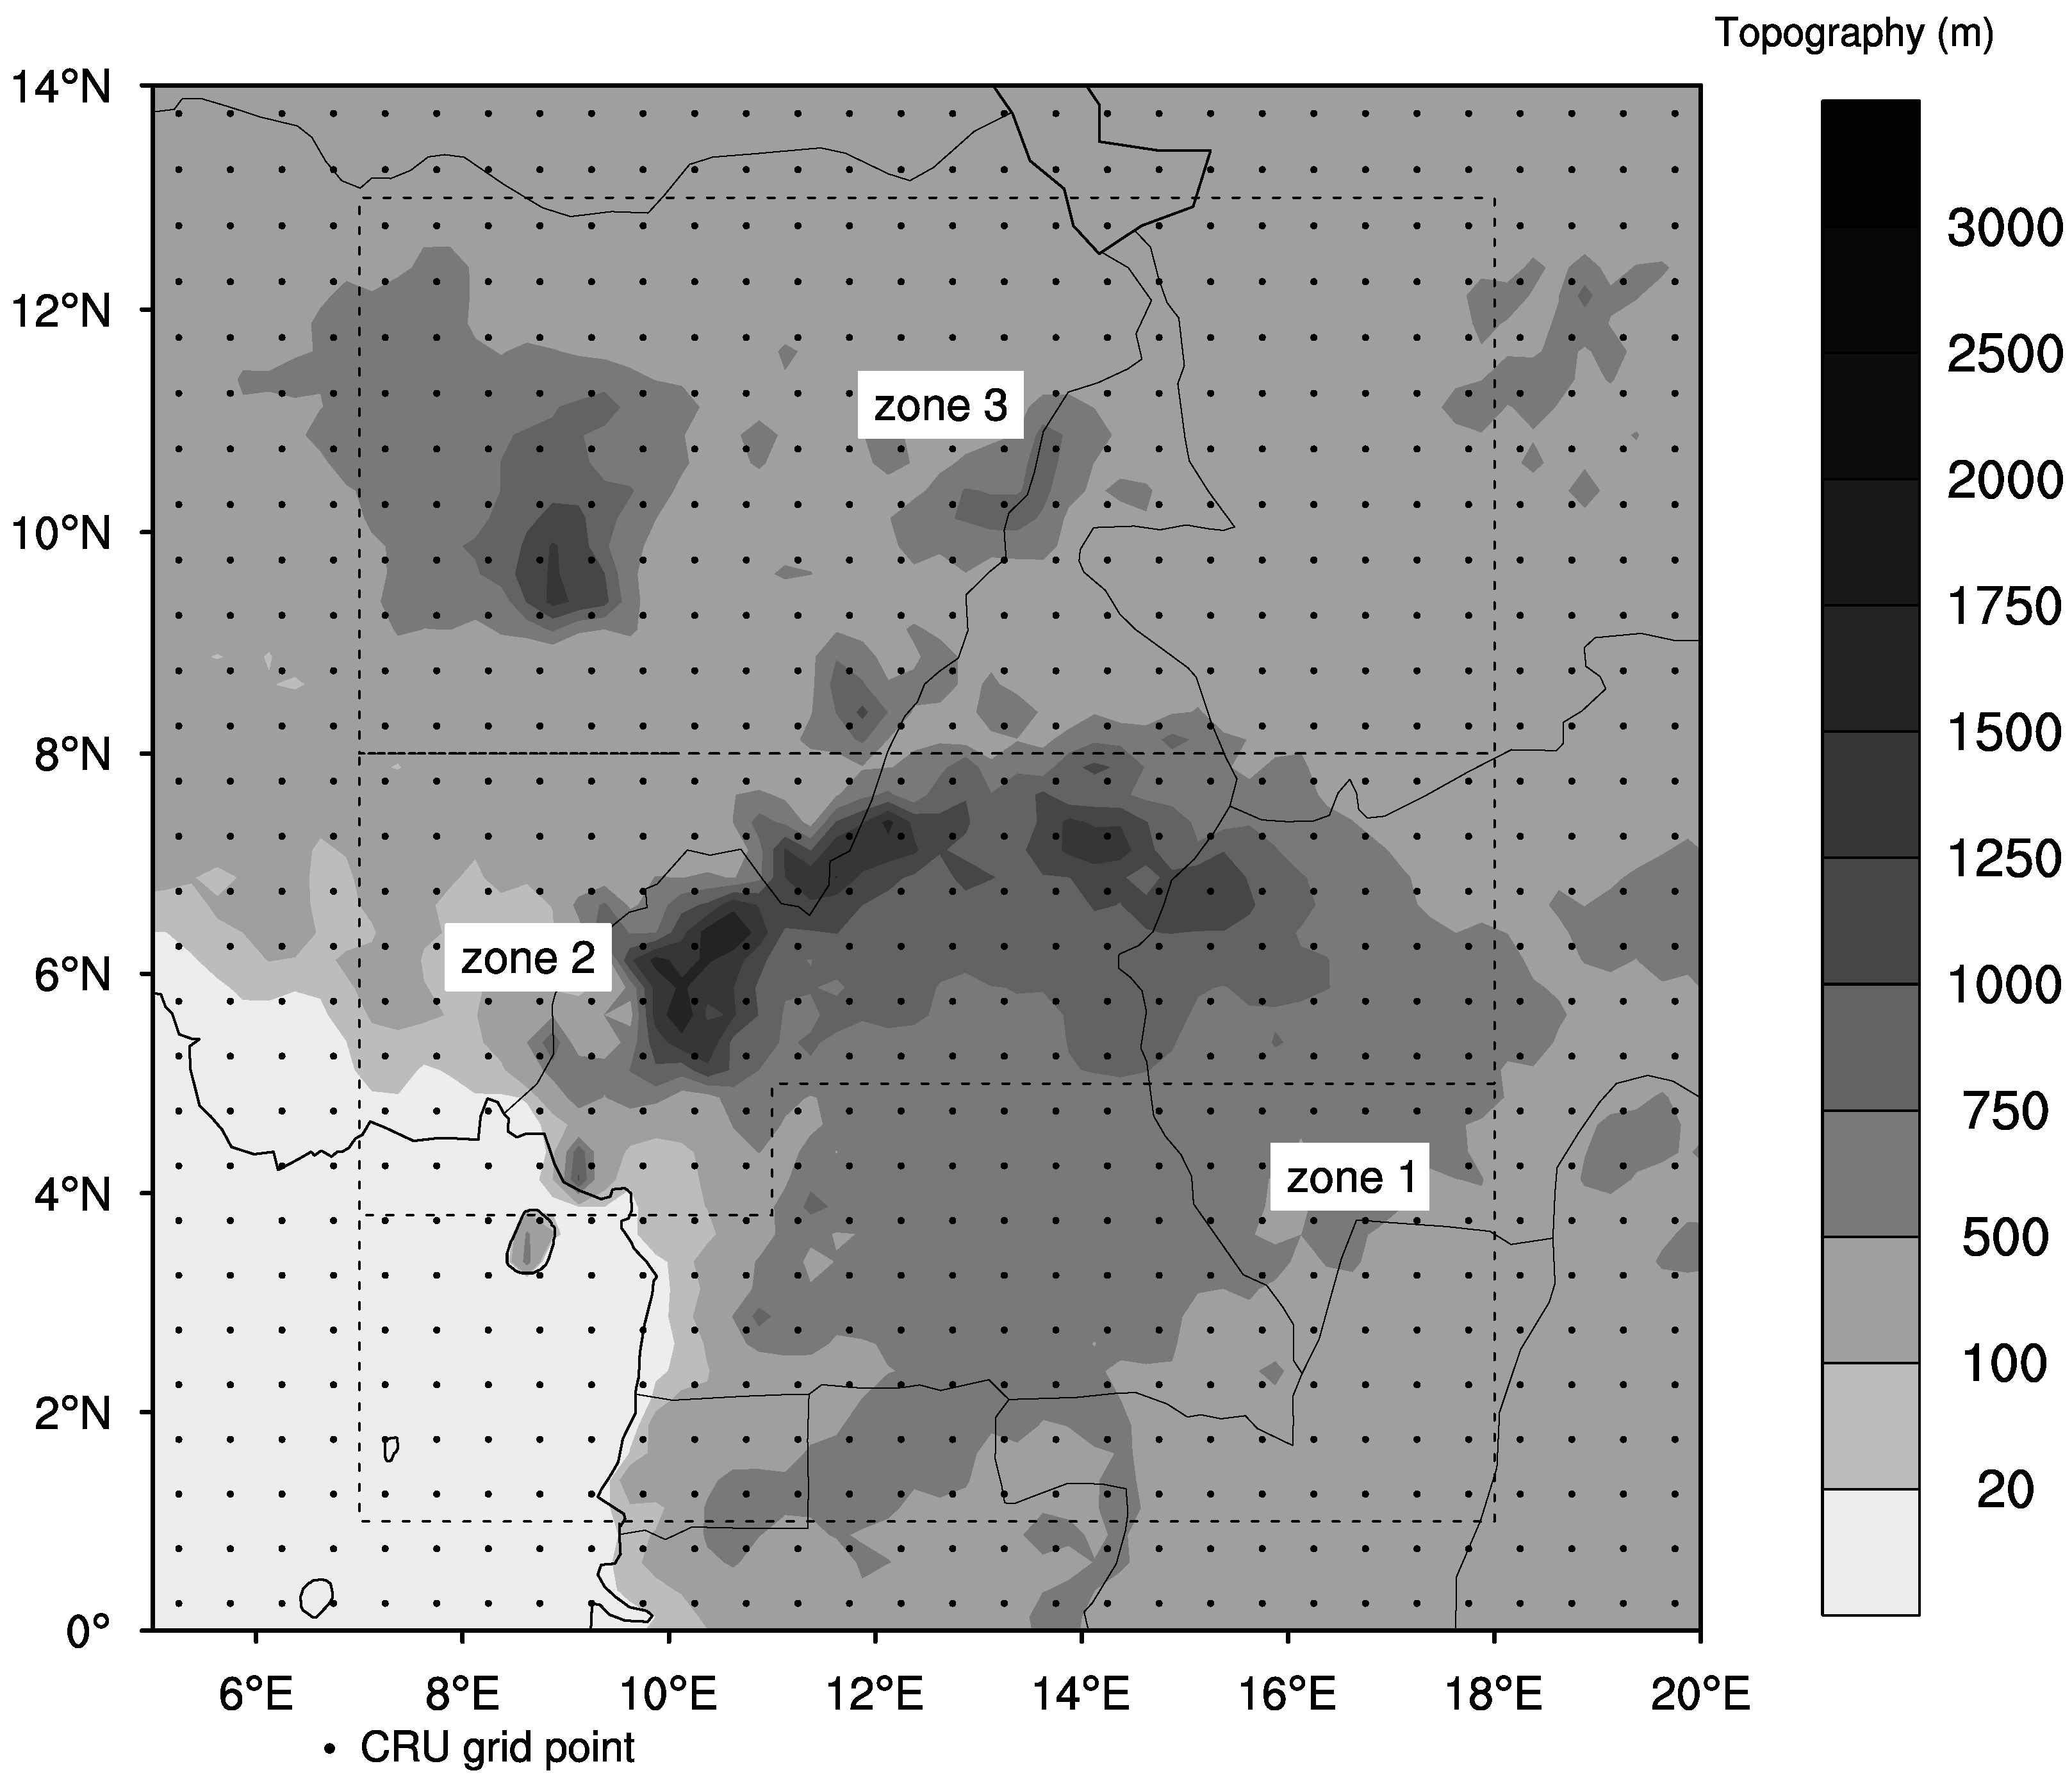
2. Study Area
3. Data and Methodology
3.1. Data Used
3.2. Methodology
- Δ: slope vapor pressure curve (kPa·C);
- : net radiation at the crop surface (MJ·m·day);
- G: soil heat flux density (MJ·m·day);
- γ: psychrometric constant (kPa·C);
- T: mean daily air temperature at 2-m height (C);
- : wind speed at 2-m height (m·s);
- : saturation vapor pressure (kPa);
- : actual vapor pressure (kPa);
- : saturation vapor pressure deficit (kPa).
4. Results
4.1. Classification of Parts of the Study Area According to the Aridity Index
4.2. Annual Cycles of PR, PET, TWSC and Their Usefulness
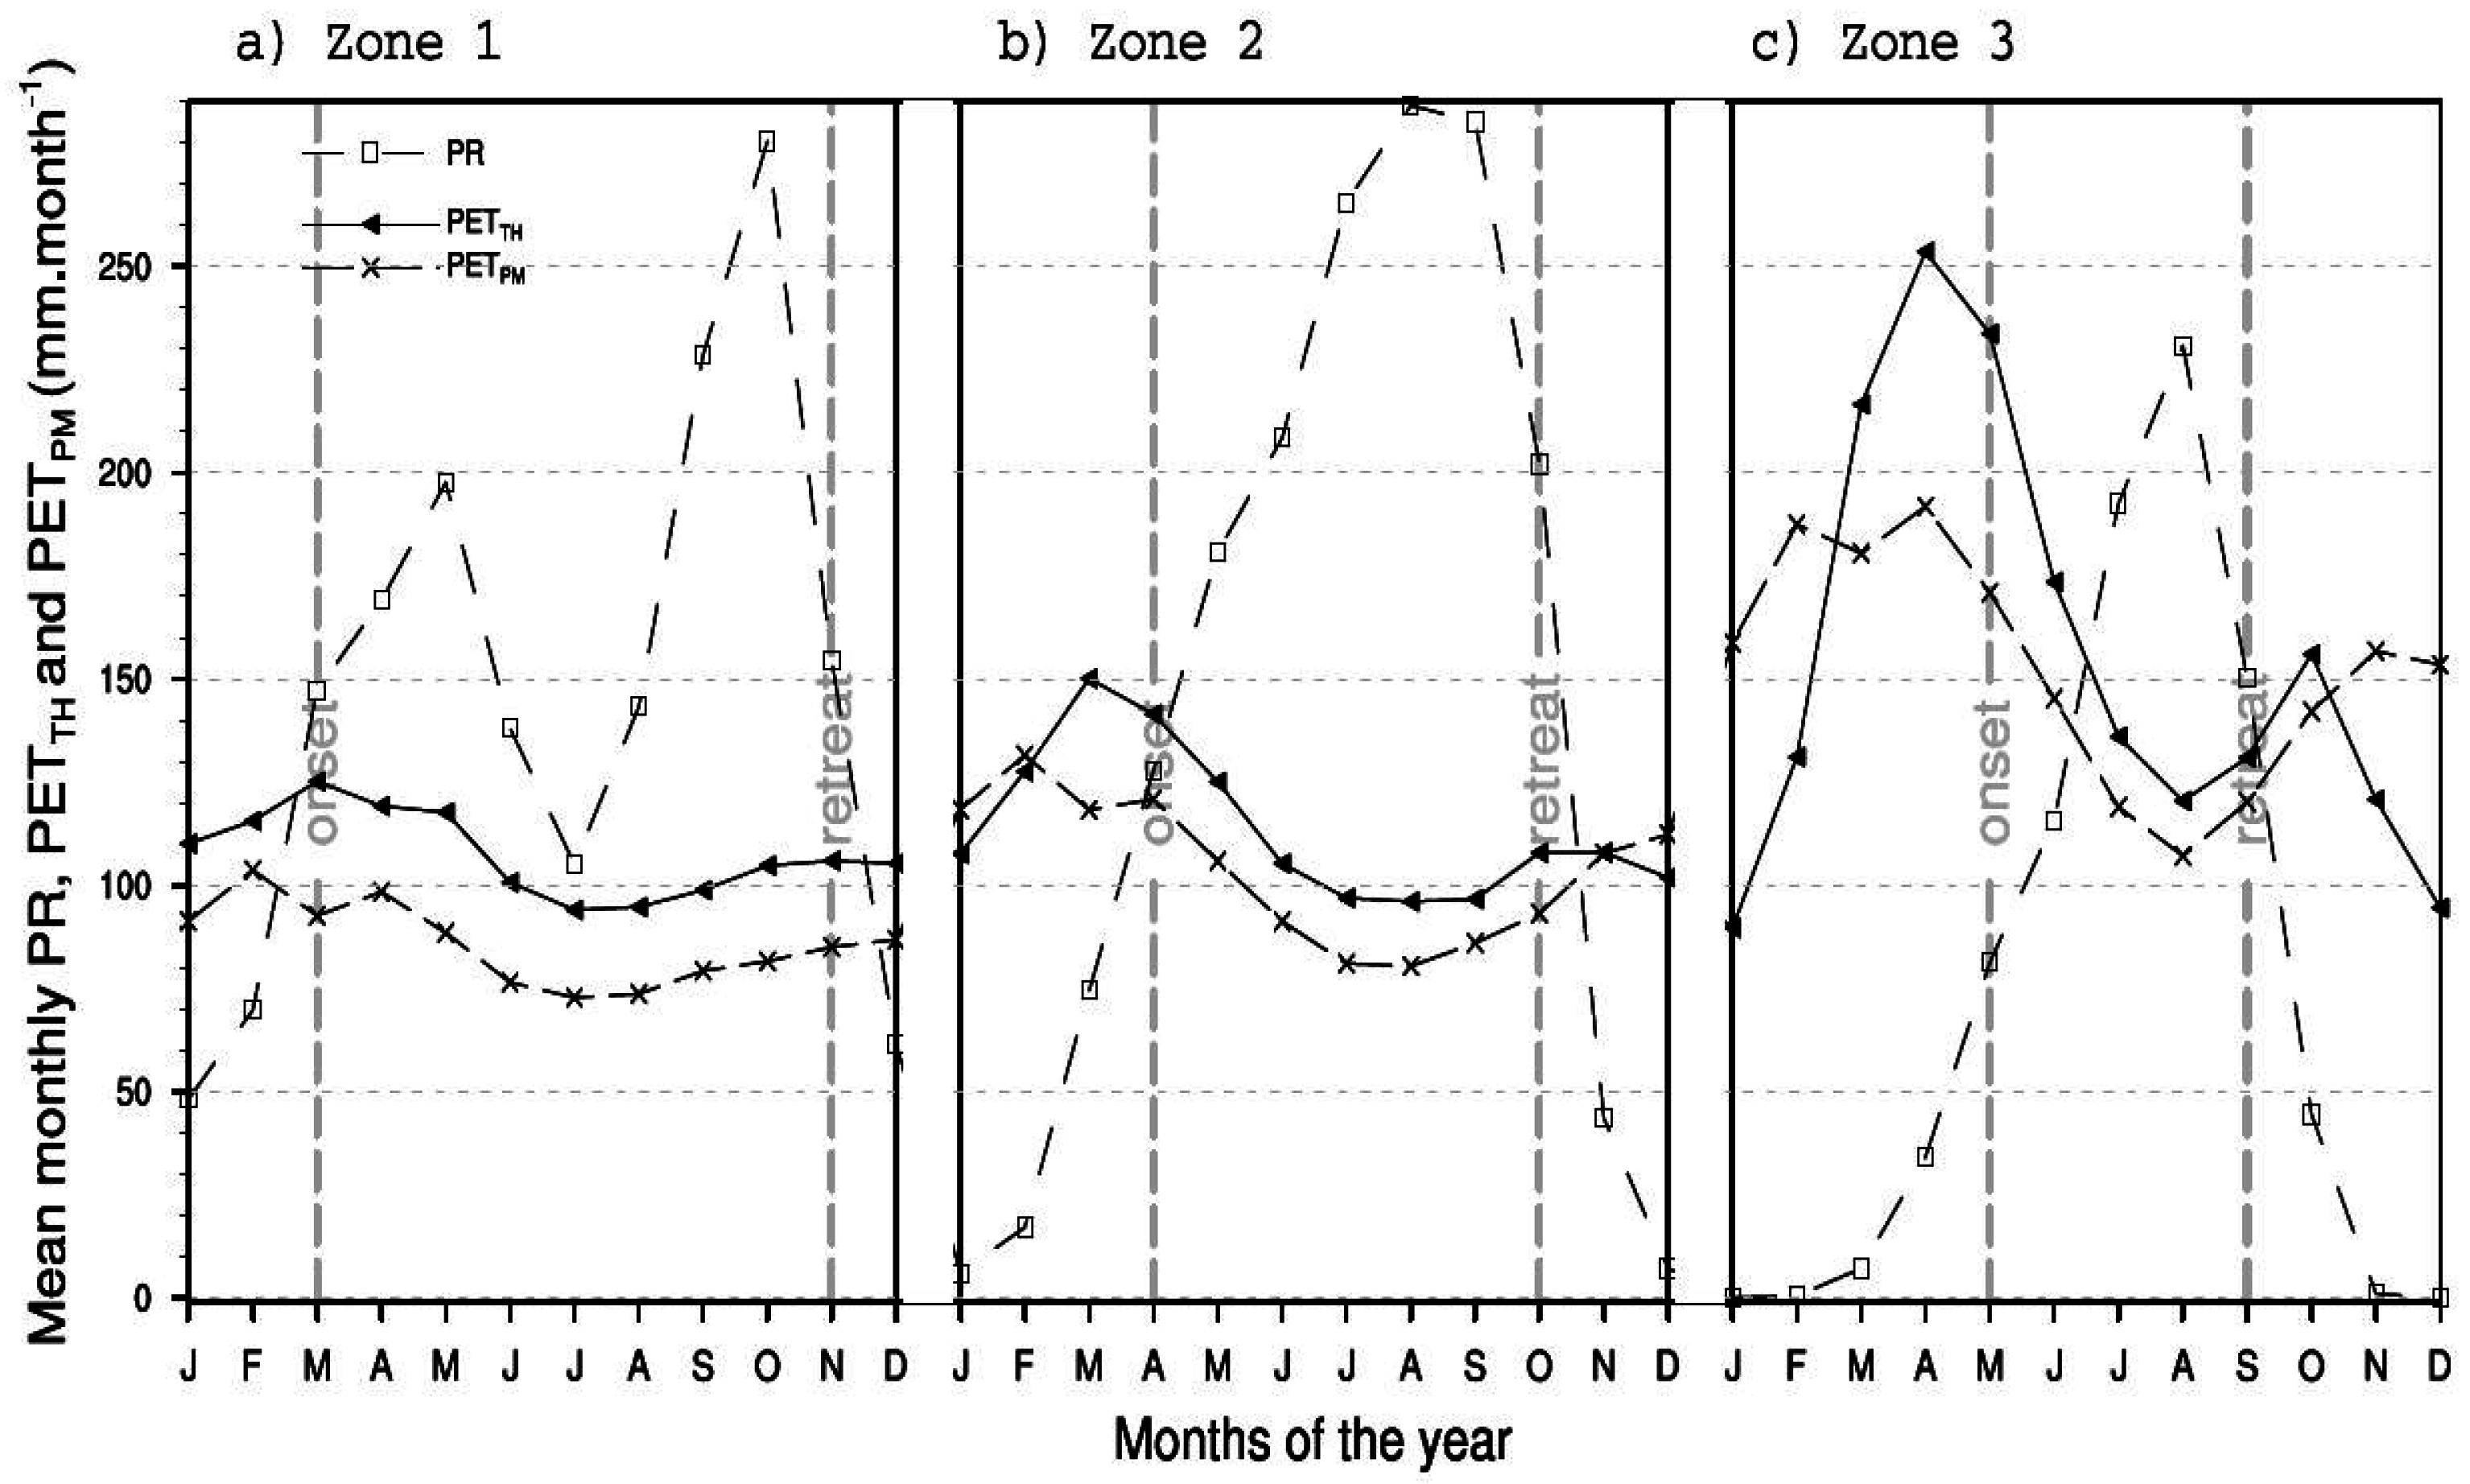
4.2.1. Annual Cycle of PR
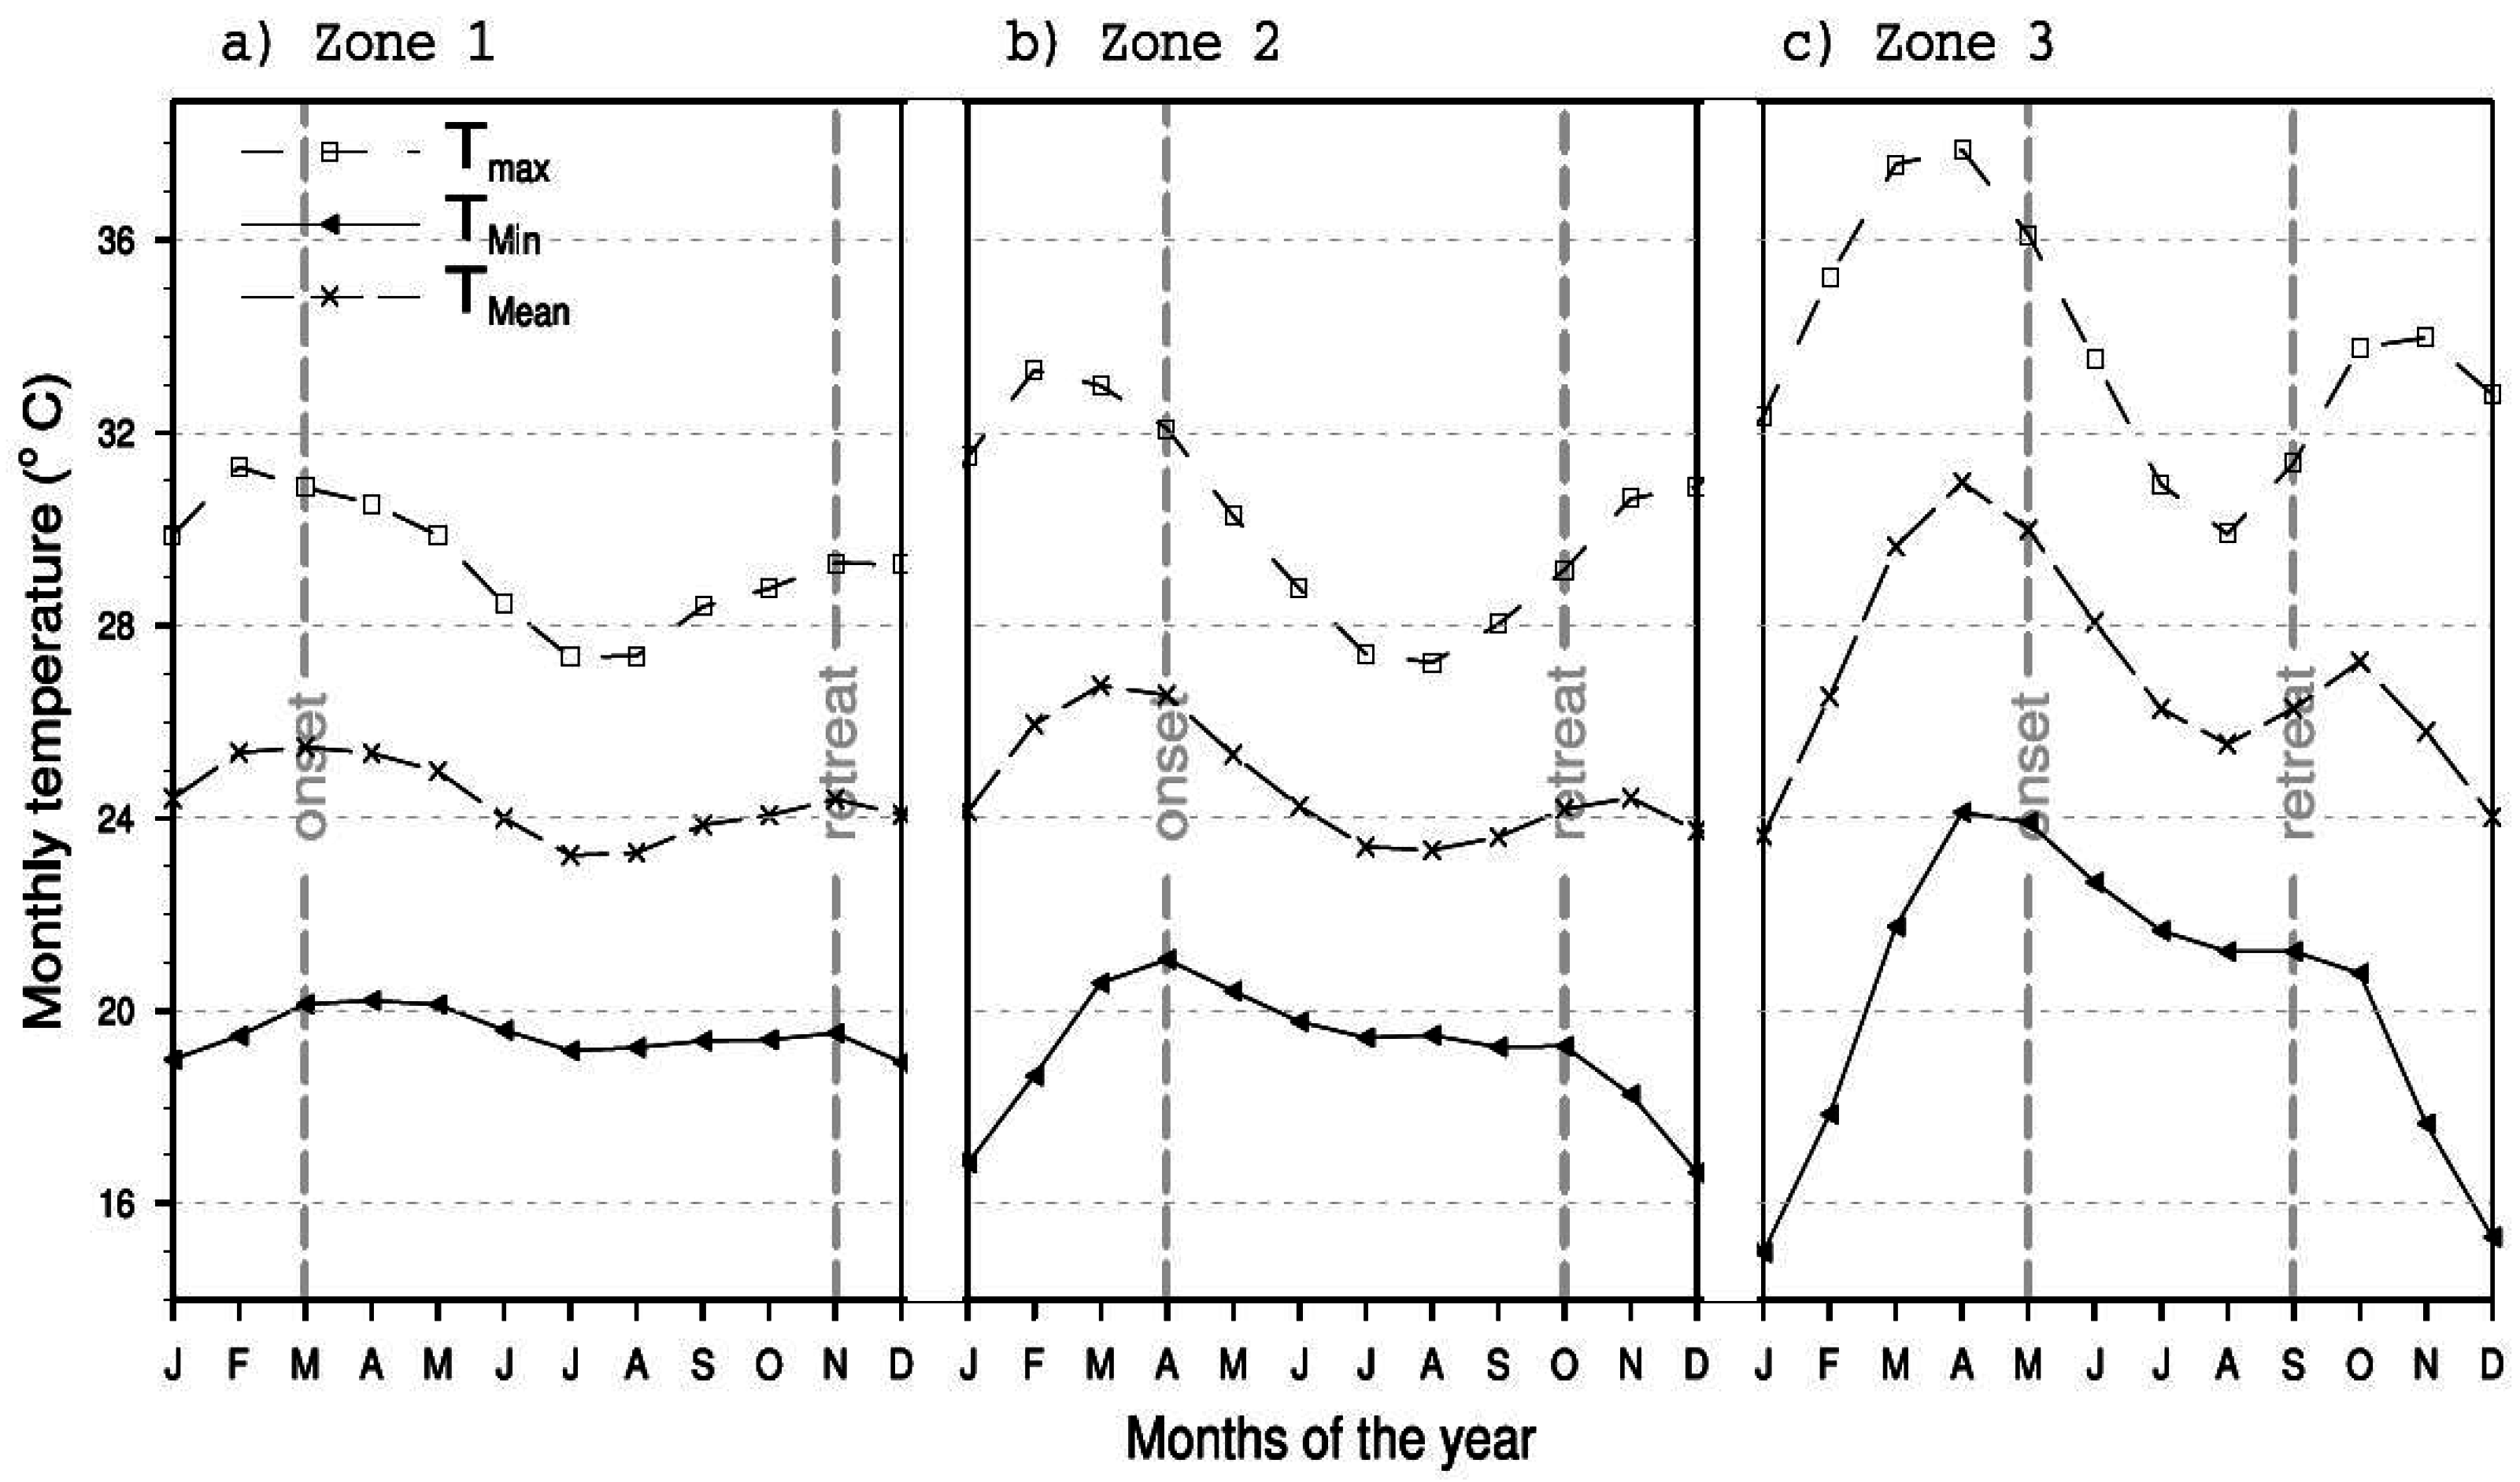
4.2.2. Annual Cycle of PET
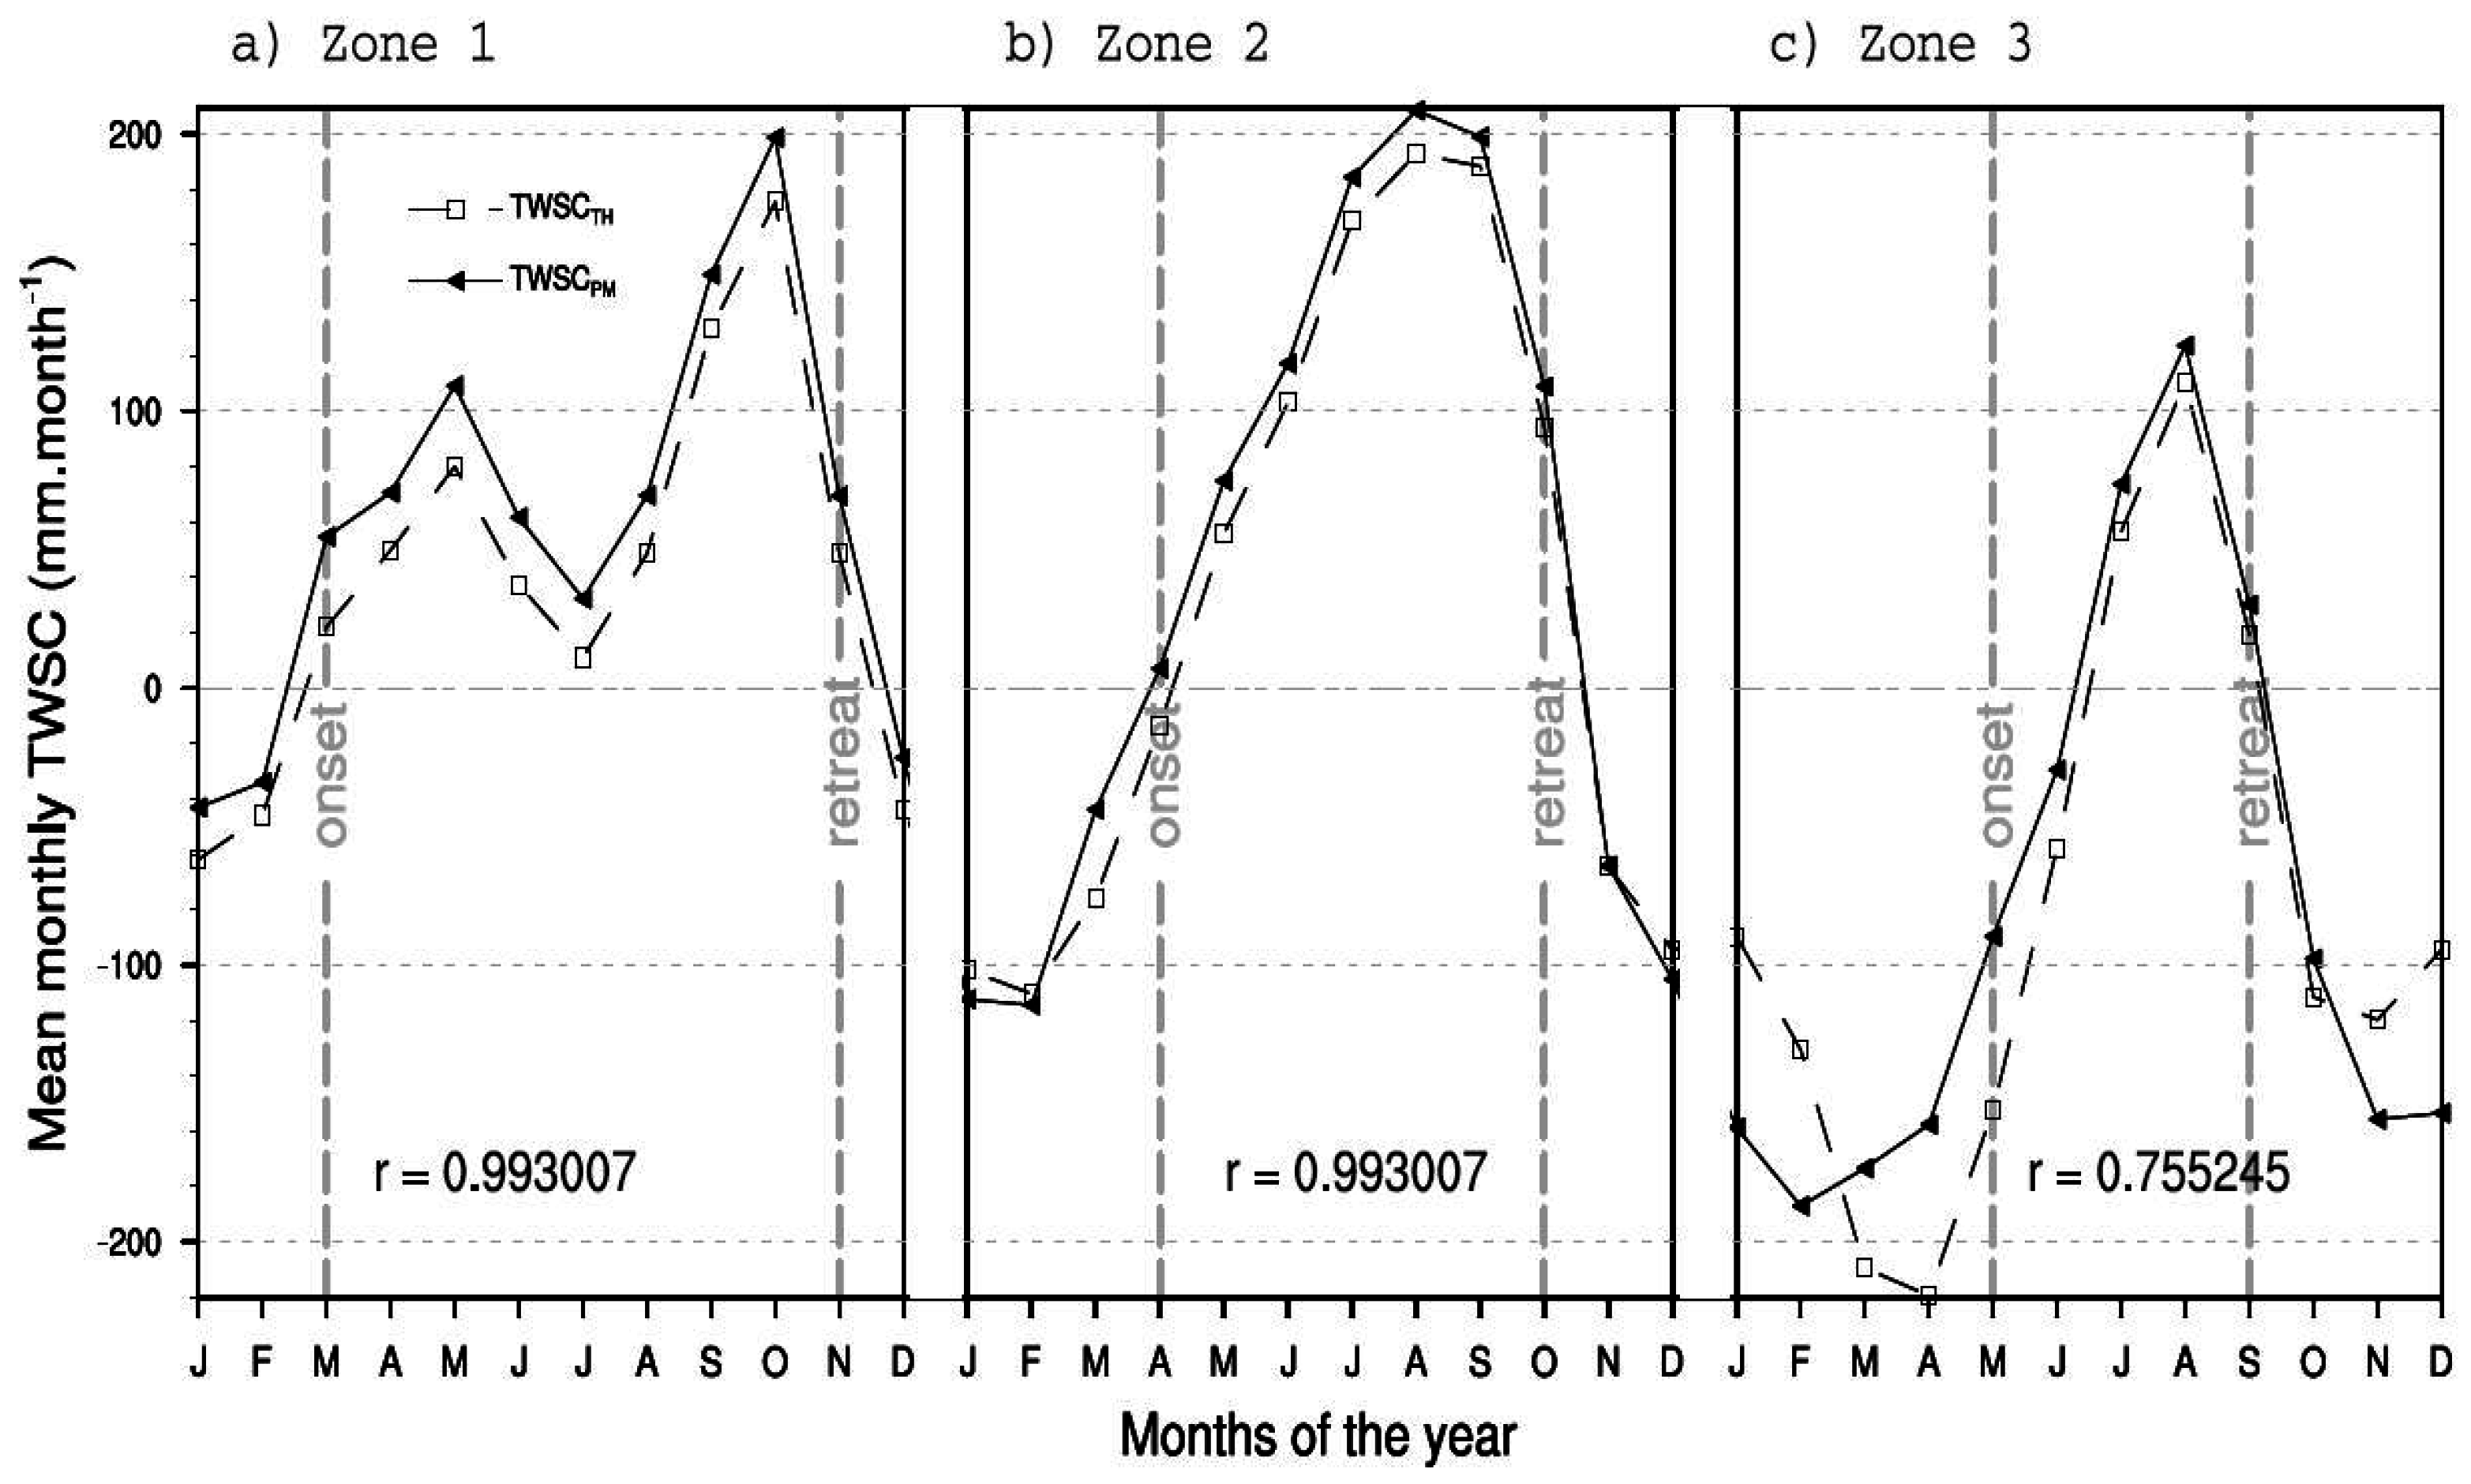
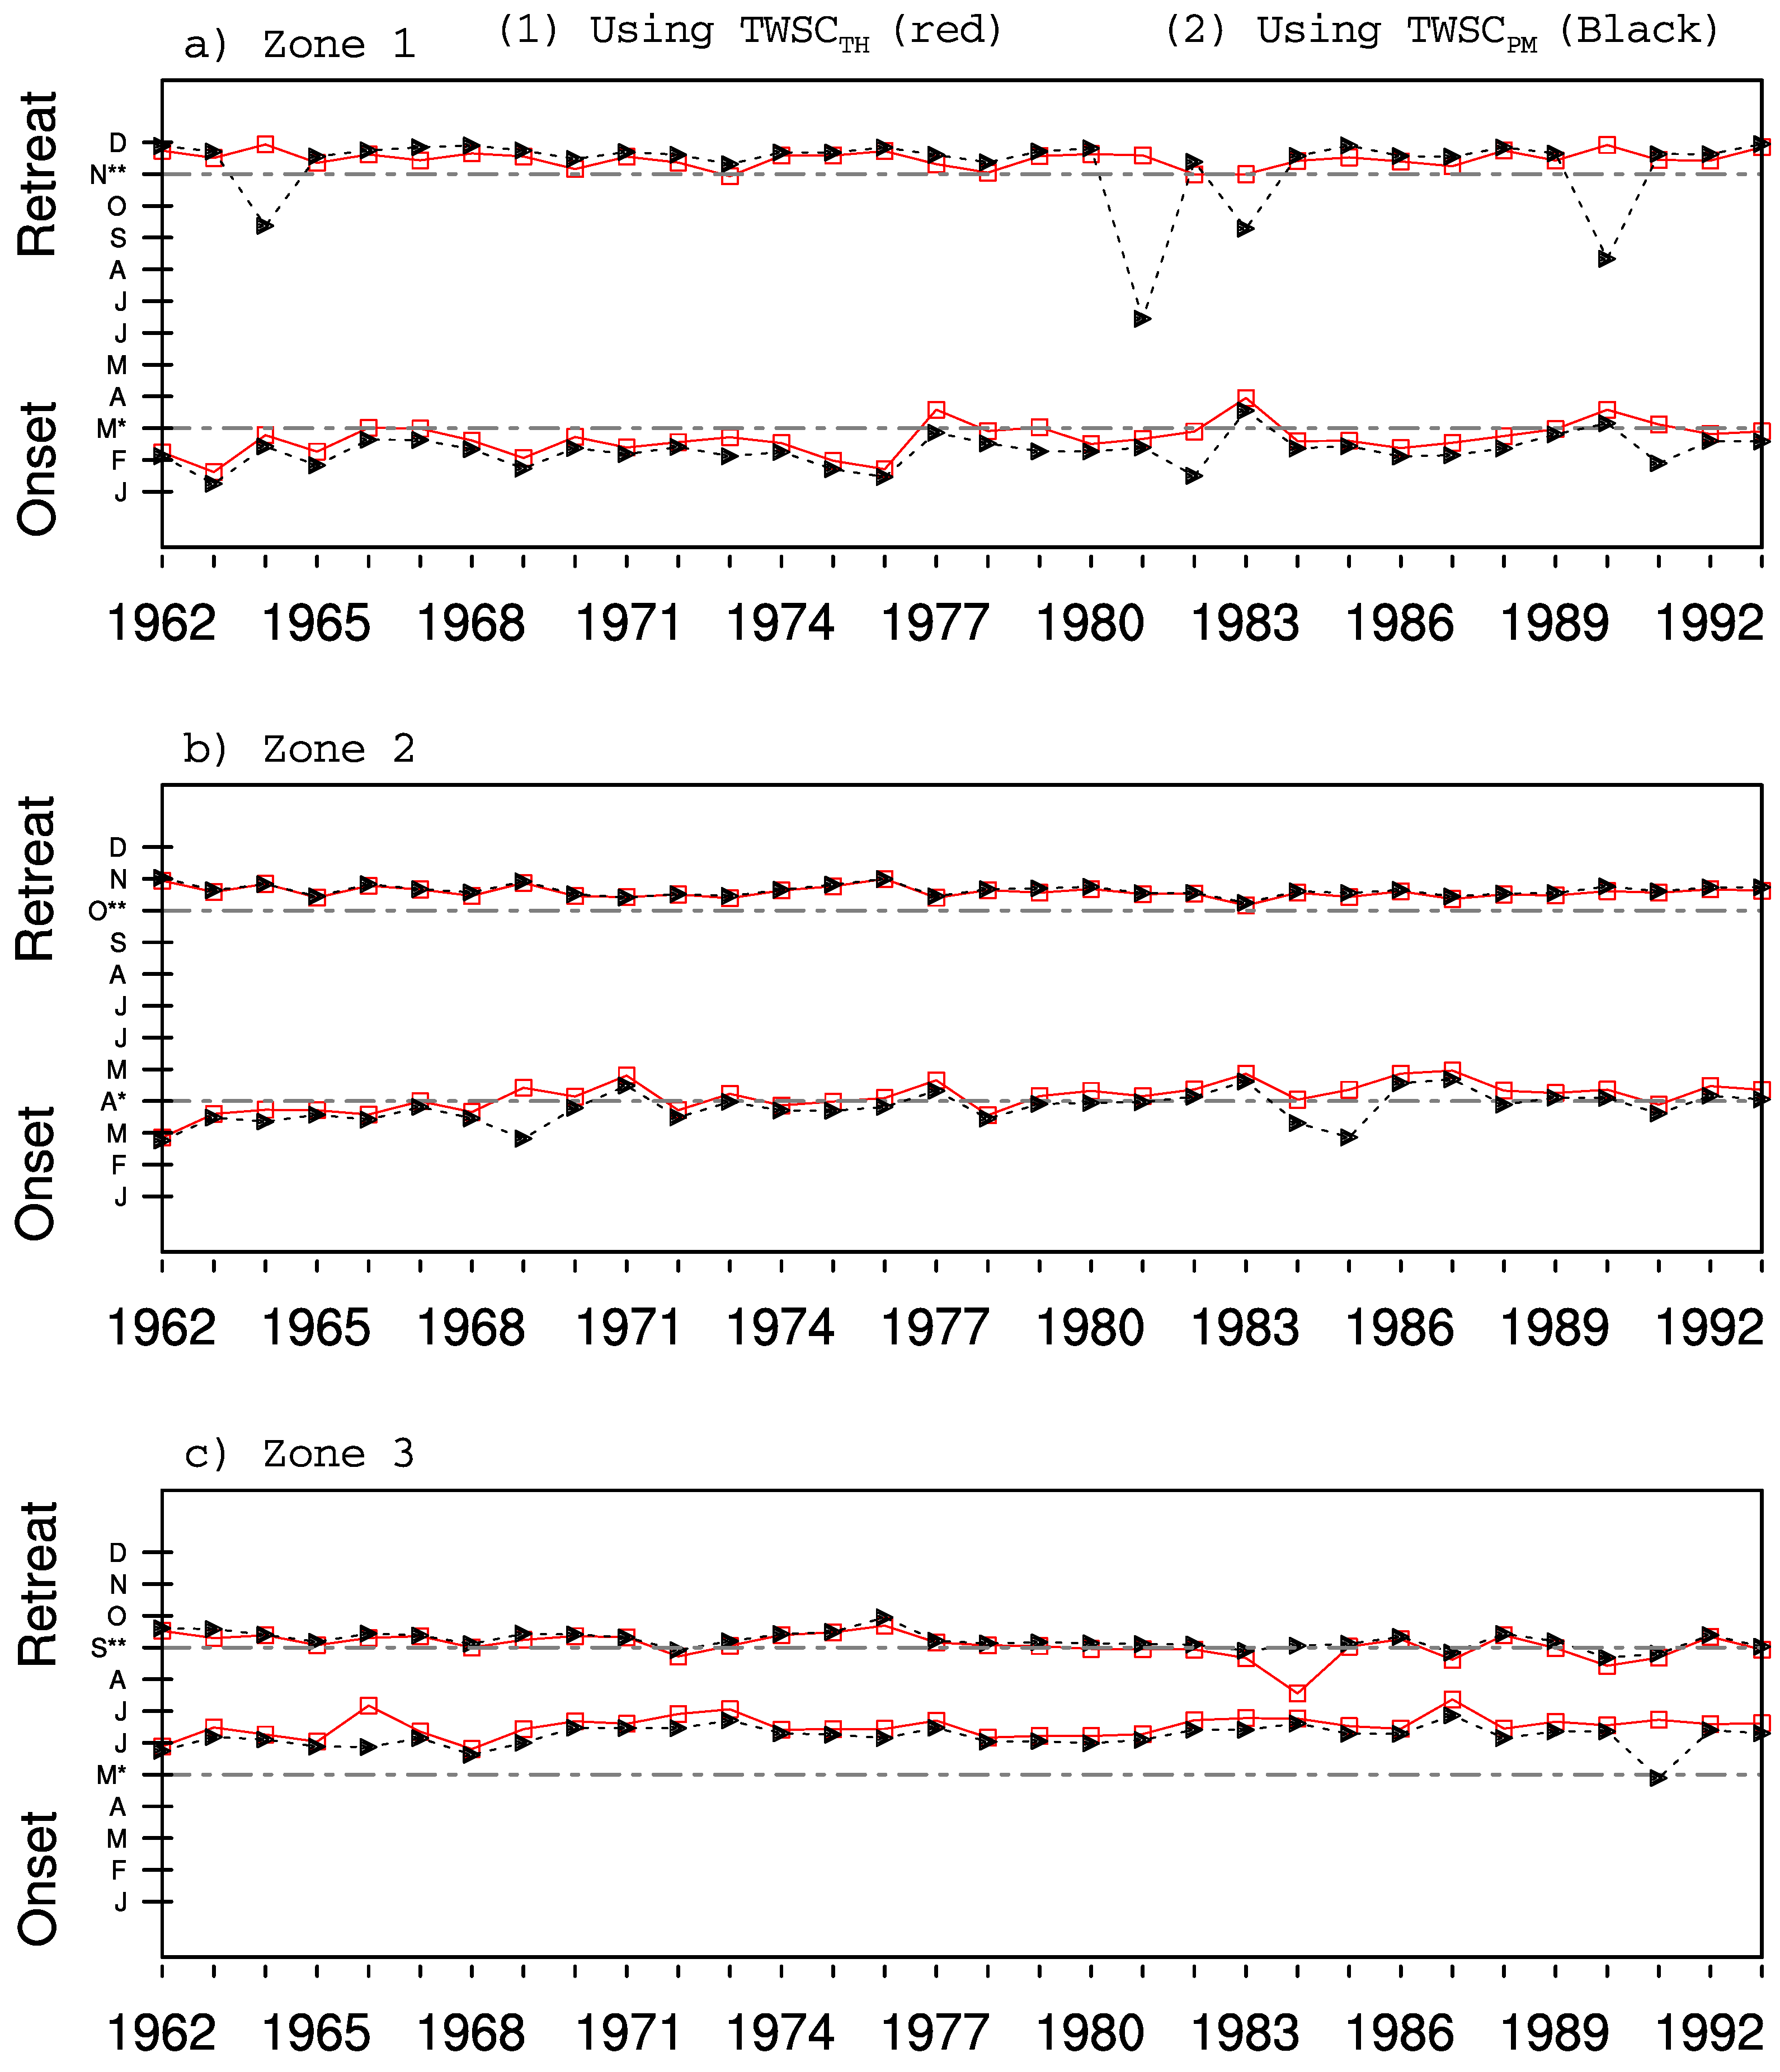
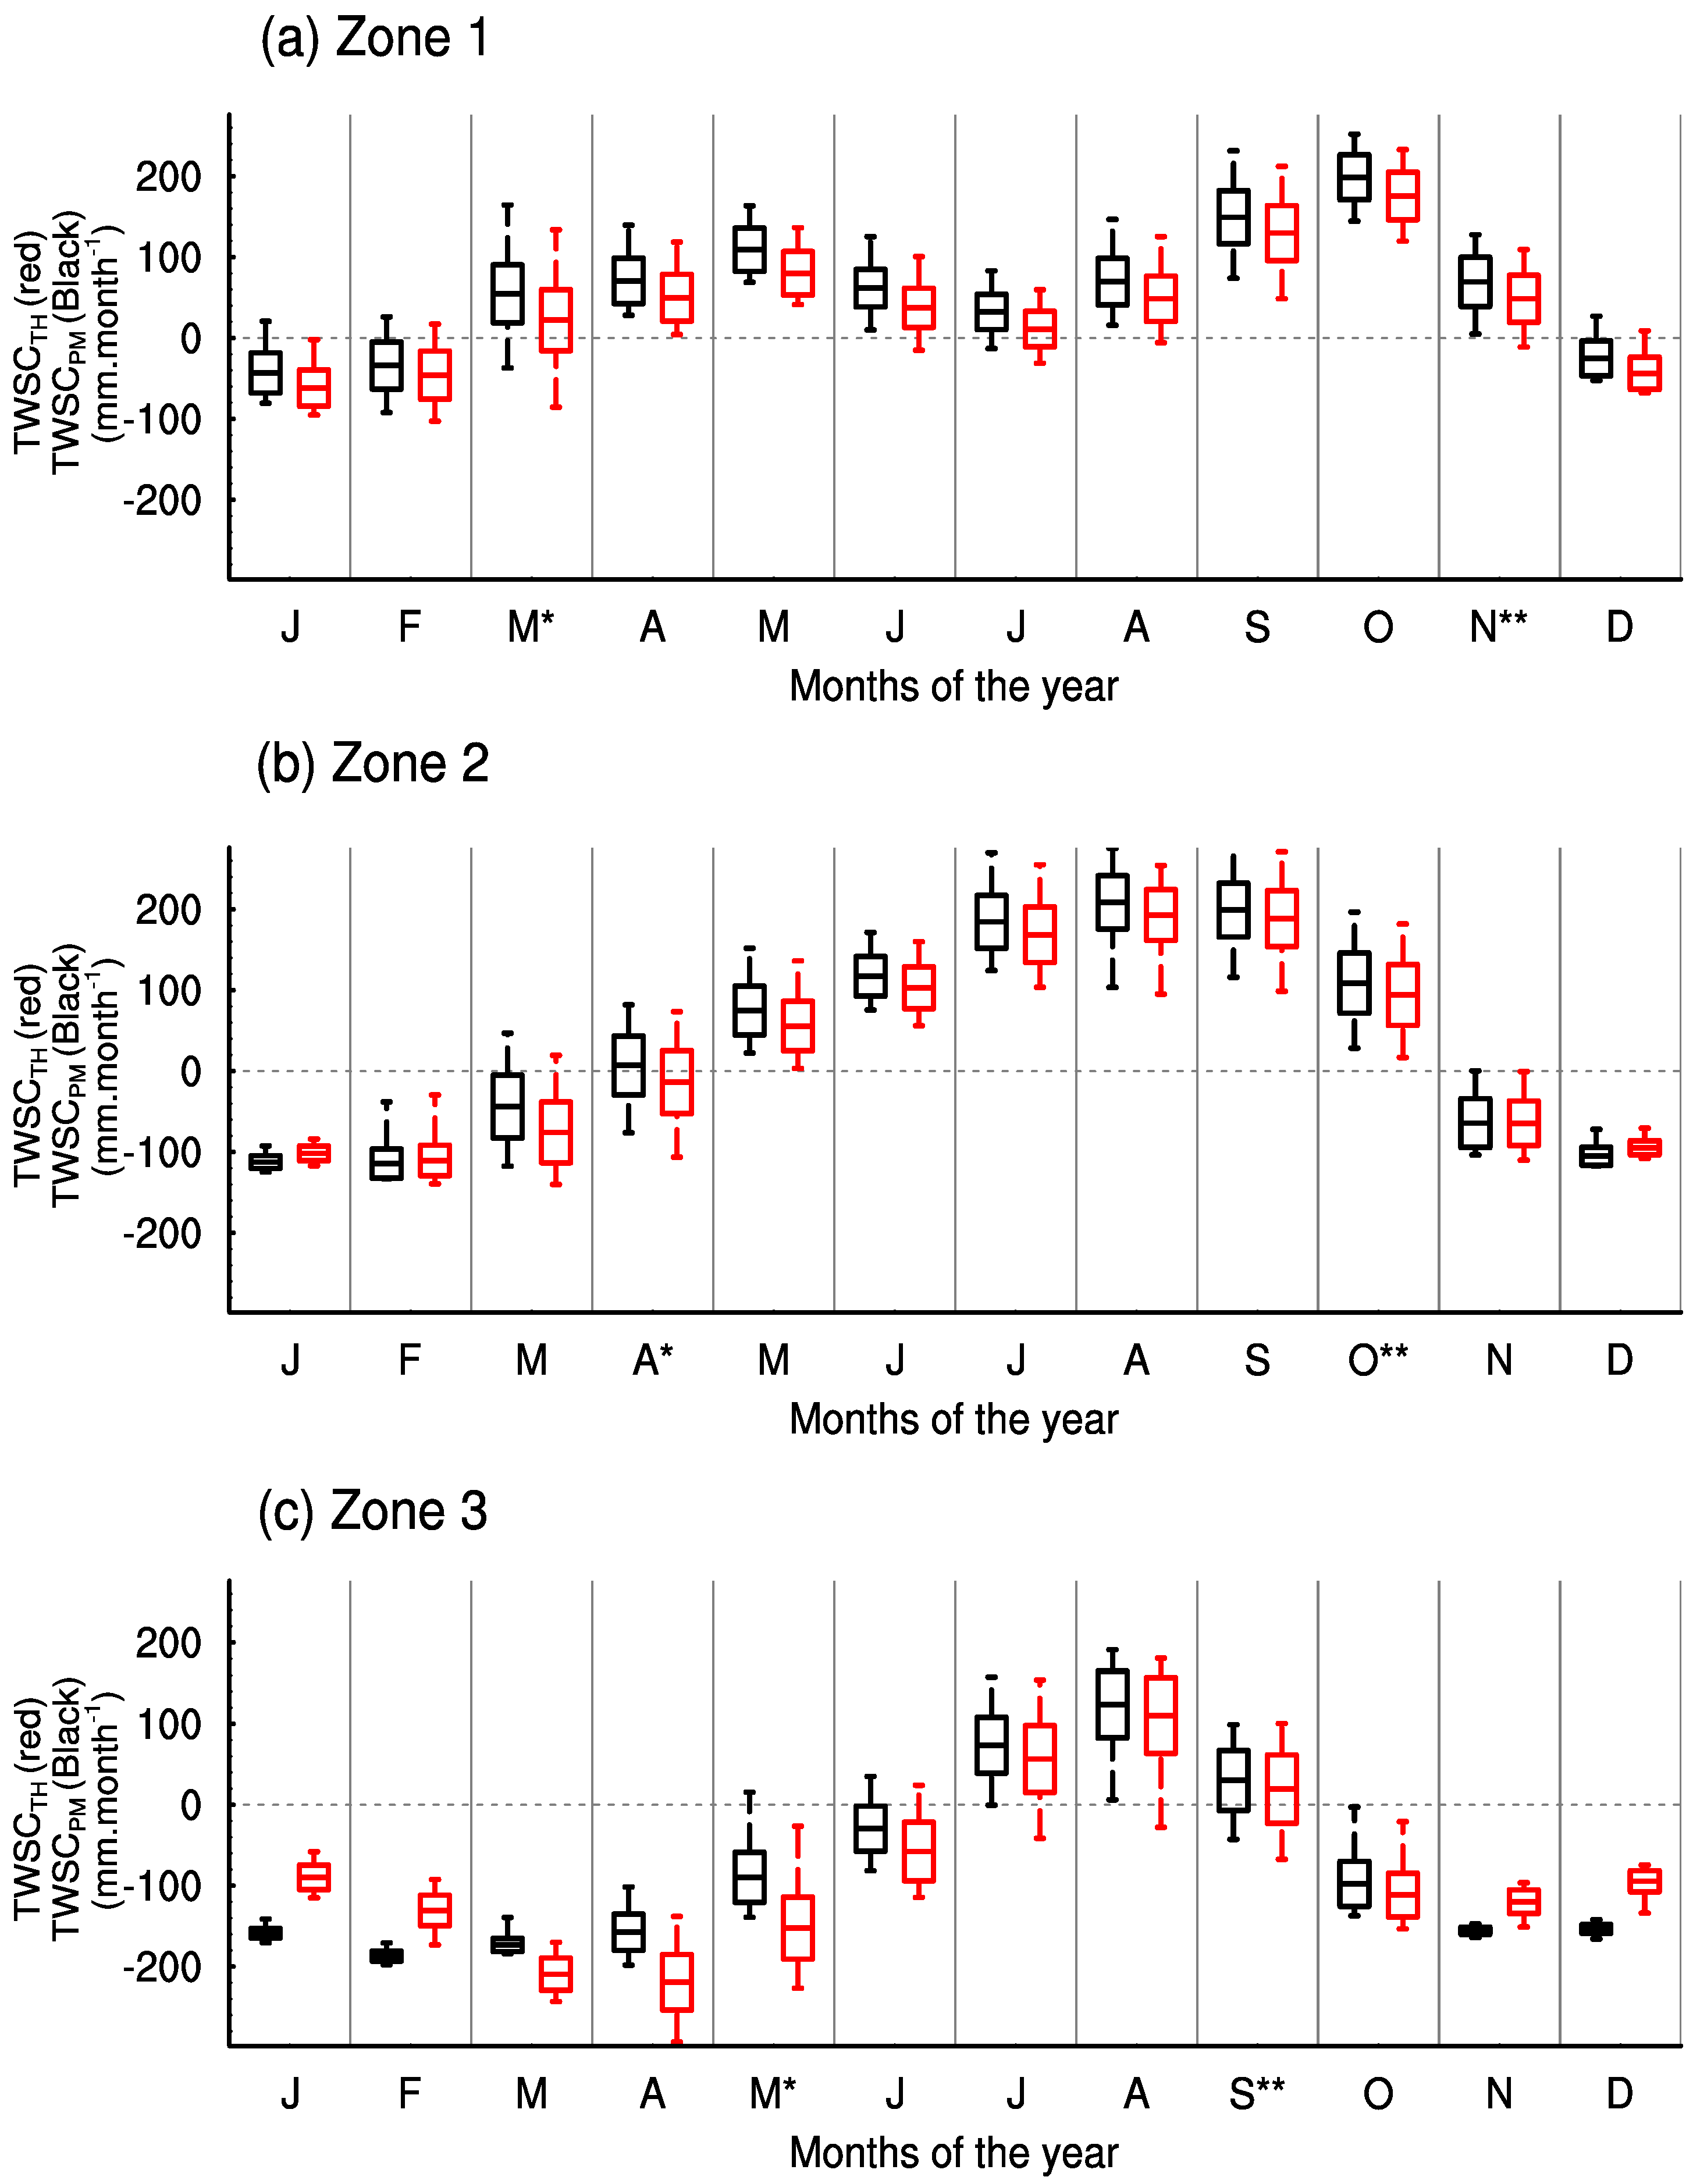
4.2.3. Annual Cycle of TWSC and Its Link with Onset and Retreat Months of the Rainy Season
4.2.4. Favorable Periods for Rainwater-Dependent Activities
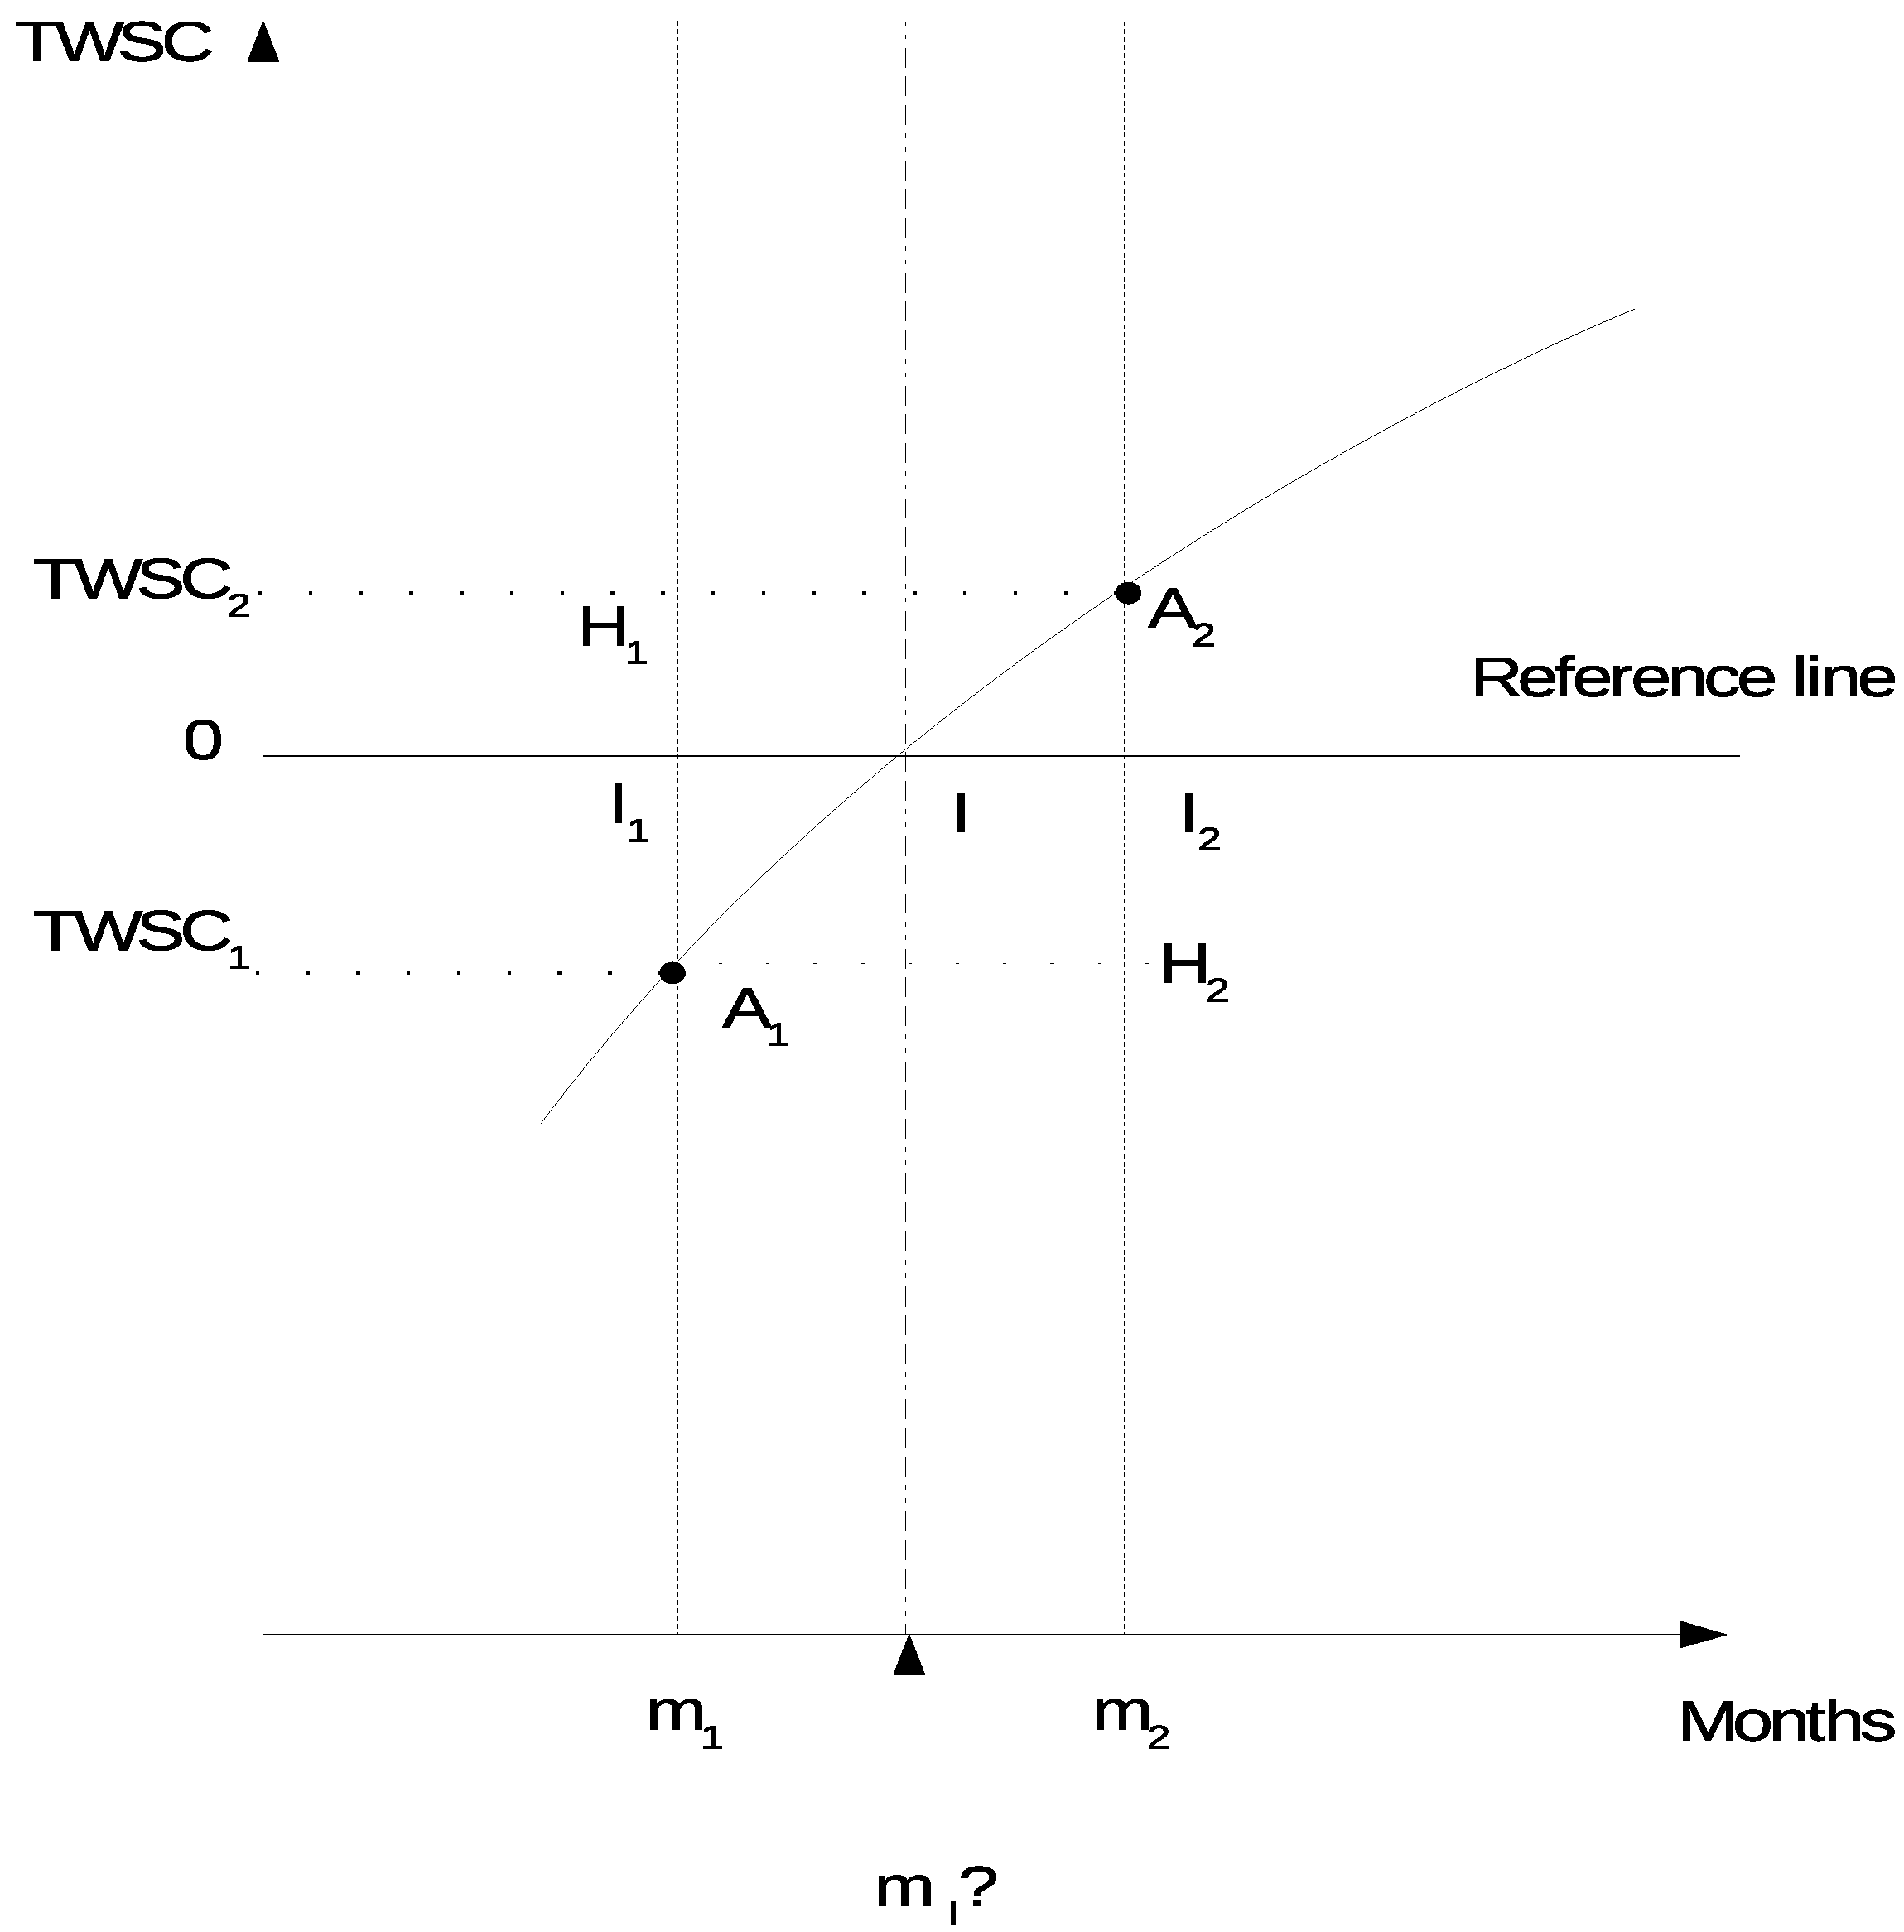
4.3. Onset and Retreat Dates of the Rainy Season for an Individual Year Applying the TWSC Method
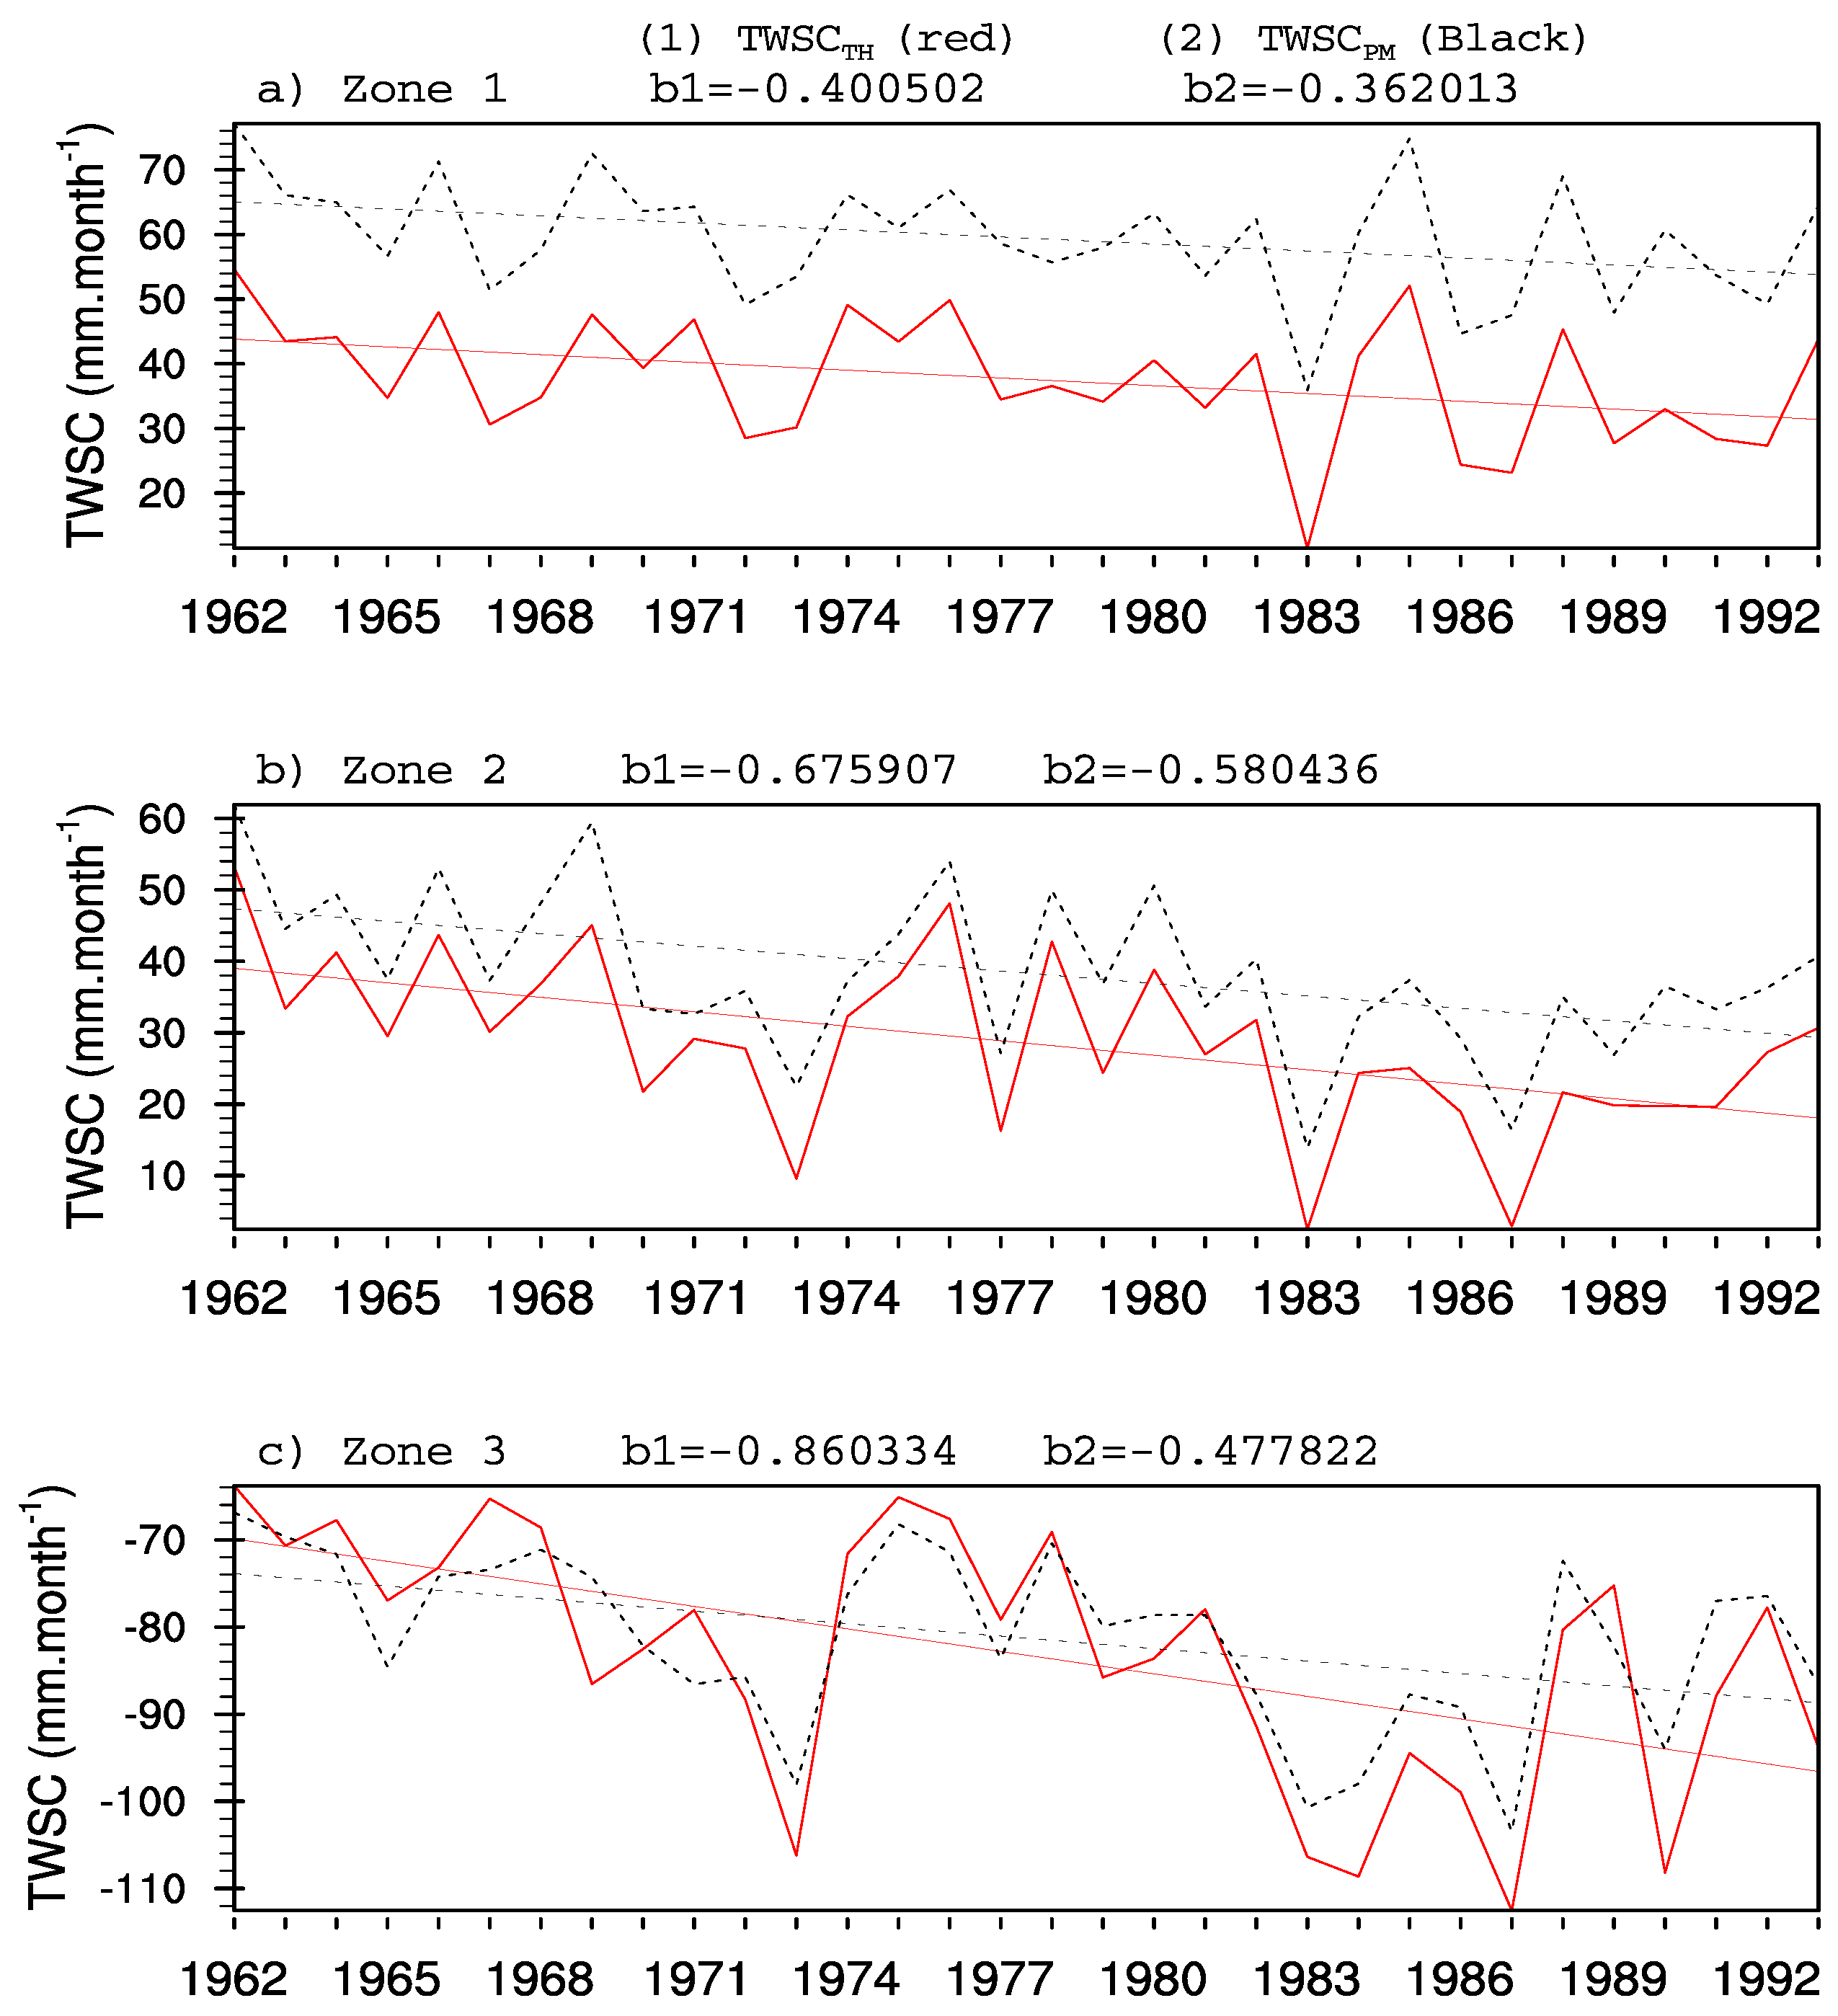
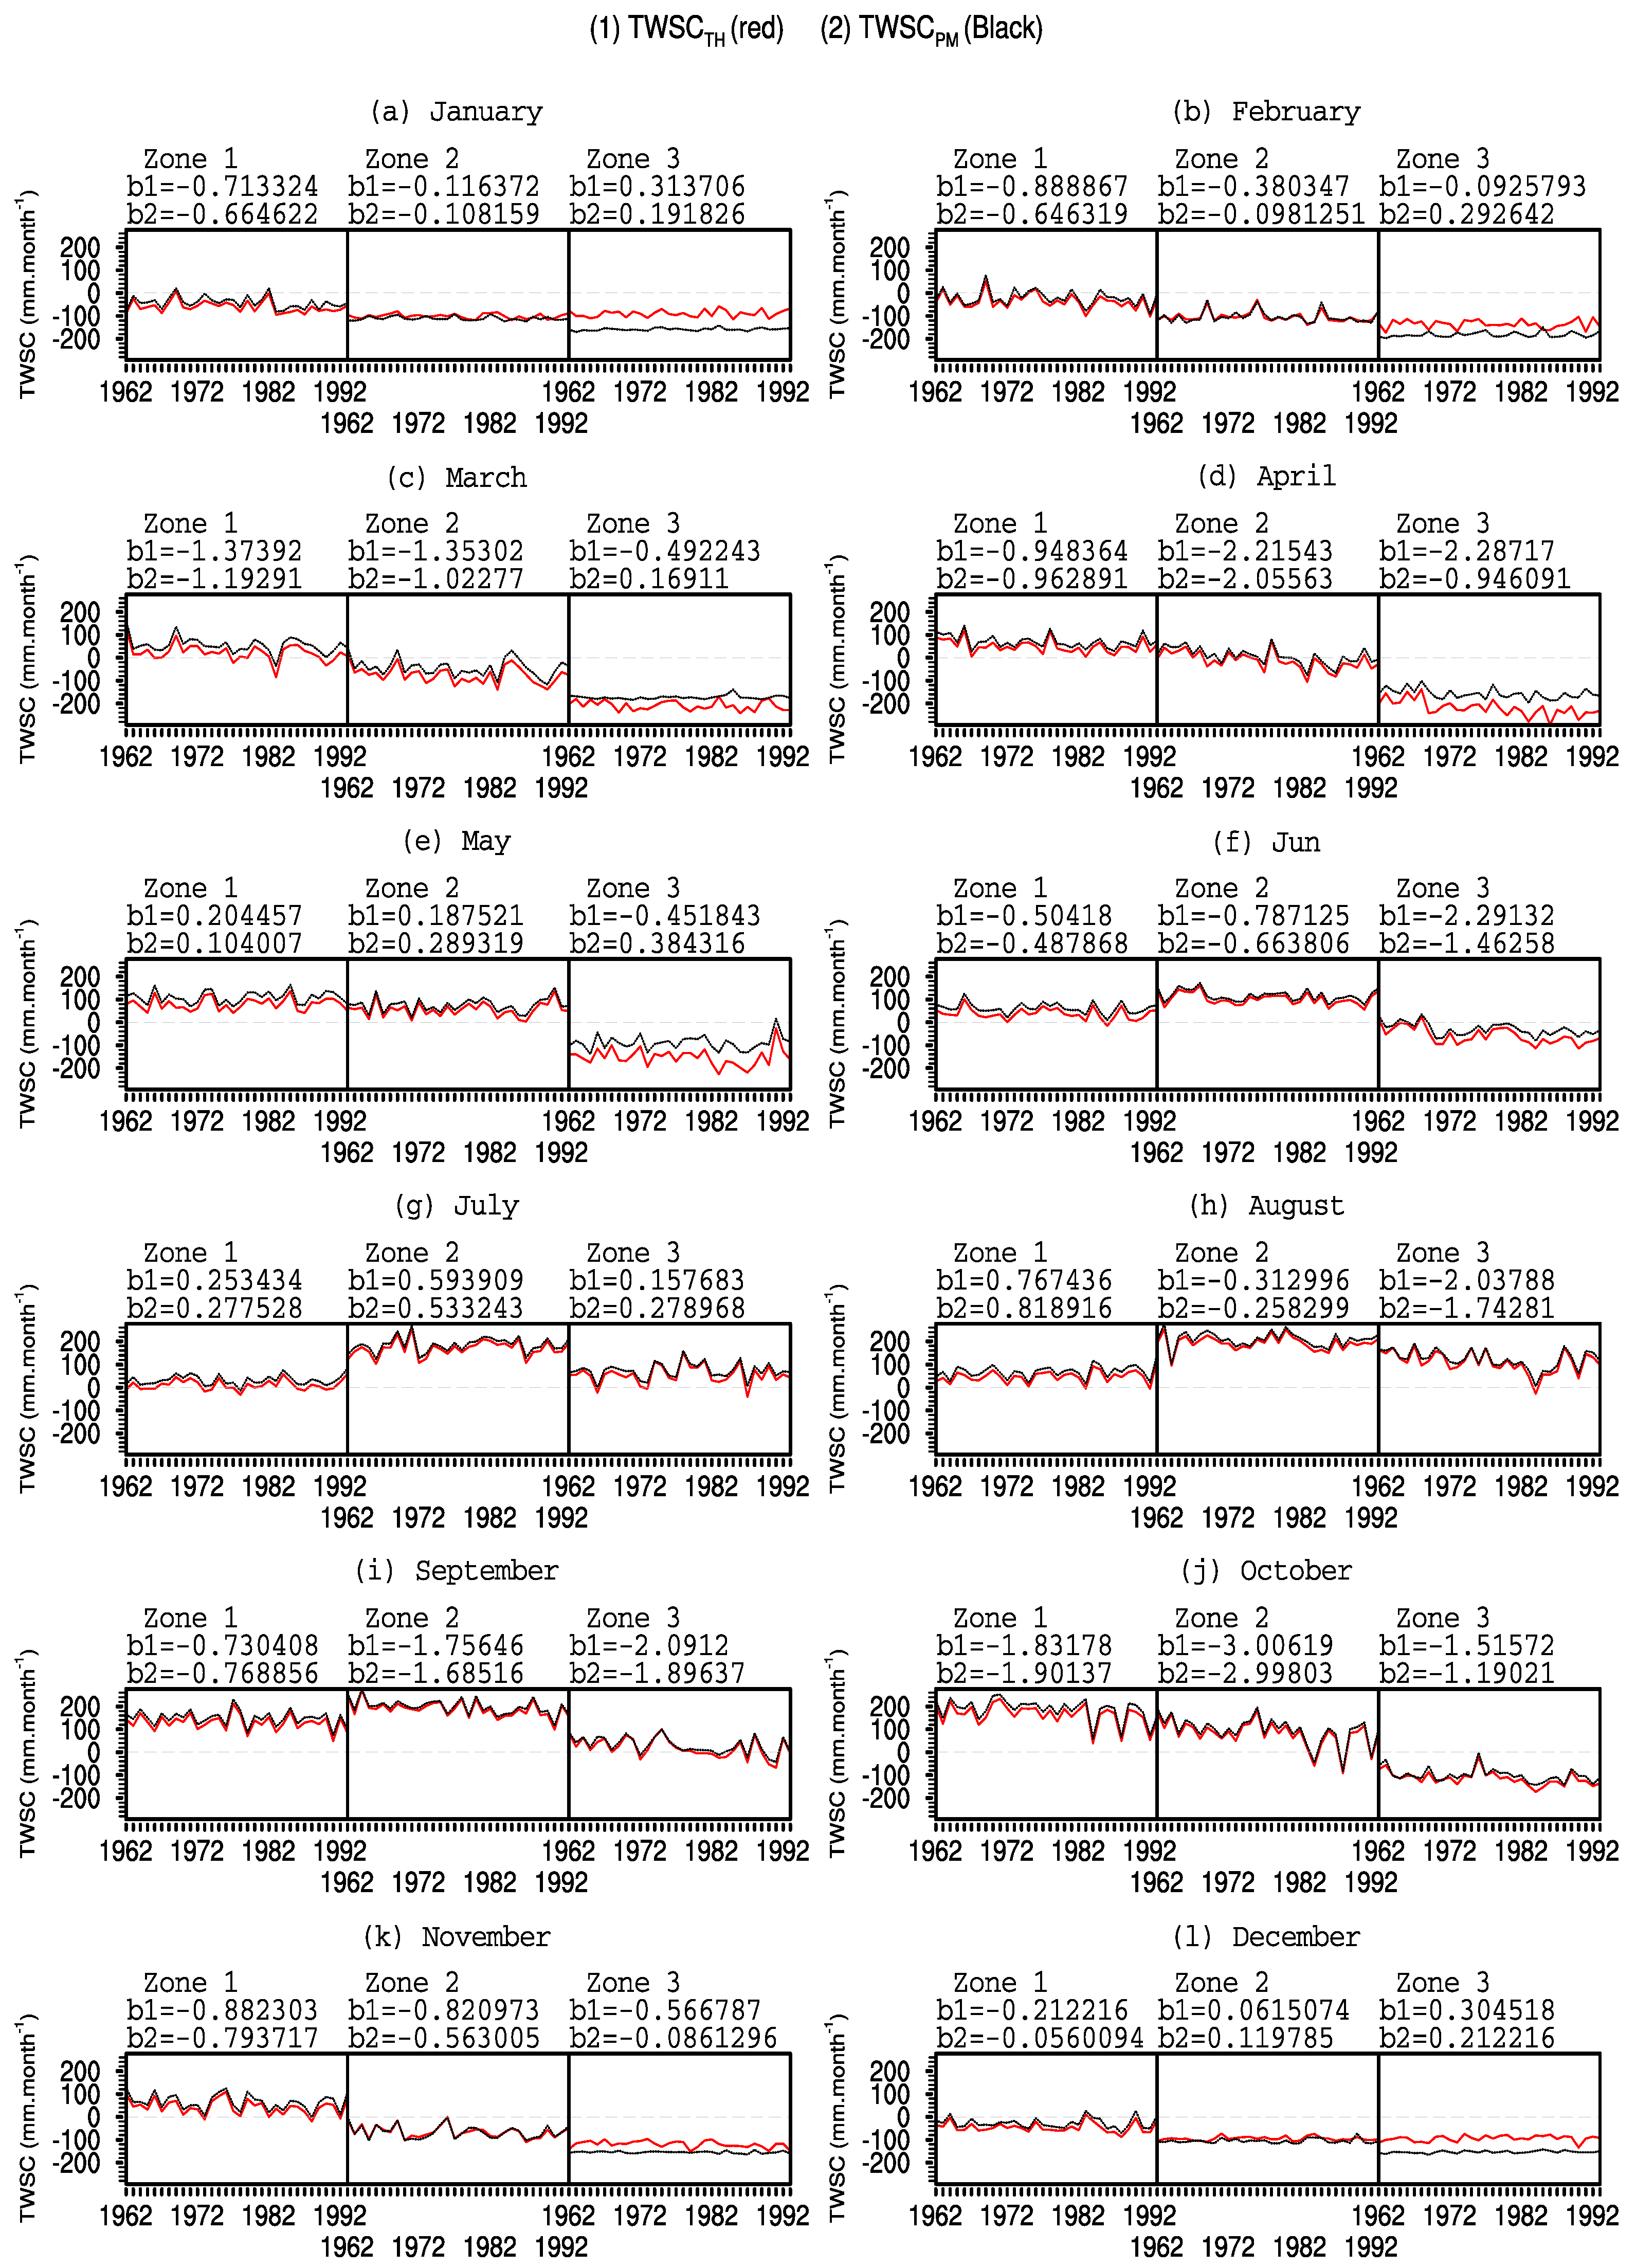
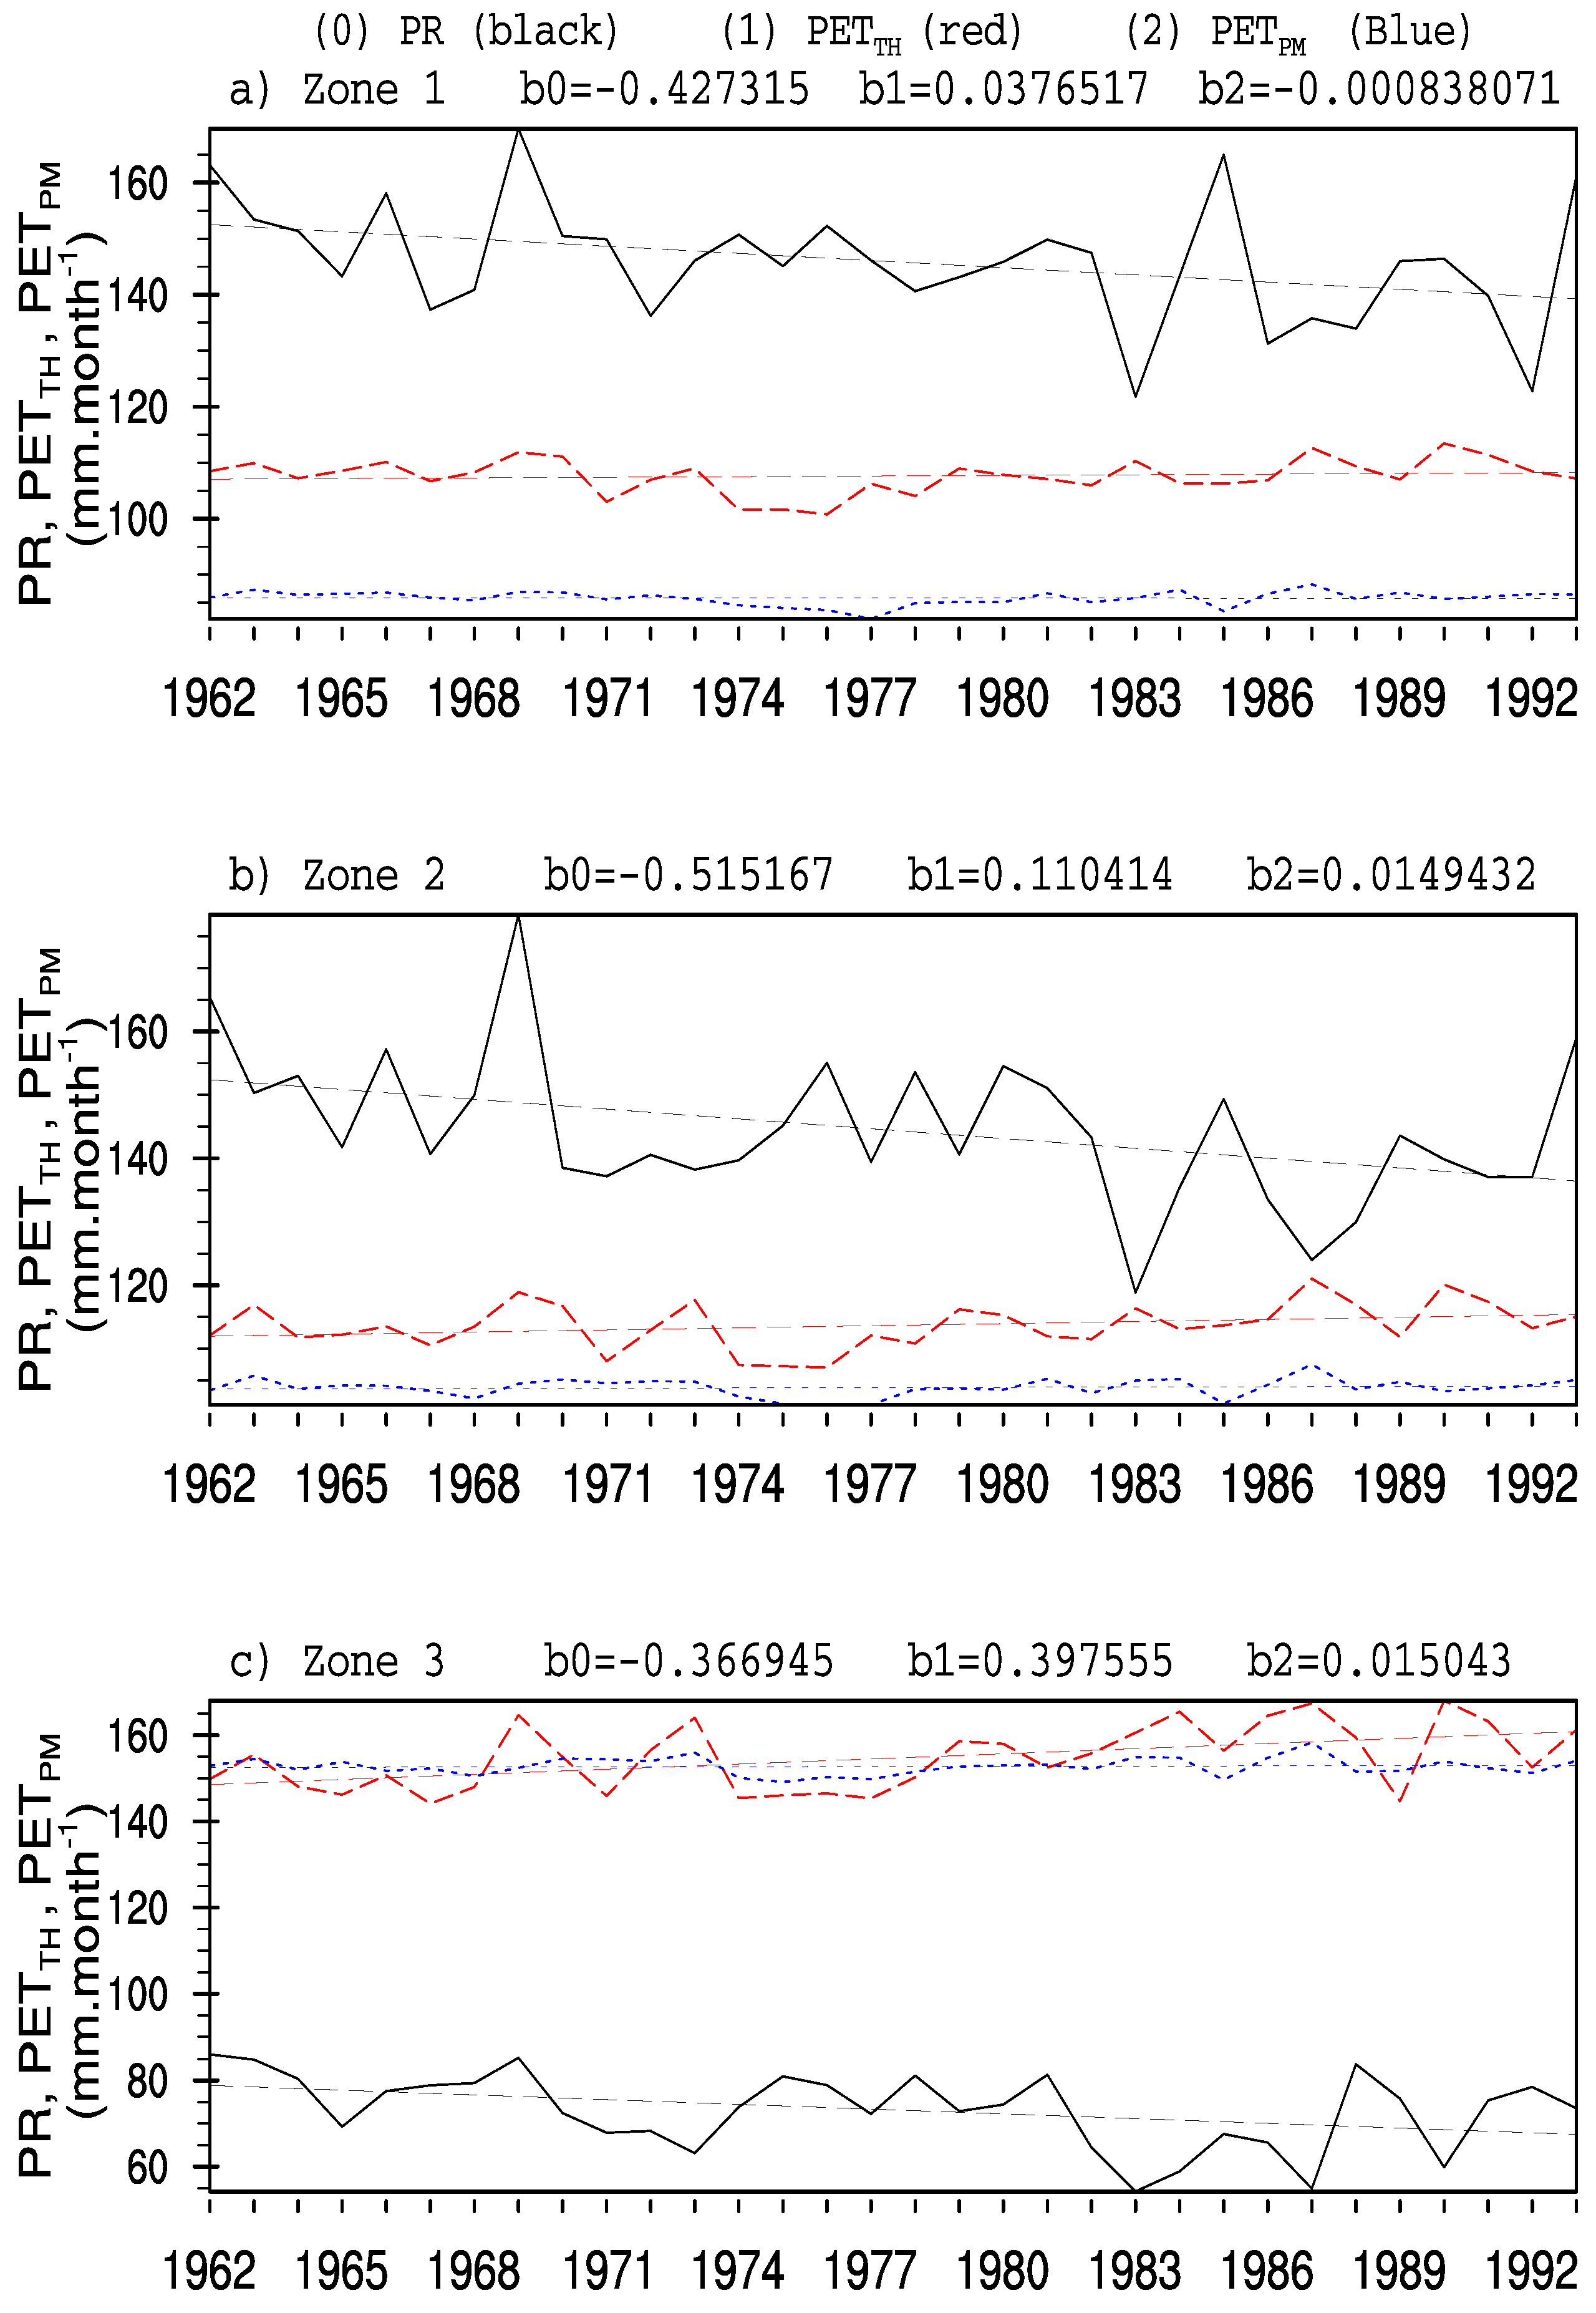
4.4. Interannual Variability of TWSC
5. Discussion and Conclusions
Acknowledgments
Author Contributions
Conflicts of Interest
Abbreviations
| CRU | Climatic Research Unit |
| ET | Evapotranspiration |
| GRACE | Gravity Recovery and Climate Experiment |
| ITD | Inter-Tropical Discontinuity |
| PET | Potential evapotranspiration |
| PR | Monthly precipitation |
| SPI | Standardized Precipitation Index |
| TAS | Surface temperature |
| T | Maximum temperatures |
| T | Average temperatures |
| T | Minimum temperatures |
| TWSC | Total water storage change |
References
- Indrani, P.; Abir, A.-T. Assessing seasonal precipitation trends in India using parametric and non-parametric statistical techniques. Theor. Appl. Climatol. 2011, 103, 1–11. [Google Scholar]
- Lu, J.; Sun, G.; McNulty, S.G.; Amatya, D.M. A comparison of six potential evapotranspiration methods for regional use in the southeastern United States. J. Am. Water Resour. Assoc. 2005, 41, 621–633. [Google Scholar] [CrossRef]
- Alexandris, S.; Stricevic, R.; Petkovic, S. Comparative analysis of reference evapotranspiration from the surface of rainfed grass in central Serbia, calculated by six empirical methods against the Penman-Monteith formula. Eur. Water 2008, 21/22, 17–28. [Google Scholar]
- Brutsaert, W.; Stricker, H. An advection-aridity approach to estimate actual regional evapotranspiration. Water Resour. Res. 1979, 15, 443–450. [Google Scholar] [CrossRef]
- Chen, J.L.; Wilson, C.R.; Famiglietti, J.S.; Rodell, M. Attenuation effect on seasonal basin-scale water storage changes from GRACE time-variable gravity. J. Geod. 2007, 81, 237–245. [Google Scholar] [CrossRef]
- Feng, W.; Zhong, M.; Lemoine, J.-M.; Biancale, R.; Hsu, H.-T.; Xia, J. Evaluation of groundwater depletion in North China using the Gravity Recovery and Climate Experiment (GRACE) data and ground-based measurements. Water Resour. Res. 2013, 49, 2110–2118. [Google Scholar] [CrossRef]
- Long, D.; Longuevergne, L.; Scanlon, B.R. Global analysis of approaches for deriving total water storage changes from GRACE satellites. Water Resour. Res. 2015, 51, 2574–2594. [Google Scholar] [CrossRef] [Green Version]
- Piao, S.; Ciais, P.; Huang, Y.; Shen, Z.; Peng, S.; Li, J.; Zhou, L.; Liu, H.; Ma, Y.; Ding, Y. The impacts of climate change on water resources and agriculture in China. Nature 2010, 467, 43–51. [Google Scholar] [CrossRef] [PubMed]
- Sadek, M.F.; Shahin, M.M.; Stigter, C.J. Evaporation from the reservoir of the High Aswan Dam, Egypt: A new comparison of relevant methods with limited data. Theor. Appl. Climatol. 1997, 56, 57–66. [Google Scholar] [CrossRef]
- Wang, D. Evaluating interannual water storage changes at watersheds in Illinois based on long-term soil moisture and groundwater level data. Water Resour. Res. 2012, 48, W03502. [Google Scholar] [CrossRef]
- Bouchet, R.J. Evapotranspiration réelle, évapotranspiration potentielle, et production agricole. Ann. Agron. 1963, 14, 543–824. [Google Scholar]
- Bouteldjaoui, F.; Bessenasse, M.; Guendouz, A. Etude comparative des différentes méthodes d’estimation de l’évapotranspiration en zone semi-aride (cas de la région de Djelfa). Nat. Technol. 2012, 2012, 109–116. [Google Scholar]
- Chen, D.; Gao, G.; Xu, C.Y.; Guo, J.; Ren, G. Comparison of the Thornthwaite method and pan data with the standard Penman-Monteith estimates of reference evapotranspiration in China. Clim. Res. 2016, 28, 123–132. [Google Scholar] [CrossRef]
- Harris, I.; Jones, P.; Osborn, T.; Lister, D. Updated high-resolution grids of monthly climatic observations - the CRU TS3.10 dataset. Int. J. Climatol. 2012. [Google Scholar] [CrossRef] [Green Version]
- McMahon, T.A.; Peel, M.C.; Lowe, L.; Srikanthan, R.; McVicar, T.R. Estimating actual, potential, reference crop and pan evaporation using standard meteorological data: A pragmatic synthesis. Hydrol. Earth Syst. Sci. 2013, 17, 1331–1363. [Google Scholar] [CrossRef]
- Allen, R.G.; Pereira, L.S.; Raes, D.; Smith, M. Crop Evapotranspiration—Guidelines for Computing Crop Water Requirements; FAO Irrigation and Drainage Paper 56; FAO: Rome, Italy, 1998. [Google Scholar]
- Cao, G.; Han, D.; Song, X. Evaluating actual evapotranspiration and impacts of groundwater storage change in the North China Plain. Hydrol. Process. 2013. [Google Scholar] [CrossRef]
- Katerji, N.; Perrier, A.; Renard, D.; Kerim, A.; Aissa, O. Modélisation de l’évapotranspiration réelle ETR d’une parcelle de luzerne : rôle d’un coefficient cultural. Agron. EDP Sci. 1983, 3, 513–521. [Google Scholar] [CrossRef]
- Moiwo, J.P.; Yang, Y.; Tao, F.; Lu, W.; Han, S. Water storage change in the Himalayas from the Gravity Recovery and Climate Experiment (GRACE) and an empirical climate model. Water Resour. Res. 2011, 47, W07521. [Google Scholar] [CrossRef]
- Sharma, V.; Kilic, A.; Irmak, S. Impact of scale/resolution on evapotranspiration from Landsat and Modis images. Water Resour. Res. 2016. [Google Scholar] [CrossRef]
- Brutsaert, W. A generalized complementary principle with physical constraints for land-surface evaporation. Water Resour. Res. 2015, 51, 8087–8093. [Google Scholar] [CrossRef]
- Sean, S.; Wahr, J. Estimating Large-Scale Precipitation Minus Evapotranspiration from GRACE Satellite Gravity Measurements. J. Hydrometeorol. 2005, 7, 252–270. [Google Scholar]
- Longuevergne, L.; Wilson, C.R.; Scanlon, B.R.; Cretaux, J.F. GRACE water storage estimates for the Middle East and other regions with significant reservoir and lake storage. Hydrol. Earth Syst. Sci. 2013, 17, 4817–4830. [Google Scholar] [CrossRef] [Green Version]
- Mo, X.; Wu, J.J.; Wang, Q.; Zhou, H. Variations in water storage in China over recent decades from GRACE observations and GLDAS. Nat. Hazards Earth Syst. Sci. 2016, 16, 469–482. [Google Scholar] [CrossRef]
- Moiwo, J.P.; Tao, F.; Lu, W. Analysis of satellite-based and in situ hydro-climatic data depicts water storage depletion in North China Region. Hydrol. Process. 2012. [Google Scholar] [CrossRef]
- Yirdaw, S.Z.; Snelgrove, K.R.; Agboma, C.O. GRACE satellite observations of terrestrial moisture changes for drought characterization in the Canadian Prairie. J. Hydrol. 2008, 356, 84–92. [Google Scholar] [CrossRef]
- Zeng, N.; Yoon, J.H.; Mariotti, A.; Swenson, S. Variability of basin-scale terrestrial water storage from a P-E-R water budget method: the Amazon and the Mississippi. J. Clim. 2008, 21, 248–265. [Google Scholar] [CrossRef]
- Moiwo, J.P.; Yang, Y.; Han, S.; Lu, W.; Yan, N.; Wu, B. A method for estimating soil moisture storage in regions under water stress and storage depletion: A case study of Hai River Basin, North China. Hydrol. Process. 2011, 25, 2275–2287. [Google Scholar] [CrossRef]
- Zhang, L.; Dawes, W.R.; Walker, G.R. Response of mean annual evapotranspiration to vegetation changes at catchment scale. Water Resour. Res. 2001, 37, 701–708. [Google Scholar] [CrossRef]
- Guenang, G.M.; Mkankam, K.F. Onset, retreat and length of the rainy season over Cameroon. Atmos. Sci. Lett. 2012, 13, 120–127. [Google Scholar] [CrossRef]
- Guenang, G.M.; Mkankam Kamga, F. Computation of the Standardized Precipitation Index (SPI) and its use to assess drought occurrences in Cameroon over recent decades. J. Appl. Meteorol. Climatol. 2014, 53, 2310–2324. [Google Scholar] [CrossRef]
- Mortimore, M.; Anderson, S.; Cotula, L.; Davies, J.; Faccer, K.; Hesse, C.; Morton, J.; Nyangena, W.; Skinner, J.; Wolfangel, C. Dryland Opportunities: A New Paradigm for People, Ecosystems and Development; IUCN: Gland, Switzerland; IIED: London, UK; UNDP/DDC: Nairobi, Kenya, 2009; p. 86. [Google Scholar]
- Scheff, J.; Frierson, D. Terrestrial aridity and its response to greenhouse warming across CMIP5 climate models. J. Clim. 2015. [Google Scholar] [CrossRef]
- Middleton, N.; Thomas, D.S.G. World Atlas of Desertification, 2nd ed.; Wiley: Hoboken, NJ, USA, 1997; p. 182. [Google Scholar]
- Safriel, U.; Adeel, Z.; Niemeijer, D.; Puigdefabregas, J.; White, R.; Lal, R.; Winslow, M.; Ziedler, J.; Prince, S.; Archer, E.; et al. Dryland Systems. In Millennium Ecosystem Assessment; Hassan, R., Scholes, R., Ash, N., Eds.; World Resources Institute: Washington, DC, USA, 2005; Volume 1, Charpter 22; pp. 623–662. [Google Scholar]
- Wu, G.; Chen, S.; Su, R.; Jia, M.; Li, W. Temporal trend in surface water resources in Tianjin in the Haihe River Basin, China. Hydrol. Process. 2011, 25, 2141–2151. [Google Scholar] [CrossRef]
- Thornthwaite, C. An Approach Toward a Rational Classification of Climate. Geograph. Rev. 1948, 38, 55–94. [Google Scholar] [CrossRef]
- Ilesanmi, O.O. An ampirical formulation of the onset, advance and retreat of rainfall in Nigeria. J. Trop. Geogr. 1972, 34, 17–24. [Google Scholar]
- Ngachie, V. A general assessment of soil resources and soil fertility constraints in Cameroon on the basis of FAO-UNESCO soil map analysis. Tropicultura 1992, 10, 61–63. [Google Scholar]
- Yerima, B.P.K.; Van Ranst, E. Major Soil Classification Systems Used in the Tropics: Soils of Cameroon; Trafford Publishing: Victoria, BC, Canada, 2005; p. 315. [Google Scholar]


| Zone | Aridity Index | Classification | |
|---|---|---|---|
| PR/PET | PR/PET | ||
| 1 | 1.31919 | 1.65474 | humid |
| 2 | 1.23678 | 1.35346 | humid |
| 3 | 0.460394 | 0.466259 | semiarid |
| Zone | Error on Onset Month | Error on Retreat Month | ||
|---|---|---|---|---|
| Using TWSC | Using TWSC | Using TWSC | Using TWSC | |
| 1 | <1 month | <1 month | <1 month | <1 month |
| 2 | ≃0 | ≃0 | <1 month | <1 month |
| 3 | >1 month | >1 month | ≃0 | ≃0 |
| (mm·month) | (mm·month) | |||||
|---|---|---|---|---|---|---|
| Month | Zone 1 | Zone 2 | Zone 3 | Zone 1 | Zone 2 | Zone 3 |
| January | −41.58 ± 26 | −111.50 ± 9 | −158.70 ± 6 | −60.35 ± 25 | −100.75 ± 10 | −89.64 ± 15 |
| February | −30.87 ± 28 | −112.48 ± 19 | −187.16 ± 6 | −42.96 ± 30 | −109.13 ± 21 | −131.84 ± 18 |
| March | 54.64 ± 36 | −43.86 ± 39 | −173.40 ± 8 | 22.09 ± 38 | −75.70 ± 38 | −209.44 ± 20 |
| April | 70.64 ± 28 | 7.04 ± 36 | −157.61 ± 22 | 49.83 ± 29 | −13.58 ± 39 | −219.38 ± 34 |
| May | 109.14 ± 27 | 74.89 ± 30 | −89.66 ± 31 | 79.96 ± 27 | 55.68 ± 31 | −152.44 ± 38 |
| June | 61.62 ± 23 | 117.18 ± 24 | −29.51 ± 28 | 37.37 ± 24 | 103.16 ± 26 | −57.72 ± 36 |
| July | 32.27 ± 22 | 184.49 ± 33 | 73.62 ± 35 | 11.04 ± 22 | 168.61 ± 34 | 56.57 ± 41 |
| August | 69.59 ± 29 | 208.63 ± 33 | 123.69 ± 41 | 48.53 ± 28 | 192.96 ± 31 | 110.37 ± 47 |
| September | 149.33 ± 33 | 199.08 ± 33 | 30.12 ± 37 | 129.75 ± 34 | 188.44 ± 35 | 19.39 ± 42 |
| October | 187.38 ± 47 | 95.50 ± 60 | −100.62 ± 31 | 164.19 ± 47 | 80.80 ± 60 | −114.47 ± 30 |
| November | 70.00 ± 32 | −64.20 ± 30 | −155.51 ± 4 | 48.91 ± 30 | −64.61 ± 28 | −119.79 ± 15 |
| December | −27.18 ± 23 | −105.48 ± 10 | −153.47 ± 5 | −45.65 ± 22 | −95.01 ± 9 | −94.47 ± 13 |
| (mm·month) | |||
|---|---|---|---|
| Month | Zone 1 | Zone 2 | Zone 3 |
| January | 18.77 ± 7 | −10.74 ± 10 | −69.07 ± 12 |
| February | 12.09 ± 5 | −3.35 ± 7 | −55.32 ± 14 |
| March | 32.55 ± 6 | 31.83 ± 7 | 36.04 ± 21 |
| April | 20.81 ± 6 | 20.61 ± 8 | 61.77 ± 23 |
| May | 29.18 ±5 | 19.20 ± 4 | 62.77 ± 17 |
| June | 24.26 ± 4 | 14.01 ± 4 | 28.21 ± 12 |
| July | 21.24 ± 3 | 15.88 ± 3 | 17.05 ± 9 |
| August | 21.06 ± 4 | 15.66 ± 5 | 13.31 ± 9 |
| September | 19.58 ± 3 | 10.64 ± 4 | 10.73 ± 8 |
| October | 23.19 ± 4 | 14.70 ± 4 | 13.85 ± 9 |
| November | 21.09 ± 5 | 0.41 ± 8 | −35.72 ± 14 |
| December | 18.47 ± 6 | −10.47 ± 8 | −58.99 ± 10 |
© 2016 by the authors; licensee MDPI, Basel, Switzerland. This article is an open access article distributed under the terms and conditions of the Creative Commons Attribution (CC-BY) license (http://creativecommons.org/licenses/by/4.0/).
Share and Cite
Guenang, G.M.; Vondou, D.A.; Mkankam Kamga, F. Total Water Storage Change in Cameroon: Calculation, Variability and Link with Onset and Retreat Dates of the Rainy Season. Hydrology 2016, 3, 36. https://doi.org/10.3390/hydrology3040036
Guenang GM, Vondou DA, Mkankam Kamga F. Total Water Storage Change in Cameroon: Calculation, Variability and Link with Onset and Retreat Dates of the Rainy Season. Hydrology. 2016; 3(4):36. https://doi.org/10.3390/hydrology3040036
Chicago/Turabian StyleGuenang, Guy Merlin, Derbetini A. Vondou, and Francois Mkankam Kamga. 2016. "Total Water Storage Change in Cameroon: Calculation, Variability and Link with Onset and Retreat Dates of the Rainy Season" Hydrology 3, no. 4: 36. https://doi.org/10.3390/hydrology3040036