Extreme Precipitation Indices Trend Assessment over the Upper Oueme River Valley-(Benin)


Abstract
:1. Introduction
2. Materials and Methods
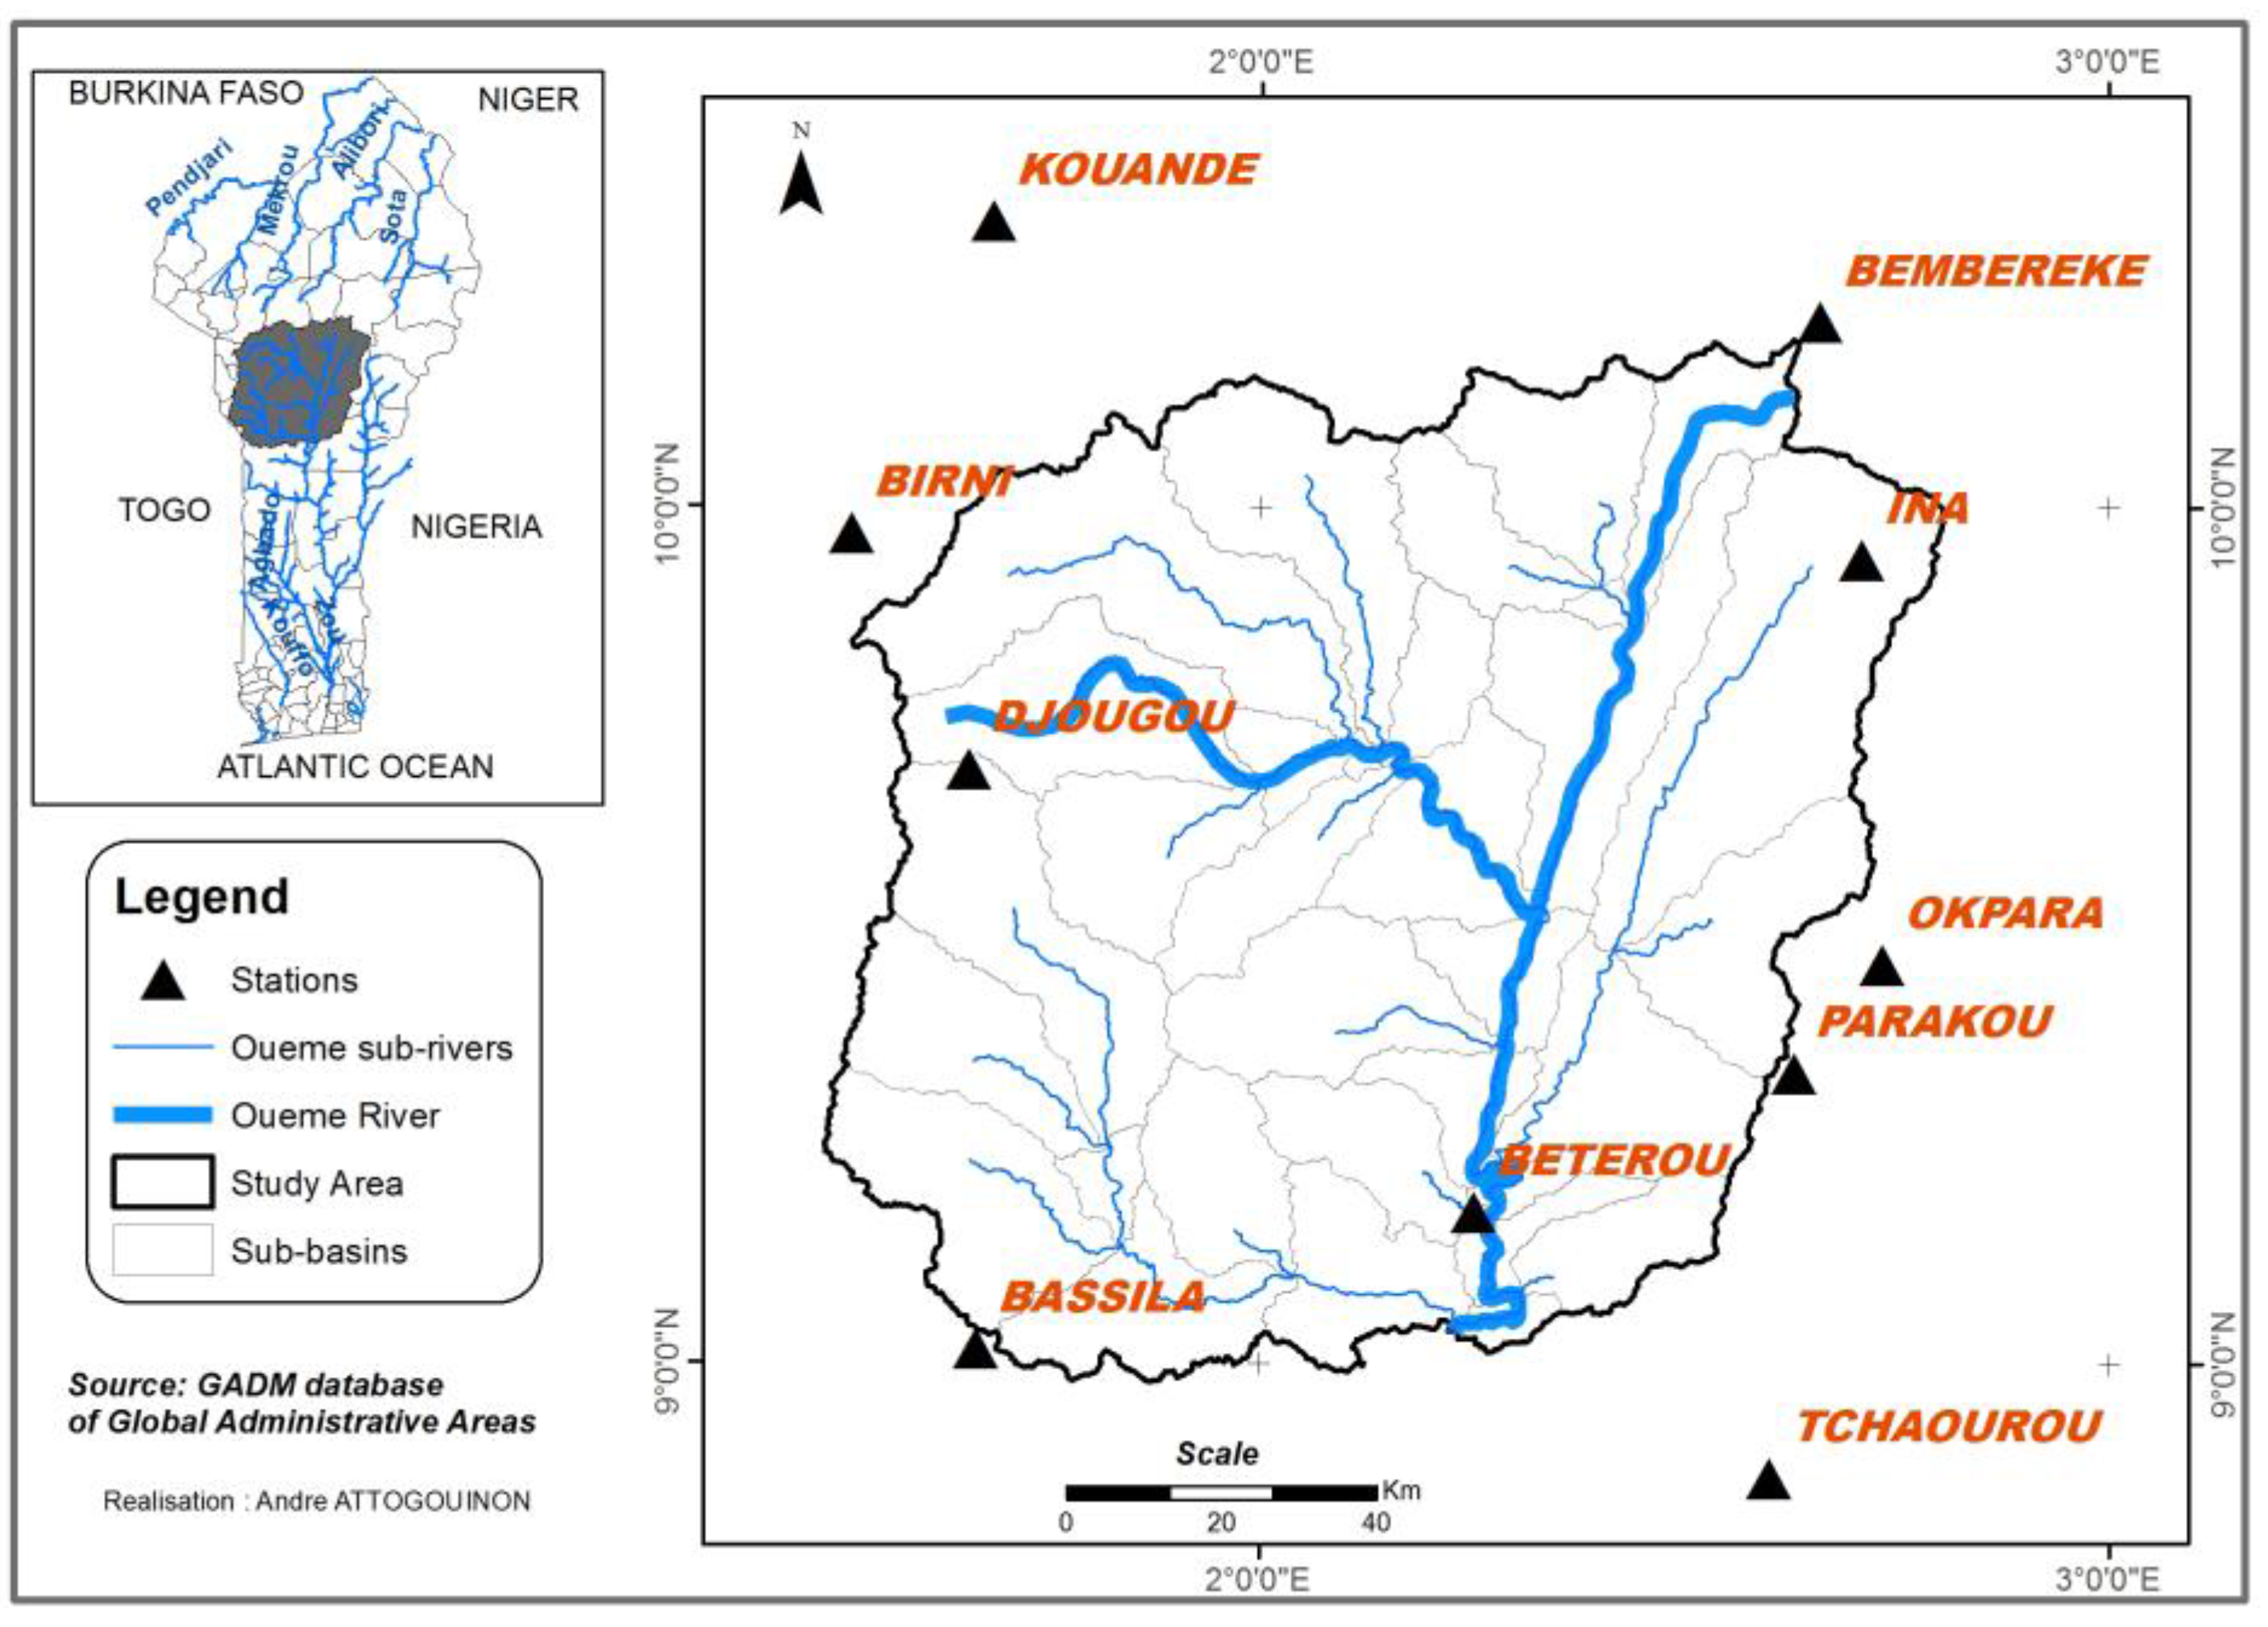
2.1. Materials
2.2. Methods
2.2.1. Extreme Rainfall Indices
2.2.2. Trends Detection
3. Results
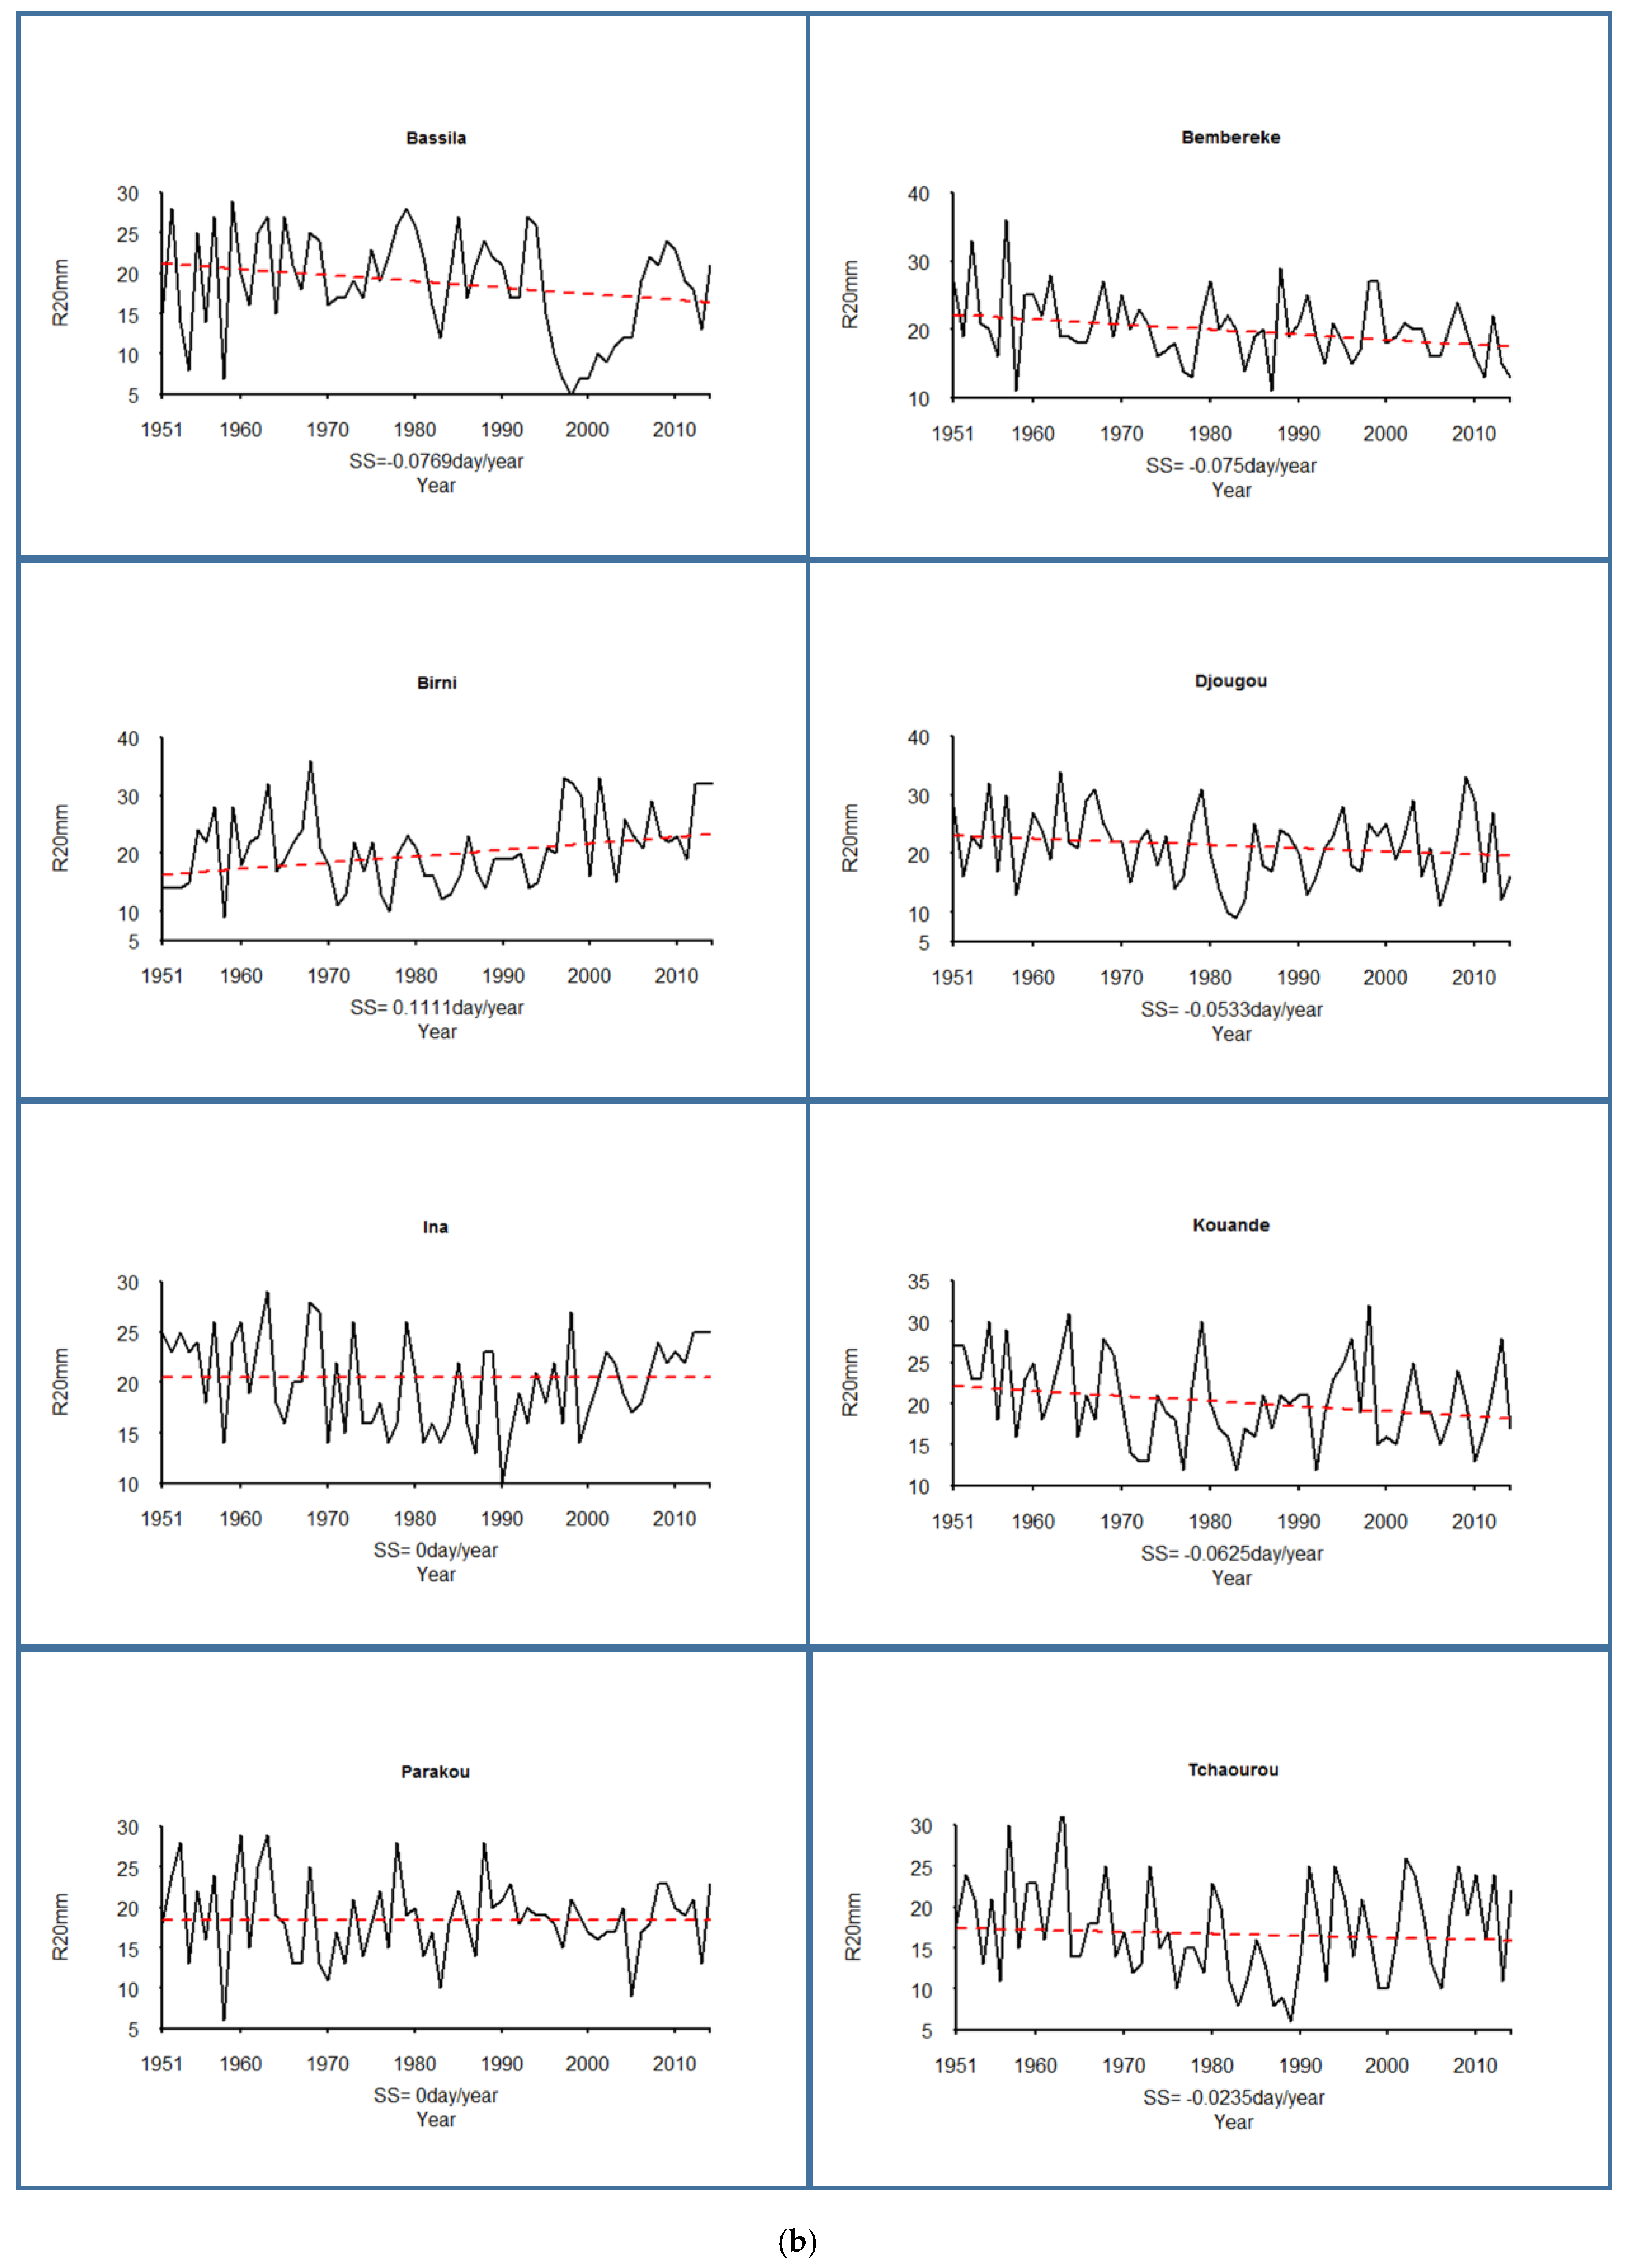
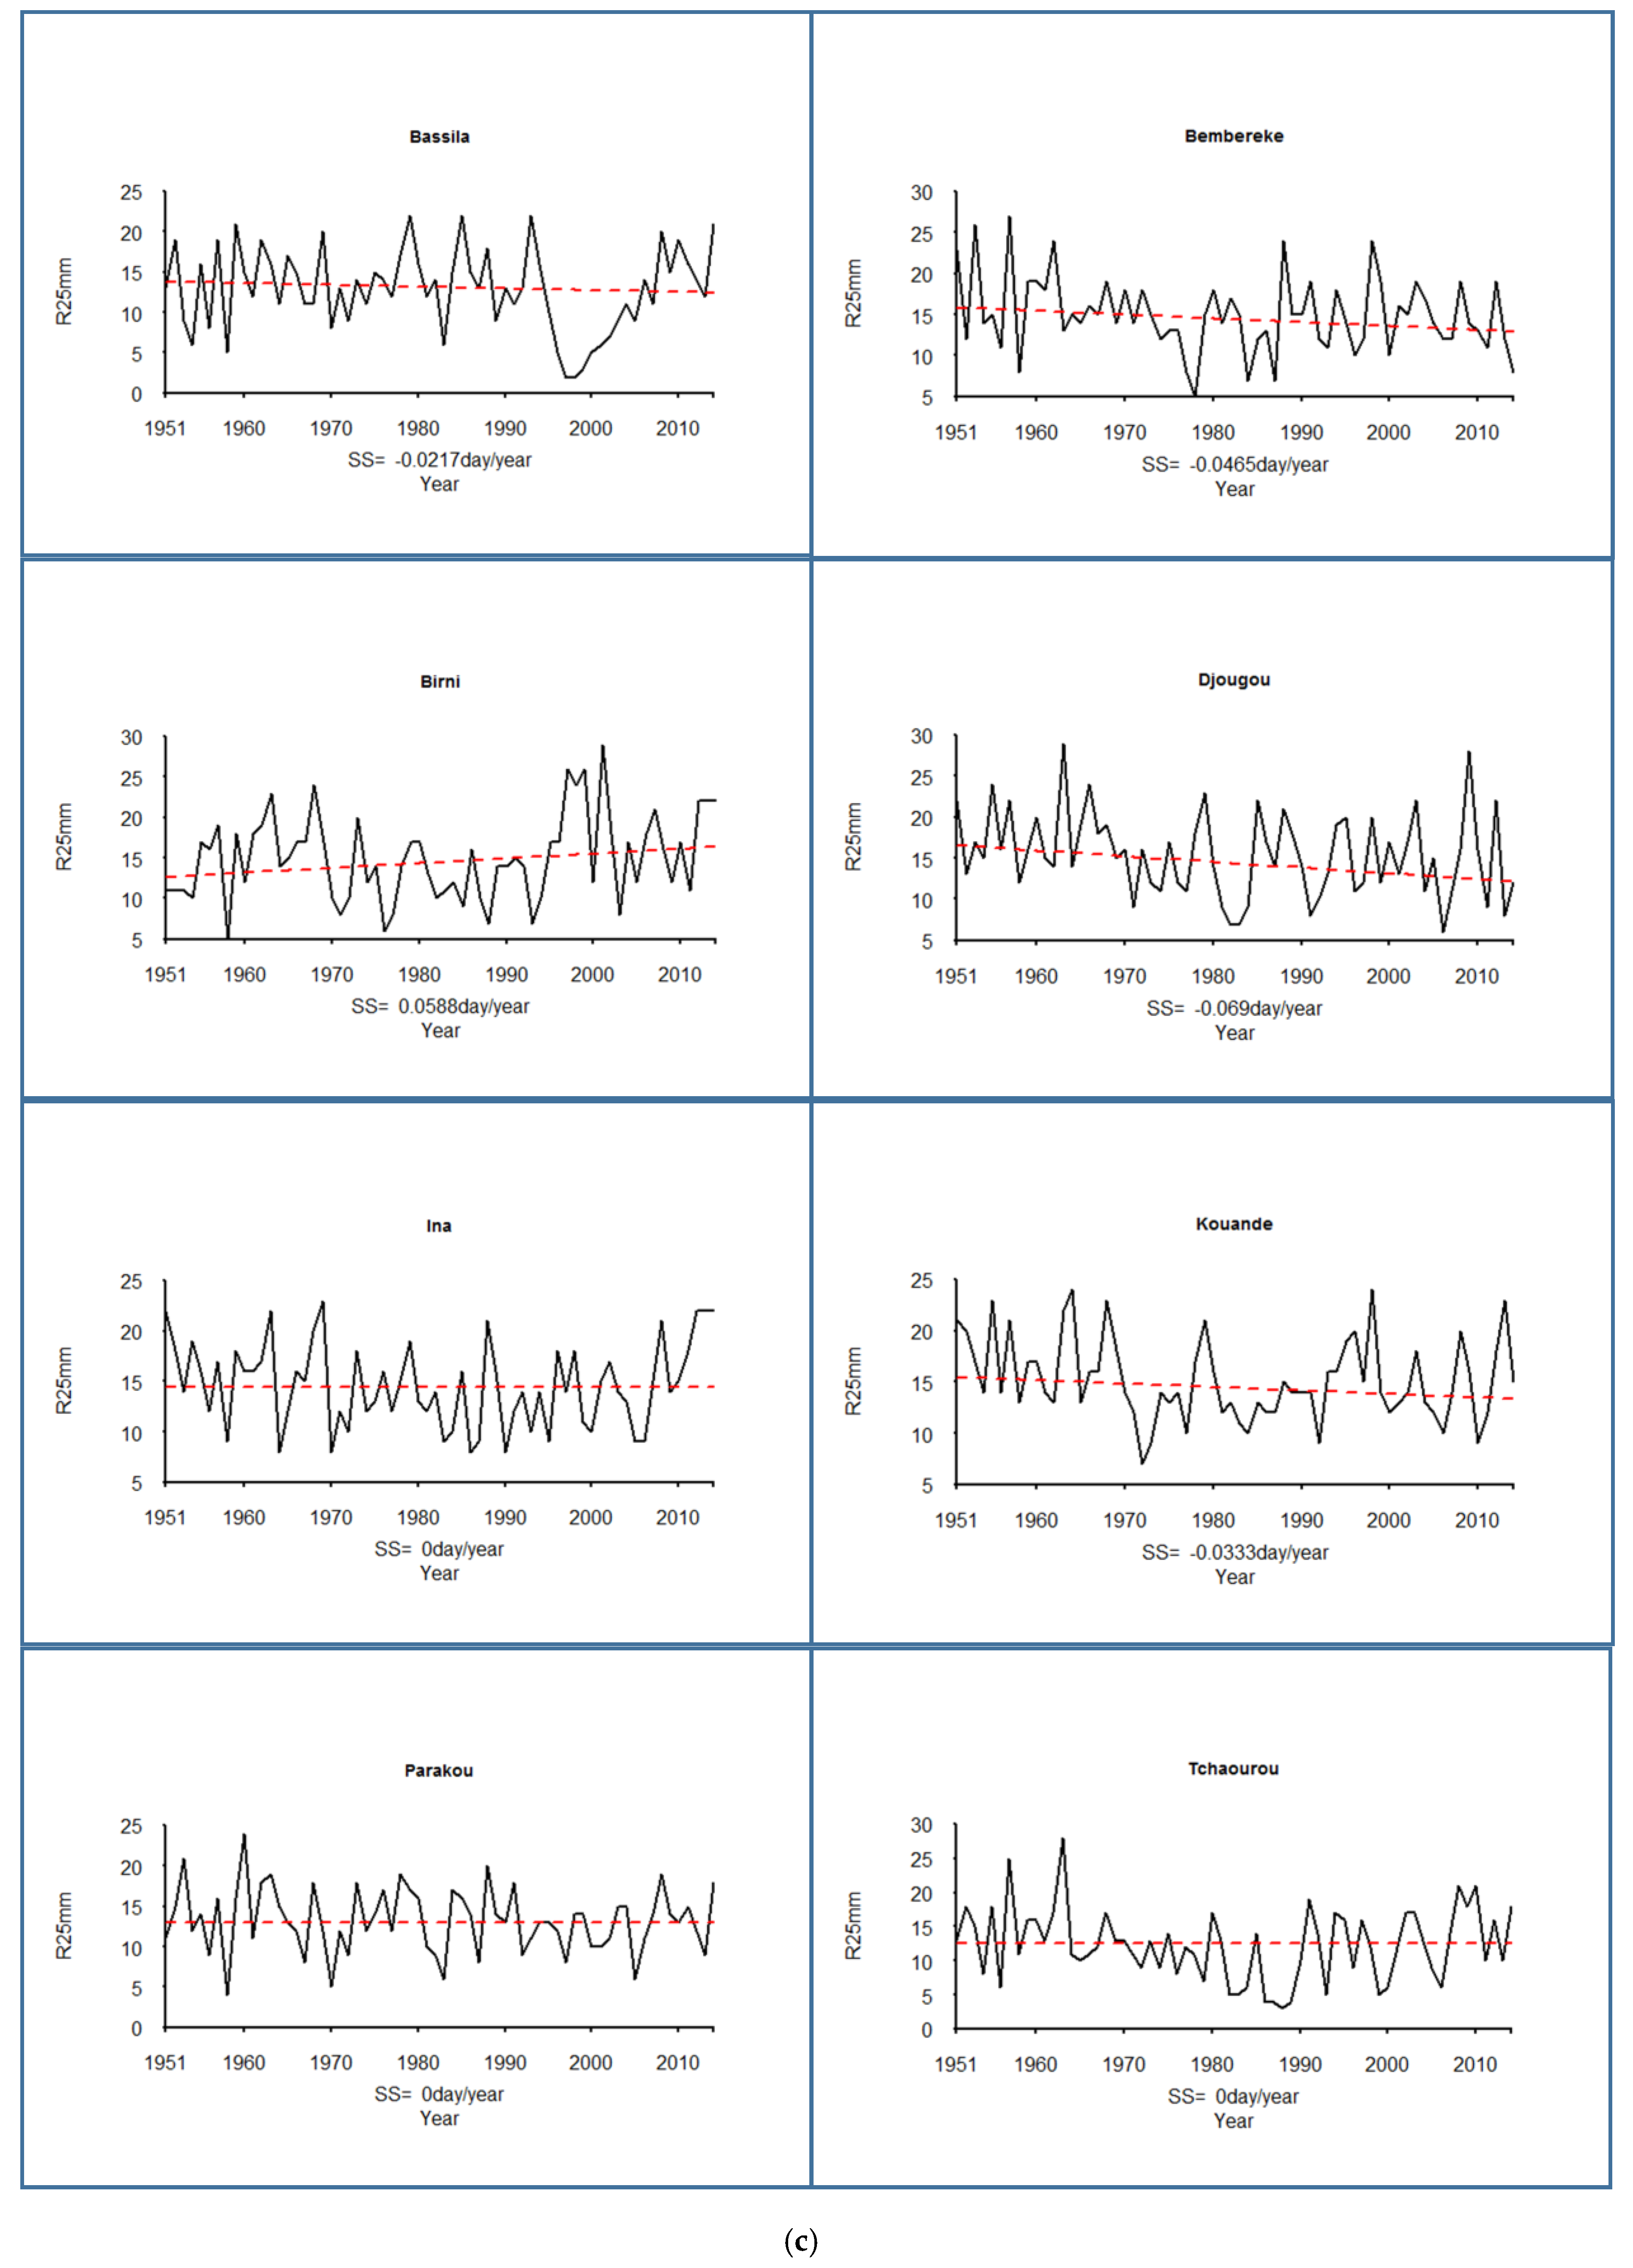
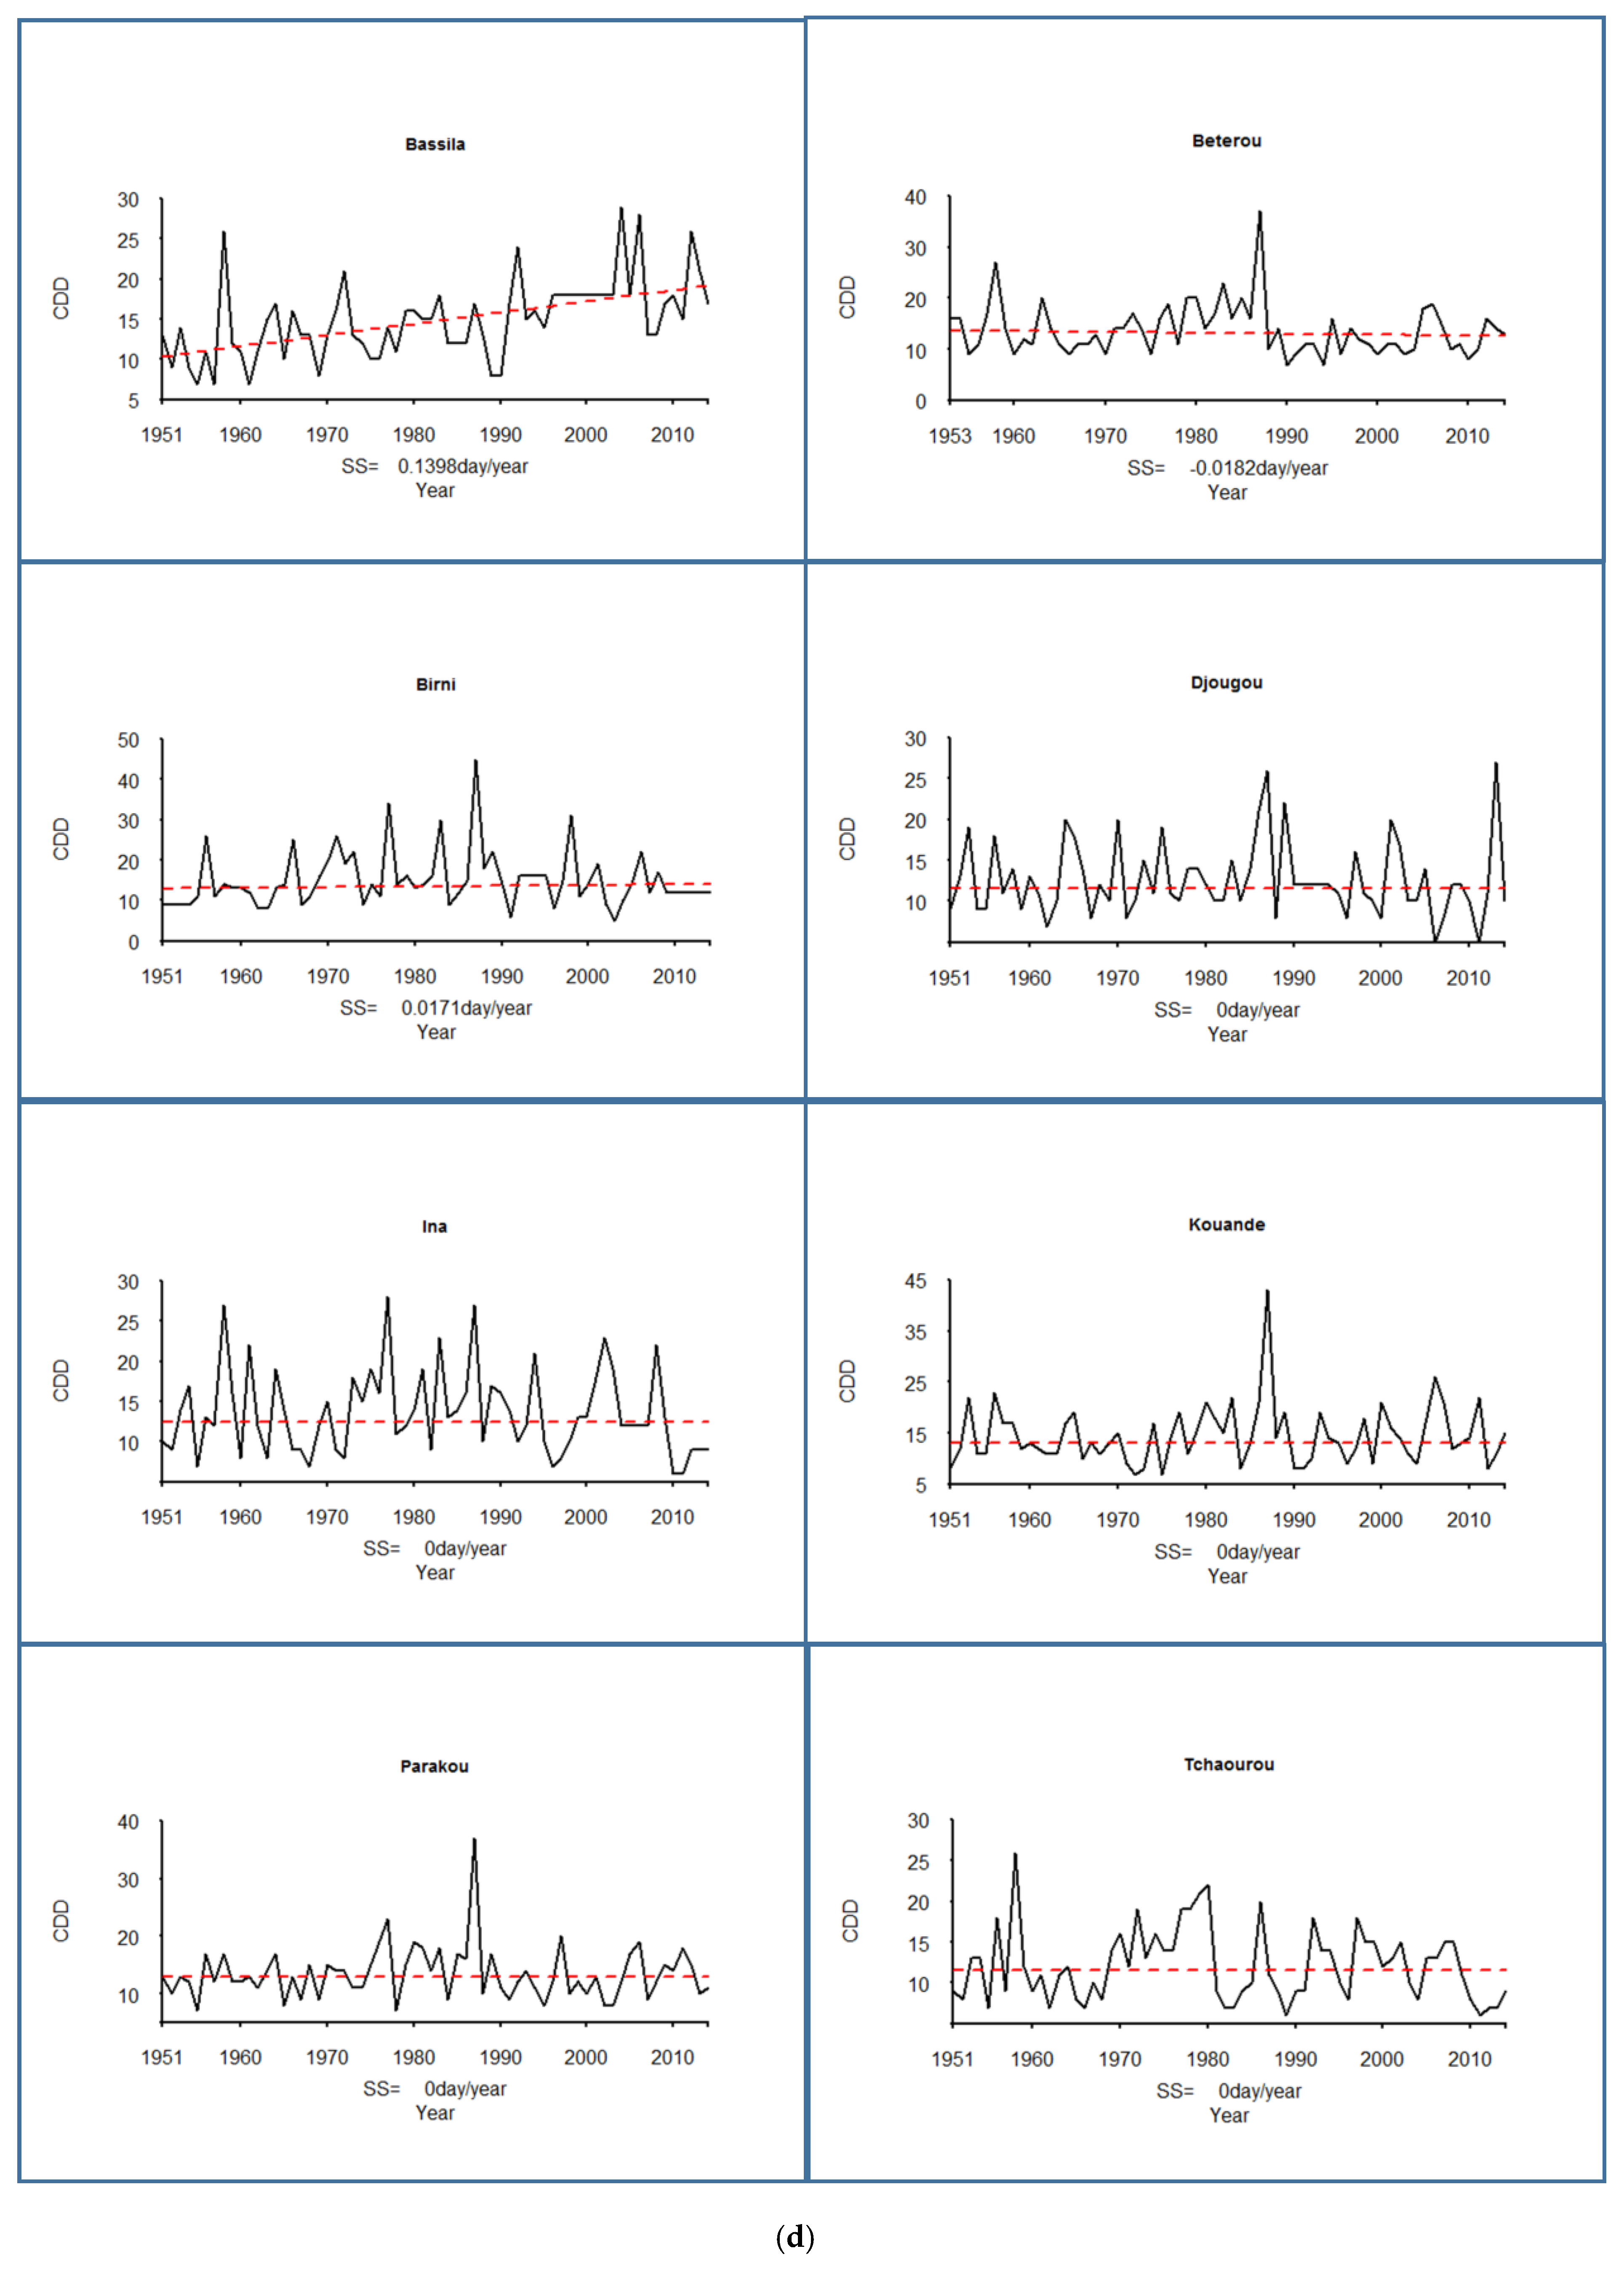
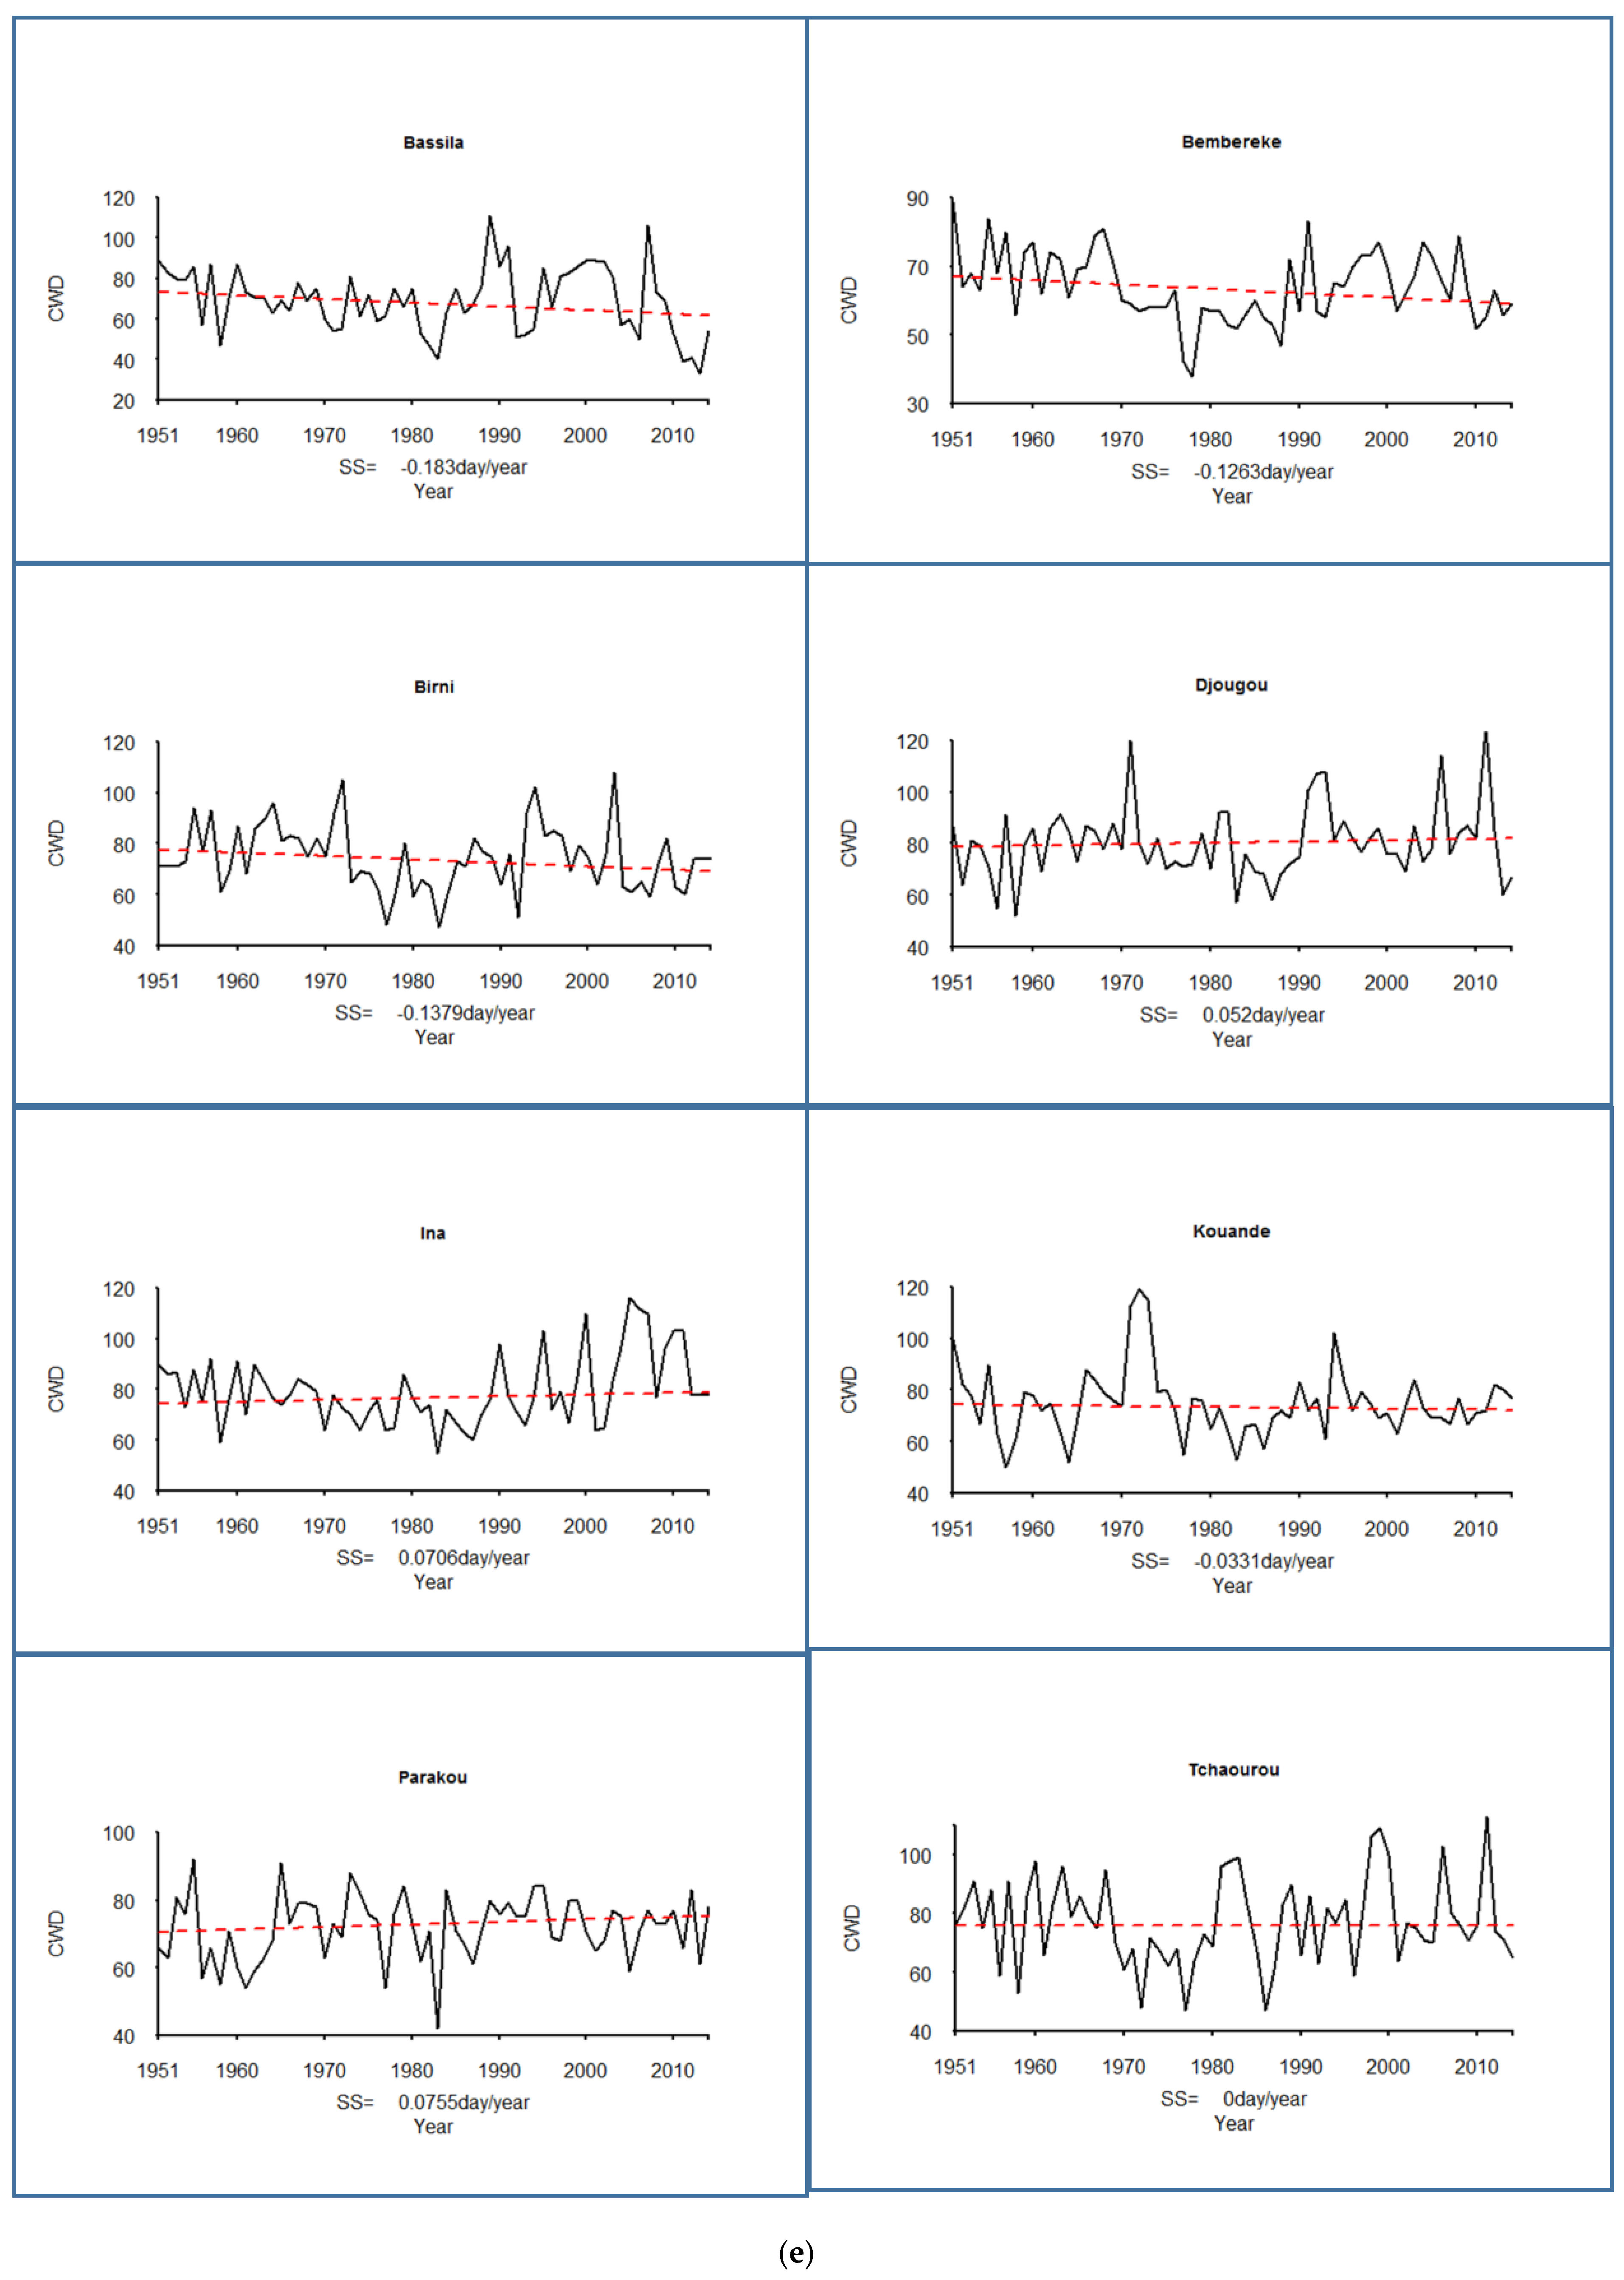
3.1. Trends in Frequency Indices
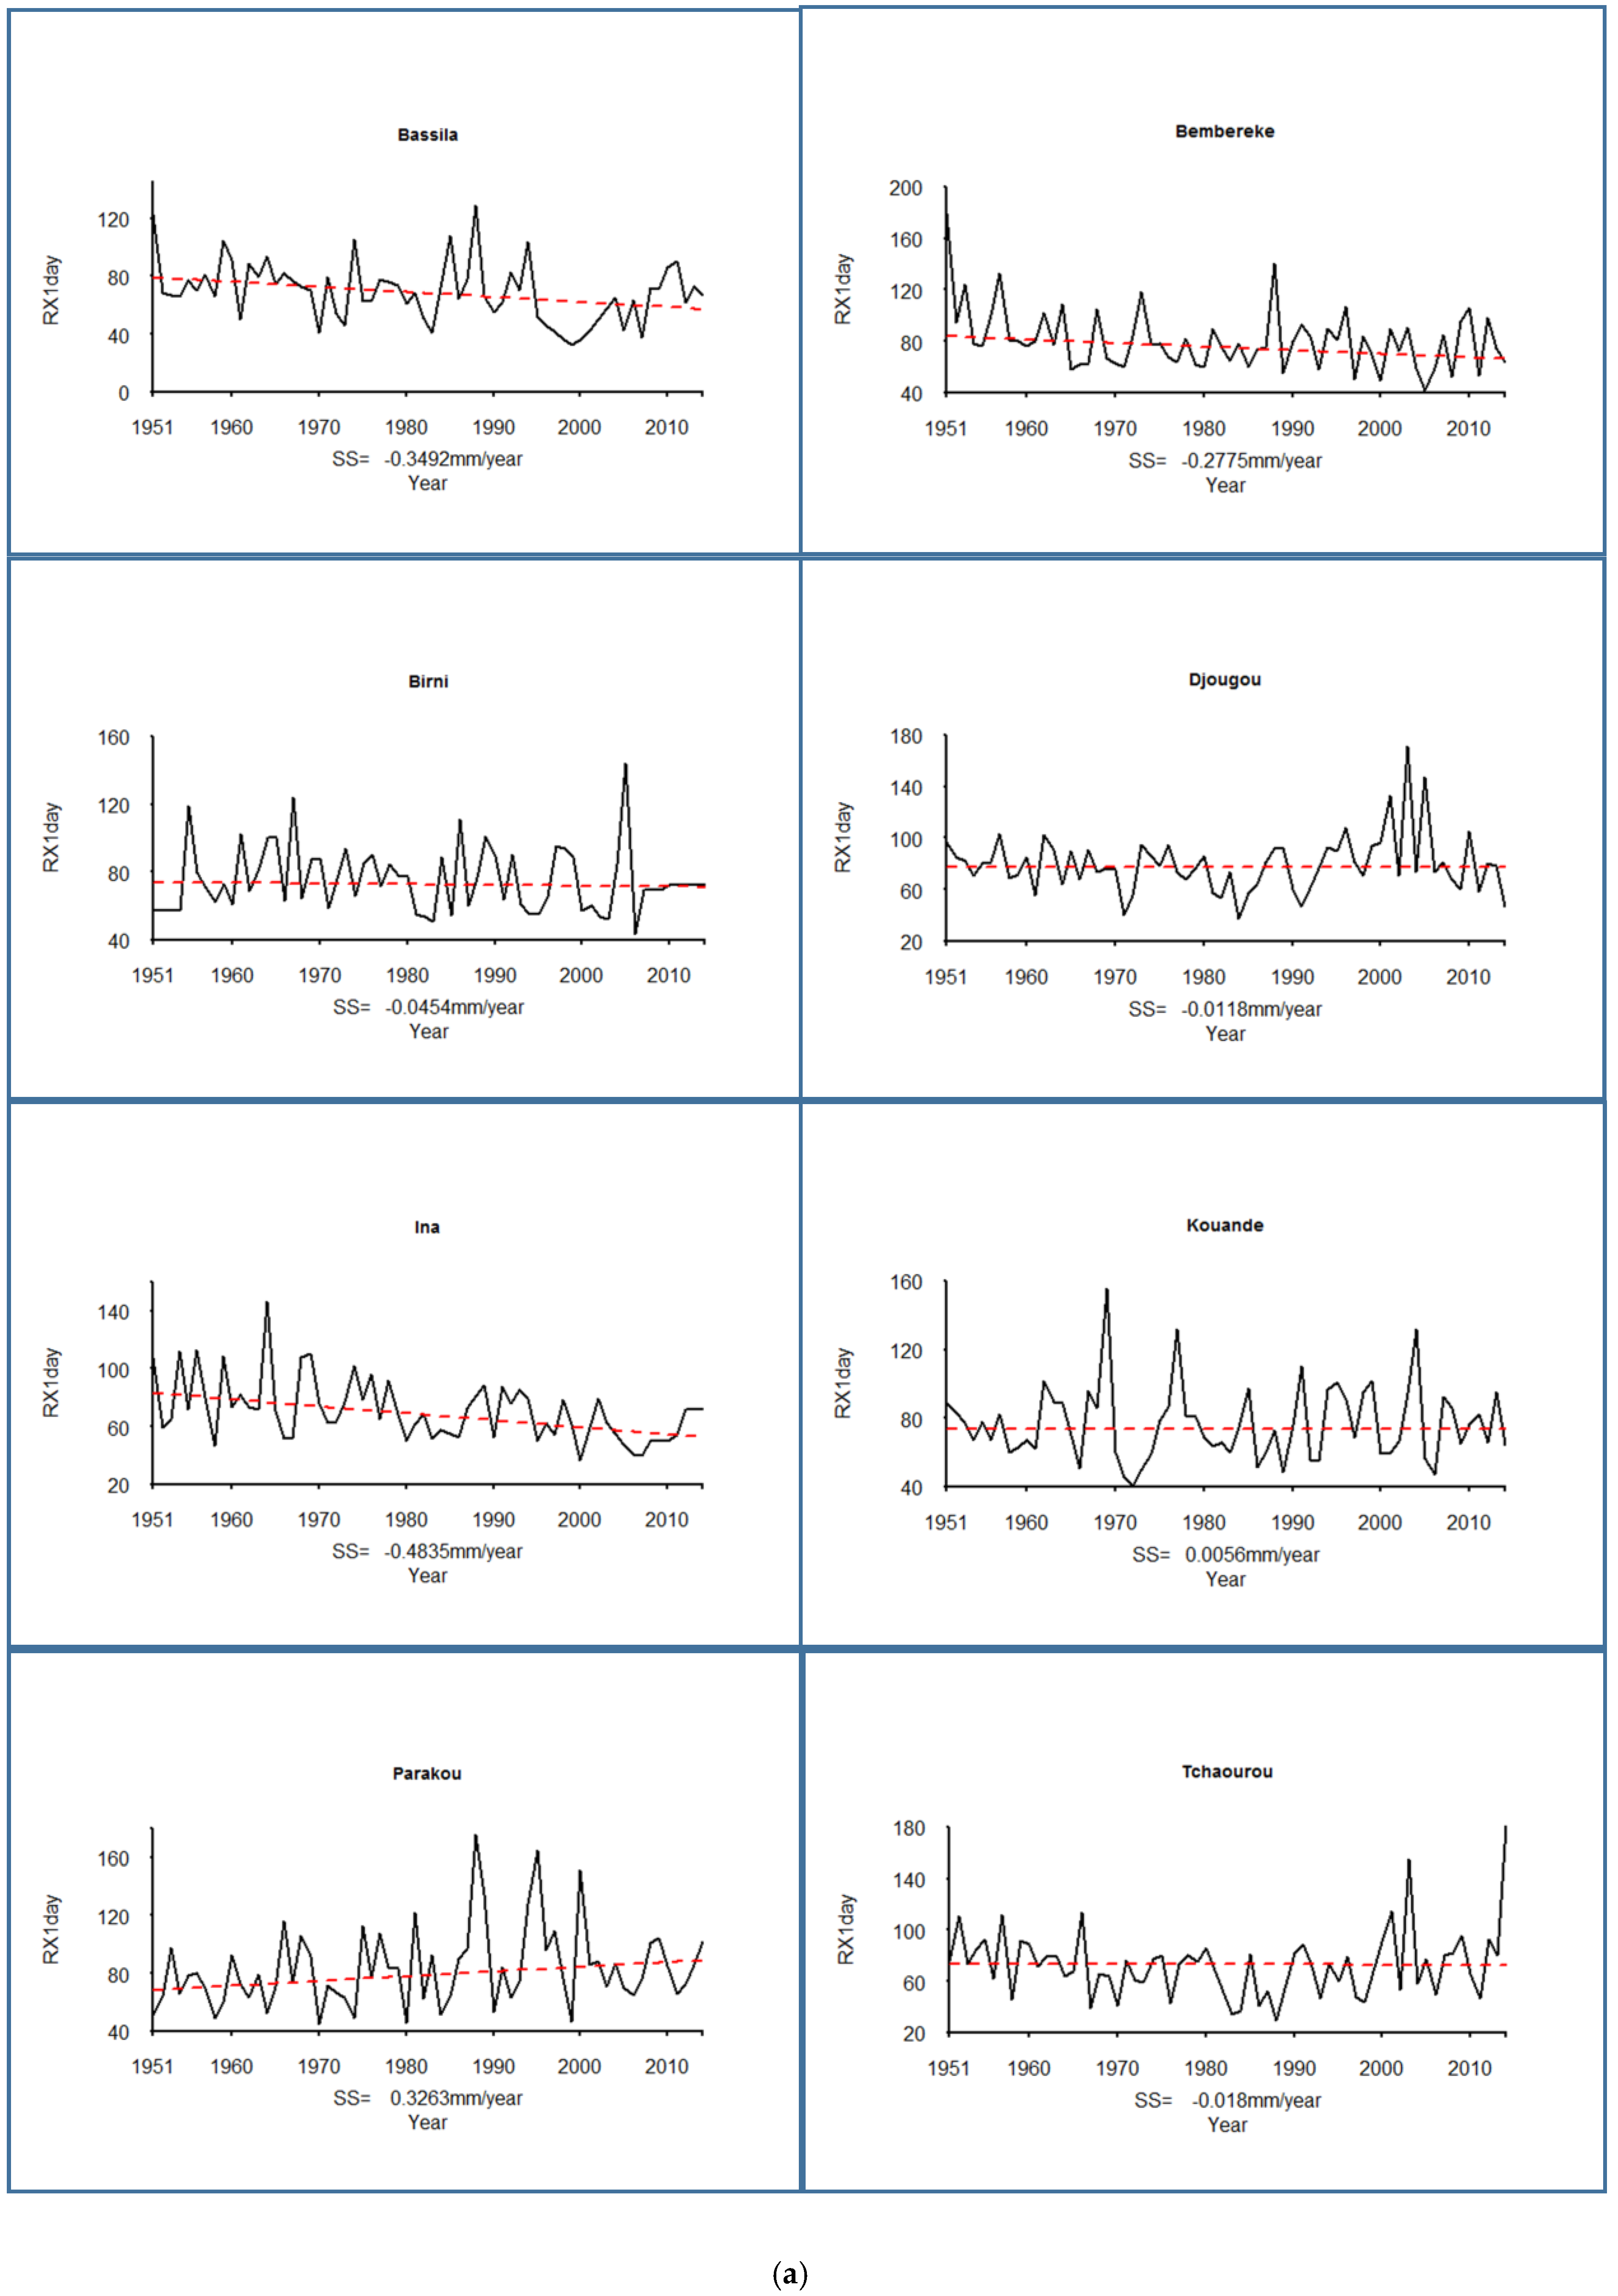
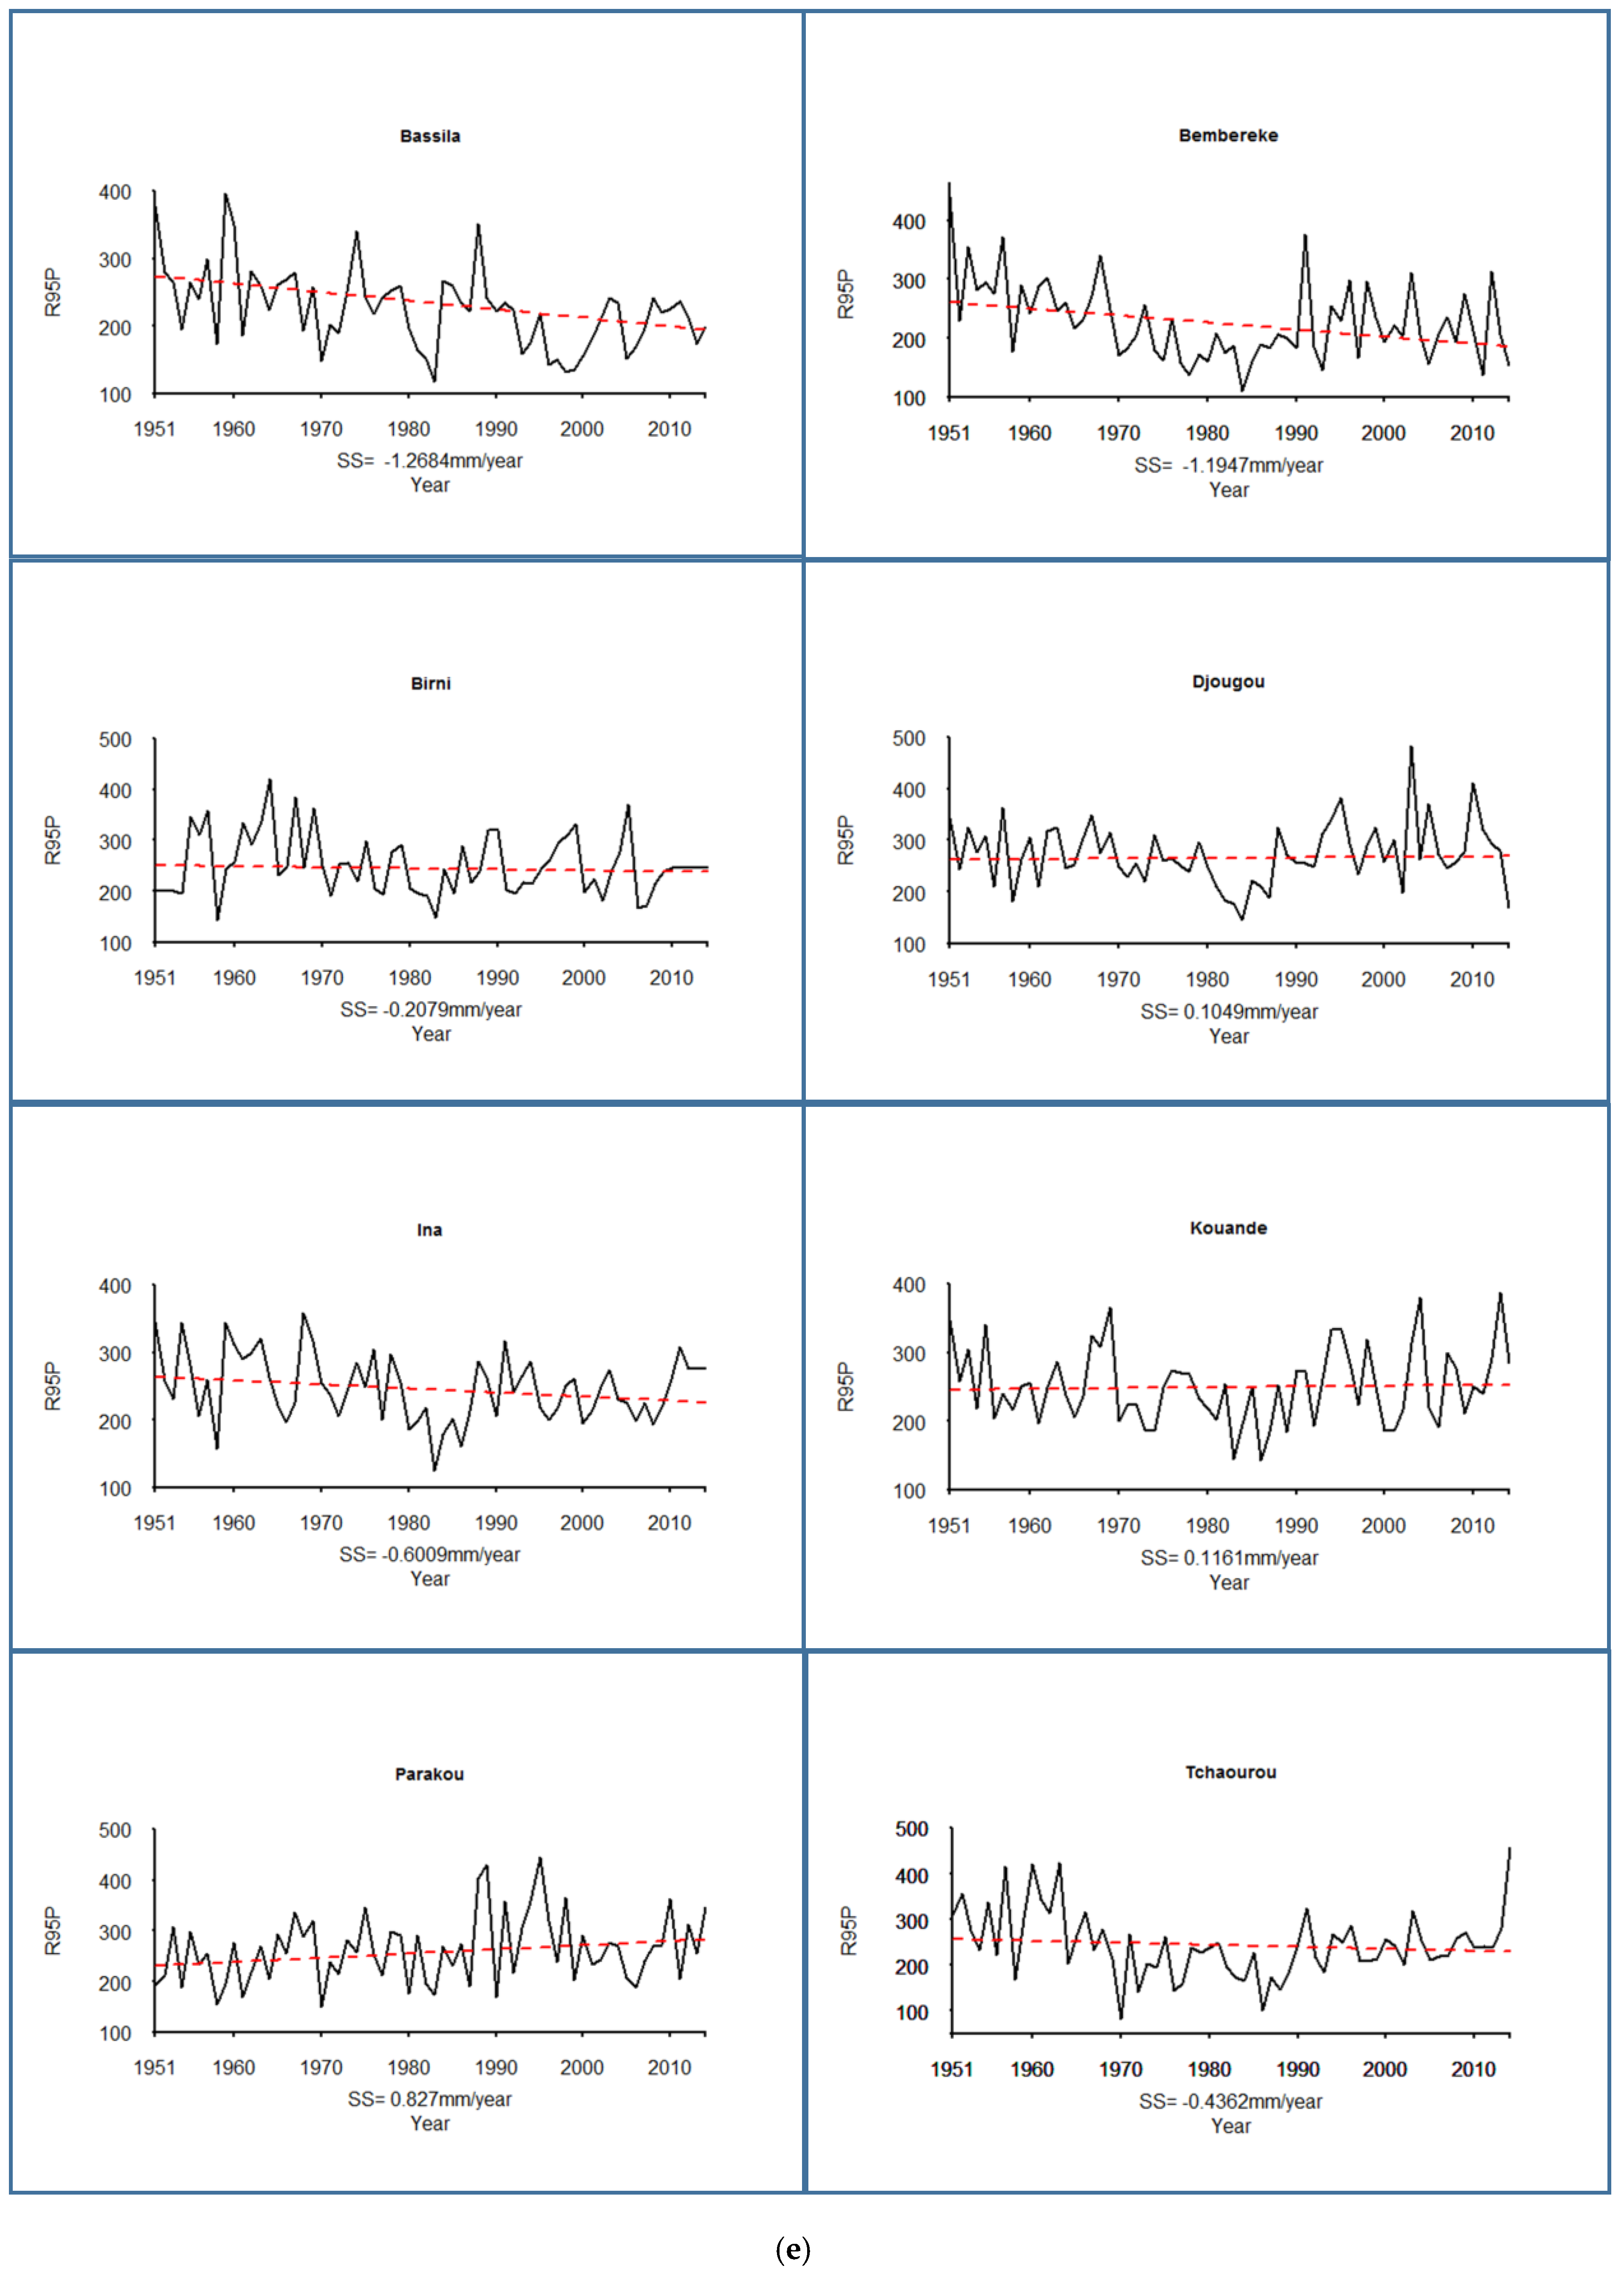
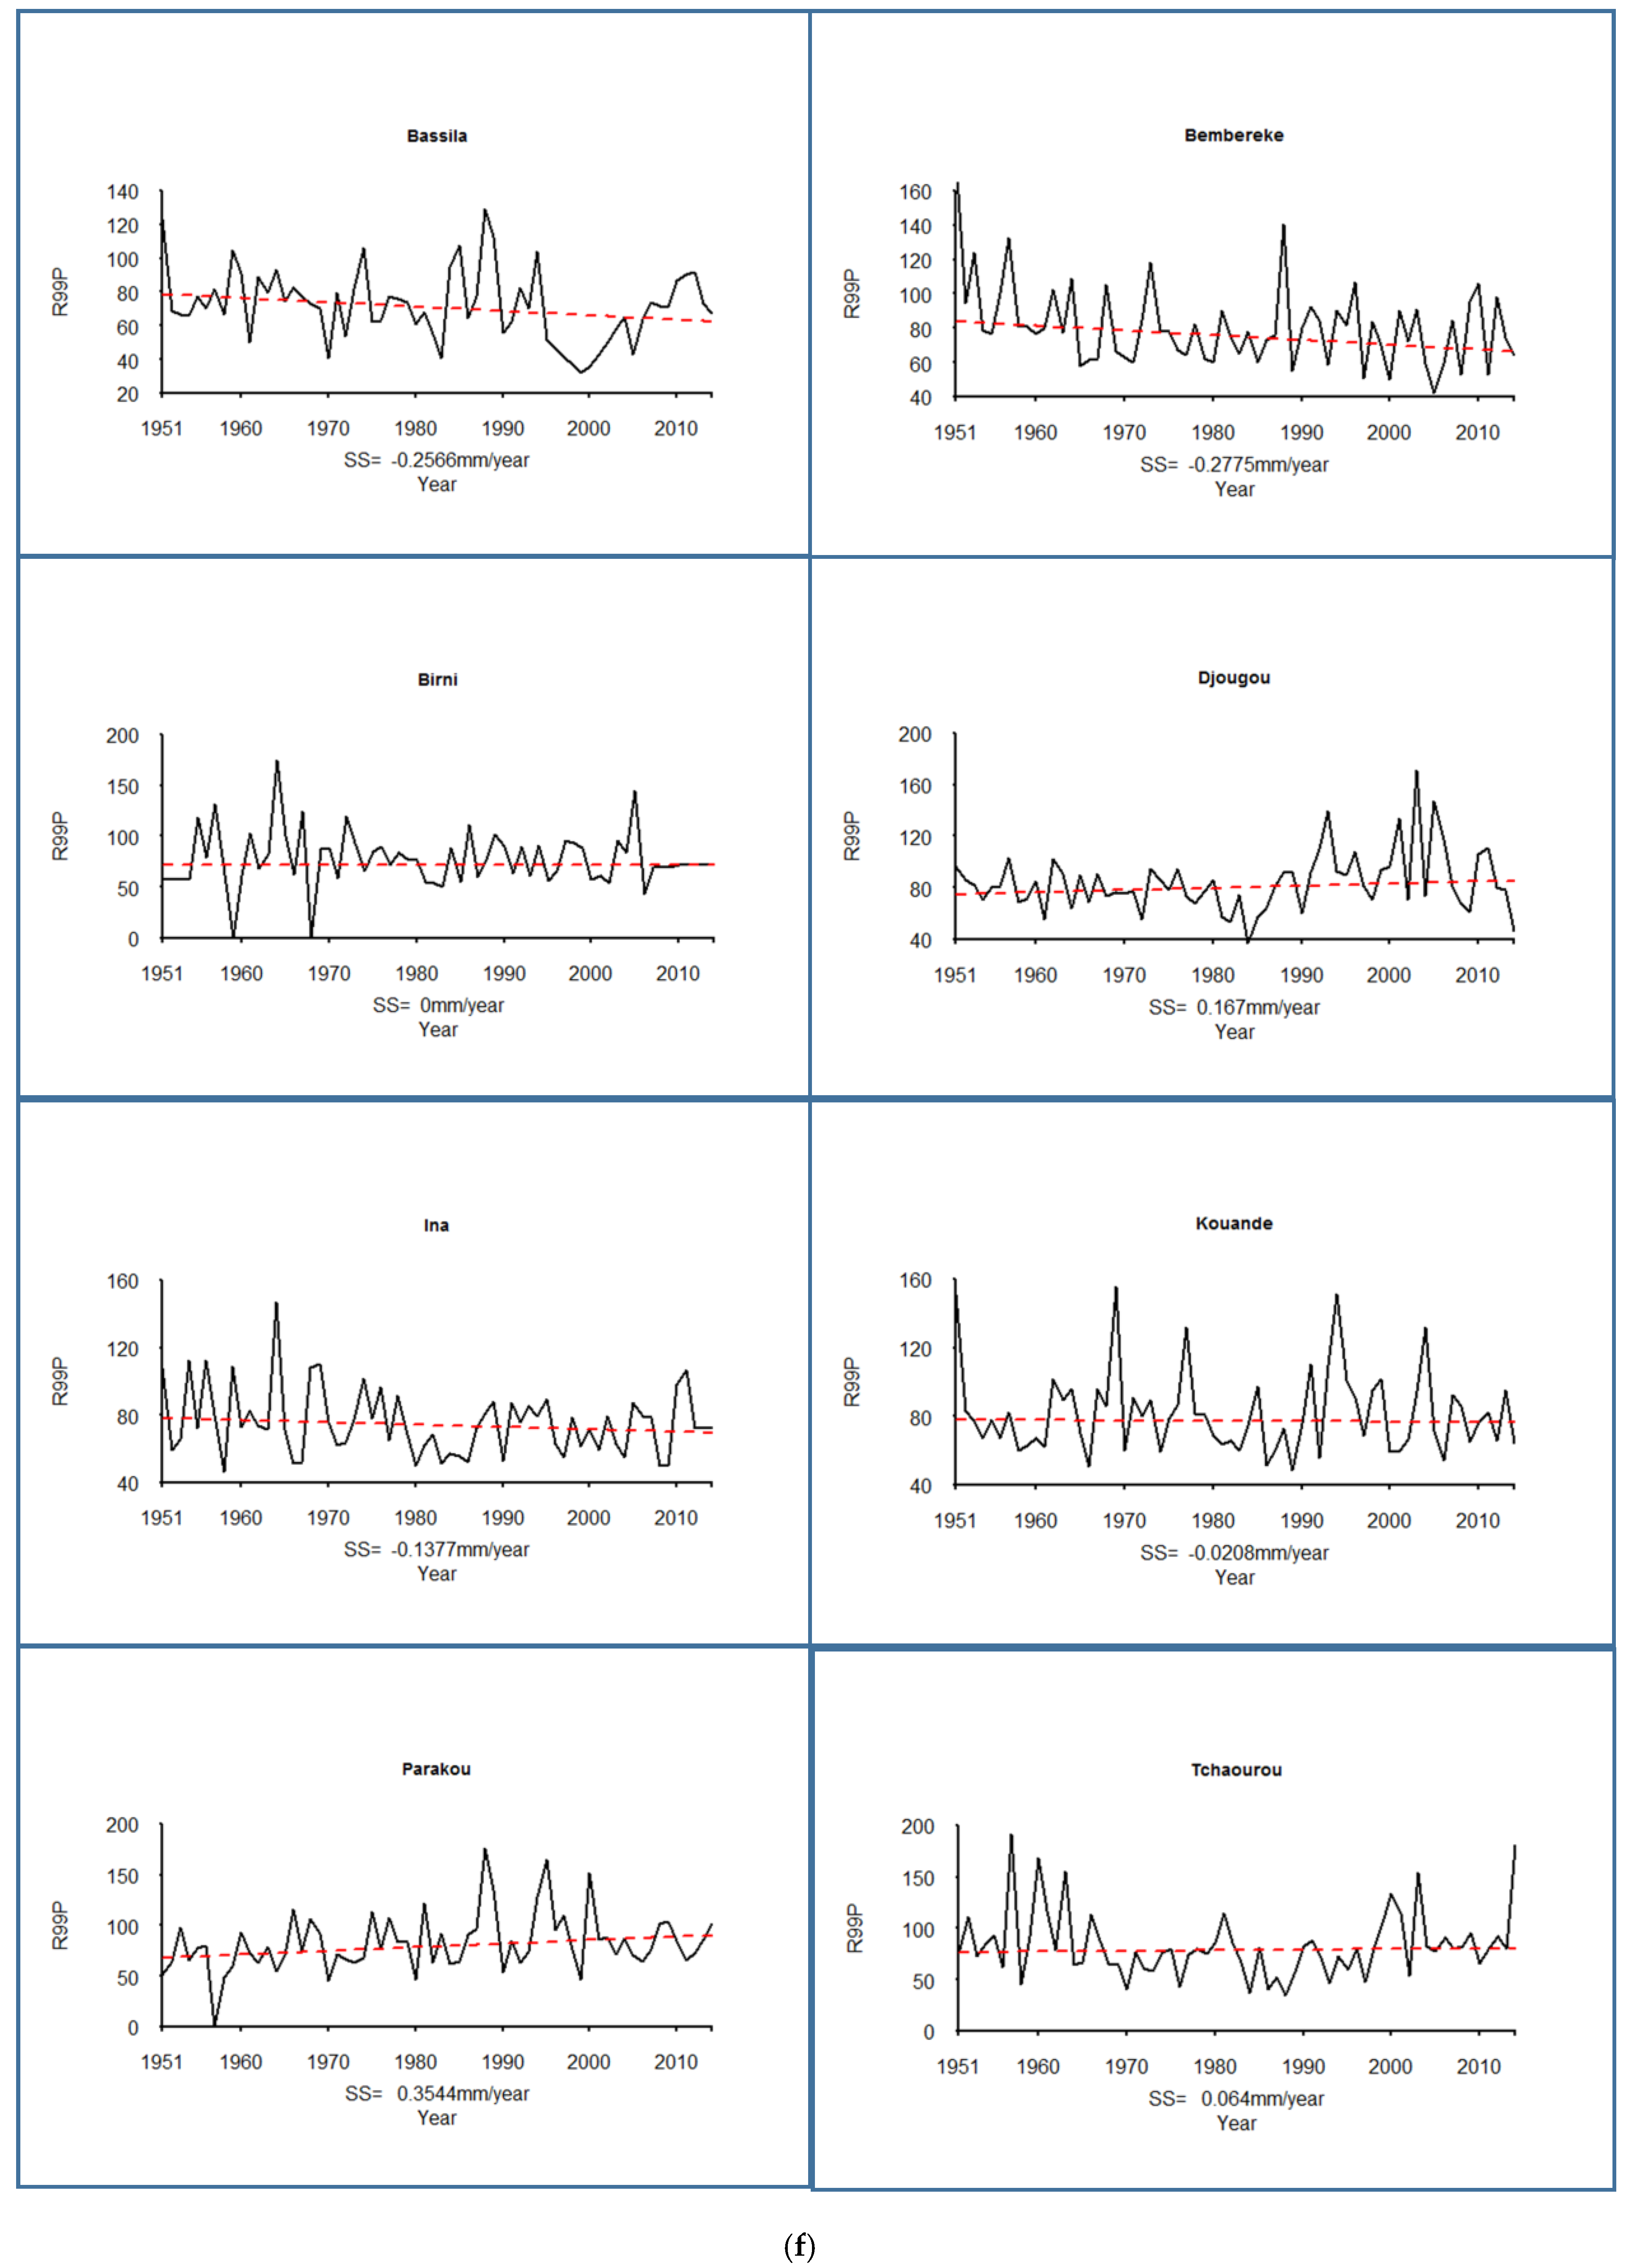
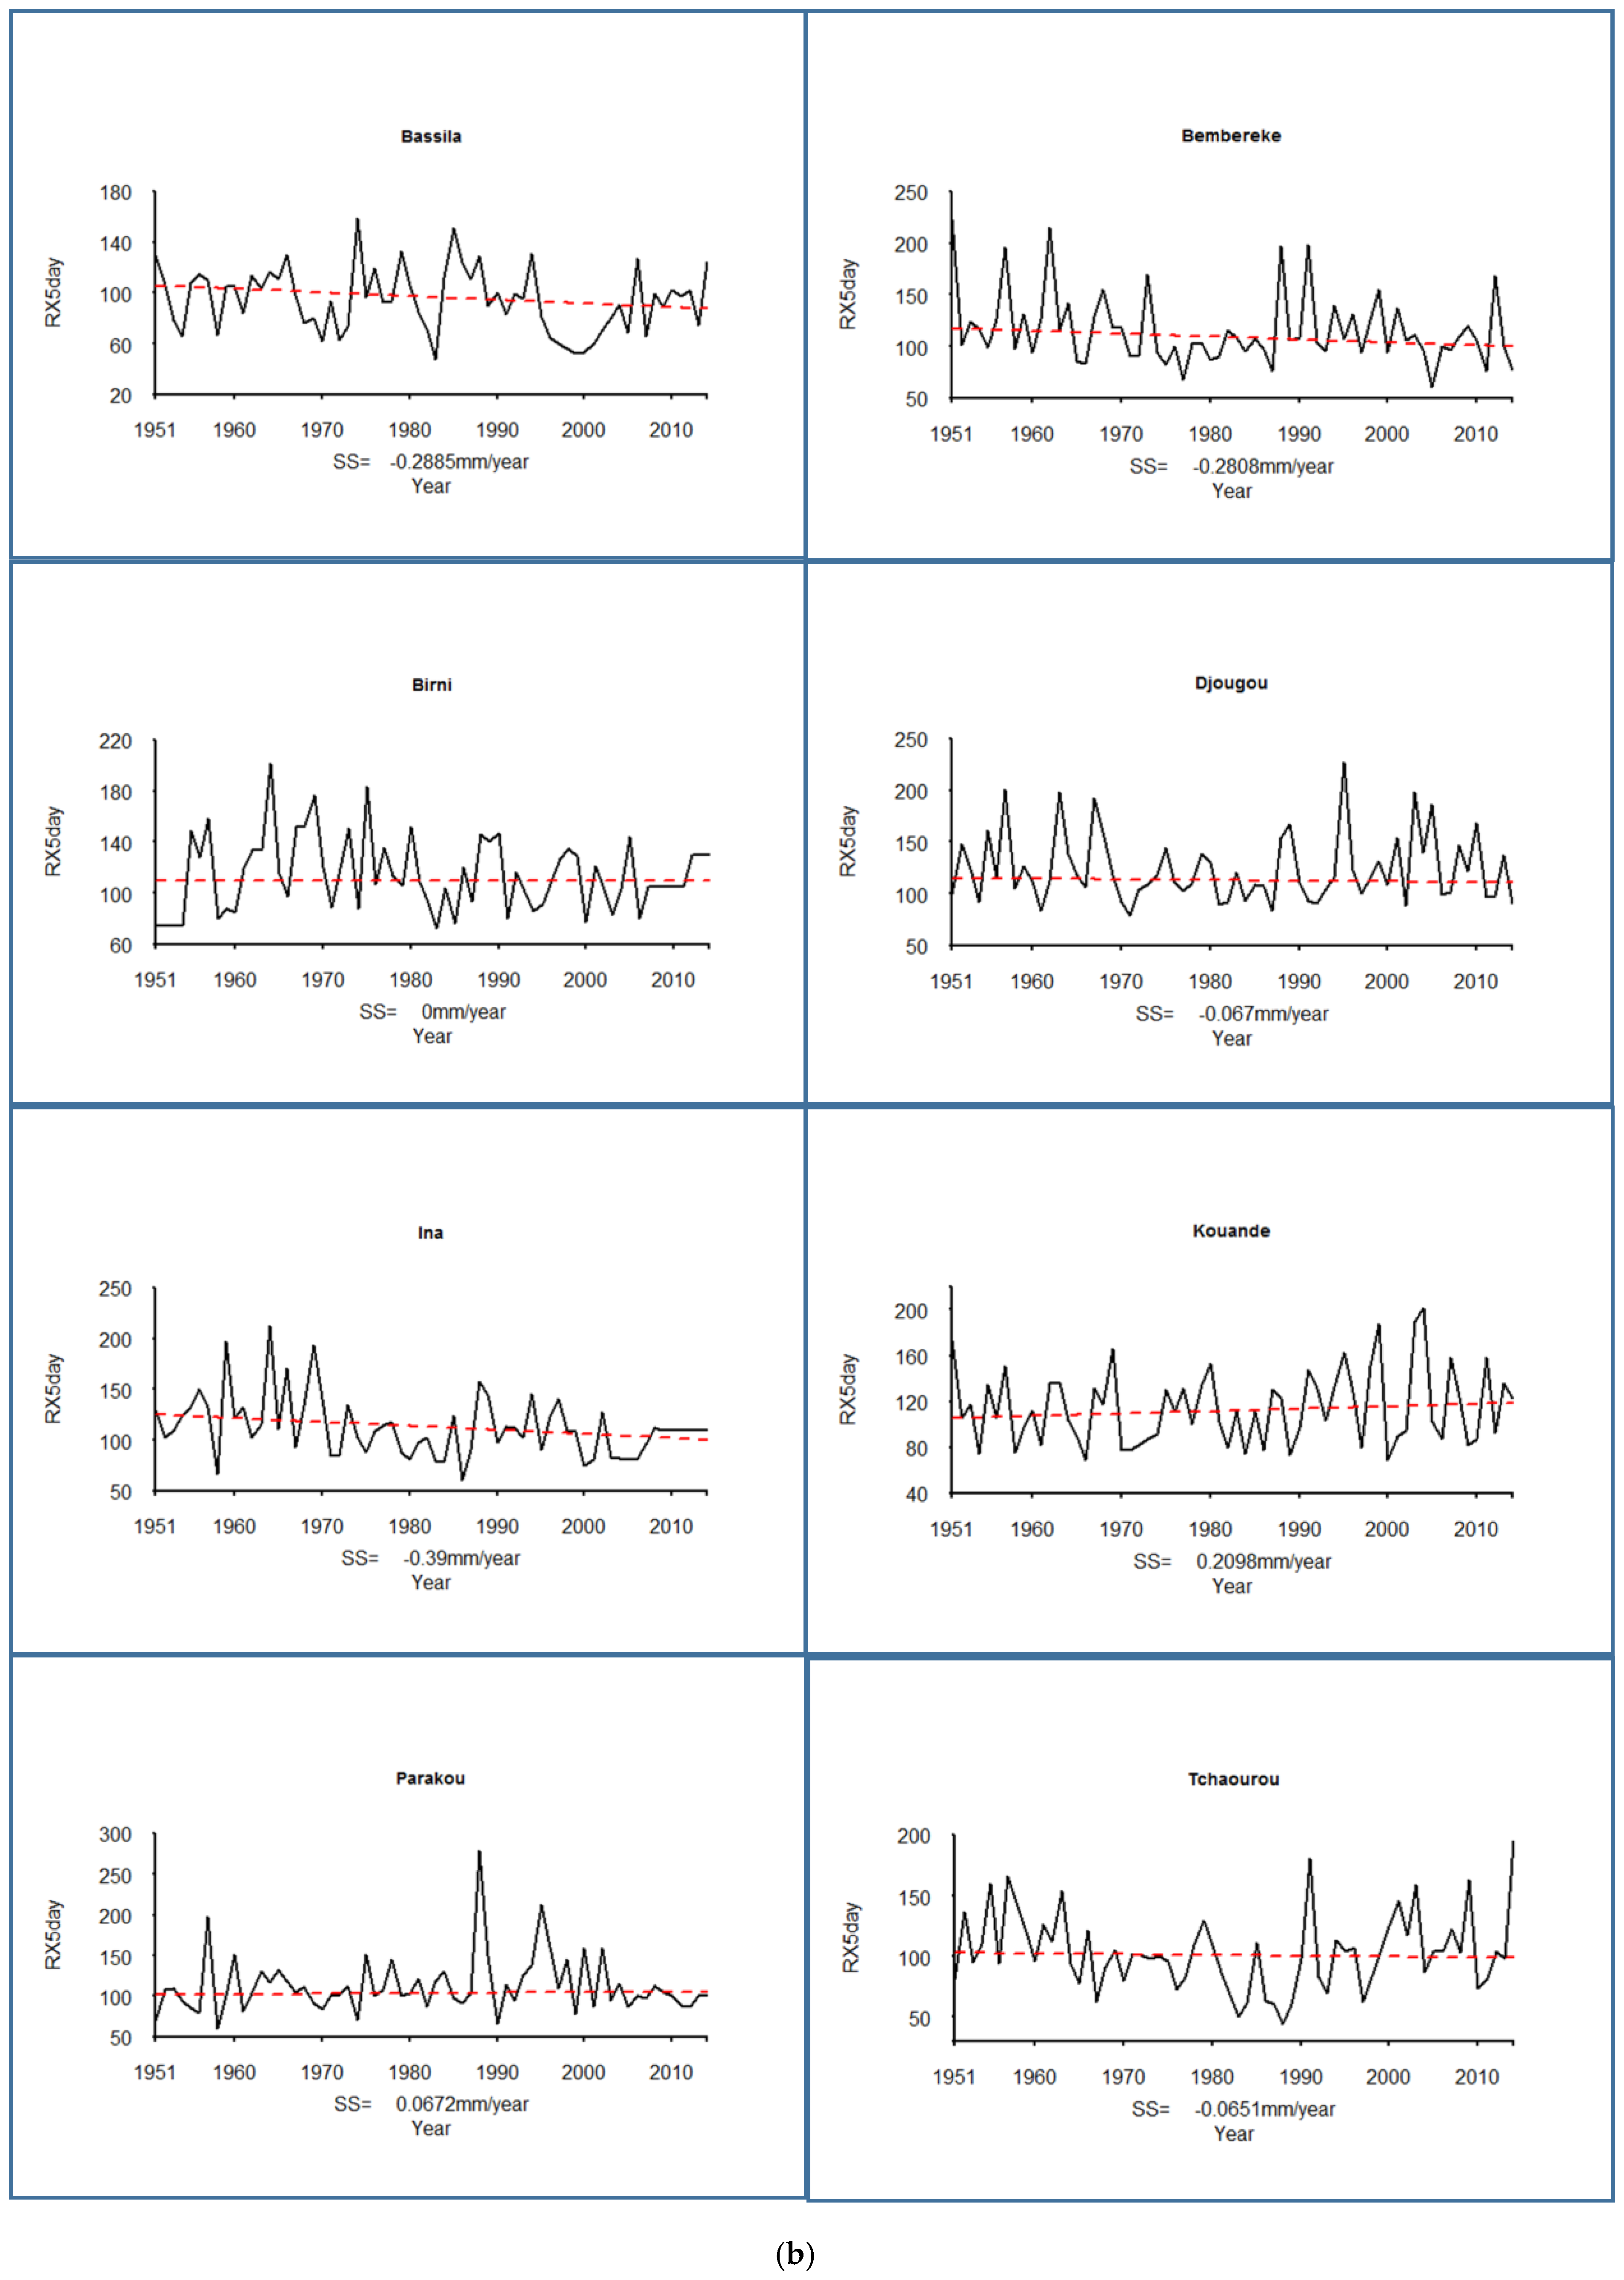
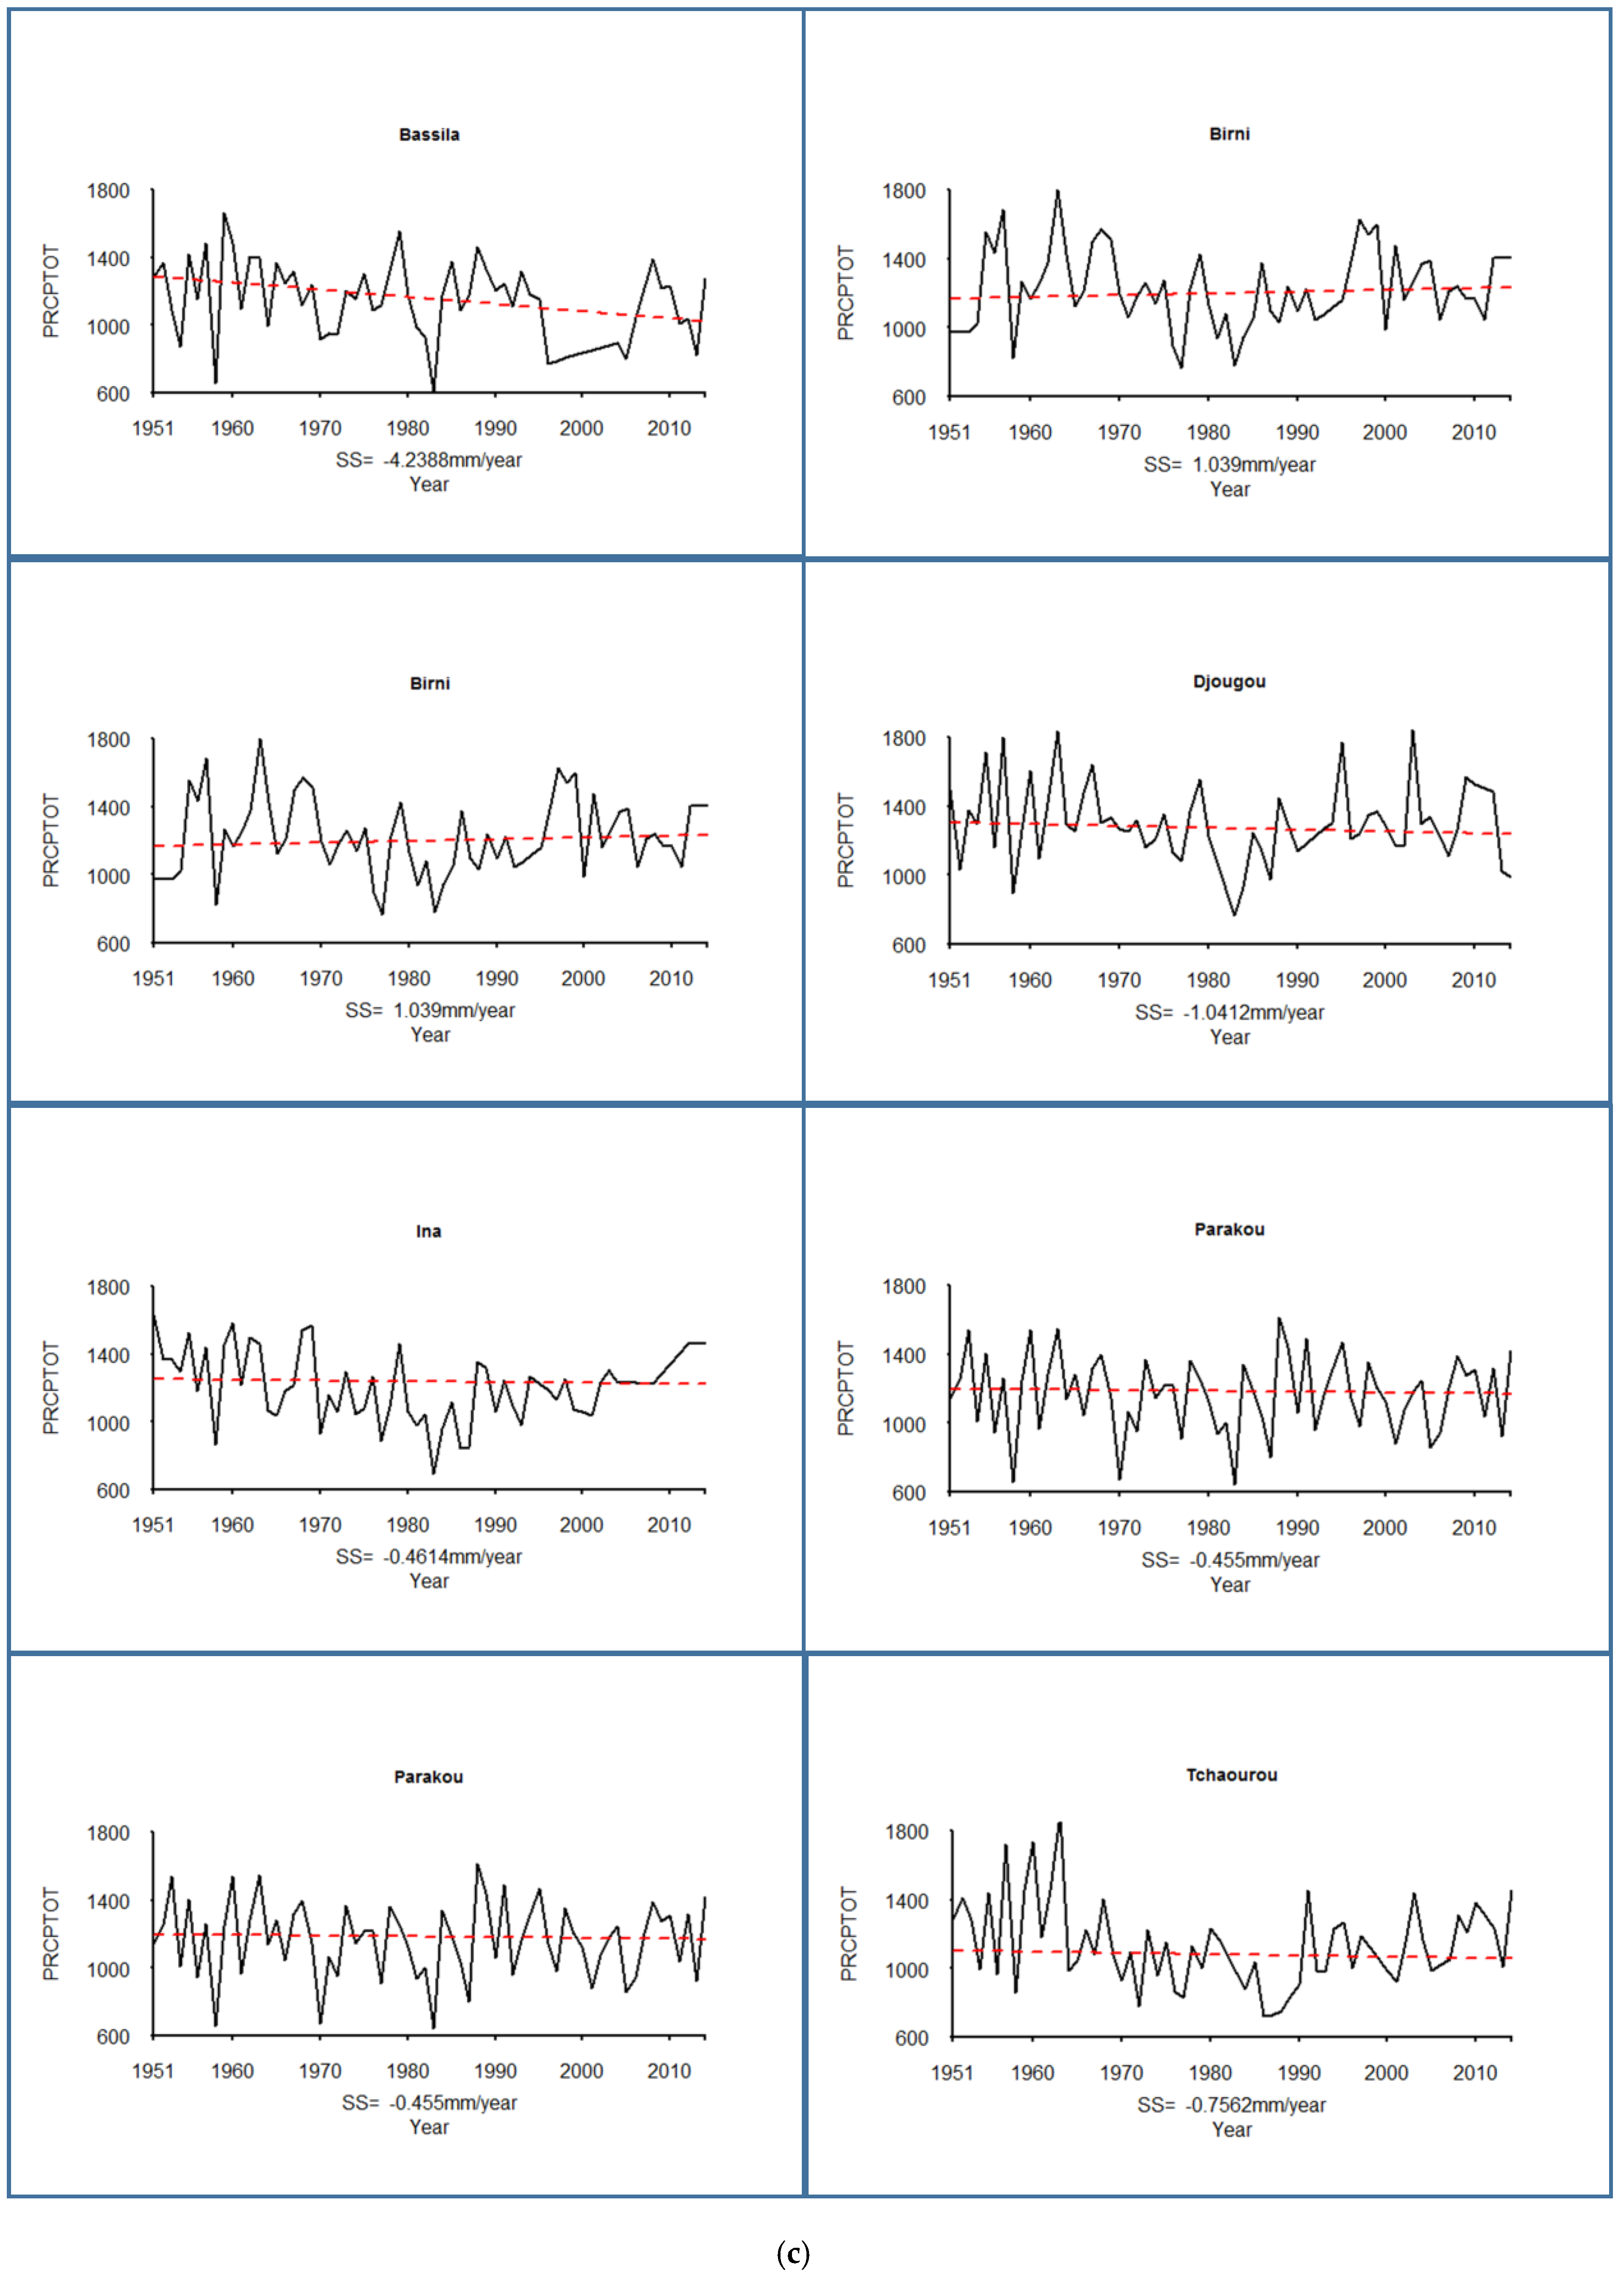
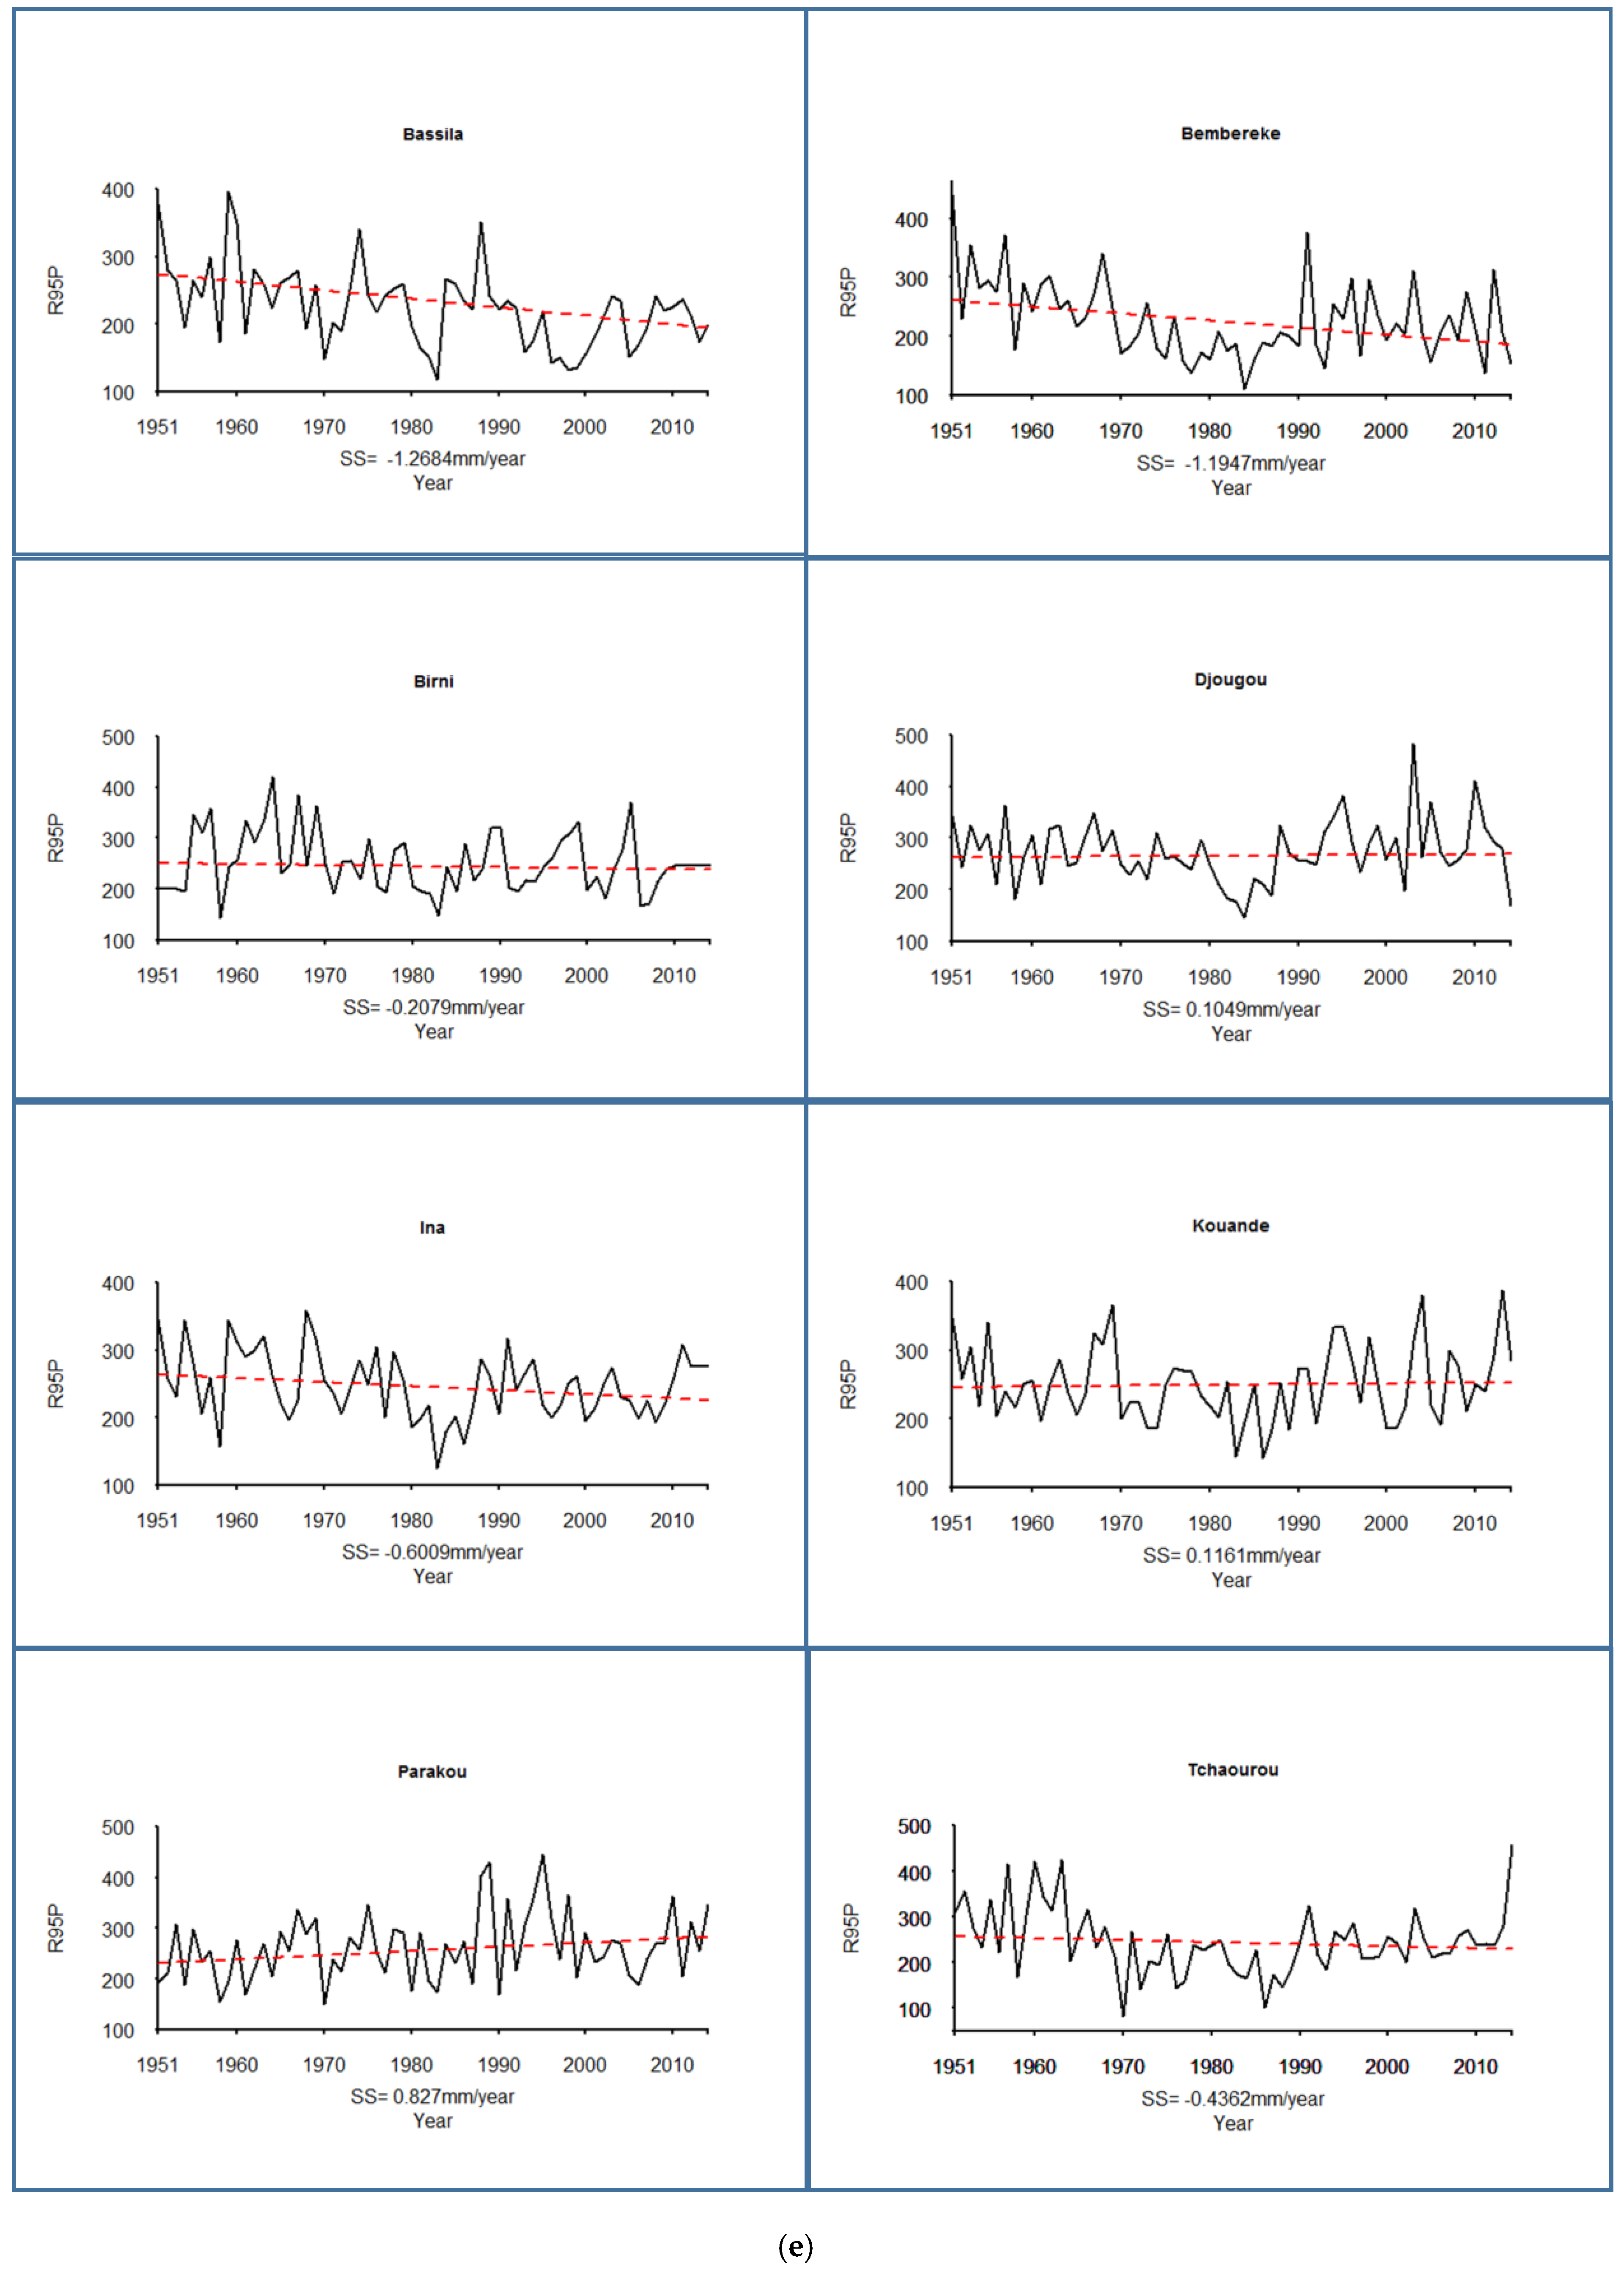
3.2. Trends in Intensity Indices
4. Discussion
5. Conclusions
Acknowledgments
Author Contributions
Conflicts of Interest
Appendix A

Appendix B


References
- Yazid, M.; Humphries, U. Regional Observed Trends in Daily Rainfall Indices of Extremes over the Indochina Peninsula from 1960 to 2007. Climate 2015, 3, 168–192. [Google Scholar] [CrossRef]
- Wade, S.; Faye, S.; Dieng, M.; Kaba, M.; Kane, N.R. Télédétection des catastrophes d inondation urbaine: Le cas de la région de Dakar (Sénégal). Journ. d’Animat. Sci. (JAS09) L’AUF Alger 2009. Available online: http://www.daneprairie.com (accessed on 20 May 2017).
- Ministère de l’Environnement et de la Protection de la Nature (MEPN). Rapport Auto-Évaluation Nationale des Capacités à Renforcer Pour La Gestion de l’Environnement Mondial-Bénin; Nations Unies: Cotonou, Bénin, 2008; Available online: https://www.thegef.org/sites/default/files/ncsa-documents/284.pdf (accessed on 20 May 2017).
- Intergovernmental Panel on Climate Change (IPCC). Managing the Risks of Extreme Events and Disasters to Advance Climate Change Adaptation; A Special Report of Working Groups I and II of the Intergovernmental Panel on Climate Change; Cambridge University Press: New York, NY, USA, 2012; Available online: http://www.preventionweb.net/files/24327_srexallfinal.pdf (accessed on 20 May 2017).
- World Meteorological Organisation (WMO). Weather Extremes in a Changing Climate: Hindsight on Foresight; World Meteorological Organisation: Geneva, Switzerland, 2011. [Google Scholar]
- Jaramillo, F.; Destouni, G. Developing water change spectra and distinguishing change drivers worldwide. Geophys. Res. Lett. 2014, 41, 8377–8386. [Google Scholar] [CrossRef]
- Jaramillo, F.; Destouni, G. Local flow regulation and irrigation raise global human water consumption and footprint. Science 2015, 350, 1248–1251. [Google Scholar] [CrossRef] [PubMed]
- Singh, D.; Jain, S.K.; Gupta, R.D.; Kumar, S. Analyses of Observed and Anticipated Changes in Extreme Climate Events in the Northwest Himalaya. Climate 2016, 4, 9. [Google Scholar] [CrossRef]
- Choi, G.; Collins, D.; Ren, G.; Trewin, B.; Baldi, M.; Fukuda, Y.; Afzaal, M.; Pianmana, T.; Gomboluudev, P.; Huong, P.T.T.; et al. Changes in means and extreme events of temperature and precipitation in the Asia-Pacific Network region, 1955–2007. Int. J. Climatol. 2009, 29, 1906–1925. [Google Scholar] [CrossRef]
- Soro, G.; Noufé, D.; Goula Bi, T.; Shorohou, B. Trend Analysis for Extreme Rainfall at Sub-Daily and Daily Timescales in Côte d’Ivoire. Climate 2016, 4, 37. [Google Scholar] [CrossRef]
- Kabo-Bah, A.; Diji, C.; Nokoe, K.; Mulugetta, Y.; Obeng-Ofori, D.; Akpoti, K. Multiyear Rainfall and Temperature Trends in the Volta River Basin and their Potential Impact on Hydropower Generation in Ghana. Climate 2016, 4, 49. [Google Scholar] [CrossRef]
- Aguiar, L.A.A.; Entre, S. Impact De La Variabilité Climatique Récente Sur Les Ecosystemes Des Niayes Du Senegal Entre 1950 Et 2004 . Ph.D.Thesis, Université du Québec à Montréal, Montréal, QC, Canada, 2009. [Google Scholar]
- Gallego, M.C.; Trigo, R.M.; Vaquero, J.M.; Brunet, M.; García, J.A.; Sigró, J.; Valente, M.A. Trends in frequency indices of daily precipitation over the Iberian Peninsula during the last century. J. Geophys. Res. Atmos. 2011, 116, 1–18. [Google Scholar] [CrossRef]
- Chattopadhyay, S.; Edwards, D. Long-Term Trend Analysis of Precipitation and Air Temperature for Kentucky, United States. Climate 2016, 4, 10. [Google Scholar] [CrossRef]
- Manton, M.J.; Della-Marta, P.M.; Haylock, M.R.; Hennessy, K.J.; Nicholls, N.; Chambers, L.E.; Collins, D.A.; Daw, G.; Finet, A.; Gunawan, D.; et al. Trends in extreme daily rainfall and temperature in southeast Asia and the south Pacific: 1961–1998. Int. J. Climatol. 2001, 21, 269–284. [Google Scholar] [CrossRef]
- Javari, M. Trend and Homogeneity Analysis of Precipitation. Climate 2016, 4, 44. [Google Scholar] [CrossRef]
- Oguntunde, P.G.; Friesen, J.; van de Giesen, N.; Savenije, H.H.G. Hydroclimatology of the Volta River Basin in West Africa: Trends and variability from 1901 to 2002. Phys. Chem. Earth 2006, 31, 1180–1188. [Google Scholar] [CrossRef]
- Oguntunde, P.G.; Abiodun, B.J.; Olukunle, O.J.; Olufayo, A.A. Trends and variability in pan evaporation and other climatic variables at Ibadan, Nigeria, 1973–2008. Meteorol. Appl. 2012, 19, 464–472. [Google Scholar] [CrossRef]
- Oguntunde, P.G.; Abiodun, B.J.; Lischeid, G. Rainfall trends in Nigeria, 1901–2000. J. Hydrol. 2011, 411, 207–218. [Google Scholar] [CrossRef]
- Hountondji, Y.; Ozer, P. Trends in extreme rainfall events in Benin (West Africa), 1960–2000. In Proceedings of the 1st International Conference on Energy, Environment and Climate Change, Ho Chi Minh, Vietnam, 26–27 August 2011. [Google Scholar]
- Institut National de la statistique et d’analyse économique du Bénin (INSAE). Effectifs De La Population Des Villages Et Quartiers De Ville Du Benin (Rgph-4, 2013); INSAE: Cotonou, Benin, 2016; Available online: http://www.insae-bj.org/population.html?file=files/publications/RGPH4/Resultats_definitifs_RGPH4.pdf (accessed on 20 May 2017).
- Klein Tank, A.M.G.; Zwiers, F.W.; Zhang, X. Guidelines on Analysis of extremes in a changing climate in support of informed decisions for adaptation. Clim. Data Monit. 2009, 56. Available online: http://www.ecad.eu/ documents/ WCDMP_72_TD_1500_en_1.pdf (accessed on 05 January 2015).
- Santos, C.; Satiamurty, P.; Santos, E. Trends of extreme climatic indices for Manaus-AM region. Acta Amazon. 2012, 42, 329–336. [Google Scholar] [CrossRef]
- Alexander, L.V.; Zhang, X.; Peterson, T.C.; Caesar, J.; Gleason, B.; Klein Tank, A.M.G.; Haylock, M.; Collins, D.; Trewin, B.; Rahimzadeh, F.; et al. Global observed changes in daily climate extremes of temperature and precipitation. J. Geophys. Res. Atmos. 2006, 111. [Google Scholar] [CrossRef]
- Sen, P.K. Estimates of the Regression Coefficient Based on Kendall’s Tau. J. Am. Stat. Assoc. 1968, 63, 1379–1389. [Google Scholar] [CrossRef]
- Nicholson, S.E.; Some, B.; Kone, B. An analysis of recent rainfall conditions in West Africa, including the rainy seasons of the 1997 El Nino and the 1998 La Nina years. J. Clim. 2000, 13, 2628–2640. [Google Scholar] [CrossRef]
- Ozer, P.; Erpicum, M.; Demaree, G.; Vandiepenbeeck, M. Dissussion of “Analysis of a Sahelian annual rainfall index from 1896 to 2000; the drought continues”. The Sahelian drought may have ended during the 1990s. Hydrol. Sci. J. 2003, 48, 489–492. [Google Scholar] [CrossRef]
- Lawin, E.A.; Afouda, A.; Gosset, M.; Lebel, T. Variabilité comparée du régime pluviométrique aux échelles régionale et locale sur la Haute Vallée de l’Ouémé au Bénin. In Proceedings of the Sixth World FRIEND Conference, Montpellier, France, 25–29 October 2010; pp. 61–68. [Google Scholar]

| Stations | Benin Meteo Agency Code | Long (Degree) | Lat (Degree) | Elevation (m) |
|---|---|---|---|---|
| Bassila | D037 | 1.667 | 9.017 | 384 |
| Bembereke | D024 | 2.662 | 10.223 | 491 |
| Beterou | D036 | 2.267 | 9.200 | 252 |
| Birni | D026 | 1.517 | 9.983 | 430 |
| Djougou | D030 | 1.662 | 9.692 | 439 |
| Ina | D027 | 2.727 | 9.969 | 358 |
| Kouande | D019 | 1.683 | 10.333 | 442 |
| Okpara | D033 | 2.733 | 9.467 | 295 |
| Parakou | D034 | 2.612 | 9.357 | 392 |
| Tchaourou | D038 | 2.600 | 325 | 325 |
| Indices | Name | Indices Calculation | Definition | Unit |
|---|---|---|---|---|
| Frequency Indices (adapted from WMO 2009) | ||||
| R10mm | Number of heavy rainfall days | Annual count of days when days rainfall ≥ 10 mm | Days | |
| R20mm | Number of very heavy rainfall days | Annual count of days when days rainfall ≥ 20 mm | Days | |
| R25mm | Number of extremely heavy rainfall days | Annual count of days when days rainfall ≥ 25 mm | Days | |
| CDD | Consecutive dry days | Maximum number of consecutive days with RR < 1 mm | Days | |
| CWD | Consecutive wet days | Maximum number of consecutive days with RR 1 mm | Days | |
| Intensity Indices (adapted from WMO 2009) | ||||
| RX1day | maximum Daily rainfall | Maximum 1-day Rainfall | mm | |
| RX5day | maximum 5-days rainfall | Maximum 5-days rainfall | mm | |
| PRCPTOT | Annual wet day rainfall total | Annual total rainfall in wet day (RR > 1 mm) | mm | |
| SDII | Simple daily intensity index | Annual mean rainfall when PRCP ≥ 1 mm | mm/day | |
| R95p | Very wet day | Annual total rainfall when RR > 95 percentile | mm | |
| R99p | Extremely wet day | Annual total rainfall when RR > 99 percentile | mm | |
| Stations | R10m | R20m | R25m | CDD | CWD | ||||||||||
|---|---|---|---|---|---|---|---|---|---|---|---|---|---|---|---|
| Z | p-Value | Z | p-Value | Z | p-Value | Z | p-Value | Z | p-Value | ||||||
| Bassila | −2.5 | 0.013 | −0.1467 | −1.6 | 0.105 | −0.0769 | −0.7 | 0.497 | −0.0217 | 4.9 | 7.59 × 10⁻⁷ | 0.1398 | −1.5 | 0.133 | −0.183 |
| Bembereke | −2.4 | 0.016 | −0.1079 | −2.3 | 0.023 | −0.075 | −1.7 | 0.089 | −0.0465 | −1 | 0.303 | −0.0253 | −1.8 | 0.066 | −0.126 |
| Beterou | −0.5 | 0.626 | −0.0294 | 0.6 | 0.535 | 0.0278 | 0.7 | 0.510 | 0 | −1.1 | 0.270 | −0.0182 | 0.7 | 0.496 | 0.048 |
| Birni | 1.8 | 0.071 | 0.0769 | 2.4 | 0.018 | 0.1111 | 1.6 | 0.120 | 0.0588 | 0.8 | 0.418 | 0.0171 | −1.5 | 0.124 | −0.138 |
| Djougou | −0.2 | 0.825 | 0 | −1.2 | 0.241 | −0.0533 | −1.9 | 0.058 | −0.069 | −0.5 | 0.624 | 0 | 0.6 | 0.582 | 0.052 |
| Ina | 0.1 | 0.949 | 0 | −0.3 | 0.05 | 0 | −0.4 | 0.718 | 0 | −0.5 | 0.605 | 0 | 0.9 | 0.391 | 0.071 |
| Kouande | −2 | 0.044 | −0.0909 | −1.8 | 0.05 | −0.0625 | −1.4 | 0.156 | −0.0333 | 0.7 | 0.511 | 0 | −0.5 | 0.618 | −0.033 |
| Okpara | −1.8 | 0.079 | −0.1042 | −1.1 | 0.276 | −0.0385 | −0.8 | 0.437 | 0 | 0.8 | 0.423 | 0.02 | −1.4 | 0.165 | −0.111 |
| Parakou | −4 | 0.150 | −0.0682 | 0 | 0.963 | 0 | −0.7 | 0.485 | 0 | 0.1 | 0.926 | 0 | 1.1 | 0.291 | 0.075 |
| Tchaourou | −0.7 | 0.497 | −0.031 | −0.6 | 0.558 | −0.0235 | −0.4 | 0.693 | 0 | −0.3 | 0.771 | 0 | 0 | 0.972 | 0 |
 Trends statistically significant at 5% level.
| Indices | Significant Positive Trend (%) | No Significant Positive Trend (%) | Significant Negative Trend (%) | No Significant Negative Trend (%) |
|---|---|---|---|---|
| R10mm | 0 | 20 | 30 | 50 |
| R20mm | 10 | 10 | 10 | 70 |
| R25mm | 0 | 20 | 0 | 80 |
| CWD | 0 | 40 | 0 | 60 |
| CDD | 10 | 40 | 0 | 50 |
| Stations | RX1day | RX5day | PRCPTOT | SDII | R95P | R99P | ||||||||||||
|---|---|---|---|---|---|---|---|---|---|---|---|---|---|---|---|---|---|---|
| Z | p-Value | Z | p-Value | Z | p-Value | Z | p-Value | Z | p-Value | Z | p-Value | |||||||
| Bassila | −2.7 | 0.008 | −0349 | −1.7 | 0.083 | −0.288 | −2.5 | 0.012 | −4.24 | 0,3 | 0.741 | 0.011 | −3.8 | 0.0001 | −1.268 | −1.8 | 0.072 | −0.257 |
| Bembereke | −2 | 0.044 | −0.277 | −1.4 | 0.169 | −0.281 | −2.5 | 0.013 | −3.89 | −1.4 | 0.159 | −0.025 | −2.4 | 0.016 | −1.195 | −2 | 0.044 | −0.277 |
| Beterou | 0.4 | 0.662 | 0.083 | 0.5 | 0.627 | 0.107 | 0.4 | 0.715 | 0.775 | −0.1 | 0.932 | −0.0007 | 0.6 | 0.535 | 0.344 | 0.7 | 0.508 | 0.106 |
| Birni | −0.5 | 0.634 | −0.045 | 0.1 | 0.954 | 0 | 0.6 | 0.574 | 1.039 | 2.3 | 0.021 | 0.053 | −0.07 | 0.397 | −0.208 | 0 | 0.972 | 0 |
| Djougou | −0.2 | 0.876 | −0.012 | −0.3 | 0.749 | −0.067 | −0.7 | 0.513 | −1.04 | −2 | 0.044 | −0.030 | 0.3 | 0.772 | 0.105 | 1.1 | 0.263 | 0.167 |
| Ina | −3.5 | 0.0005 | −0.483 | −2.2 | 0.028 | −0.39 | −0.3 | 0.754 | −0.46 | −2.2 | 0.025 | −0.031 | −1.6 | 0.103 | −0.601 | −1.2 | 0.246 | −0.138 |
| Kouande | 0.1 | 0.958 | 0.006 | 0.9 | 0.382 | 0.209 | −1.6 | 0.119 | −2.38 | −1.2 | 0.224 | −0.016 | 0.3 | 0.749 | 0.116 | −0.2 | 0.830 | −0.021 |
| Okpara | 1 | 0.323 | 0.180 | −0.6 | 0.522 | −0.15 | −1.3 | 0.209 | −2.37 | −0.3 | 0.768 | −0.004 | −0.4 | 0.671 | −0.189 | 0.7 | 0.509 | 0.1412 |
| Parakou | 2.1 | 0.039 | 0.326 | 0.4 | 0.694 | 0.0672 | −0.4 | 0.715 | −0.45 | −0.4 | 0.668 | −0.008 | 1.7 | 0.082 | 0.827 | 2.2 | 0.026 | 0.3544 |
| Tchaourou | −0.1 | 0.903 | −0.018 | −0.3 | 0.754 | −0.065 | −0.5 | 0.647 | −0.75 | −0.6 | 0.524 | −0.013 | −0.8 | 0.404 | −0.436 | 0.5 | 0.626 | 0.064 |
Trends statistically significant at 5% level.| Indices | Significant Positive Trend (%) | No Significant Positive Trend (%) | Significant Negative Trend (%) | No Significant Negative Trend (%) |
|---|---|---|---|---|
| RX1day | 10 | 30 | 30 | 30 |
| RX5day | 0 | 40 | 10 | 50 |
| PRCPTOT | 0 | 20 | 20 | 60 |
| SDII | 10 | 10 | 20 | 60 |
| R95P | 0 | 40 | 20 | 40 |
| R99P | 10 | 40 | 10 | 40 |
© 2017 by the authors. Licensee MDPI, Basel, Switzerland. This article is an open access article distributed under the terms and conditions of the Creative Commons Attribution (CC BY) license (http://creativecommons.org/licenses/by/4.0/).
Share and Cite
André Attogouinon, A.; Lawin, A.E.; M’Po, Y.N.; Houngue, R. Extreme Precipitation Indices Trend Assessment over the Upper Oueme River Valley-(Benin). Hydrology 2017, 4, 36. https://doi.org/10.3390/hydrology4030036
André Attogouinon A, Lawin AE, M’Po YN, Houngue R. Extreme Precipitation Indices Trend Assessment over the Upper Oueme River Valley-(Benin). Hydrology. 2017; 4(3):36. https://doi.org/10.3390/hydrology4030036
Chicago/Turabian StyleAndré Attogouinon, André, Agnidé E. Lawin, Yèkambèssoun N’Tcha M’Po, and Rita Houngue. 2017. "Extreme Precipitation Indices Trend Assessment over the Upper Oueme River Valley-(Benin)" Hydrology 4, no. 3: 36. https://doi.org/10.3390/hydrology4030036
APA StyleAndré Attogouinon, A., Lawin, A. E., M’Po, Y. N., & Houngue, R. (2017). Extreme Precipitation Indices Trend Assessment over the Upper Oueme River Valley-(Benin). Hydrology, 4(3), 36. https://doi.org/10.3390/hydrology4030036