The Impact of Climate Change on Water Resource Availability in a Trans-Boundary Basin in West Africa: The Case of Sassandra

Abstract
:1. Introduction
2. Materials and Methods
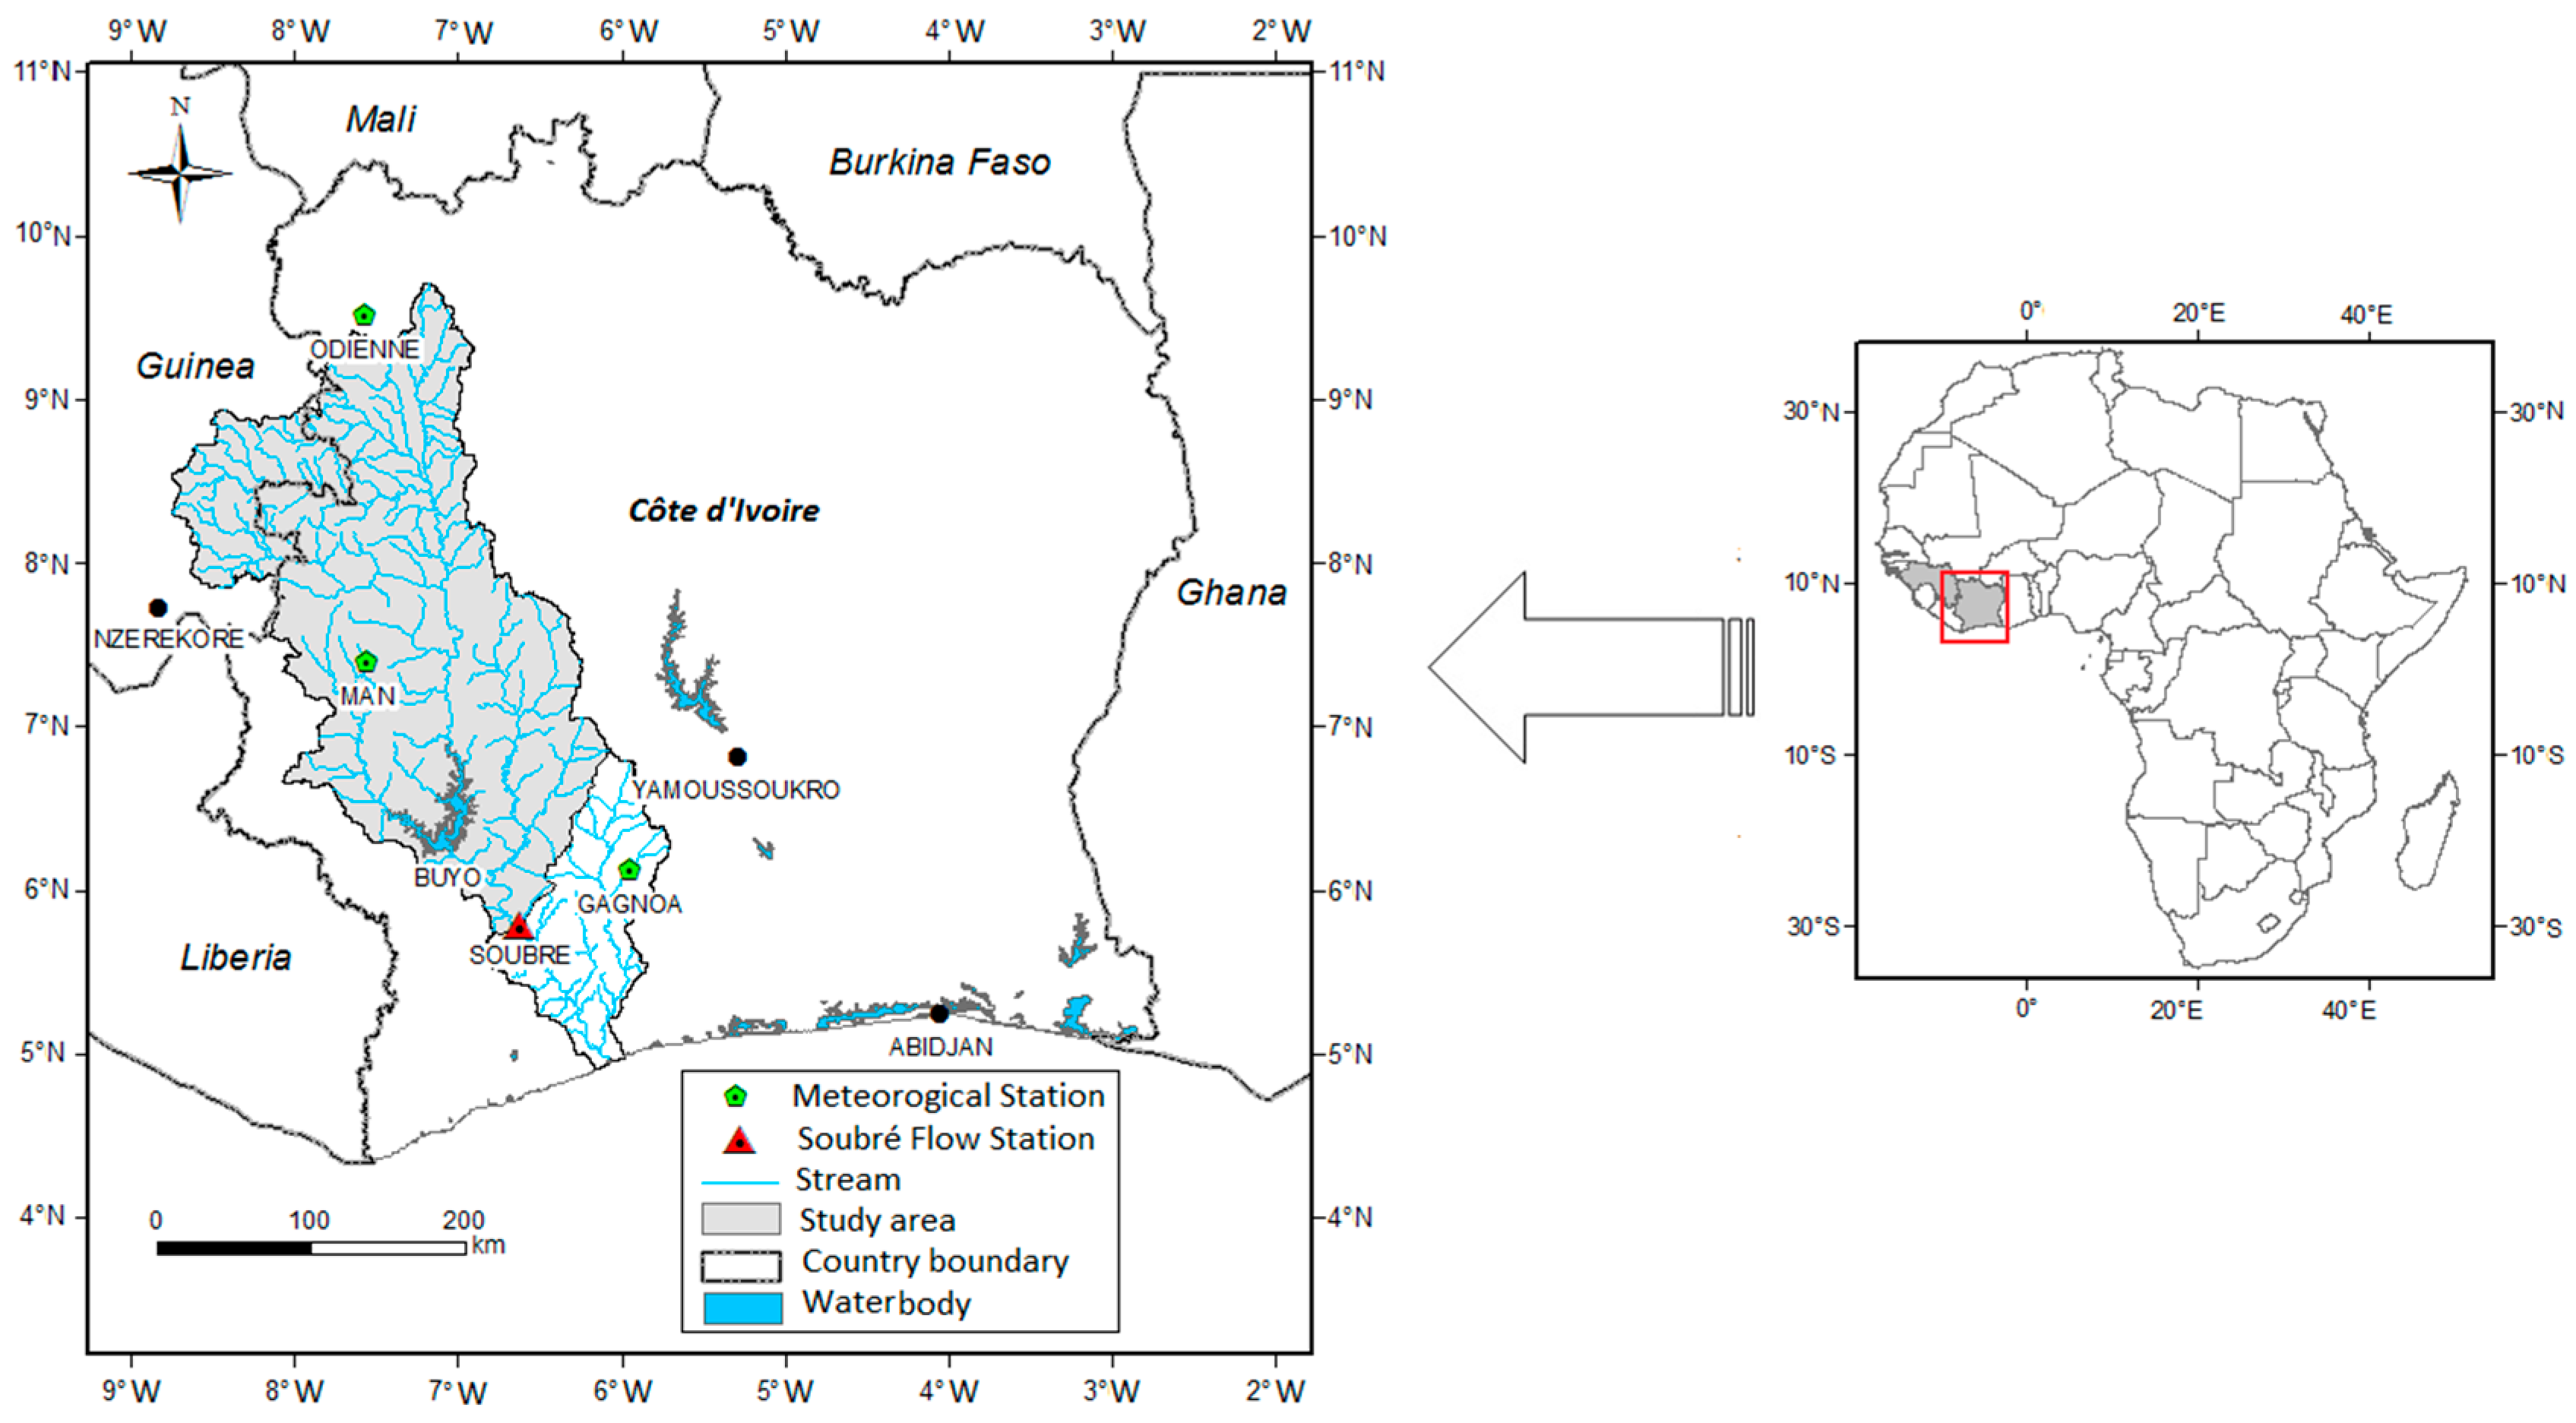
2.1. Study Area
2.2. Available Data
2.2.1. Historical Data
2.2.2. Future Climate Simulated Data
2.3. Climate Change Analysis
2.4. Bias Correction or Delta Approach
- “additive” disturbances for temperatures:
- “multiplicative” disturbances for the precipitations:
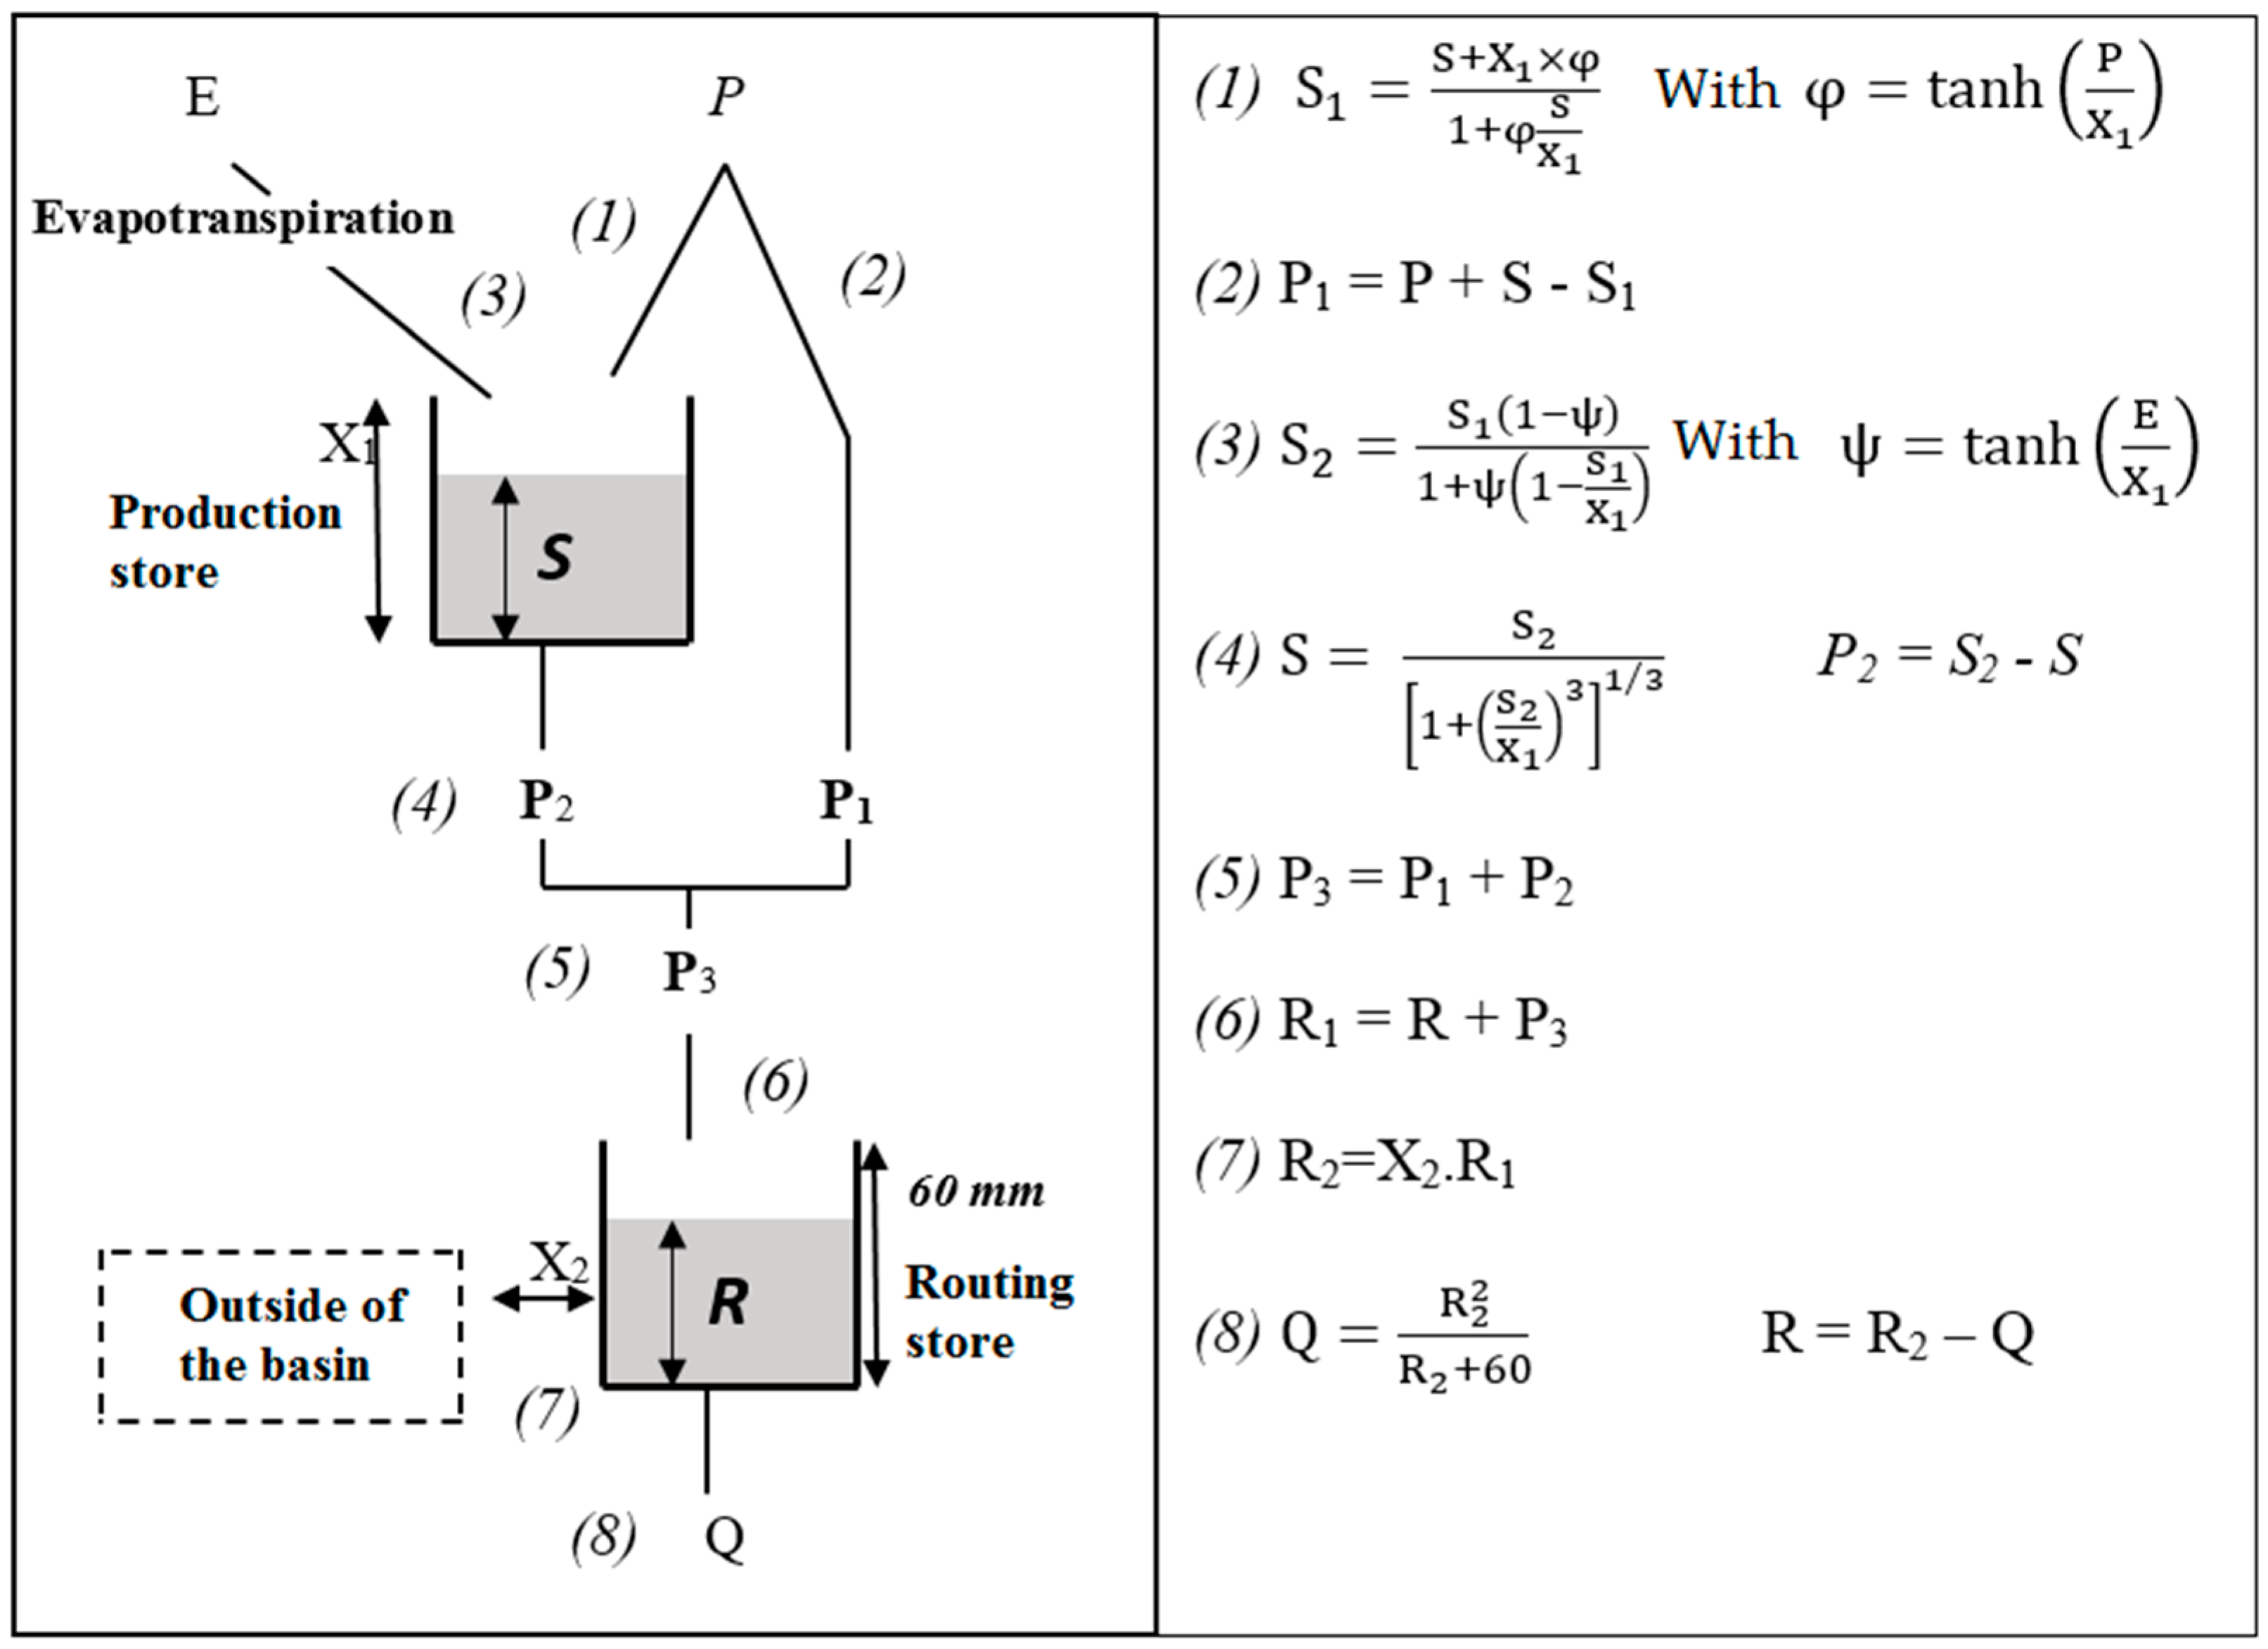
2.5. The Hydrological Model: GR2M
- -
- X1: the capacity of the production store (mm);
- -
- X2: the exchange coefficient (no dimension).
2.6. Headwater Inflows from Guinea Assessment
3. Results and Discussions
3.1. Climate Change Analysis
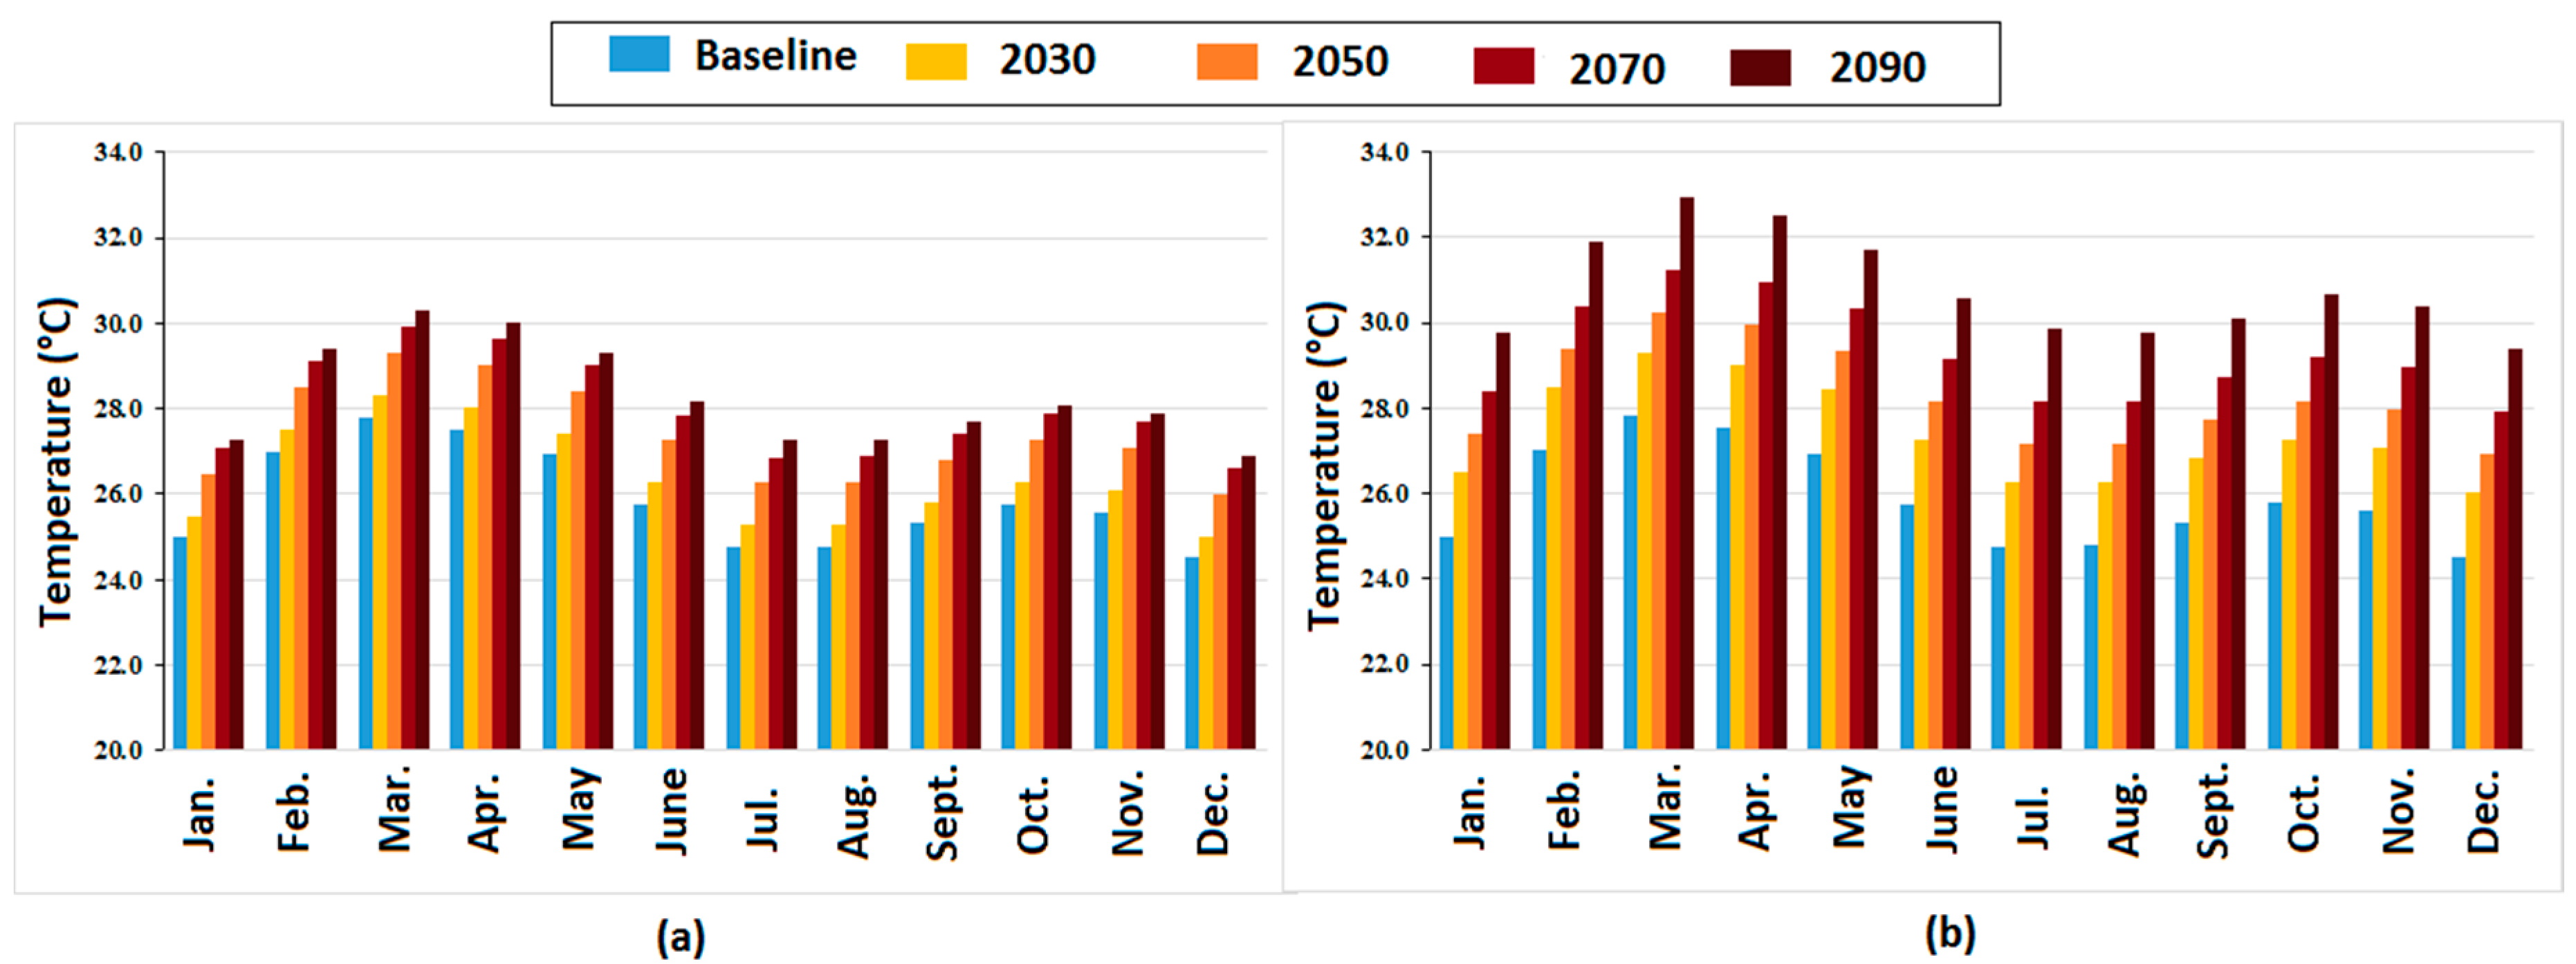
3.1.1. Temperatures
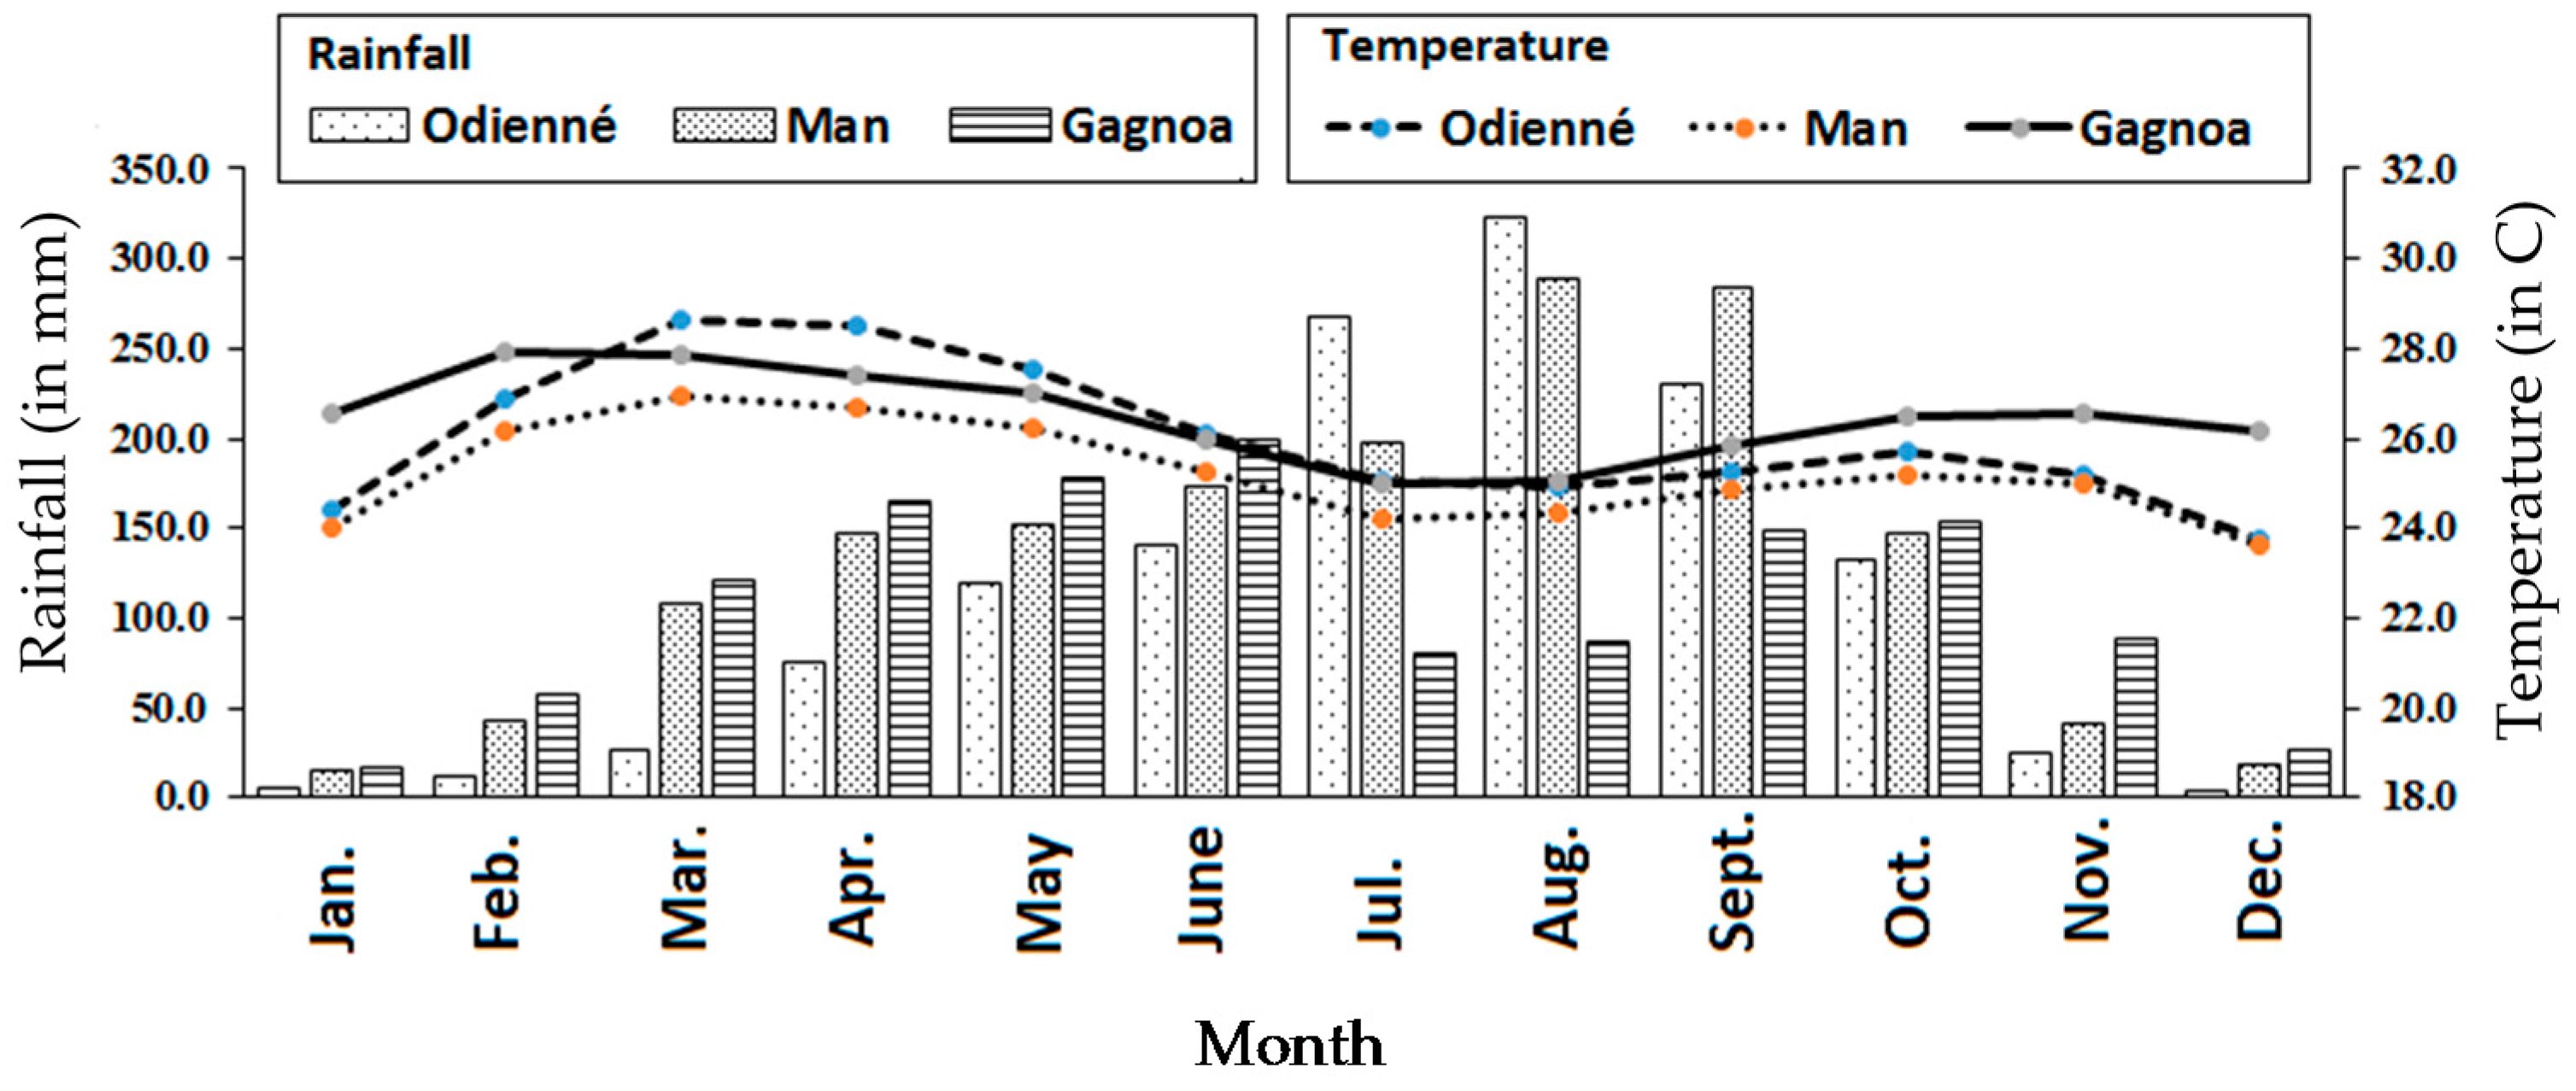
3.1.2. Rainfall
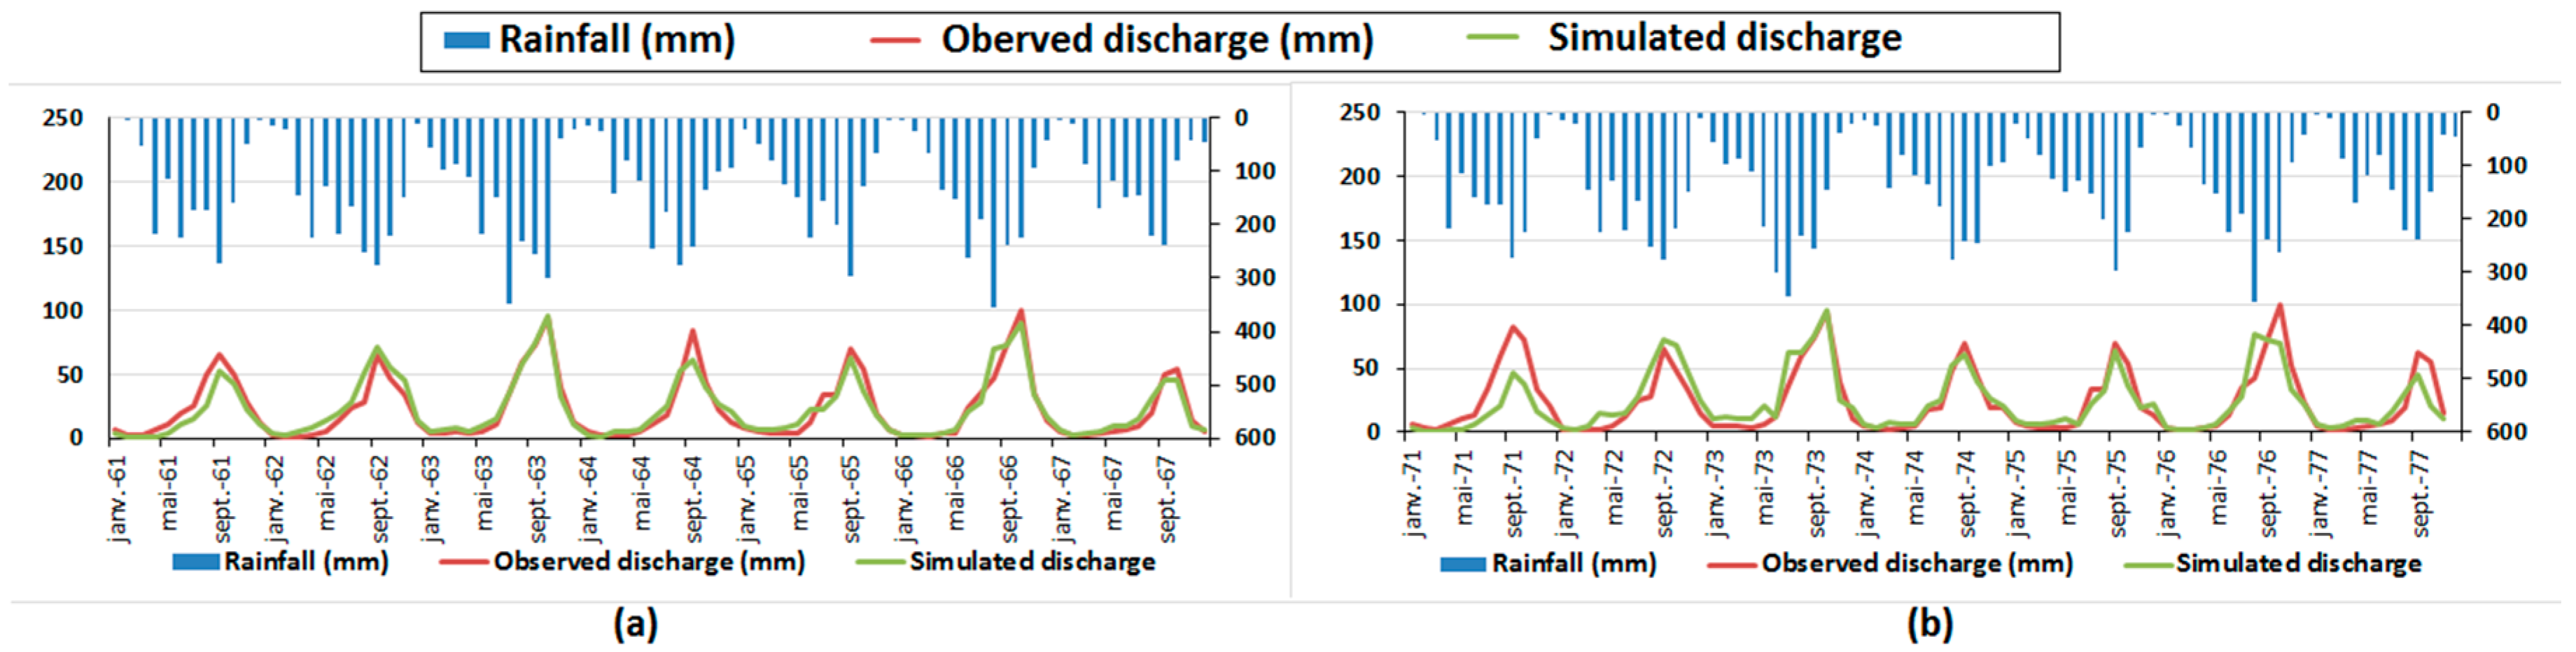
3.2. Calibration and Validation of River Discharge Simulations
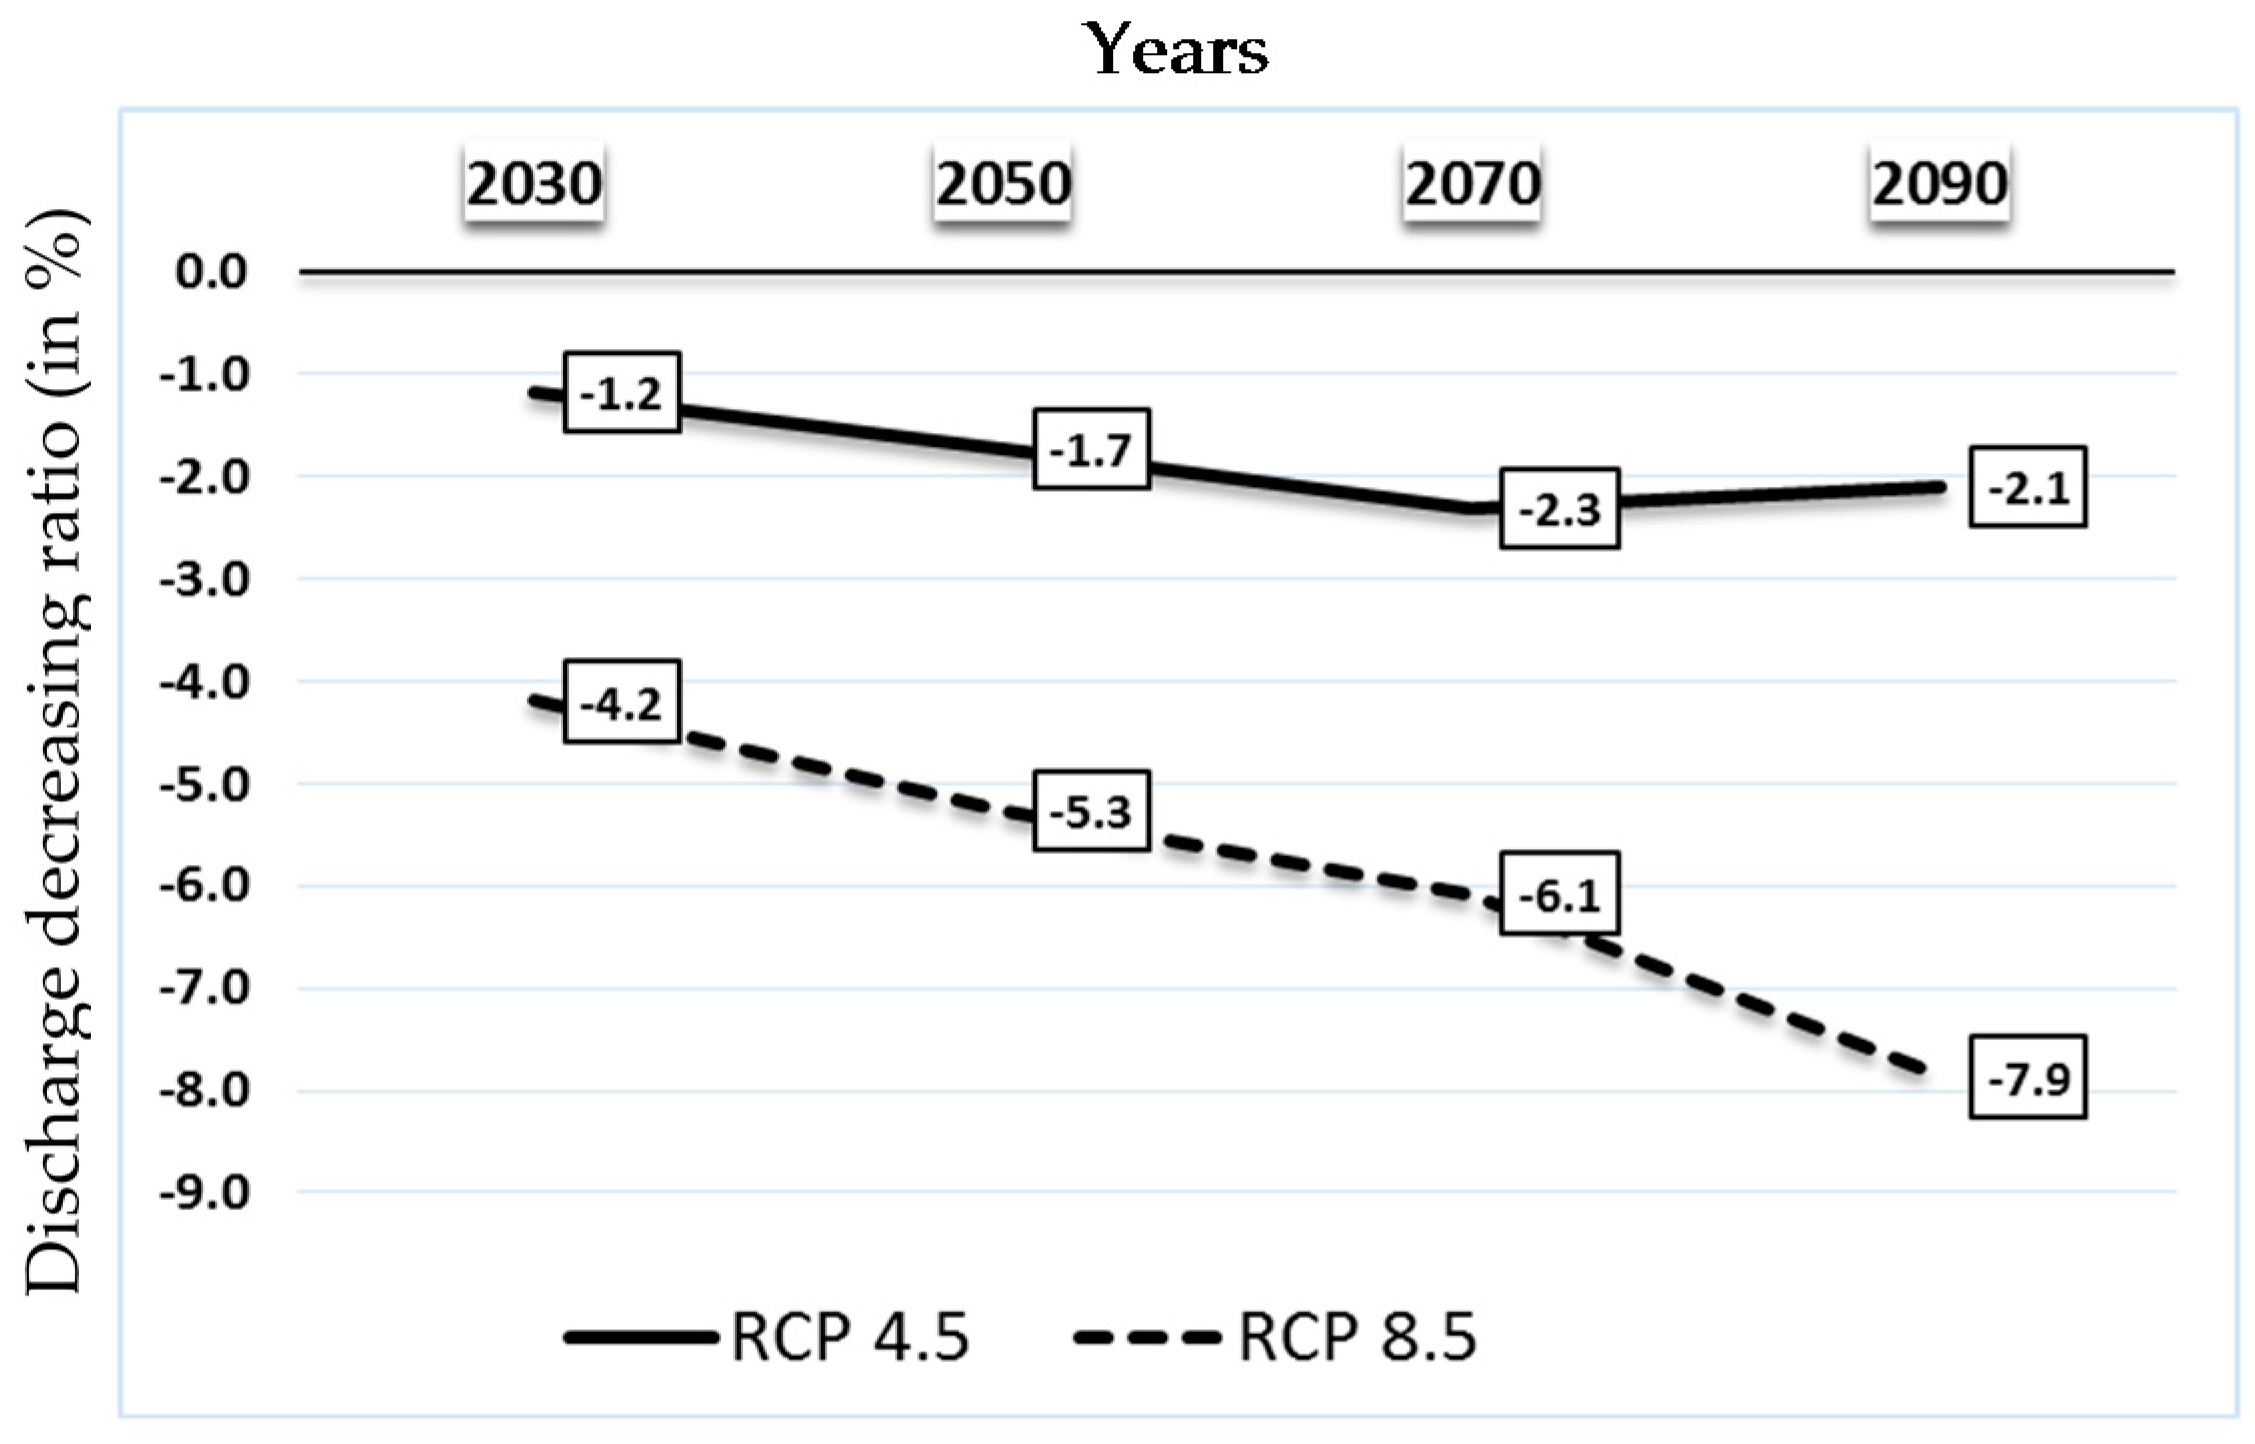
3.3. Impact of Climate Change on Natural River Discharge
3.4. Impact of Climate Change on Headwater Inflows from Guinea
4. Conclusions
Acknowledgments
Author Contributions
Conflicts of Interest
References
- Niasse, M. Climate-induced Water Conflict Risks in West Africa: Recognizing and Coping with Increasing Climate Impacts on Shared Watercourses. In Proceedings of the Human Security and Climate Change, Holmen Fjord Hotel, Oslo, Norway, 21–23 June 2005; pp. 1–15. [Google Scholar]
- Frédéric, J. Maîtrise de l’eau et développement durable en Afrique de l’ouest: De la nécessité d’une coopération régionale autour des systèmes hydrologiques transfrontaliers. VertigO 2006, 7, 1–27. [Google Scholar]
- Sidibé, S.; Oulaye, S. L’eau en Guinée. Rapport du Centre d’Observation, de Surveillance et d’Information Environnementales; COSIE: Conakry, Guinea, 2017; pp. 1–28. Available online: https://unstats.un.org/unsd/environment/envpdf/UNSD_TogoWorkshop/Session%207b_Guin%C3%A9e_L%27Eau%20en%20Guin%C3%A9e.pdf (accessed on 27 September 2017).
- Abdelkrim, B.S. Vulnérabilité et Adaptation Aux Changements Climatiques Dans les Oasis de la Région de Tafilalet-Maroc. Ph.D. Thesis, Université Cadi Ayyad, Marrakesh, Maroc, December 2013. [Google Scholar]
- Mahé, G.; Olivry, J.C. Variations des précipitations et des écoulements en Afrique de l’ouest et centrale de 1951 à 1989. Sécheresse 1995, 6, 109–117. [Google Scholar]
- Bricquet, J.P.; Bamba, F.; Mahé, G.; Touré, M.; Olivry, J.C. Evolution récente des ressources en eau de l’Afrique atlantique. J. Water Sci. 1997, 3, 321–337. [Google Scholar] [CrossRef]
- Servat, E.; Paturel, J.E.; Kouamé, B.; Travaglio, M.; Ouedraogo, M.; Boyer, J.F.; Lubès-Niel, H.; Fritsch, J.M.; Masson, J.M.; Marieu, B. Identification, caractérisation et conséquences d’une variabilité hydrologique en Afrique de l’Ouest et Centrale. IAHS J. 1998, 252, 323–337. [Google Scholar]
- Savané, I.; Coulibaly, K.M.; Gioan, P. Etude comparative de trois méthodes de calcul du coefficient de tarissement des cours d’eau. Sécheresse 2003, 1, 37–42. [Google Scholar]
- Ardoin, B.S. Variabilité Hydroclimatique et Impacts Sur Les Ressources en Eau de Grands Bassins Hydrographiques en Zone Soudano-Sahélienne. Ph.D. Thesis, Université de Montpellier II, Montpellier, France, April 2004. [Google Scholar]
- Goula, B.T.A.; Konan, B.; Brou, Y.T.; Fadika, V.; Srohourou, B. Estimation des pluies exceptionnelles journalières en zone tropicale: Cas de la Côte d’Ivoire par comparaison des lois lognormale et de Gumbel. Hydrol. Sci. J. 2007, 52, 49–67. [Google Scholar] [CrossRef]
- Kouakou, K.E.; Goula, B.T.A.; Savané, I. Impacts de la variabilité climatique sur les ressources en eau de surface en zone tropicale humide: Cas du bassin versant transfrontalier de la Comoé (Côte d’Ivoire—Burkina Faso). EJSR 2007, 16, 31–43. [Google Scholar]
- Vissin, E.W. Impact de la Variabilité Climatique et de la Dynamique Des États de Surface Sur Les Écoulements du Bassin Béninois du Fleuve Niger. Ph.D. Thesis, Université de Bourgone, Dijon, France, December 2007. [Google Scholar]
- Kouakou, K.E. Impacts de la Variabilité Climatique et du Changement Climatique Sur Les Ressources en eau en Afrique de l’Ouest: Cas du Bassin Versant de la Comoé. Ph.D. Thesis, Université Abobo-Adjamé, Abidjan, Côte d’Ivoire, February 2011. [Google Scholar]
- Kouassi, A.M.; Kouamé, K.F.; Saley, M.B.; Biémi, J. Application du modèle de maillet à l’étude des impacts des changements climatiques sur les ressources en eau en Afrique de l’Ouest: Cas du bassin versant du N’Zi-Bandama (Cote d’Ivoire). IJSRM 2013, 3, 214–228. [Google Scholar]
- Sakho, M. Incidences de L’instabilité des Ressources en eau de Surface sur les Performances Simulées d’un Système d’eau. Exemple du Sassandra en Côte d’Ivoire. Ph.D. Thesis, Université de Montpellier II, Montpellier, France, November 1991. [Google Scholar]
- Servat, E.; Sakho, M. Méthodologie simplifiée d’évaluation comparative des performances d’un système d’eau aménagé confronté à la sécheresse: Exemple de l’aménagement du Sassandra en Côte d’Ivoire. IAHS Publ. 1995, 231, 61–69. [Google Scholar]
- Brou, Y.T.; Servat, E.; Paturel, J.E. Activités humaines et variabilité climatique: Cas du Sud forestier ivoirien. Int. Assoc. Hydrol. Sci. 1998, 252, 365–373. [Google Scholar]
- Konan, B. Modélisation et Gestion Intégrée des Ressources en Eau Dans le Bassin Versant du Sassandra (Côte d’Ivoire). Ph.D. Thesis, Université d’Abobo-Adjamé, Abidjan, Côte d’Ivoire, April 2002. [Google Scholar]
- Ardoin, B.S.; Dezetter, A.; Servat, E.; Mahe, G.; Paturel, J.E.; Dieulin, C.; Casenave, L. Évaluation des impacts du changement climatique sur les ressources en eau d’Afrique de l’Ouest et Centrale. Proceedings of symposium S6 held during the Seventh IAHS Scientific Assembly at Foz do Iguaçu, Brazil. IAHS Publ. 2005, 296, 194–202. [Google Scholar]
- Rescan, M. Prévision des Ressources en eau en Afrique de L’ouest et Centrale Jusqu’en 2099 Par Application Des Sorties du Modèle D’évolution du Climat HadCM3 au Modèle Hydrologique GR2M; DEA; Université Montpellier II: Montpellier, France, 2005. [Google Scholar]
- Goula, B.T.A.; Savane, I.; Konan, B.; Fadika, V.; Kouadio, G.B. Impact de la variabilité climatique sur les ressources hydriques des bassins de N’Zo et N’Zi en Côte d’Ivoire (Afrique tropicale humide). Vertigo 2006, 7. [Google Scholar] [CrossRef]
- Yao, A.B. Evaluation Des Potentialités en Eau du Bassin Versant de la Lobo en Vue D’une Gestion Rationnelle (Centre-ouest de la Côte d’Ivoire). Ph.D. Thesis, Université Nangui Abrogoua, Abidjan, Côte d’Ivoire, January 2015. [Google Scholar]
- Eldin, M. Le climat. In Le Milieu Naturel de la Cote d’Ivoire; Mémoires ORSTOM: Paris, France, 1971; pp. 77–108. [Google Scholar]
- Guillaumet, J.L.; Adjanohoun, E. La végétation. In Le Milieu Naturel de la Côte d’Ivoire; Mémoires ORSTOM: Paris, France, 1971; pp. 161–232. [Google Scholar]
- Noufou, C. Déforestation et Activités Agricoles en Côte d’Ivoire: Recherche d’un Nouvel Équilibre. Ph.D. Thesis, Faculté Des Études Supérieures de L’université Laval, Laval, QC, Canada, January 1998. [Google Scholar]
- USAID (United States Agency for International Development). Guinea-Land Tenure and Property Rights Profile; USAID Country Profile; USAID: Washington, DC, USA, 2011; p. 23. [Google Scholar]
- Perraud, A. Les sols. In Le Milieu Naturel de la Côte D’ivoire; Mémoires ORSTOM: Paris, France, 1971; pp. 265–391. [Google Scholar]
- Sylla, M.B. Development and Analysis of Climatological Baseline and Climate Change Scenarios for Ecowas. Technical Report for United Nations University Institute for Natural Resources in Africa (UNU-INRA) Project: Climate Change, Agricultural Trade and Food Security in ECOWAS; United Nations University: Tokyo, Japan, 2015. [Google Scholar]
- Giorgi, F.; Coppola, E.; Solmon, F.; Mariotti, L.; Sylla, M.B.; Bi, X.; Elguindi, N.; Diro, G.T.; Nair, V.; Giuliani, G.; et al. RegCM4: Model description and preliminary tests over multiple CORDEX domains. Clim. Res. 2012, 52, 7–29. [Google Scholar] [CrossRef]
- Paeth, H.; Hall, N.M.J.; Gaertner, M.A.; Alonso, M.D.; Moumouni, S.; Polcher, J.; Ruti, P.M.; Fink, A.H.; Gosset, M.; Lebel, T.; et al. Progress in regional downscaling of West African precipitation. Atmos. Sci. Lett. 2011, 12, 75–82. [Google Scholar] [CrossRef]
- Sylla, M.B.; Gaye, A.T.; Jenkins, G.S. On the fine-scale topography regulating changes in atmospheric hydrological cycle and extreme rainfall over West Africa in a Regional Climate Model projections. Int. J. Geophys. 2012, 1–15. [Google Scholar] [CrossRef]
- Abiodun, B.J.; Lawal, K.A.; Salami, A.T.; Abatan, A.A. Potential influences of global warming on future climate and extreme events in Nigeria. Reg. Environ. Chang. 2013, 13, 477–491. [Google Scholar] [CrossRef]
- Zaroug, M.A.H.; Sylla, M.B.; Giorgi, F.; Eltahir, E.A.B.; Aggarwal, P.K. A sensitivity study on the role of the Swamps of Southern Sudan in the summer climate of North Africa using a regional climate model. Theor. Appl. Climatol. 2013, 113, 63–81. [Google Scholar] [CrossRef]
- Ibrahim, B.; Karambiri, H.; Polcher, J.; Yacouba, H.; Ribstein, P. Changes in rainfall regime over Burkina Faso under the climate change conditions simulated by 5 regional climate models. Clim. Dyn. 2014, 42, 1363–1381. [Google Scholar] [CrossRef] [Green Version]
- Taylor, K.E.; Stouffer, R.J.; Meehl, G.A. An Overview of CMIP5 and the Experiment Design. Bull. Am. Meteorol. Soc. 2012, 93, 485–498. [Google Scholar] [CrossRef]
- Mora, D.E.; Campozano, L.; Cisneros, F.; Wyseure, G.; Willems, P. Climate changes of hydrometeorological and hydrological extremes in the Paute basin, Ecuodoreas Andes. Hydrol. Earth Syst. Sci. 2014, 18, 631–648. [Google Scholar] [CrossRef] [Green Version]
- Mouelhi, S.; Michel, C.; Perrin, C.; Andréassian, V. Stepwise development of a two-parameter monthly water balance model. J. Hydrol. 2006, 318, 200–214. [Google Scholar] [CrossRef]
- Kouakou, K.E.; Kouassi, A.M.; Kouadio, Z.A.; Goula Bi, T.A.; Savané, I. Modélisation hydrologique du bassin versant de la Comoé dans un contexte de changement climatique. IJIAS 2016, 15, 799–811. [Google Scholar]
- Perrin, C. Vers Une Amélioration d’un Modèle Global Pluie-Début au Travers D’une Approche Comparative. Ph.D. Thesis, INPG, Grenoble, France/Cemagref, Antony, France, October 2000. [Google Scholar]
- Nash, J.; Sutcliffe, J. River flow forecasting through conceptual models. Part I: A discussion of principle. J. Hydrol. 1970, 10, 282–290. [Google Scholar] [CrossRef]
- Roudier, P.; Ducharne, A.; Feyen, L. Climate change impacts on runoff in West Africa: A review. Hydrol. Earth Syst. Sci. 2014, 18, 2789–2801. [Google Scholar] [CrossRef]
- IPCC (Intergovernmental Panel on Climate Change). Climate Change 2013: The Physical Science Basis. In Contribution of Working Group I to the Fifth Assessment Report of the Intergovernmental Panel on Climate Change; Stocker, T.F., Qin, D., Plattner, G.-K., Tignor, M., Allen, S.K., Boschung, J., Nauels, A., Xia, Y., Bex, V., Midgley, P.M., Eds.; Cambridge University Press: Cambridge, UK, 2013. [Google Scholar] [CrossRef]
- Sylla, M.B.; Nikiema, P.M.; Gibba, P.; Kebe, I.; Klutse, N.A.B. Climate Change over West Africa: Recent Trends and Future Projections. In Adaptation to Climate Change and Variability in Rural West Africa; Yaro, A.J., Hesselberg, J., Eds.; Springer International Publishing: Cham, Switzerland, 2016; pp. 25–40. [Google Scholar]
- Soro, G.E.; Yao, A.B.; Kouamé, Y.M.; Goula Bi, T.A. Climate Change and Its Impacts on Water Resources in the Bandama Basin, Côte d’Ivoire. Hydrology 2017, 4, 18. [Google Scholar] [CrossRef]
- Mbaye, M.L.; Hagemann, S.; Haensler, A.; Stacke, T.; Gaye, A.T.; Afouda, A. Assessment of Climate Change Impact on Water Resources in the Upper Senegal Basin (West Africa). Am. J. Clim. Chang. 2015, 4, 77–93. [Google Scholar] [CrossRef]
- Bodian, A.; Dezetter, A.; Diop, L. Evolution des apports en eau au barrage de Manantali à l’horizon 2050. Int. J. Water Resour. Dev. 2015, 32, 1–13. [Google Scholar]
- Biao, E.I. Assessing the Impacts of Climate Change on River Discharge Dynamics in Oueme River Basin (Benin, West Africa). Hydrology 2017, 4, 47. [Google Scholar] [CrossRef]
- Kouakou, K.E.; Goula, B.T.A.; Kouassi, A.M. Analyze of climate variability and change impacts on hydro-climate parameters: Case study of Côte d’Ivoire. Int. J. Sci. Eng. Res. 2012, 3, 1–8. [Google Scholar]
- Rowell, D. Sources of uncertainty in future changes in local precipitation. Clim. Dyn. 2012, 39, 1929–1950. [Google Scholar] [CrossRef]
- Orlowsky, B.; Seneviratne, S. Global changes in extreme events: Regional and seasonal dimension. Clim. Chang. 2012, 110, 669–696. [Google Scholar] [CrossRef]


| Longitude (Decimal Degree) | Latitude (Decimal Degree) | Temperature (in °C) | Rainfall (in mm) | PET (in mm) | |
|---|---|---|---|---|---|
| Odienné | −7.5660 | 9.5000 | 26.0 | 1365.9 | 1559.9 |
| Man | −7.5167 | 7.4000 | 25.2 | 1617.8 | 1411.0 |
| Gagnoa | −5.9500 | 6.1333 | 26.5 | 1322.7 | 1632.4 |
| Average | - | - | 25.9 | 1435.5 | 1534.4 |
| Baseline | 2030 | 2050 | 2070 | 2090 | ||||||
|---|---|---|---|---|---|---|---|---|---|---|
| Average | Change | Average | Change | Average | Change | Average | Change | |||
| Temperature | RCP 4.5 | 25.9 °C | 26.4 °C | +2% | 27.4 °C | +6% | 28 °C | +8% | 28.3 °C | +9% |
| RCP 8.5 | 27.4 °C | +6% | 28.3 °C | +9% | 29.3 °C | +13% | 30.8 °C | +19% | ||
| Rainfall | RCP 4.5 | 1435.5 mm | 1330.1 mm | –7% | 1310.2 mm | –9% | 1295.4 mm | –10% | 1296.6 mm | –10% |
| RCP 8.5 | 1224.7 mm | –15% | 1185 mm | –17% | 1155.3 mm | –20% | 1088.8 mm | –24% | ||
| Headwater Inflows from Guinea | 2030 | 2050 | 2070 | 2090 | |
|---|---|---|---|---|---|
| RCP 4.5 | Runoff change (in %) | −6.9 | −8.3 | −9.8 | −9.3 |
| Volume change (106 m3/year) | −48.3 | −71.6 | −95.2 | −86.5 | |
| RCP 8.5 | Runoff change (in %) | −14.7 | −17.5 | −19.5 | −24.1 |
| Volume change (106 m3/year) | −173.3 | −217.6 | −250.7 | −324.8 | |
© 2018 by the authors. Licensee MDPI, Basel, Switzerland. This article is an open access article distributed under the terms and conditions of the Creative Commons Attribution (CC BY) license (http://creativecommons.org/licenses/by/4.0/).
Share and Cite
Coulibaly, N.; Coulibaly, T.J.H.; Mpakama, Z.; Savané, I. The Impact of Climate Change on Water Resource Availability in a Trans-Boundary Basin in West Africa: The Case of Sassandra. Hydrology 2018, 5, 12. https://doi.org/10.3390/hydrology5010012
Coulibaly N, Coulibaly TJH, Mpakama Z, Savané I. The Impact of Climate Change on Water Resource Availability in a Trans-Boundary Basin in West Africa: The Case of Sassandra. Hydrology. 2018; 5(1):12. https://doi.org/10.3390/hydrology5010012
Chicago/Turabian StyleCoulibaly, Naga, Talnan Jean Honoré Coulibaly, Ziyanda Mpakama, and Issiaka Savané. 2018. "The Impact of Climate Change on Water Resource Availability in a Trans-Boundary Basin in West Africa: The Case of Sassandra" Hydrology 5, no. 1: 12. https://doi.org/10.3390/hydrology5010012
APA StyleCoulibaly, N., Coulibaly, T. J. H., Mpakama, Z., & Savané, I. (2018). The Impact of Climate Change on Water Resource Availability in a Trans-Boundary Basin in West Africa: The Case of Sassandra. Hydrology, 5(1), 12. https://doi.org/10.3390/hydrology5010012