Effect of Land Use Land Cover and Climate Change on River Flow and Soil Loss in Didessa River Basin, South West Blue Nile, Ethiopia


Abstract
:1. Introduction
2. Database and Catchment Description
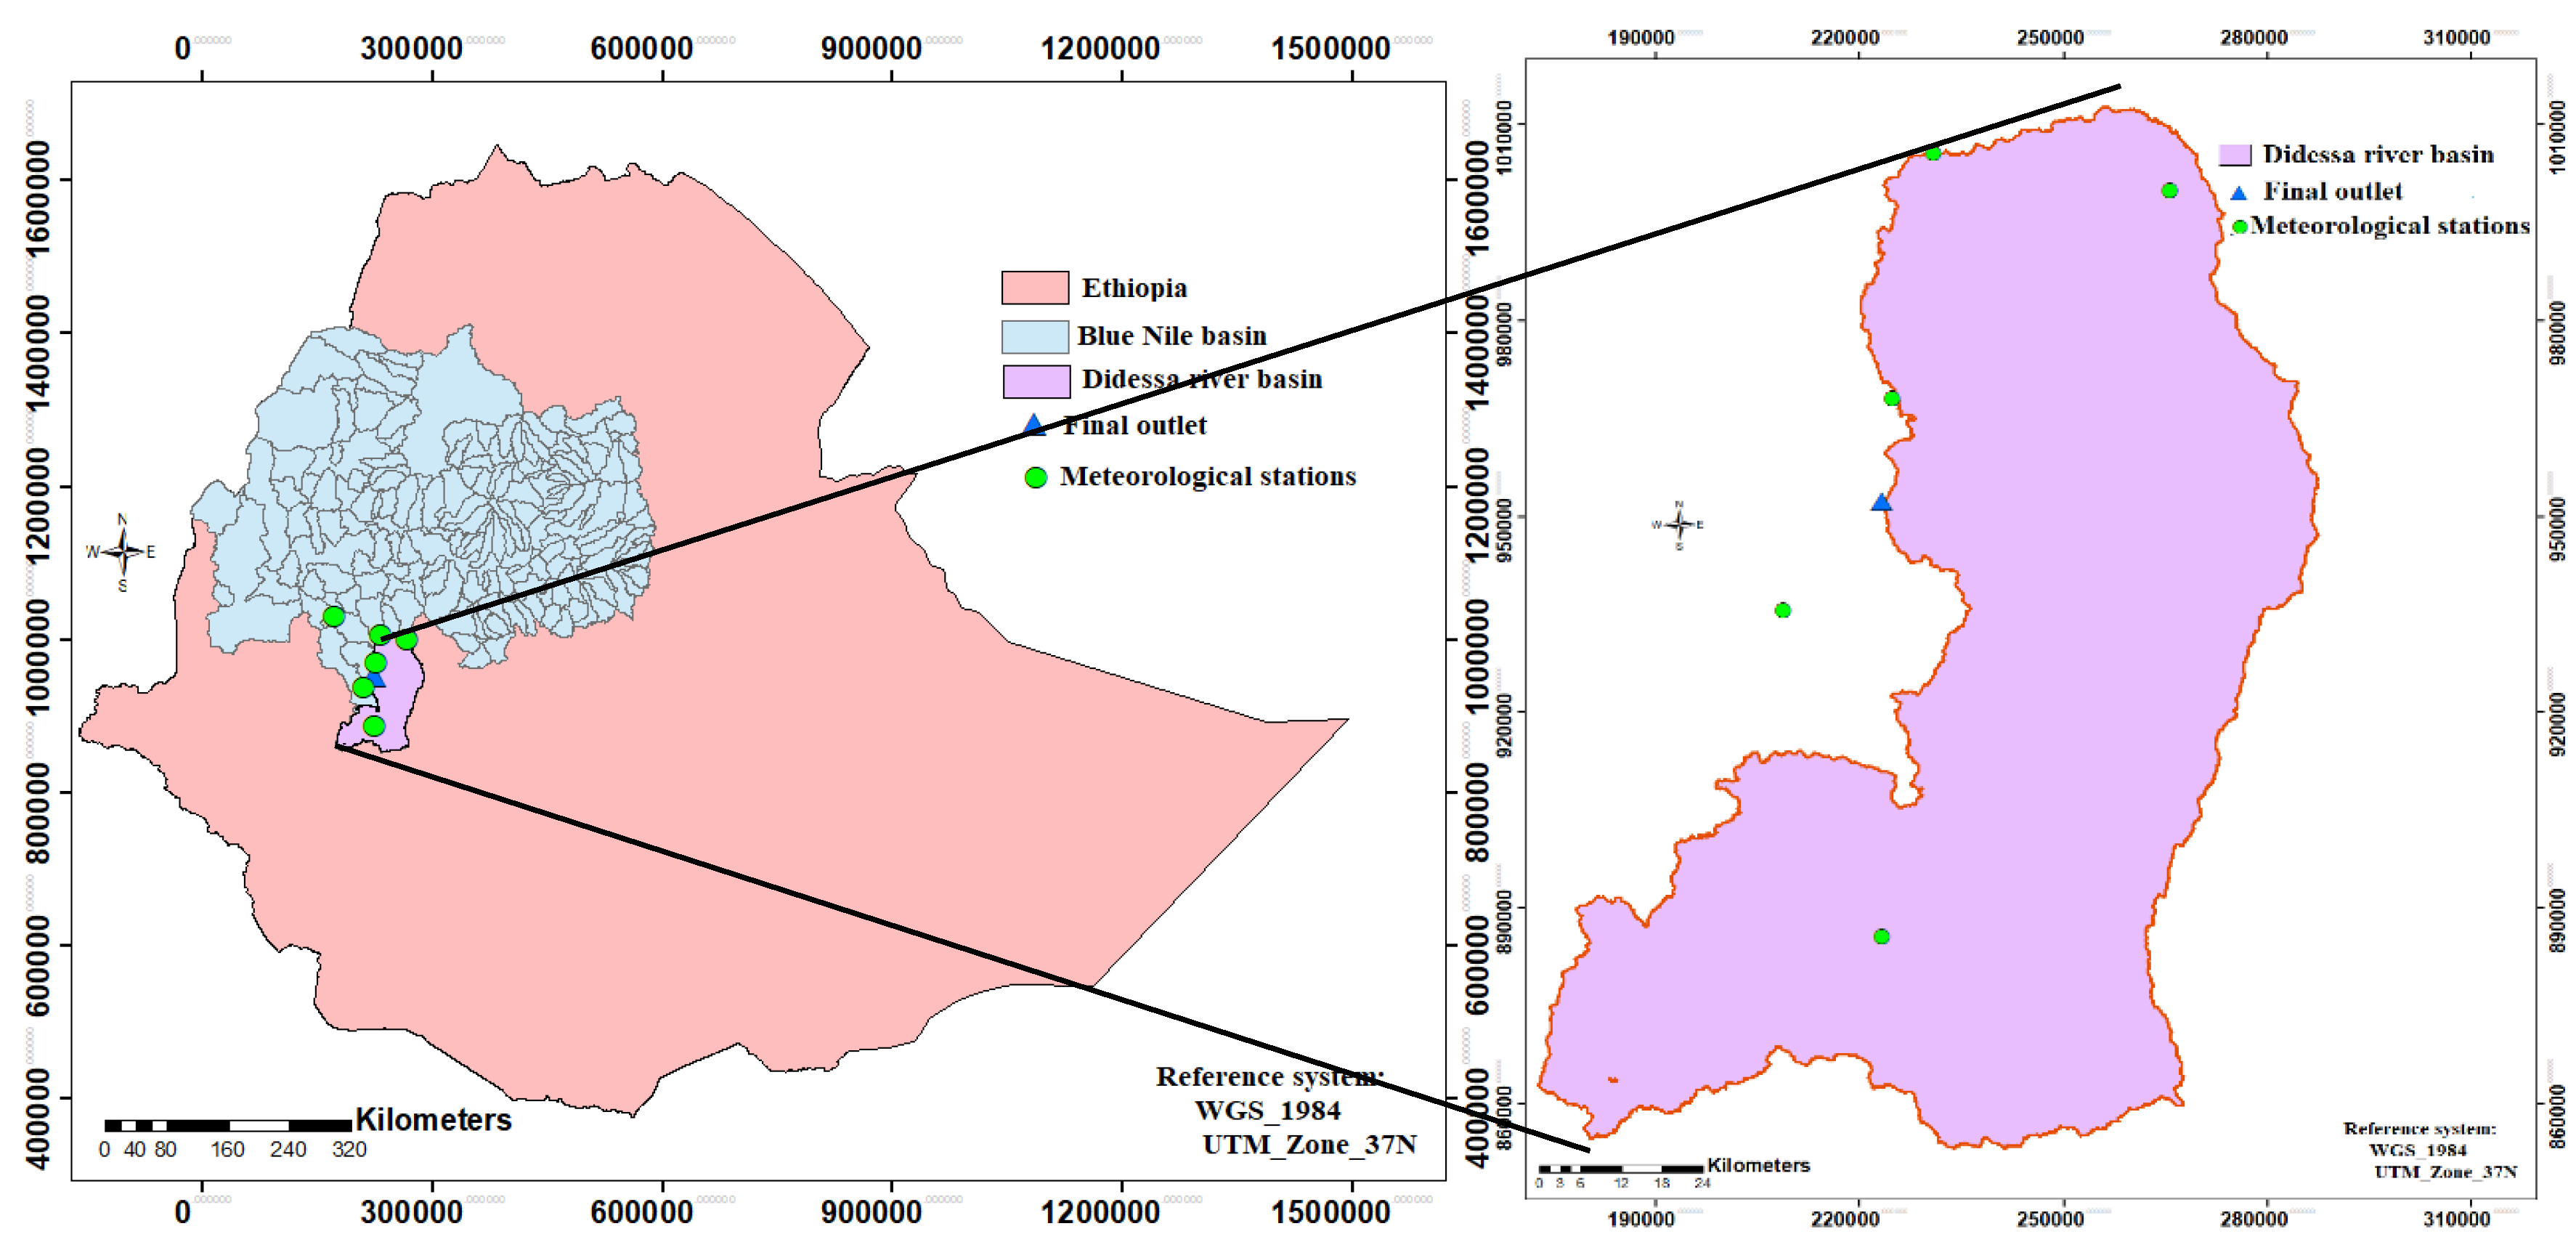
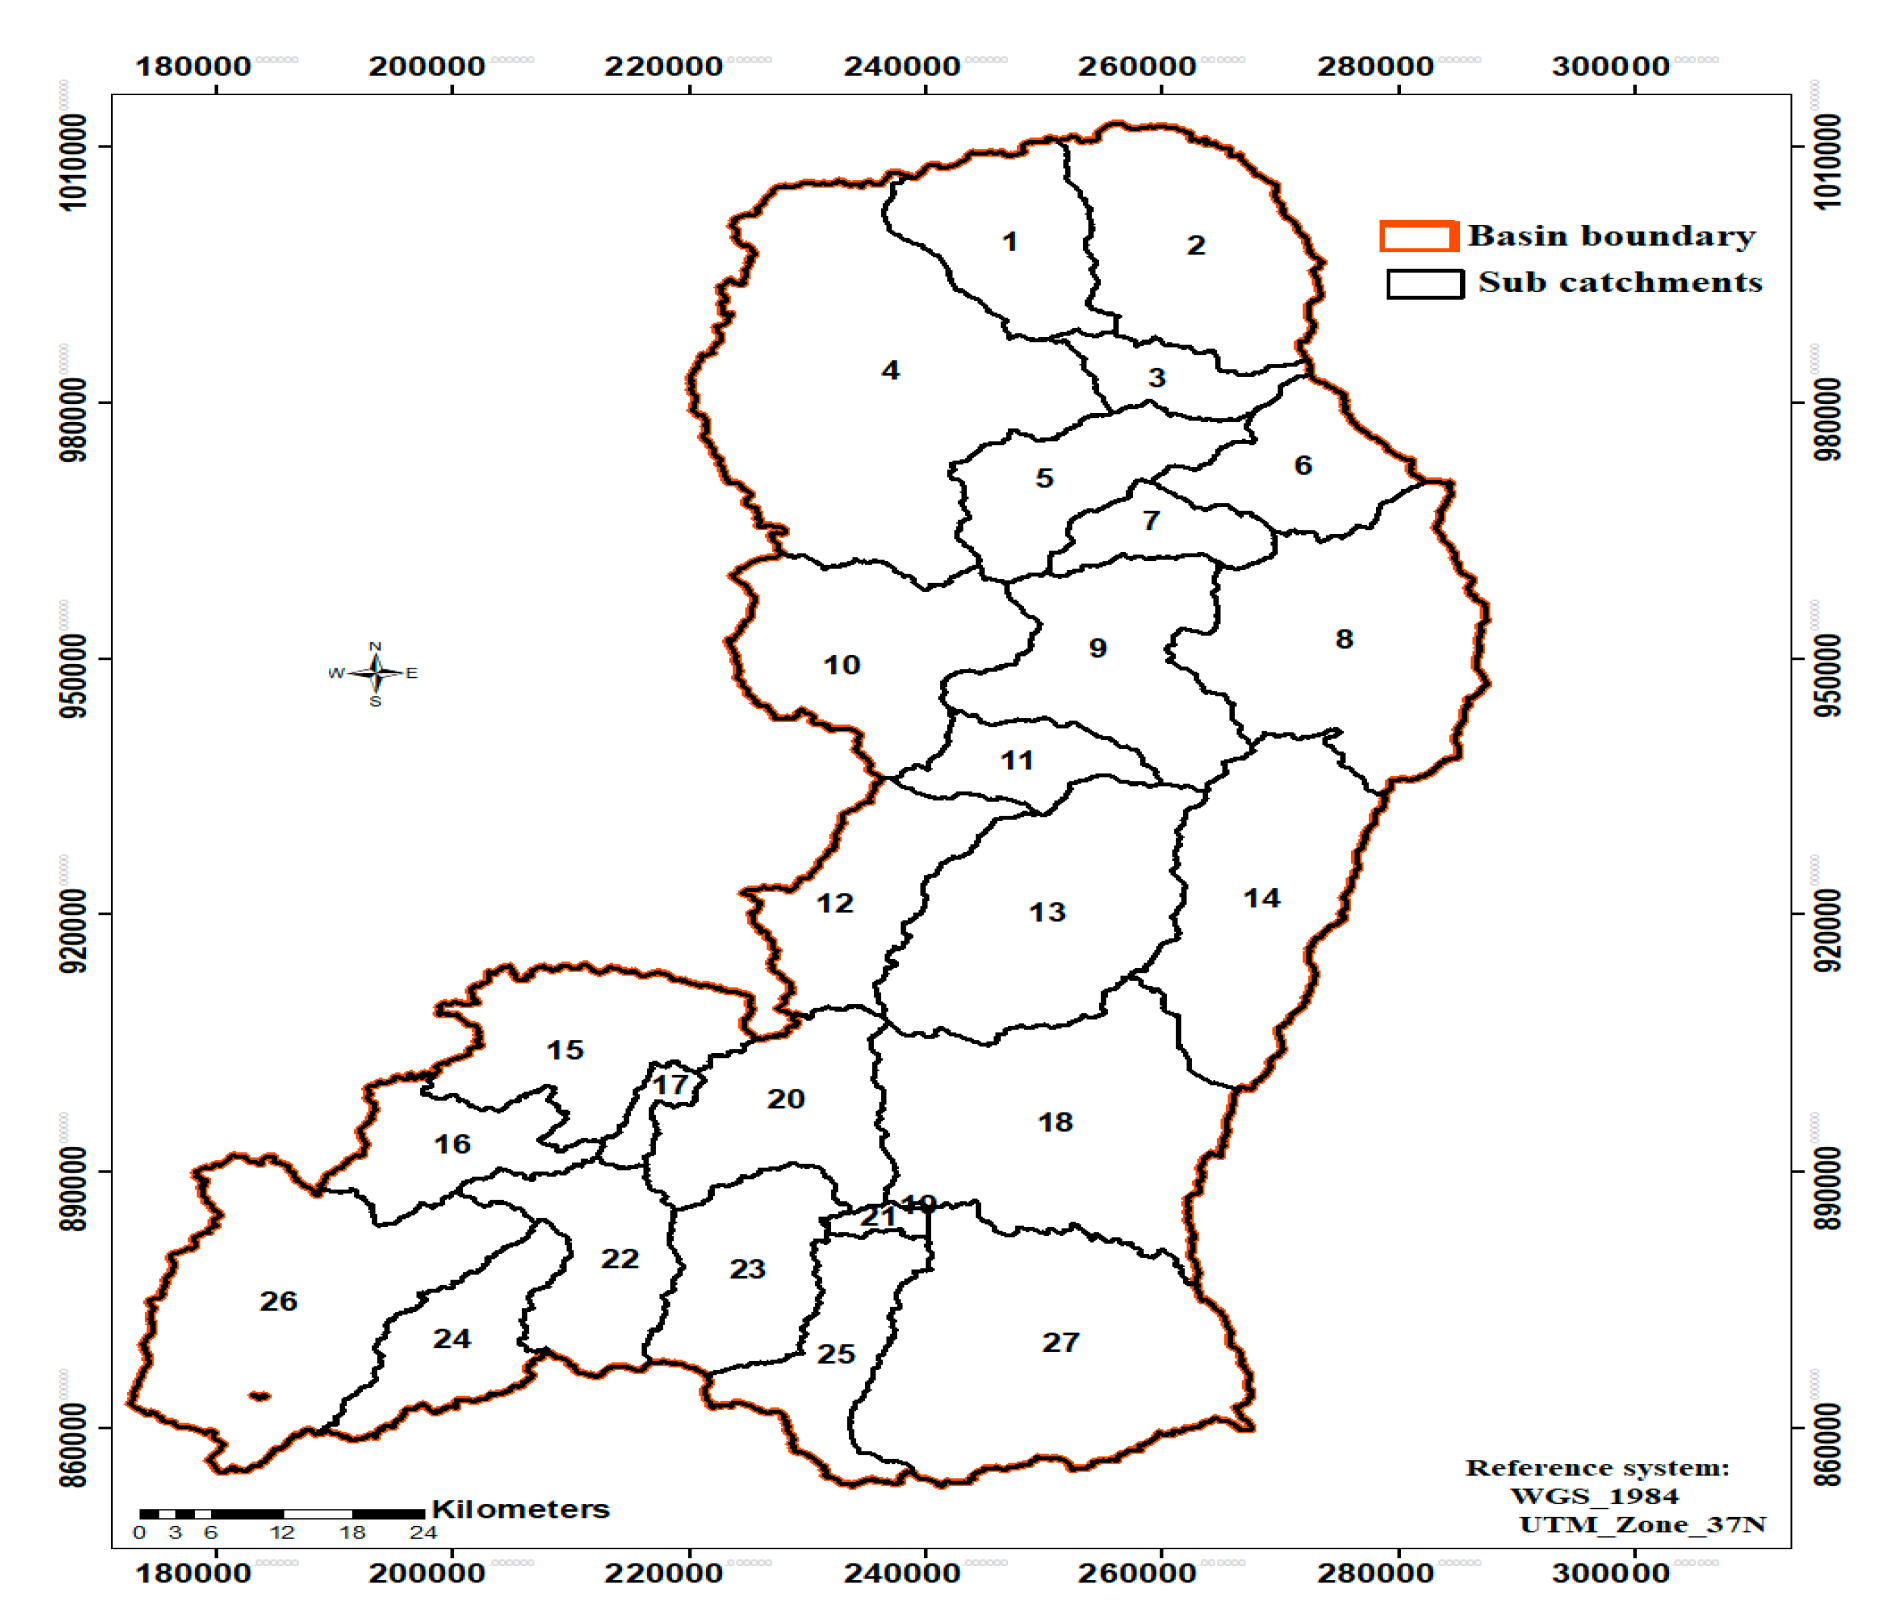
2.1. Catchment Description
2.2. Database
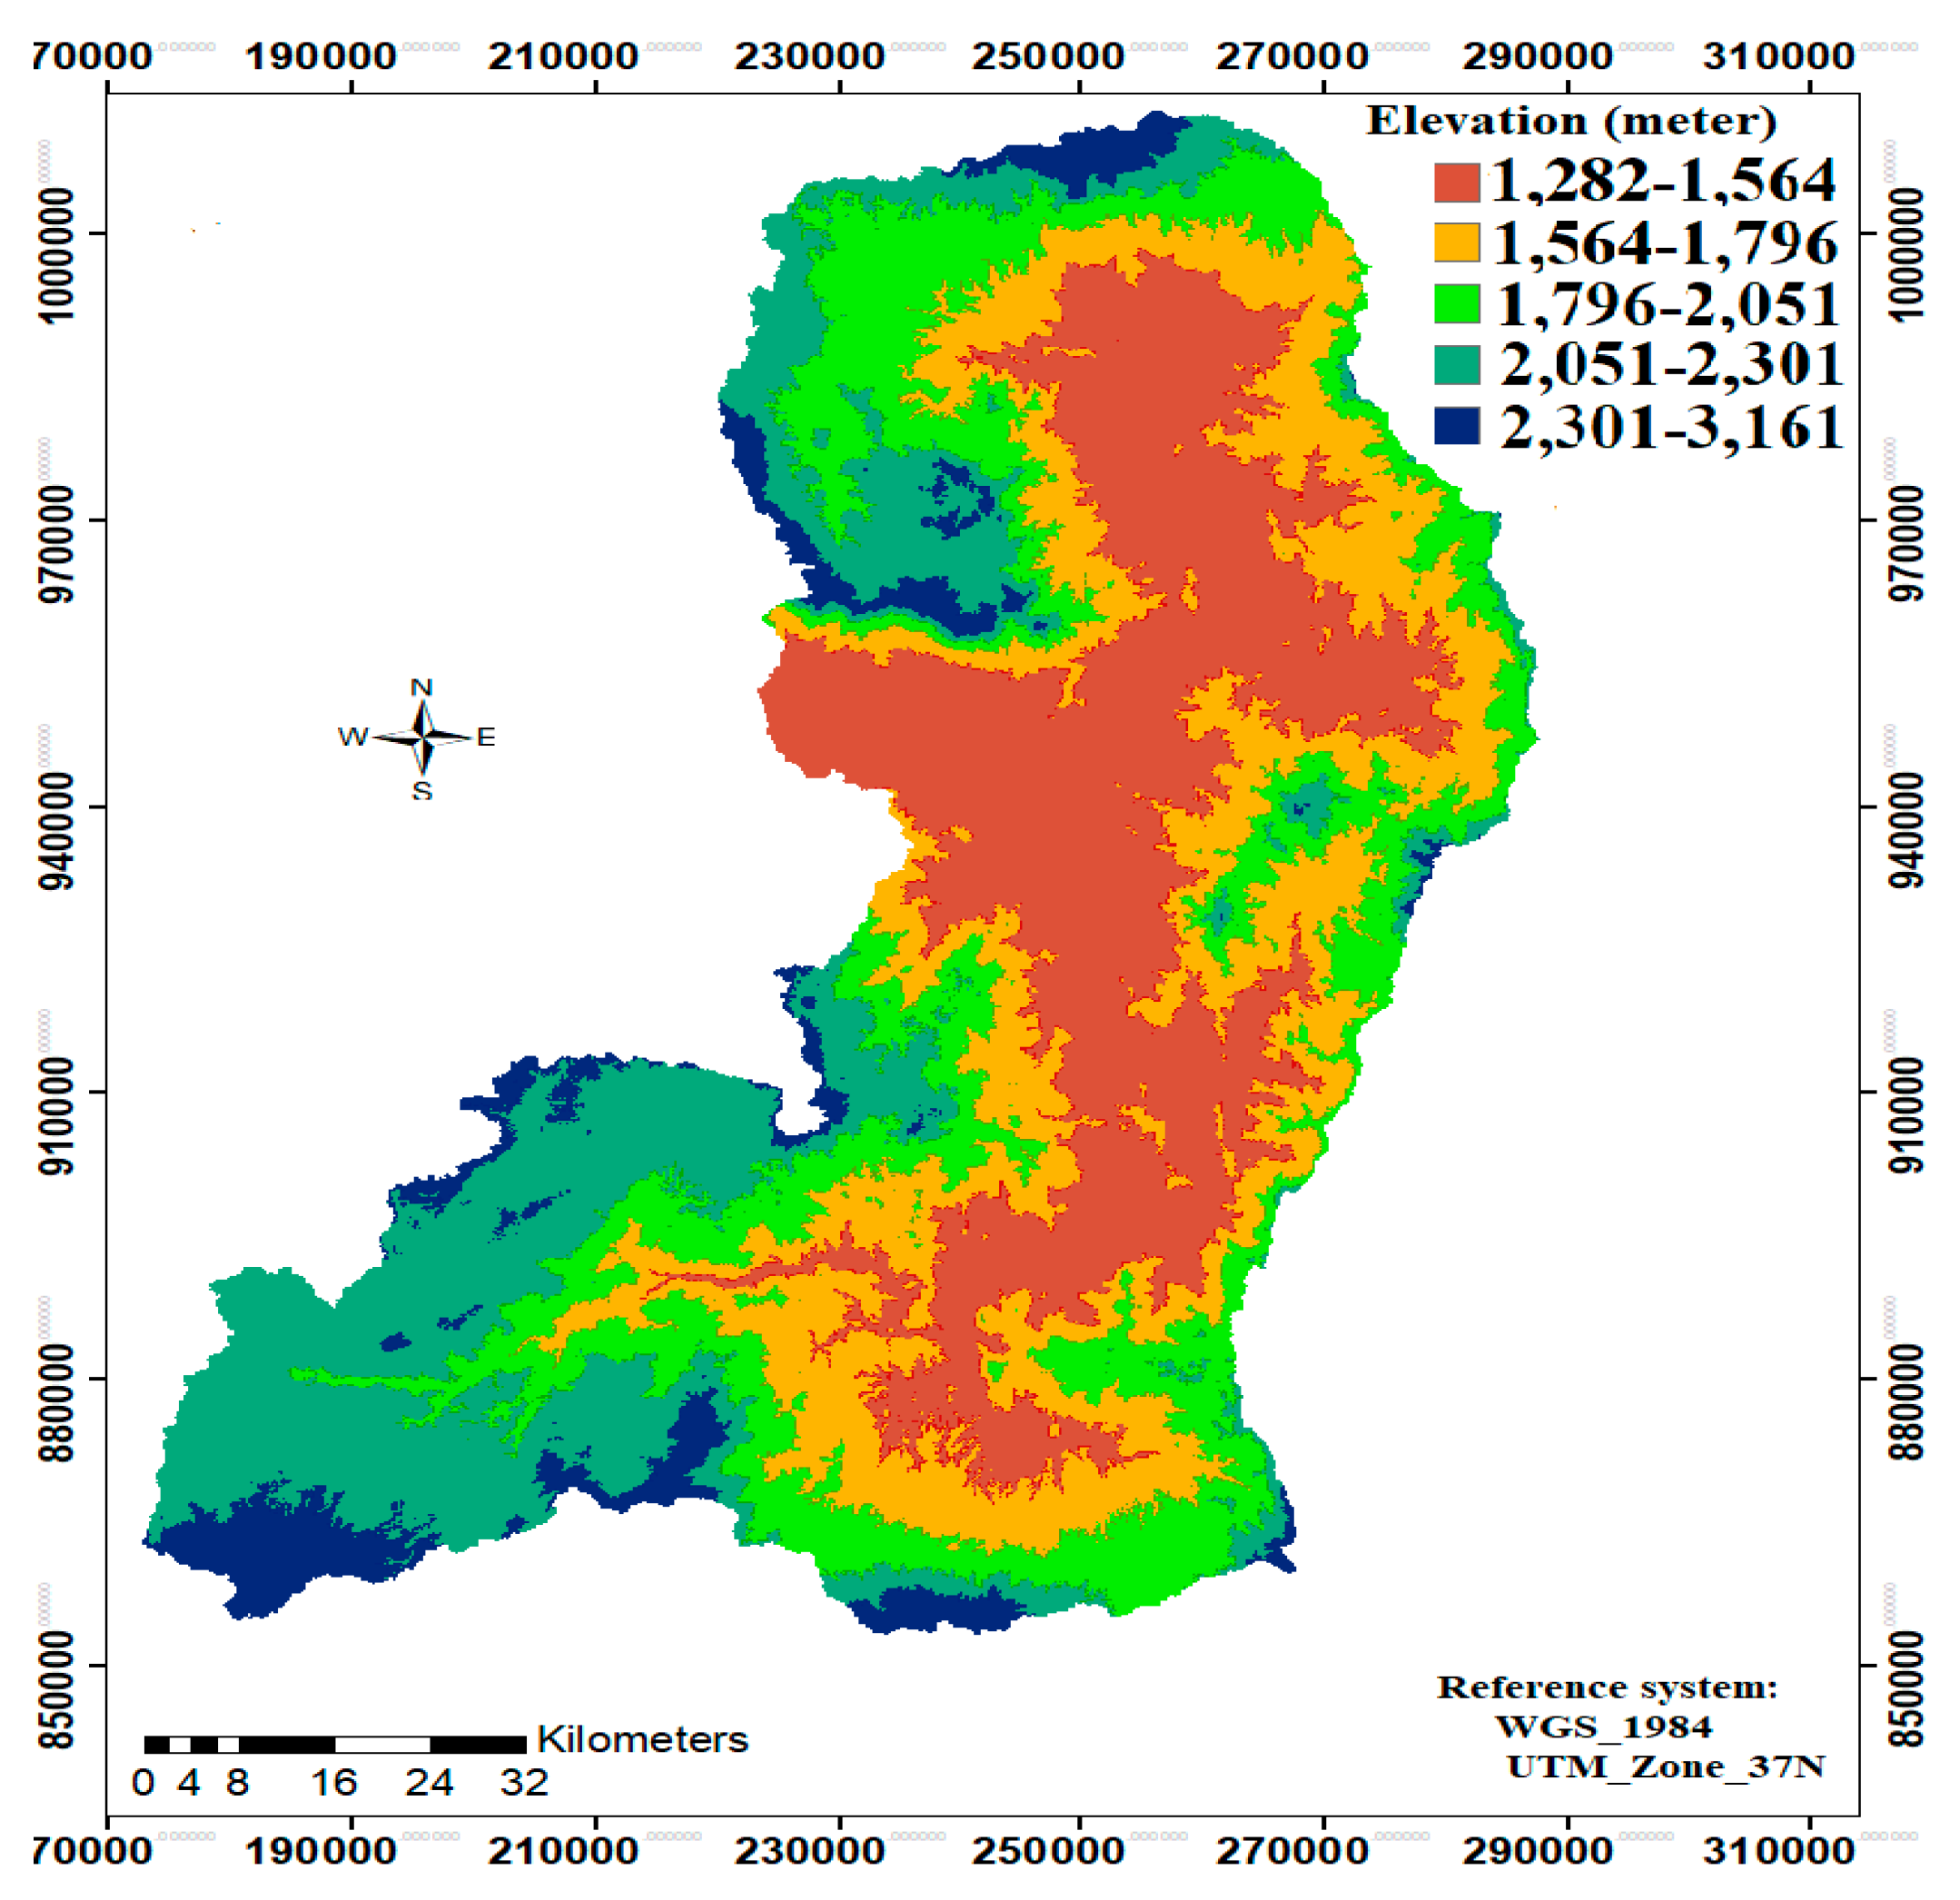
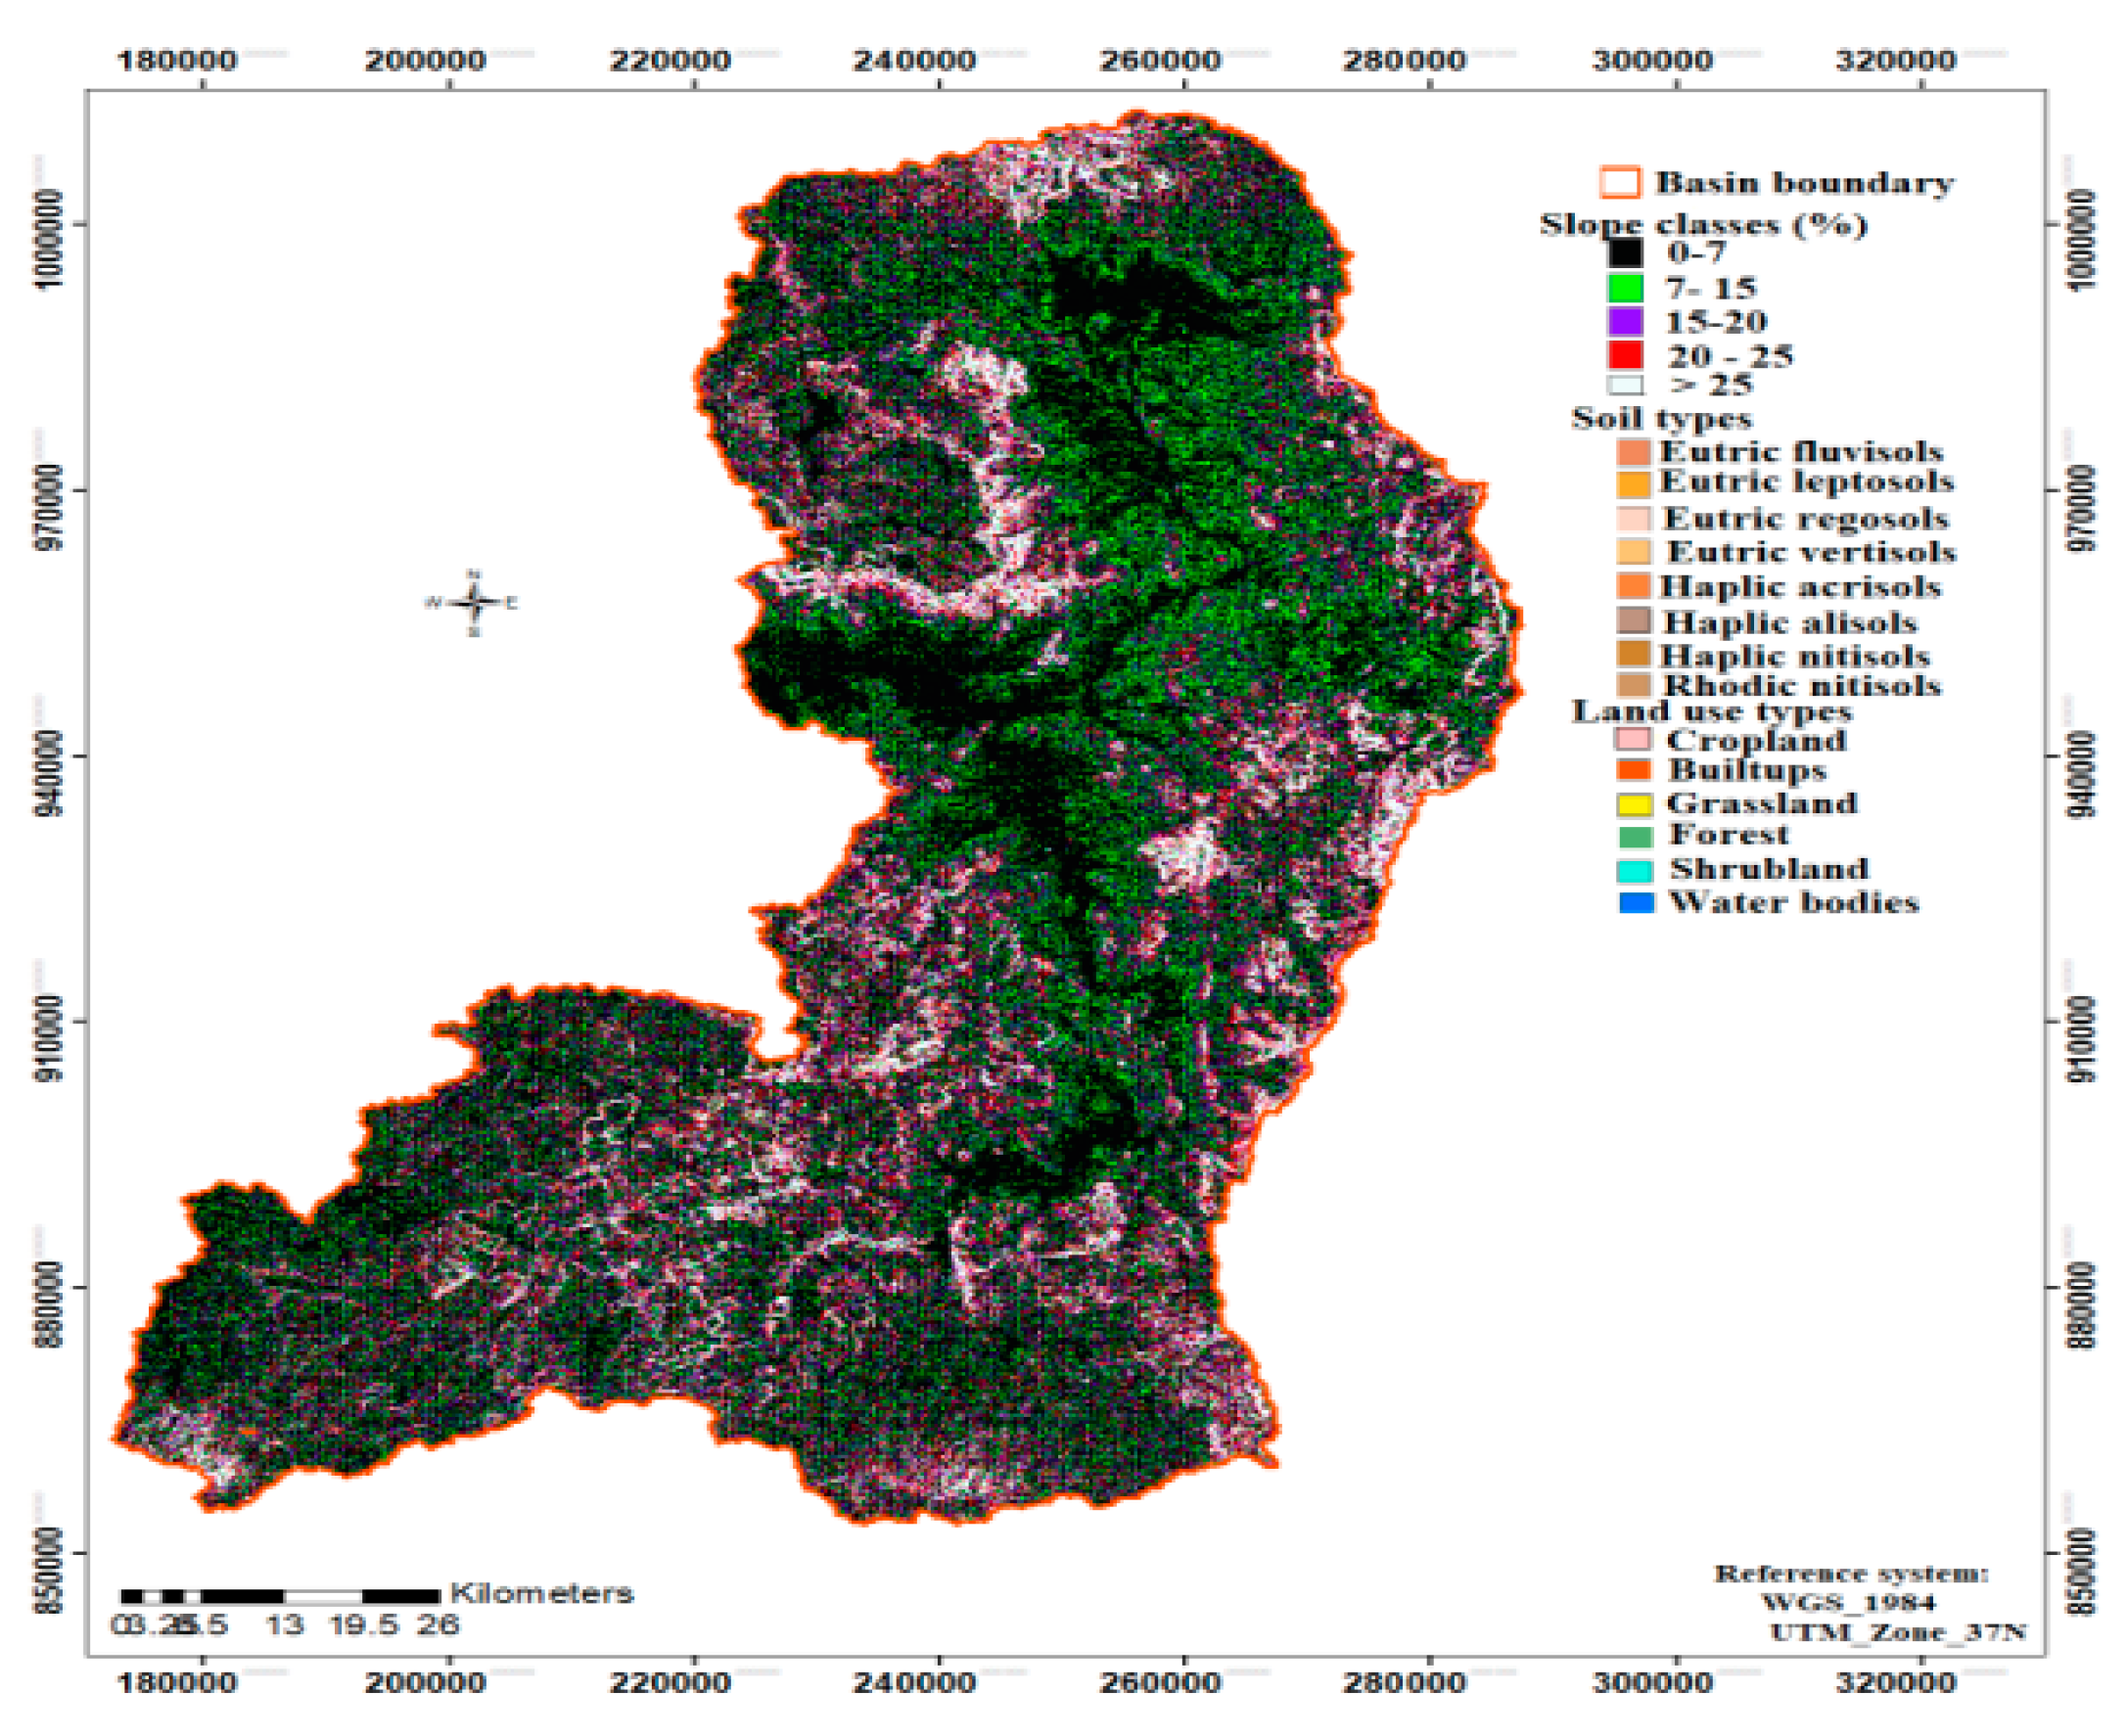
2.2.1. Digital Elevation Model
2.2.2. Climate Data
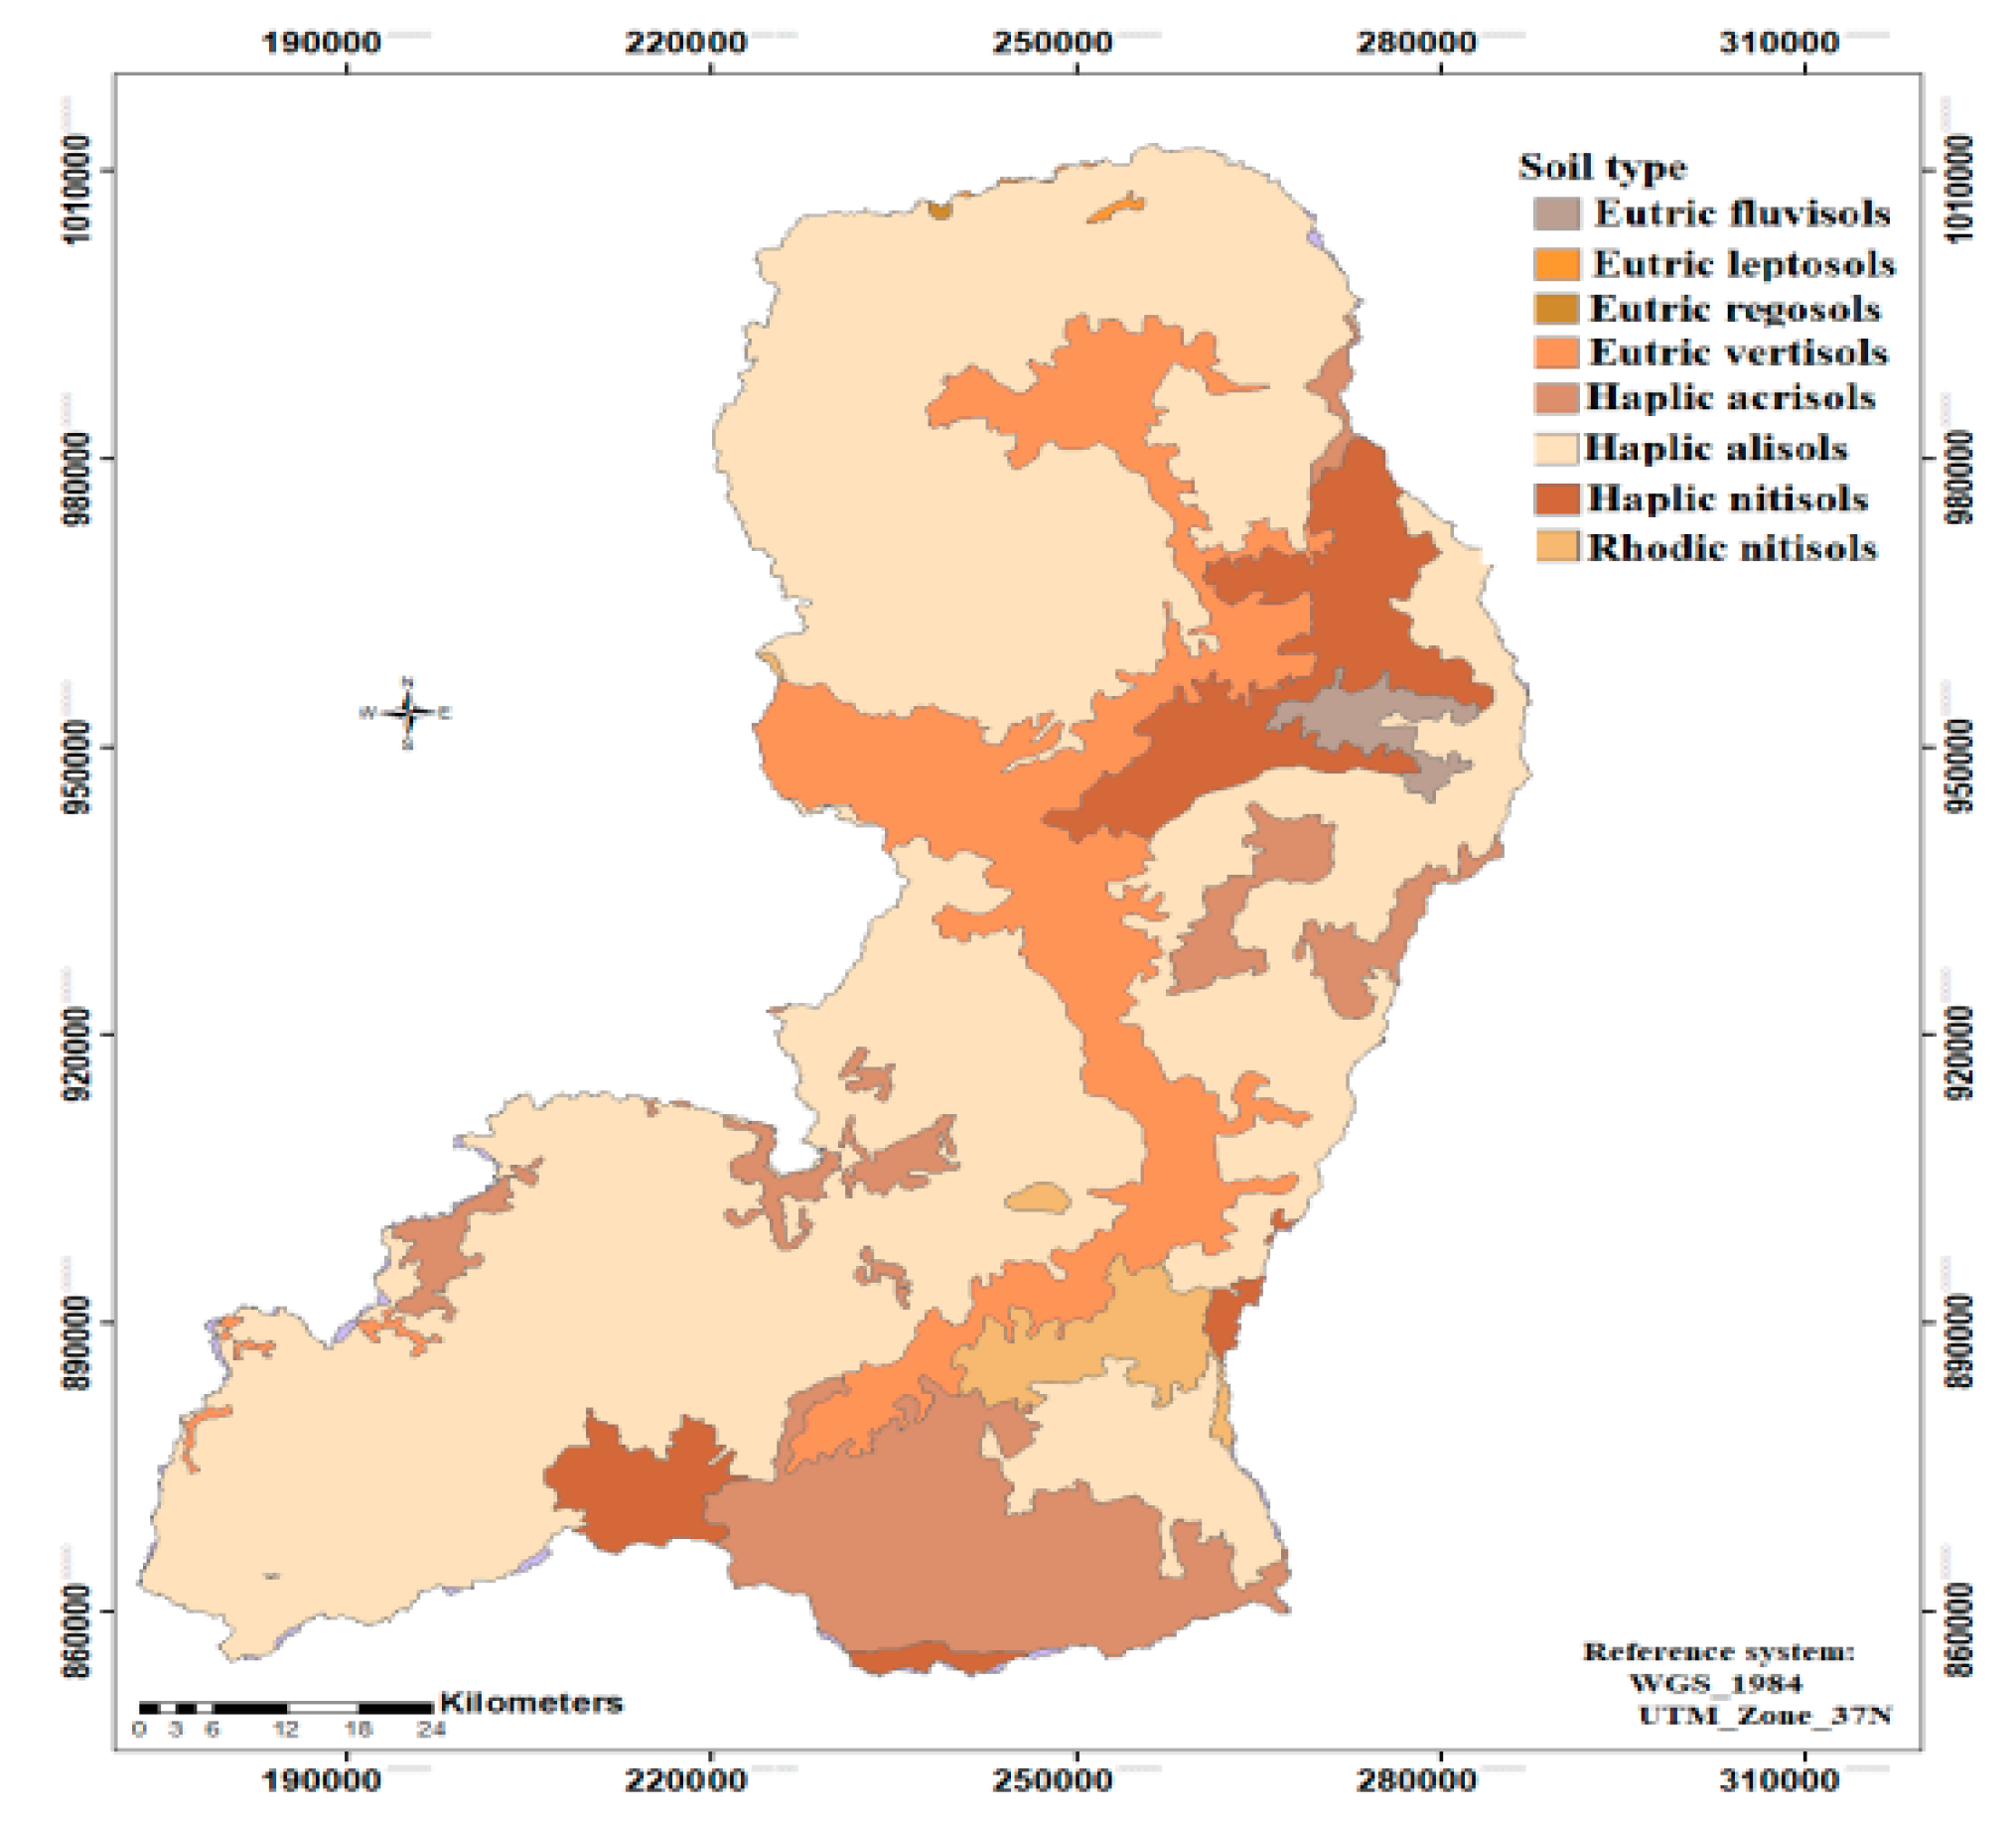
2.2.3. Soil Data
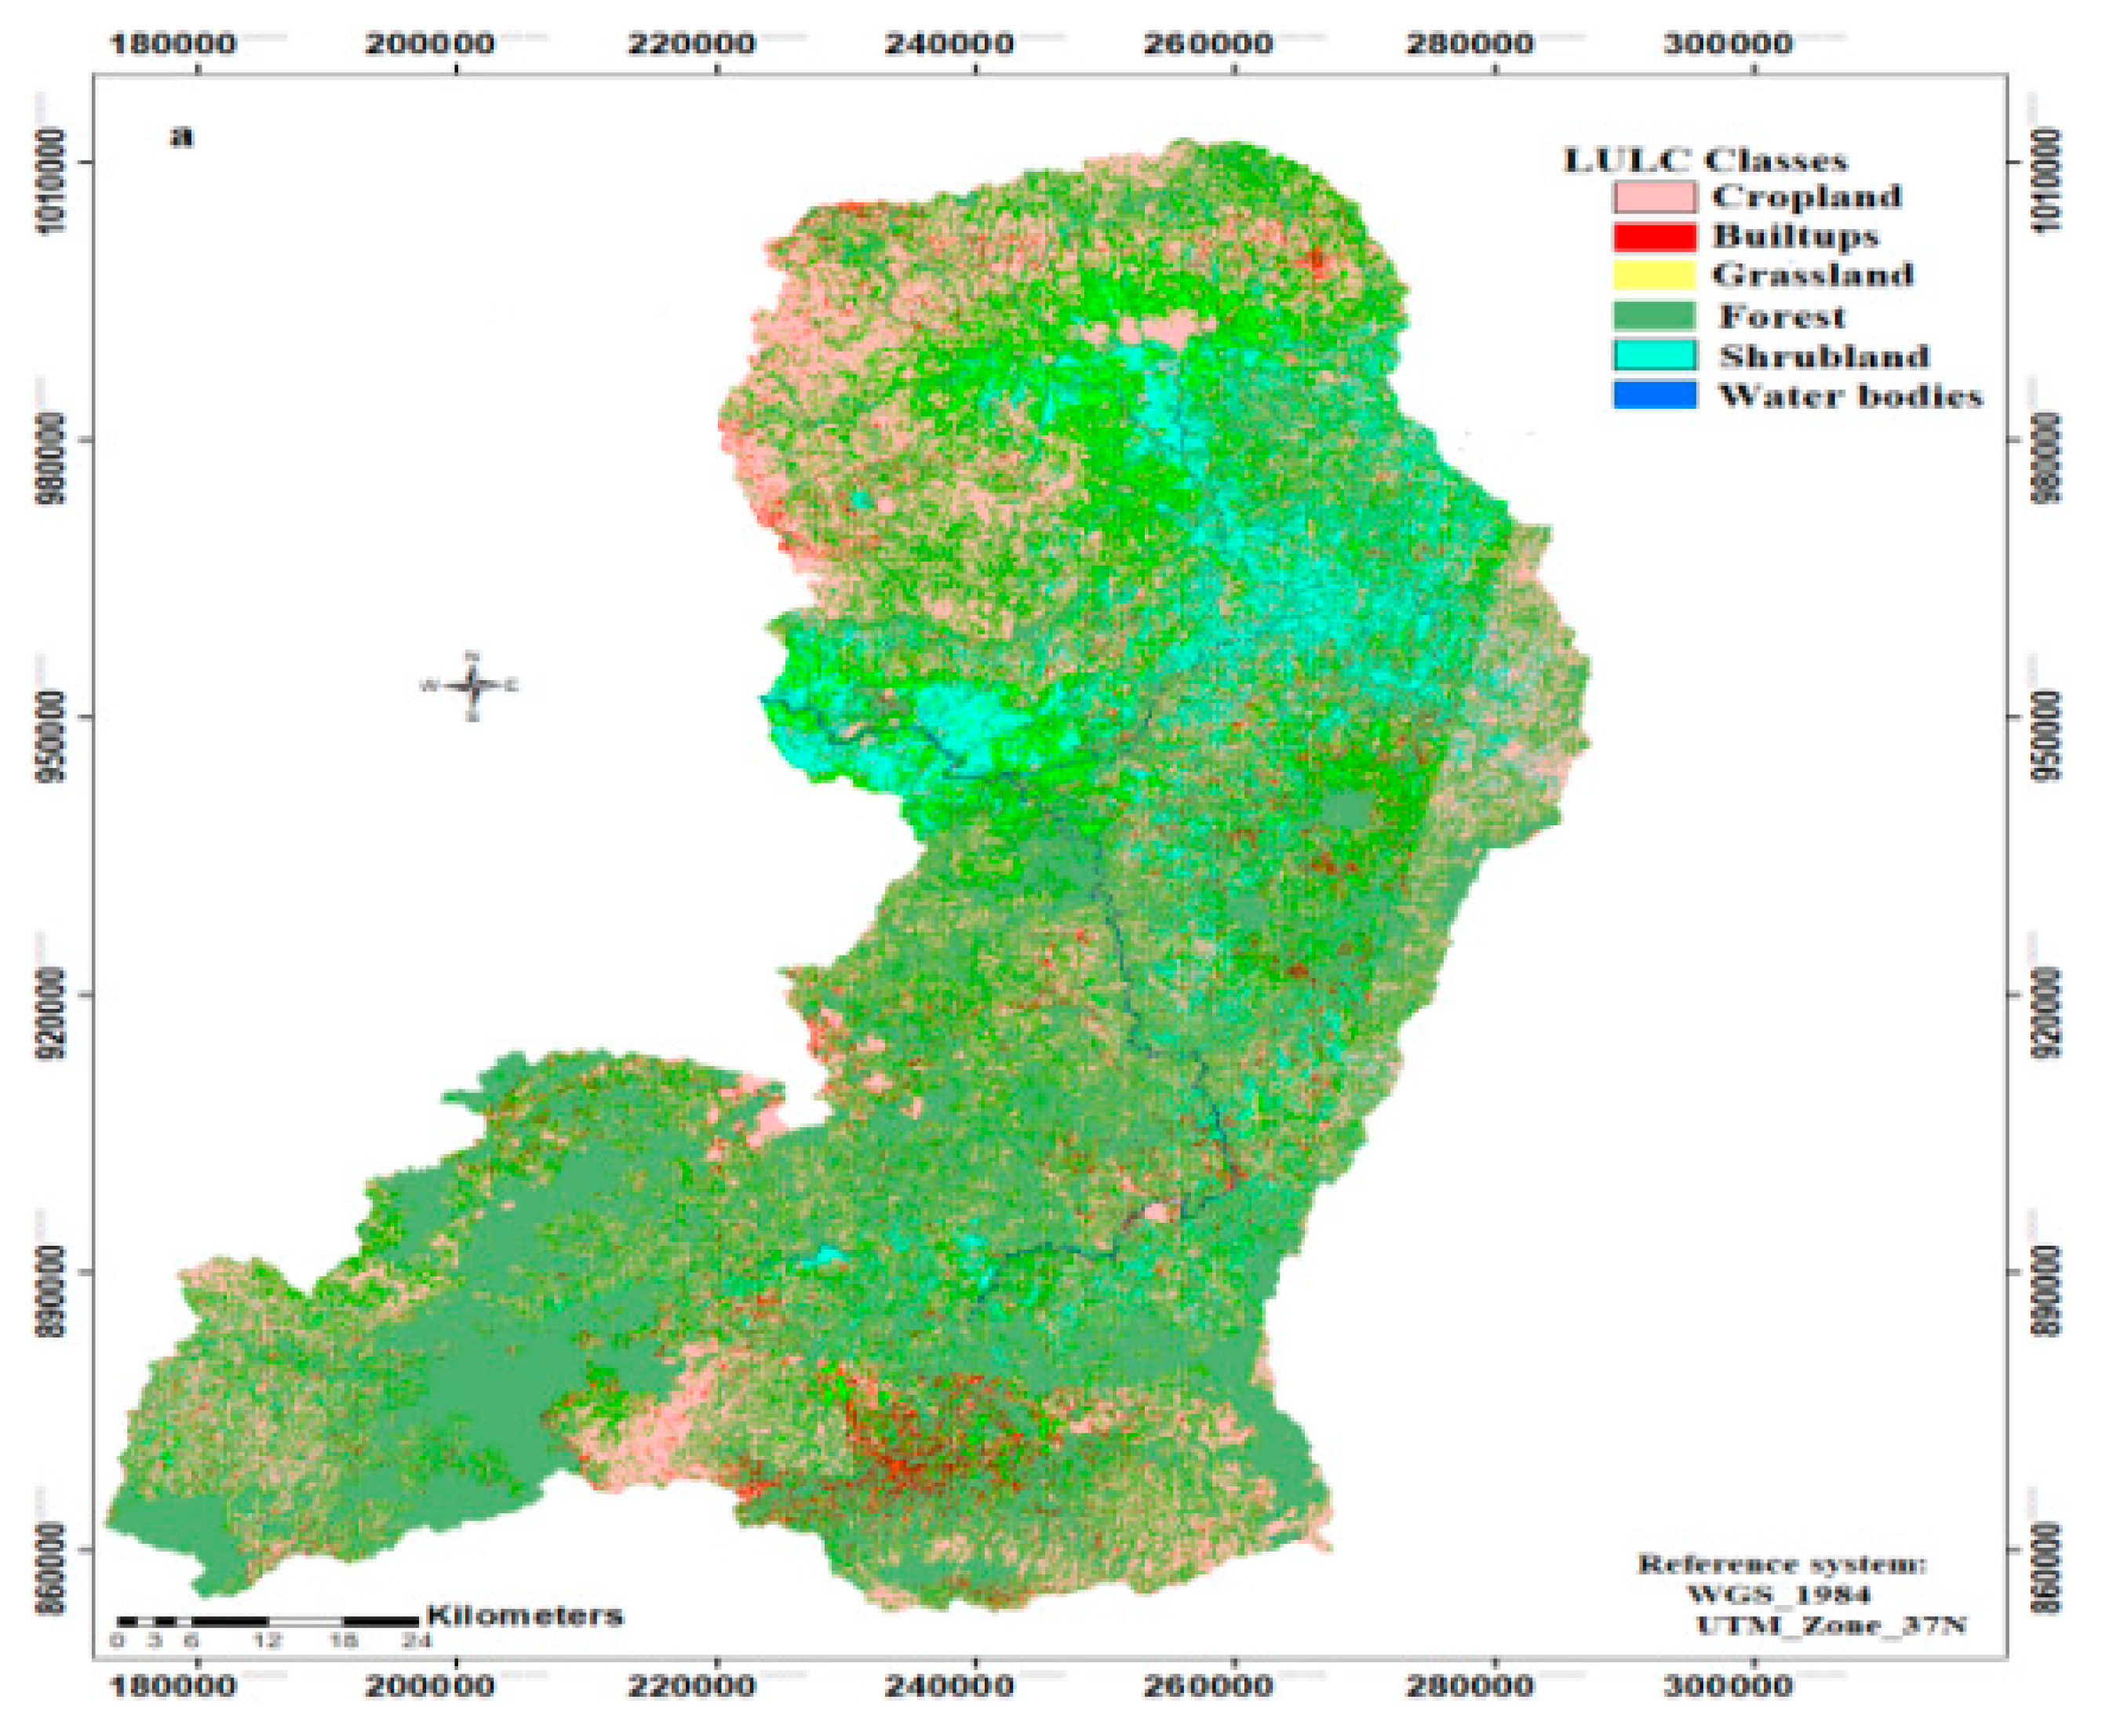
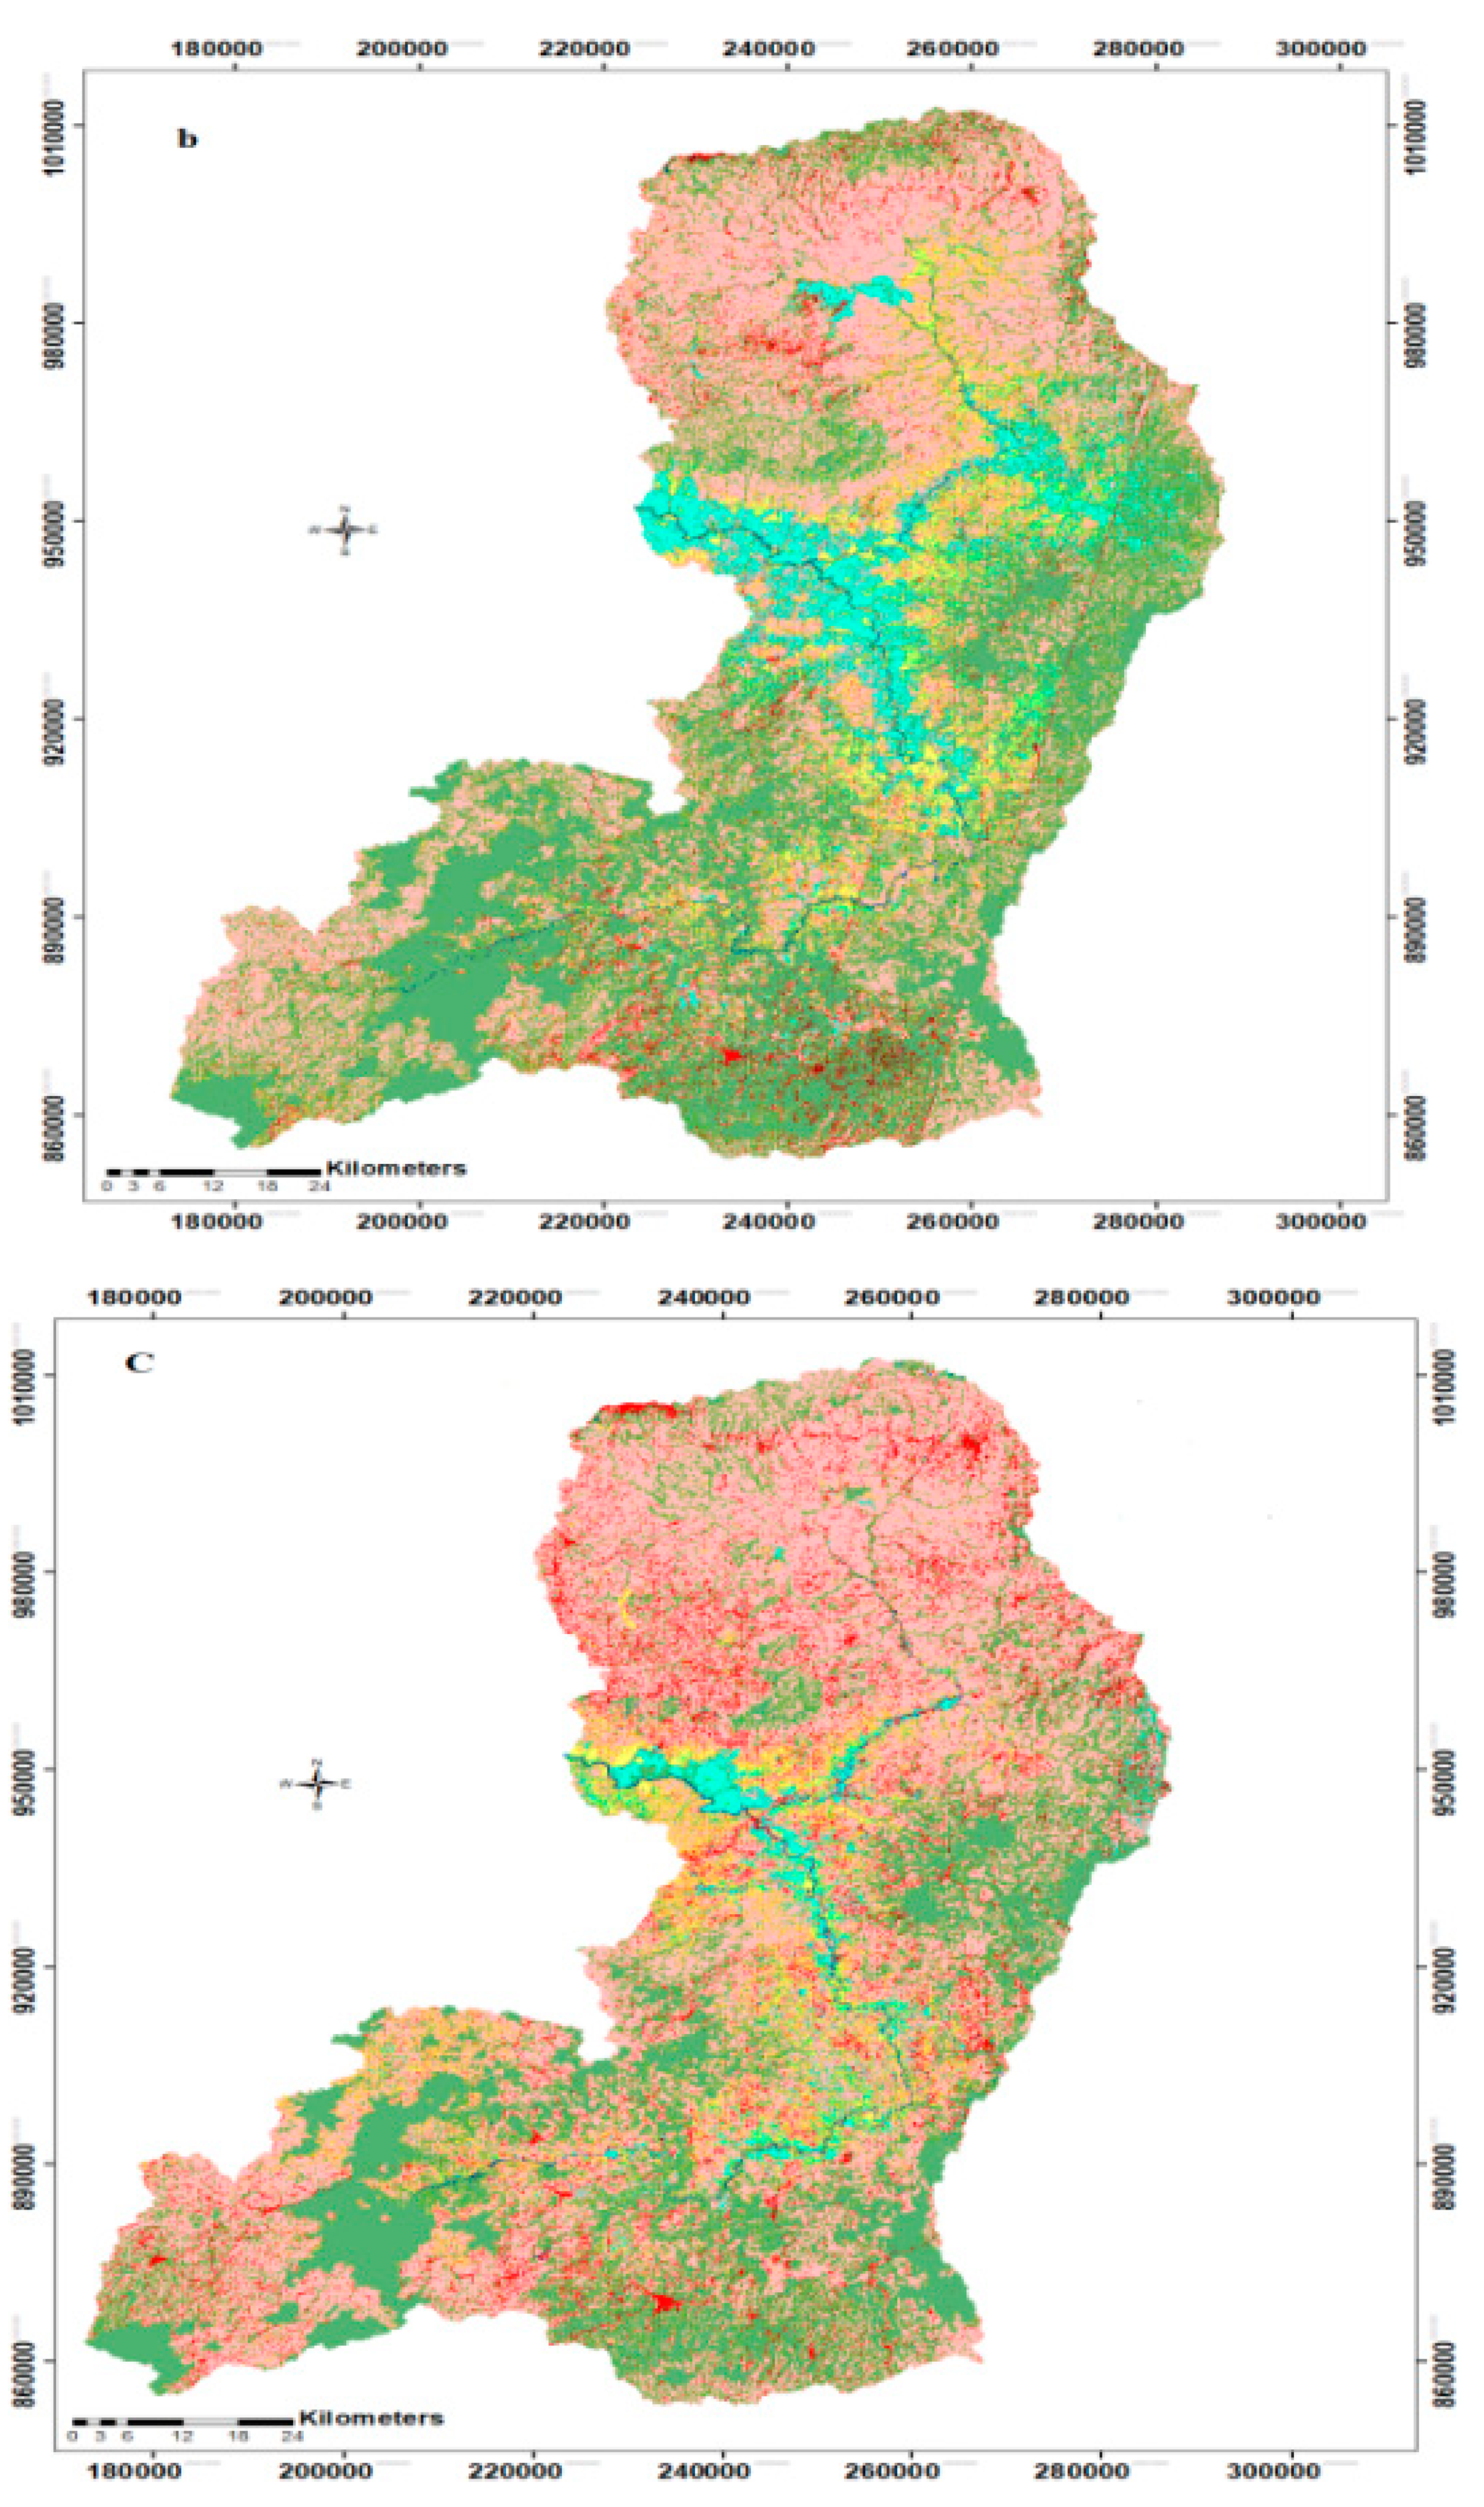
2.2.4. Land Use/Land Cover
3. Modelling Approach
3.1. River Flow and Sediment Yield Estimation Methods
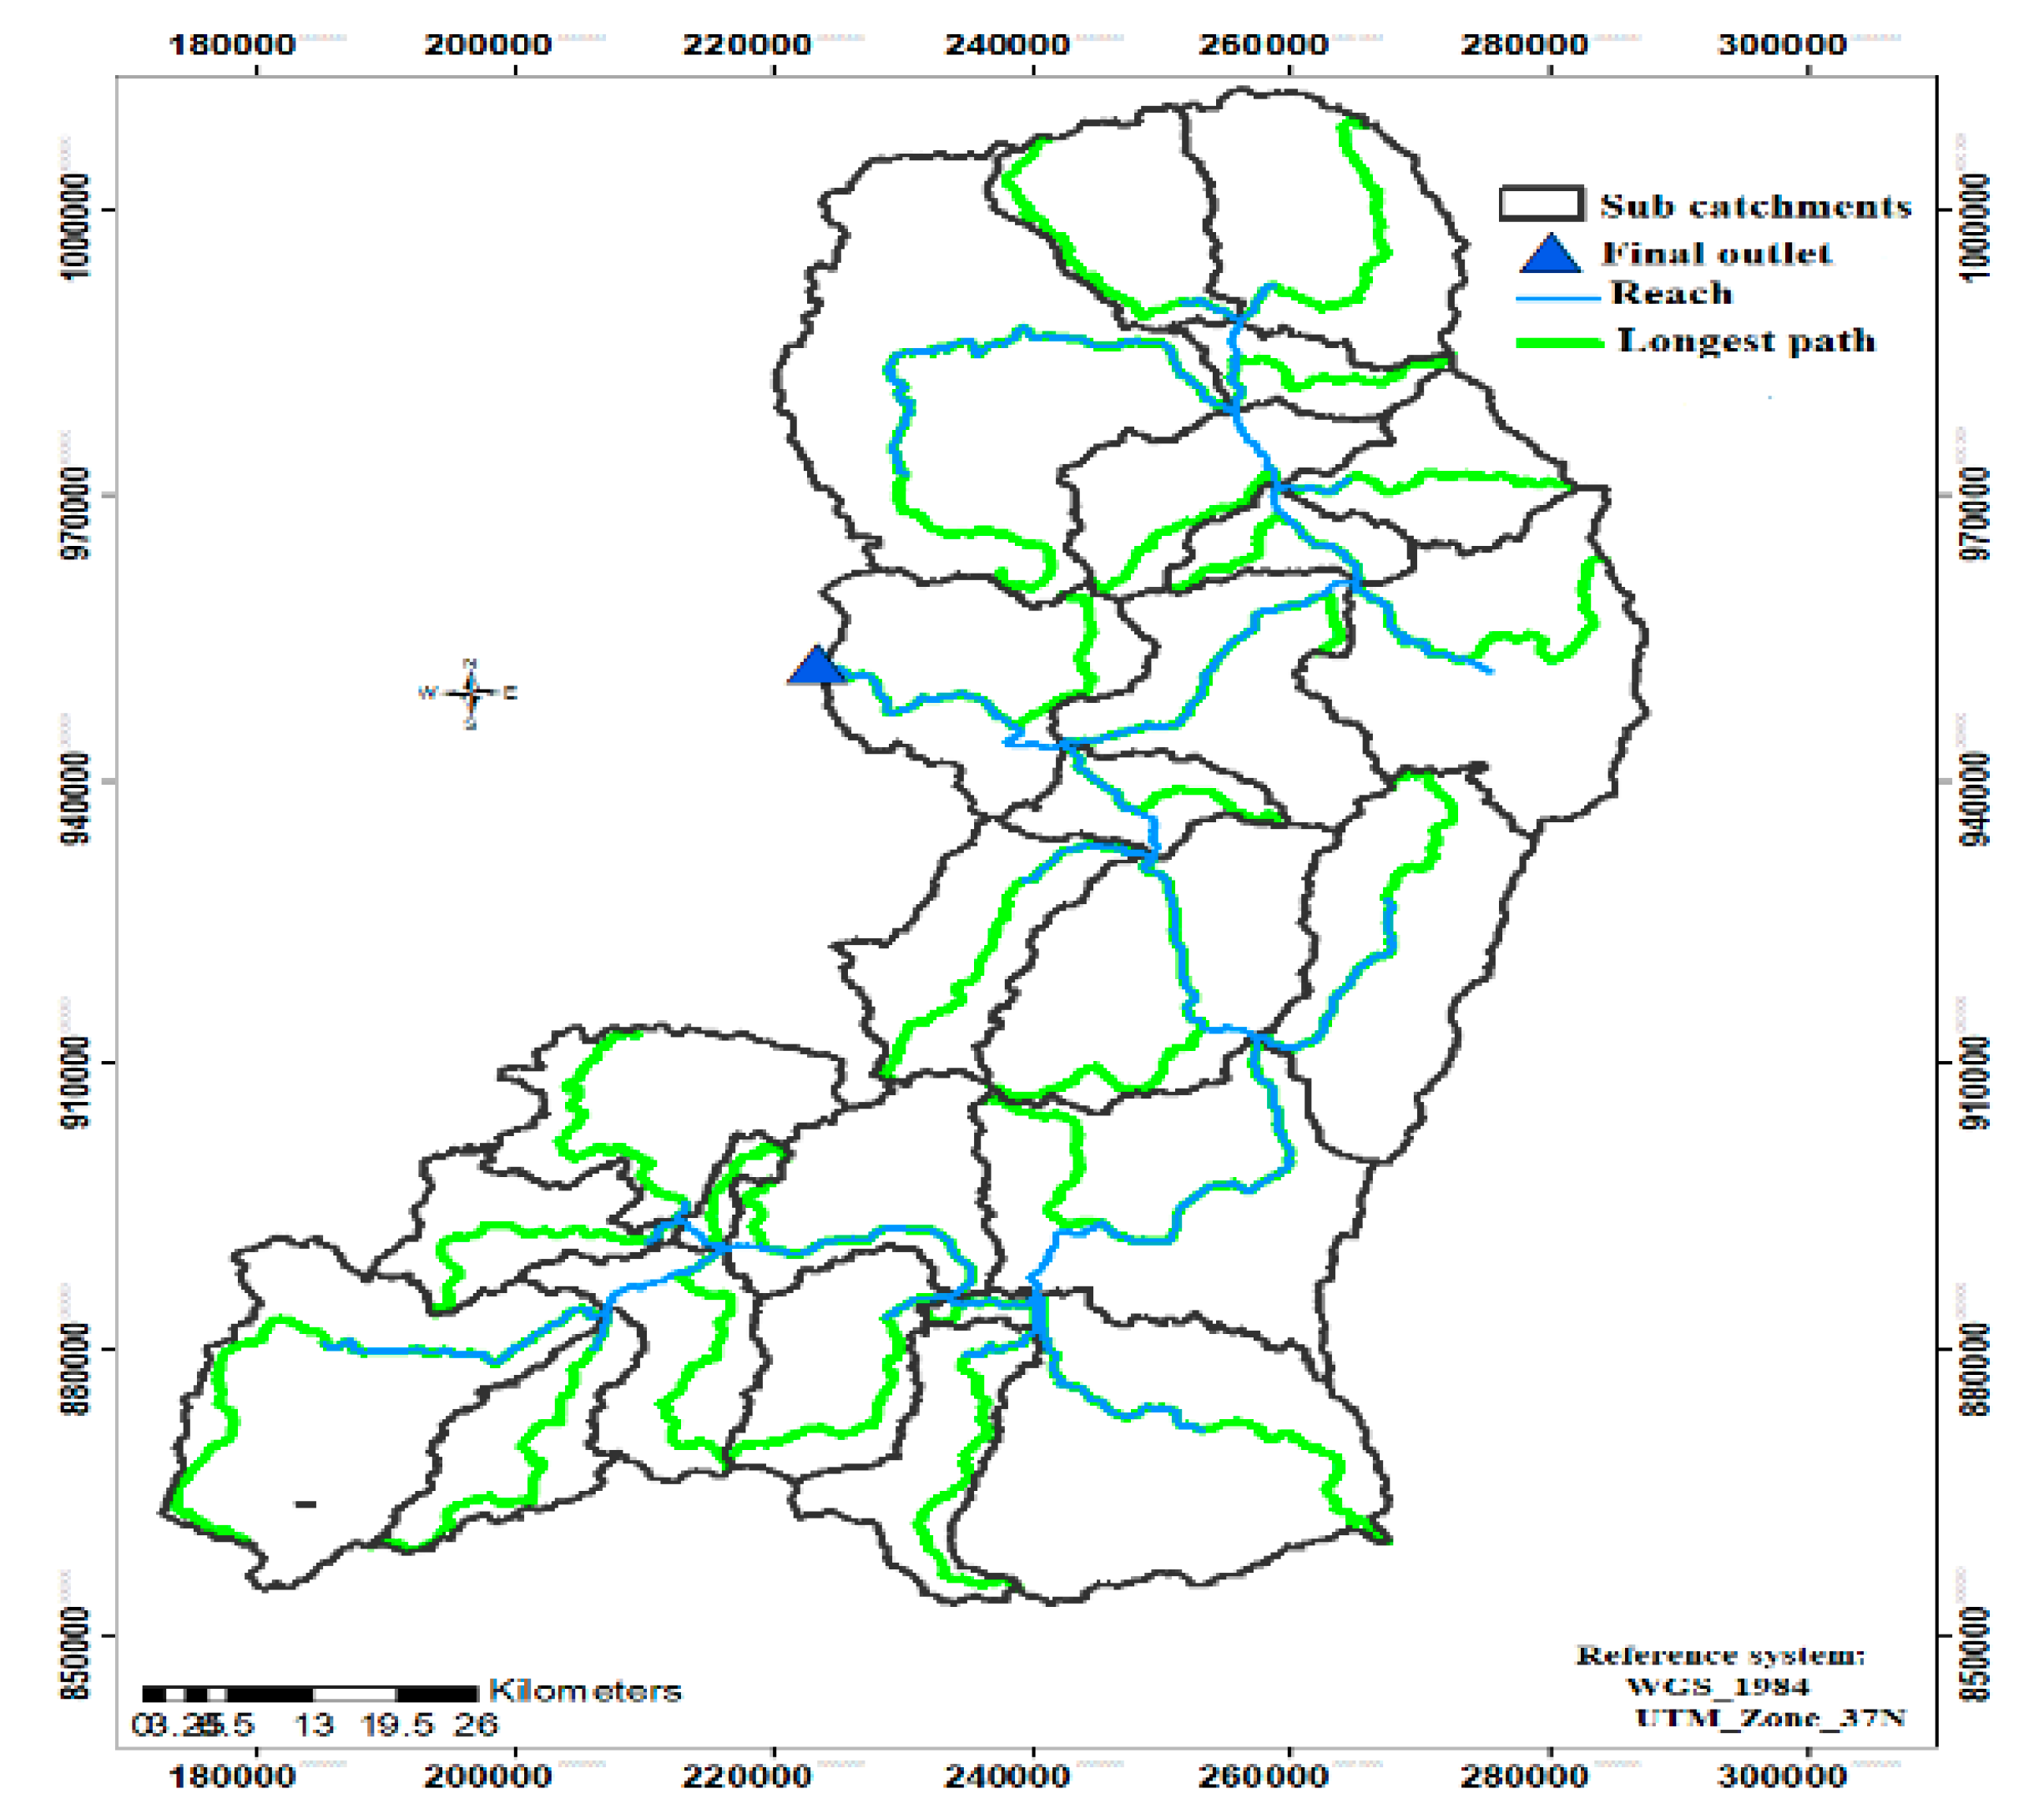
3.2. Watershed Delineation
3.3. Hydrologic Response Units (HRU) Analysis
3.4. Parameter Sensitivity Analysis
3.5. Model Calibration and Validation
3.6. Model Performance Evaluation
4. Results and Discussions
4.1. Identified Sensitive Parameters for River Flow
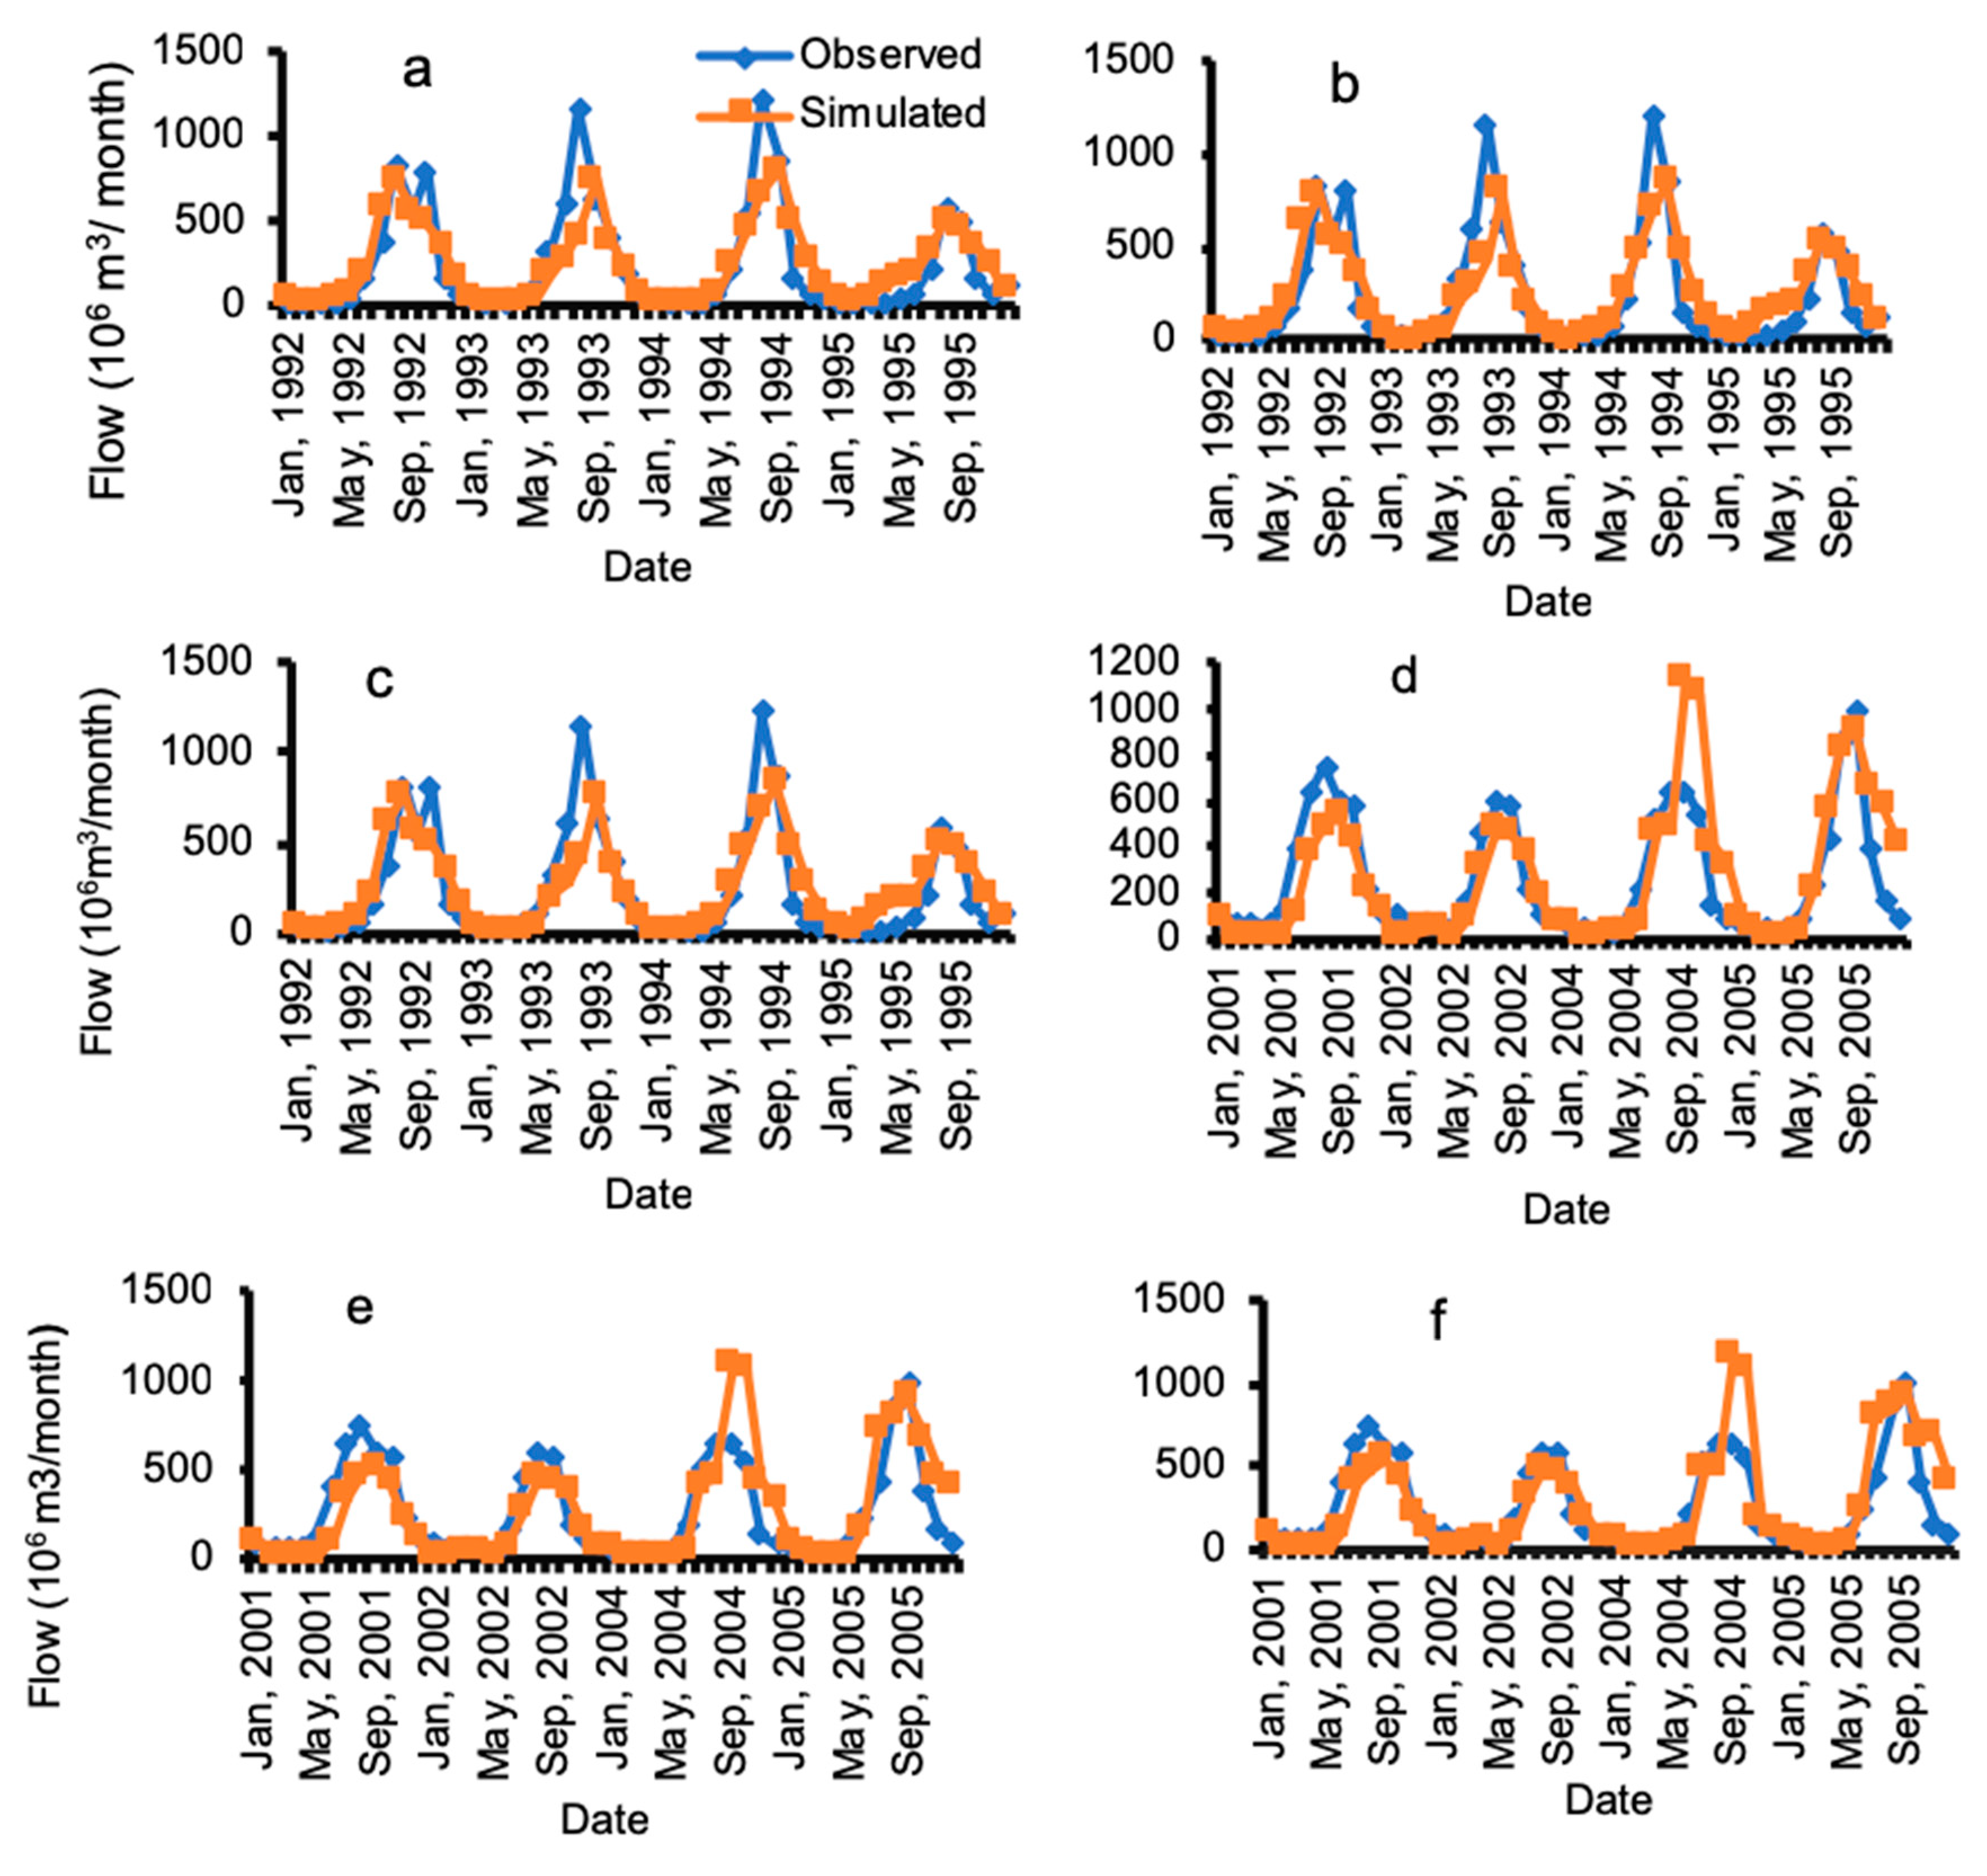
4.2. Model Calibration and Validation for Discharge
4.3. Model Performance Evaluation
4.4. Sensitive Parameters for Sediment Yield
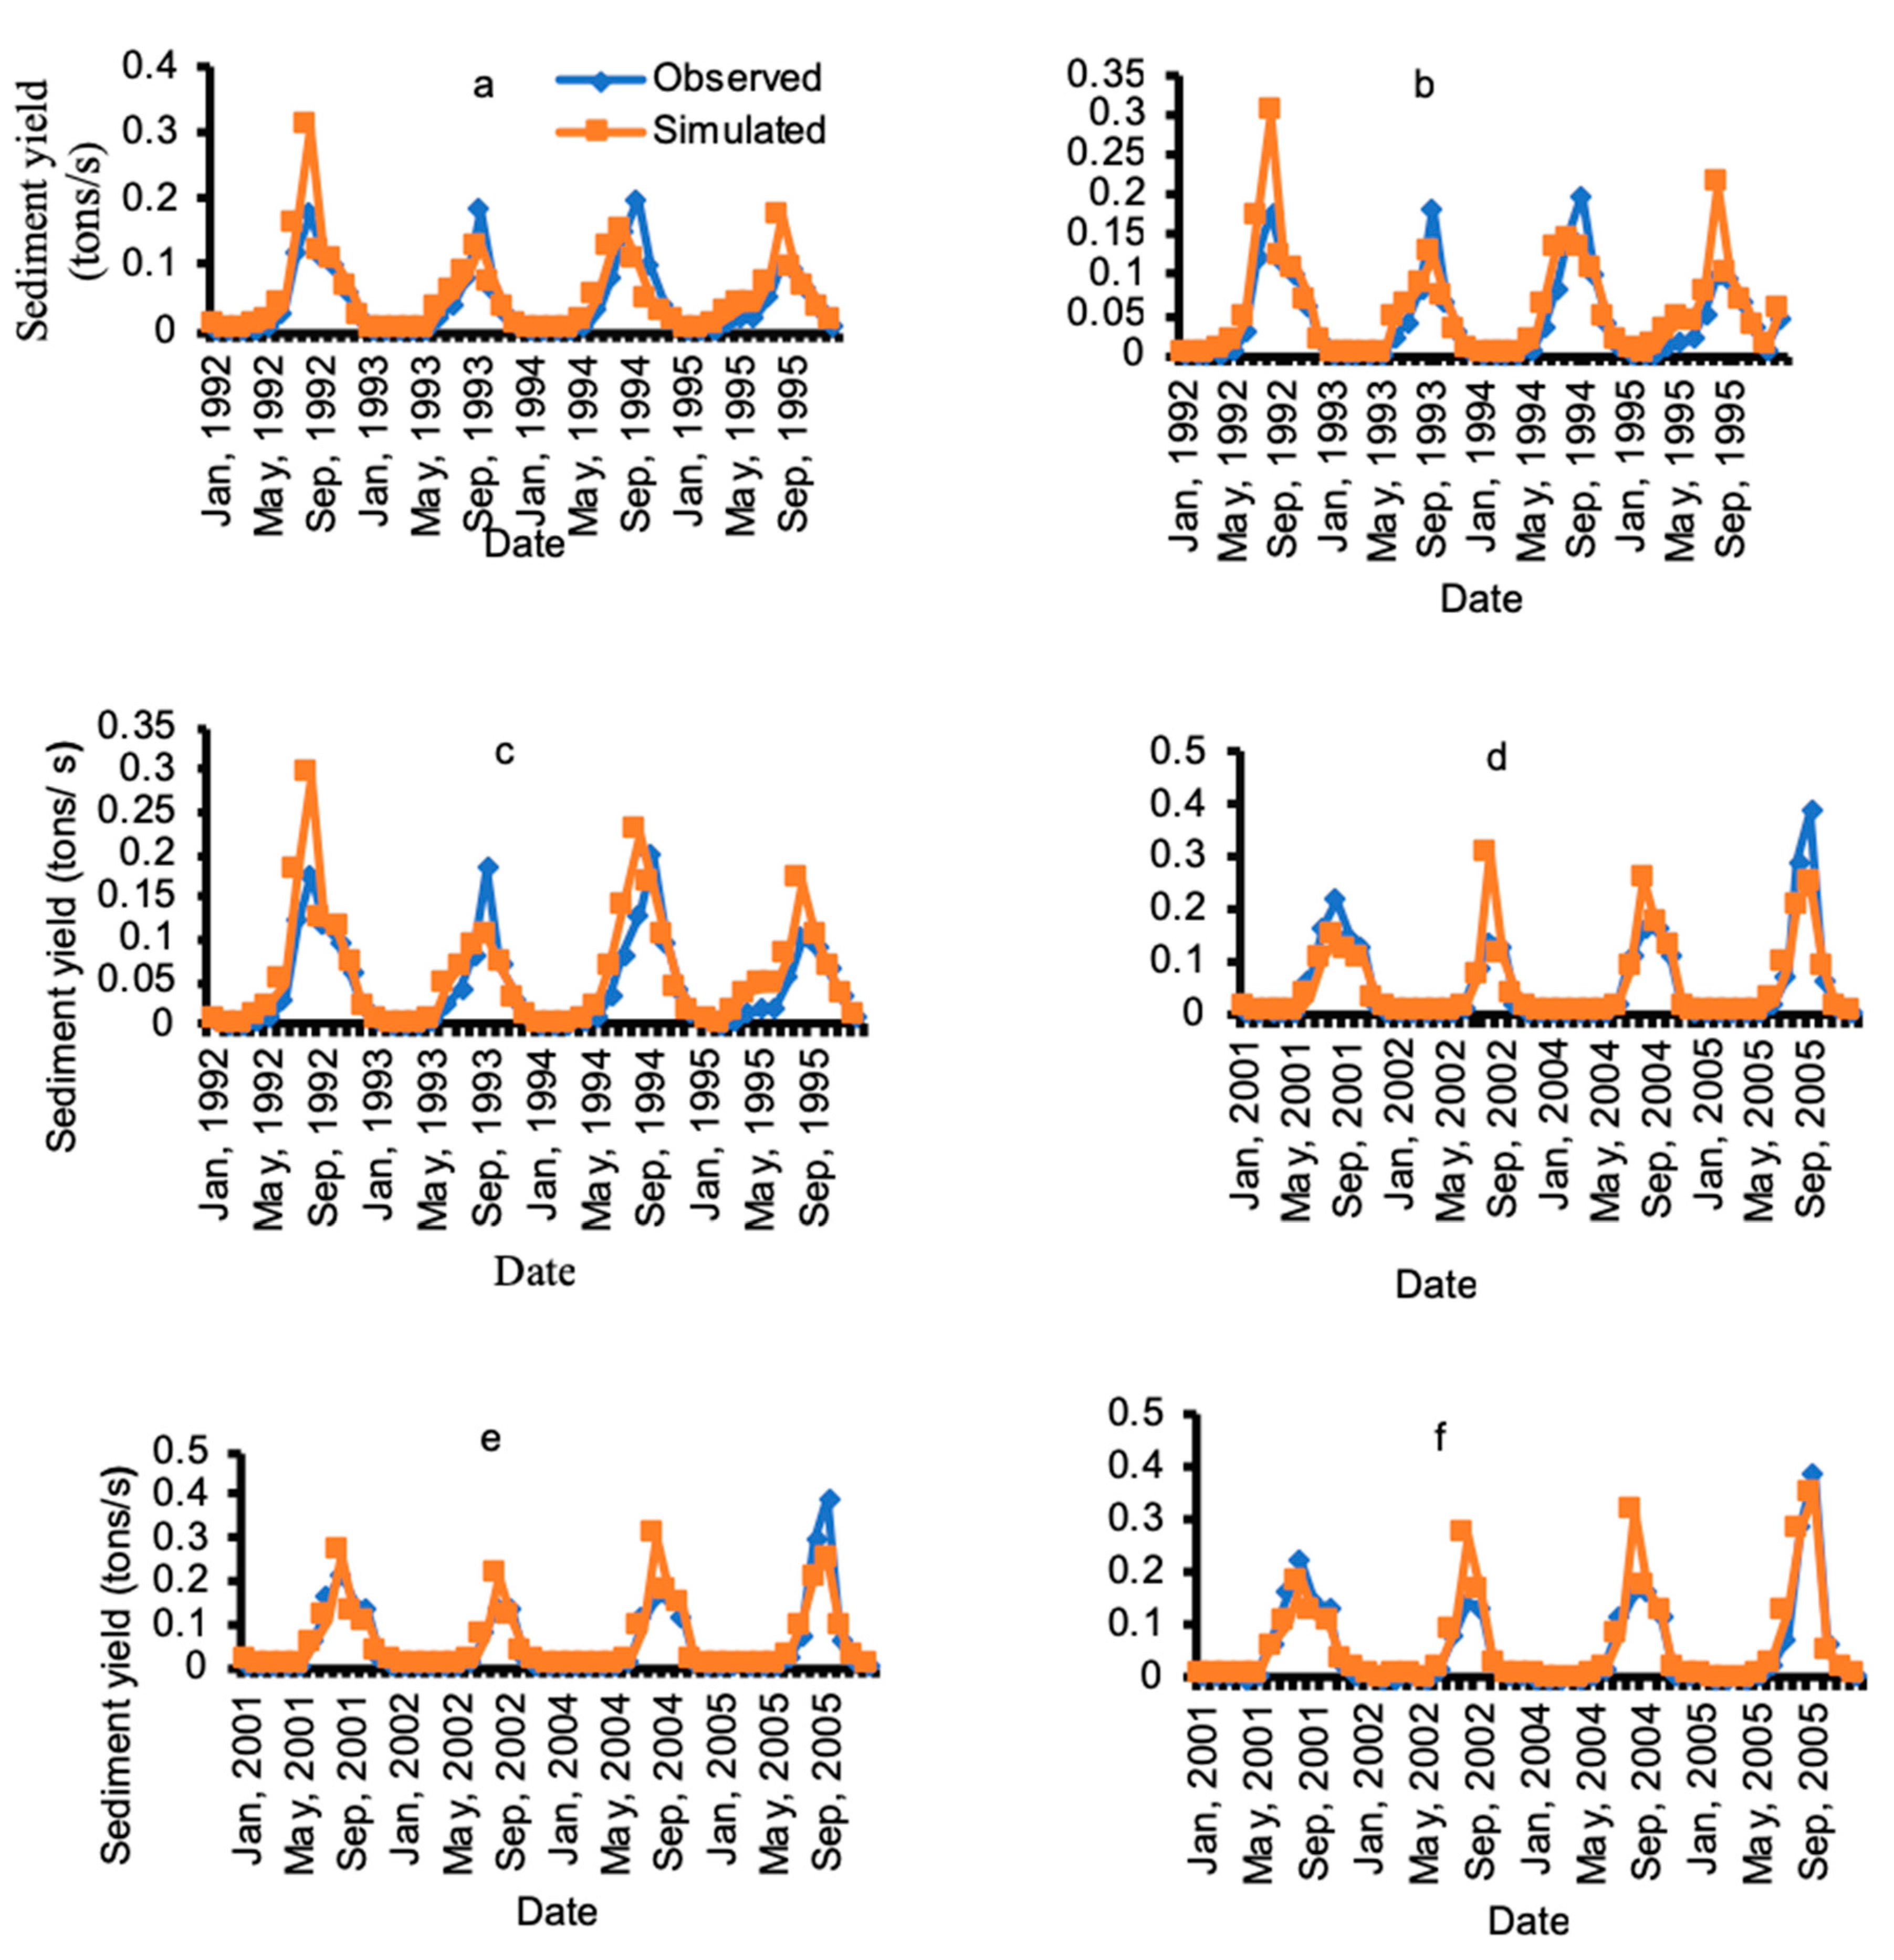
4.5. Model Calibration and Validation for Soil Loss
4.6. Added Effect of Future Climate on River Flow and Soil Loss
4.7. Erosion-Prone Priority Sub-Catchments
5. Conclusions
Author Contributions
Funding
Acknowledgments
Conflicts of Interest
References
- Schulze, R.E. Hydrological responses to land use and climate change: A southern African perspective. Ambio 2000, 29, 12–22. [Google Scholar] [CrossRef]
- Fohrer, N.; Haverkamp, S.; Eckhardt, K.; Frede, H.G. Hydrologic response to land use changes on the catchment scale. Physics and chemistry of the earth. Part B: Hydrology. Oceans Atmos. 2001, 26, 577–582. [Google Scholar]
- Sahin, V.; Hall, M.J. The effects of afforestation and deforestation on water yields. J. Hydrol. 1996, 178, 293–309. [Google Scholar] [CrossRef] [Green Version]
- Kassa, T. Watershed Hydrological Responses to Changes in Land Use and Land Cover, and Management Practices at Hare Watershed, Ethiopia. Doctoral Dissertation, University of Siegen, Research Institute for water and Environment, Siegen, Germany, 2009. [Google Scholar]
- Kidane, W.; Bogale, G. Effect of land use land cover dynamics on hydrological response of watershed: Case study of Tekeze Dam watershed, northern Ethiopia. Int. Soil Water Conserv. Res. 2017, 5, 1–16. [Google Scholar]
- Kassa, T.; Gerd, F. Impacts of Land use/cover dynamics on stream flow: The case of Hare watershed, Ethiopia. In Proceedings of the 4th International SWAT2005, Delft, The Netherlands, 4–6 July 2007. [Google Scholar]
- Hurni, H.; Tato, K.; Zeleke, G. The implications of changes in population, land use, and land management for surface runoff in the upper Nile Basin Area of Ethiopia. Mt. Res. Dev. 2005, 25, 147–154. [Google Scholar] [CrossRef]
- Moges, A.; Holden, N.M. Land cover change and gully development between 1965 and 2000 in Umbulo Catchment, Ethiopia. Mt. Res. Dev. 2009, 29, 265–276. [Google Scholar] [CrossRef]
- FAO. Ethiopian Highland Reclamation Study (EHRS); Final Report; FAO: Rome, Italy, 1984; Volume 1, pp. 37–46. [Google Scholar]
- SCRP (Soil Conservation Research Programme). Soil Conservation Research Project Database Report 1982–1993; Ministry of Agriculture and University of Berne, Series Report III; Hundelafto Research Unit, Institute of Geography, University of Berne: Bern, Switzerland, 1996. [Google Scholar]
- Bewket, W. Land Degradation and Farmers’ Acceptance and Adoption of Soil Conservation Technologies in the Dingil Watershed, Northwestern Highlands, Ethiopia. Addis Ababa (Social Science Research Report) Series No. 29. 2003. Available online: http://library.wur.nl/WebQuery/wurpubs/326000 (accessed on 26 December 2018).
- Gizachew, A.; Yihenew, G. Soil loss estimation for soil conservation planning using geographic information system in Guang watershed, Blue Nile basin. J. Environ. Earth Sci. 2015, 5. ISSN 2225-0948. [Google Scholar]
- Adugna, A.; Abegaz, A.; Cerdà, A. Soil erosion assessment and control in Northeast Wollega, Ethiopia. Solid Earth Discus. 2015, 7, 3511–3540. [Google Scholar] [CrossRef]
- Habtamu and Amare. Soil loss estimation using GIS and Remote sensing techniques: A case in Koga watershed, Northwestern Ethiopia. Int. Soil Water Conserv. Res. 2016, 4, 126–136. [Google Scholar] [CrossRef]
- Melaku, S. Effect of land use land cover changes on the forest resources of Ethiopia. Int. J. Nat. Resour. Ecol. Manag. 2016, 1, 51–57. [Google Scholar]
- Tamene, L.; Vlek, P.L.G. Analysis of factors determining sediment yield variability in the highlands of Northern Ethiopia. Geomorphology 2006, 76, 76–91. [Google Scholar] [CrossRef]
- Gissila, T.; Black, E.; Grimes, D.I.F.; Slingo, J.M. Seasonal forecasting of the Ethiopian Summer rains. Int. J. Clim. 2004, 24, 1345–1358. [Google Scholar] [CrossRef]
- NMA (National Meteorological Agency). Climate Change National Adaptation Program of Action of Ethiopia; Ministry of Water Resources: Addis Ababa, Ethiopia, 2007.
- IPCC (Intergovernmental Panel on Climate Change). Climate Change 2007: Impacts, Adaptation, and Vulnerability; Contribution of Working Group II to the Third Assessment report of the Intergovernmental Panel on Climate Change; Parry, M.L., Canziani, O.F., Canziani, J.P., van der Linden, P.J., Hanson, C.E., Eds.; Cambridge University Press: Cambridge, UK, 2007. [Google Scholar]
- Barnett, T.P.; Adam, J.C.; Lettenmaier, D.P. Potential impacts of a warming climate on water availability in snow dominated regions. Nature 2005, 438, 303–309. [Google Scholar] [CrossRef]
- Zeray, L.; Roehrig, J.; Chekol, D.A. Climate change impact on Lake Ziway watershed water availability, Ethiopia. FWU. Water Resour. Publ. 2007, 6, 18–23. [Google Scholar]
- Haileyesus, B. Evaluation of Climate Change Impacts on Hydrology on Selected Catchments of Abbay Basin. Master of Science Thesis, Addis Ababa University, Addis Ababa, Ethiopia, 2011. [Google Scholar]
- Arnold, J.G.; Srinivasan, R.; Muttiah, R.S.; Williams, J.R. Large area hydrologic modeling and assessment part I: Model development. J. Am. Water Resour. Assoc. 1998, 34, 73–89. [Google Scholar] [CrossRef]
- Gassman, P.W.; Reyes, M.R.; Green, C.H.; Arnold, J.G. The Soil and Water Assessment Tool: Historical Development, Applications, and Future Research Directions. Trans. Am. Soc. Agric. Boil. Eng. 2007, 50, 1211–1250. [Google Scholar] [CrossRef] [Green Version]
- Sima, B. Flow Regime and Land Cover Changes in the Didessa Sub-Basin of the Blue Nile River, South-Western Ethiopia: Combining Empirical Analysis and Community Perception. Second Cycle, A2E; SLU, Department of Environmental Assessment: Uppsala, Sweden, 2011. [Google Scholar]
- CSA (Centeral Statistical Agency). Summary and Statistical Report of the 2007 Population and Housing Census: Population Size by Age and Sex; Federal Democratic Republic of Ethiopia Population Census Commission: Addis Ababa, Ethiopia, 2008.
- Tadesse, A.; Tsegaye, A. Geology and Tectonic Evolution of the Pan-African Tulu Dimtu Belt, Western Ethiopia, Geologic Survey of Ethiopia. Online J. Earth Sci. 2007, 1, 24–42. [Google Scholar]
- Stern, R.; Rijks, D.; Dale, I.; Knock, J. Instat Climatic Guide; Statistical Services Centre, The University of Reading: Reading, UK, 2006. [Google Scholar]
- FAO (Food and Agricultural Organization). Major Soils of the World Land and Water Digital Media Series; CD-ROM; Food and Agricultural Organization of the United Nations: Rome, Italy, 2002. [Google Scholar]
- Neitsch, S.L.; Arnold, J.G.; Kiniry, J.R.; Srinivasan, R.; Williams, J.R. Soil and Water Assessment Tool, Theoretical Documentation: Version 2005; USDA Agricultural Research Service and Texas A&M Blackland Research Center: Temple, TX, USA, 2005. [Google Scholar]
- Arnold, J.G.; Fohrer, N. SWAT2000: Current capabilities and research opportunities in applied watershed modeling. Hydrol. Proc. 2005, 19, 563–572. [Google Scholar] [CrossRef]
- Williams, J.R.; Berndt, H.D. Sediment yield prediction based on watershed hydrology. Trans. Am. Soc. Agric. Eng. 1977, 20, 1100–1104. [Google Scholar] [CrossRef]
- Van Griensven, A.; Meixner, T.; Grunwald, S.; Bishop, T.; Diluzio, M.; Srinivasan, R. A global sensitivity analysis tool for the parameters of multi-variable catchment models. J. Hydrol. 2006, 324, 10–23. [Google Scholar] [CrossRef]
- Abbaspour, K.C.; Yang, J.; Maximov, I.; Siber, R.; Bogner, K.; Mieleitner, J.; Zobrist, J.; Srinivasan, R. Spatially distributed modelling hydrology and water quality in the Pre-Alpine/Alpine Thur watershed using SWAT. J. Hydrol. 2007, 333, 413–430. [Google Scholar] [CrossRef]
- Santhi, C.; Arnold, J.G.; Williams, J.R.; Dugas, W.A.; Srinivasan, R.; Hauck, L.M. Validation of the SWAT model on a large river basin with point and nonpoint sources. J. Am. Water Resour. Assoc. 2001, 37, 1169–1188. [Google Scholar] [CrossRef]
- Gupta, H.V.; Sorooshian, S.; Yapo, P.O. Status of automatic calibration for hydrologic models: Comparison with multilevel expert calibration. J. Hydrol. Eng. 1999, 4, 135–143. [Google Scholar] [CrossRef]
- Shimelis, G.S.; Ragahavan, S.; Bijan, D. Hydrological Modelling in the Lake Tana Basin, Ethiopia Using SWAT Model. Open Hydrol. J. 2008, 2, 49–62. [Google Scholar]
- Tesfaye, G.; Minichil, J. Sediment yield modeling of Didessa sub basin, Abay basin, Southwestern Ethiopia. J. Environ. Earth Sci. 2016, 6, 120–127. [Google Scholar]
- Abdi, B.A.; Desalegn, C.E.; Ekasit, K. Simulation of sediment yield using SWAT model in Fincha Watershed, Ethiopia. Kasetsart J. Nat. Sci. 2012, 46, 283–297. [Google Scholar]
- Lu, Z.; Zou, S.; Qin, Z.; Yang, Y.; Xiao, H.; Wei, Y.; Zhang, K.; Xie, J. Hydrologic Responses to Land Use Change in the Loess Plateau: Case Study in the Upper Fenhe River Watershed. Adv. Meteorol. 2015, 2015, 10. [Google Scholar] [CrossRef]
- Quintero, F.; Mantilla, R.; Anderson, C.; Claman, D.; Krajewski, W. Assessment of changes in flood frequency due to the effects of climate change: Implications for engineering design. Hydrology 2018, 5, 19. [Google Scholar] [CrossRef]
- Githui, F.; Gitau, W.; Mutuab, F.; Bauwensa, W. Climate change impact on SWAT simulated stream flow in western Kenya. Int. J. Clim. 2009, 29, 1823–1834. [Google Scholar] [CrossRef]
- Babur, M.; Babel, M.S.; Shrestha, S.; Kawasaki, A.; Tripathi, N.K. Assessment of Climate Change Impact on Reservoir Inflows Using Multi Climate-Models under RCPs: The Case of Mangla Dam in Pakistan. Water 2016, 8, 389. [Google Scholar] [CrossRef]


| Stations | Latitude | Longitude | Altitude (m) |
|---|---|---|---|
| Arjo | 8°51′36″ | 36°31′12″ | 2469 |
| Bedele | 8°16′12″ | 36°12′0″ | 2030 |
| Dembi | 8°2′24″ | 36°16′12″ | 1950 |
| Nekemte | 9°13′48″ | 36°38′24″ | 2124 |
| Sire | 9°7′48″ | 36°12′36″ | 1826 |
| Parameters | 1986 LULC | 2001 LULC | 2015 LULC | ||||||
|---|---|---|---|---|---|---|---|---|---|
| RS | Rank | Class | RS | Rank | Class | RS | Rank | Class | |
| Cn2 | 0.582 | 1 | high | 0.672 | 1 | high | 0.764 | 1 | high |
| Esco | 0.546 | 2 | high | 0.605 | 2 | high | 0.646 | 2 | high |
| Sol_awc | 0.442 | 3 | high | 0.532 | 3 | high | 0.592 | 3 | high |
| Gwqmn | 0.382 | 4 | high | 0.452 | 4 | high | 0.497 | 4 | high |
| Alpha_bf | 0.321 | 5 | high | 0.371 | 5 | high | 0.112 | 7 | med |
| Sol_z | 0.116 | 6 | medium | 0.121 | 6 | medium | 0.374 | 5 | high |
| Revapmn | 0.112 | 7 | medium | 0.025 | 10 | small | 0.035 | 10 | small |
| Gw_revap | 0.054 | 8 | medium | 0.056 | 7 | medium | 0.104 | 8 | medium |
| Hru_slp | 0.042 | 9 | small | 0.053 | 8 | medium | 0.127 | 6 | medium |
| Gw_delay | 0.014 | 10 | small | 0.032 | 9 | small | 0.053 | 9 | medium |
| Rchrg_dp | 0.012 | 11 | small | 0.013 | 12 | small | 0.013 | 12 | small |
| Surlag | 0.011 | 12 | small | 0.015 | 11 | small | 0.015 | 11 | small |
| Parameter | 1986 LULC | 2001 LULC | 2015 LULC | |||||
|---|---|---|---|---|---|---|---|---|
| Range | Fitted | Parameter | Range | Fitted | Parameter | Range | Fitted | |
| Cn2 | 35–98 | 48.52 | Cn2 | 35–98 | 50.38 | Cn2 | 35–98 | 54.6 |
| Esco | 0–1 | 0.594 | Gwqmn | 0–5000 | 4454 | Esco | 0–1 | 0.74 |
| Sol_awc | 0–1 | 0.792 | Esco | 0–1 | 0.675 | Gwqmn | 0–5000 | 4465 |
| Gwqmn | 0–5000 | 4450 | Sol_awc | 0–1 | 0.836 | Sol_awc | 0–1 | 0.89 |
| Alpha_bf | 0–1 | 0.792 | Alpha_bf | 0–1 | 0.764 | Alpha_bf | 0–1 | 0.79 |
| Parameter | 1986 LULC | 2001 LULC | 2015 LULC | |||
|---|---|---|---|---|---|---|
| Calibration | Validation | Calibration | Validation | Calibration | Validation | |
| ENS | 0.7 | 0.5 | 0.7 | 0.5 | 0.7 | 0.5 |
| R2 | 0.8 | 0.8 | 0.8 | 0.8 | 0.8 | 0.8 |
| PBIAS | −3.7 | −0.4 | 0.01 | −1.5 | −0.6 | −2.8 |
| Observed | 244.9 | 263.2 | 244.9 | 263.2 | 244.9 | 263.2 |
| Simulated | 236.3 | 264.4 | 241.1 | 267.3 | 246.2 | 270.5 |
| Parameters | 1986 LULC | 2001 LULC | 2015 LULC | ||||||
|---|---|---|---|---|---|---|---|---|---|
| RS | Rank | Class | RS | Rank | Class | RS | Rank | Class | |
| USLE_P | 0.76 | 1 | high | 0.84 | 1 | high | 0.90 | 1 | high |
| Spcon | 0.61 | 2 | high | 0.62 | 2 | high | 0.63 | 2 | high |
| Slope | 0.53 | 3 | high | 0.52 | 3 | high | 0.54 | 3 | high |
| Spexp | 0.32 | 4 | high | 0.32 | 4 | high | 0.34 | 4 | high |
| Sol_Awc | 0.14 | 5 | medium | 0.14 | 5 | medium | 0.14 | 5 | medium |
| Sol_K | 0.01 | 7 | small | 0.03 | 7 | small | 0.02 | 8 | small |
| USLE_C | 0.01 | 8 | small | 0.02 | 8 | small | 0.03 | 7 | small |
| Biomix | 0.05 | 6 | medium | 0.06 | 6 | medium | 0.05 | 6 | medium |
| Parameters | 1986 LULC | 2001 LULC | 2015 LULC | |||
|---|---|---|---|---|---|---|
| Range | Fitted Value | Range | Fitted Value | Range | Fitted Value | |
| USLE_P | 0–1 | 0.65 | 0–1 | 0.69 | 0–1 | 0.7 |
| Spcon | 0.0001–0.01 | 0.0074 | 0.0001–0.01 | 0.0079 | 0.0001–0.01 | 0.0081 |
| Slope | 0–1 | 1.05 | 0–1 | 1.045 | 0–1 | 1.04 |
| Spexp | 1–2 | 2.41 | 1–2 | 2.05 | 1–2 | 2.08 |
| Parameters | Calibration | Validation | ||||
|---|---|---|---|---|---|---|
| 1986 LULC | 2001 LULC | 2015 LULC | 1986 LULC | 2001 LULC | 2015 LULC | |
| ENS | 0.68 | 0.67 | 0.6 | 0.73 | 0.71 | 0.67 |
| R2 | 0.87 | 0.89 | 0.89 | 0.85 | 0.84 | 0.83 |
| PBIAS | −4.46 | −5.43 | −7.51 | −0.03 | −2.03 | −6.01 |
| Observed average | 0.044 | 0.044 | 0.044 | 0.051 | 0.051 | 0.051 |
| Simulated average | 0.05 | 0.055 | 0.06 | 0.053 | 0.056 | 0.058 |
| Model Inputs | Average Monthly Flow (m3/s) | Average Sediment Yield (ton/month) |
|---|---|---|
| 1986 LULC | 263.519 | 192,370 |
| 2001 LULC | 268.406 | 193,941 |
| 2015 LULC | 274.118 | 195,466 |
| RCP2.6 (2021 to 2045) | 287.896 | 2,149,784 |
| RCP2.6 (2046 to 2070) | 281.463 | 2,138,041 |
| RCP2.6 (2071 to 2095) | 263.162 | 1,949,804 |
| RCP4.5 (2021 to 2045) | 339.217 | 2,746,660 |
| RCP4.5 (2046 to 2070) | 340.495 | 2,722,949 |
| RCP4.5 (2071 to 2095) | 316.520 | 2,475,240 |
| RCP8.5 (2021 to 2045) | 319.786 | 2,497,640 |
| RCP8.5 (2046 to 2070) | 332.0478 | 2,680,347 |
| RCP8.5 (2071 to 2095) | 347.8888 | 2,931,043 |
| Catchment | Area (ha) | Soil Loss (t ha−1 yr−1) | Priority Order Based on 2015 LULC | ||
|---|---|---|---|---|---|
| 1986 LULC | 2001 LULC | 2015 LULC | |||
| 1 | 30,052.2 | 43.4 | 57.9 | 62.8 | 1 |
| 2 | 47,427.1 | 30.2 | 42.8 | 39.9 | 19 |
| 3 | 12,970.5 | 11.2 | 34.2 | 51.3 | 9 |
| 4 | 103,767.6 | 45.6 | 54.7 | 62.0 | 2 |
| 5 | 26,998.7 | 32.9 | 52.0 | 61.7 | 3 |
| 6 | 23,887.1 | 20.7 | 45.2 | 51.2 | 10 |
| 7 | 12,854.6 | 14.3 | 28.1 | 47.8 | 12 |
| 8 | 62,564.2 | 37.5 | 35.0 | 35.2 | 22 |
| 9 | 42,130.1 | 19.7 | 23.9 | 39.6 | 20 |
| 10 | 45,051.8 | 18.7 | 28.8 | 51.7 | 8 |
| 11 | 155,66.6 | 11.3 | 12.9 | 34.7 | 24 |
| 12 | 31,529.7 | 30.2 | 41.2 | 53.2 | 7 |
| 13 | 59,221.7 | 26.7 | 29.6 | 60.9 | 4 |
| 14 | 53,713.7 | 42.3 | 48.7 | 54.9 | 6 |
| 15 | 37,301.8 | 18.8 | 29.4 | 34.9 | 23 |
| 16 | 22,202.9 | 12.2 | 20.9 | 38.0 | 21 |
| 17 | 4773.4 | 20.3 | 32.5 | 46.1 | 14 |
| 18 | 71,506.3 | 20.3 | 37.6 | 29.3 | 26 |
| 19 | 98.7 | 9.7 | 15.7 | 41.0 | 18 |
| 20 | 35,220.8 | 28.4 | 40.8 | 44.3 | 15 |
| 21 | 2705.4 | 11.9 | 15.6 | 43.6 | 16 |
| 22 | 28,125.9 | 32.5 | 33.7 | 57.7 | 5 |
| 23 | 29,601.2 | 44.3 | 43.7 | 42.1 | 17 |
| 24 | 23,676.0 | 1.3 | 18.0 | 32.3 | 25 |
| 25 | 25,486.7 | 21.8 | 27.1 | 47.6 | 13 |
| 26 | 69,494.0 | 31.7 | 45.4 | 48.9 | 11 |
| 27 | 80,171.1 | 32.1 | 34.1 | 22.4 | 27 |
| Average | 24.8 | 34.4 | 45.7 | ||
| Catchment | 2015LULC & HC | 2015 LULC & RCP2.6 | 2015LULC & RCP4.5 | 2015LULC & RCP8.5 | ||||
|---|---|---|---|---|---|---|---|---|
| Soil Loss (t ha−1 yr−1) | Rank | Soil Loss (t ha−1 yr−1) | Rank | Soil Loss (t ha−1 yr−1) | Rank | Soil Loss (t ha−1 yr−1) | Rank | |
| 1 | 62.8 | 1 | 106.5 | 1 | 134.2 | 1 | 176.1 | 1 |
| 2 | 39.9 | 19 | 83.4 | 11 | 111.3 | 6 | 157.2 | 5 |
| 3 | 51.3 | 9 | 96.7 | 5 | 124.3 | 3 | 163.9 | 4 |
| 4 | 62.0 | 2 | 102.7 | 2 | 132.4 | 2 | 178.2 | 2 |
| 5 | 61.7 | 3 | 98.9 | 3 | 126.1 | 4 | 170.1 | 3 |
| 6 | 51.2 | 10 | 86.9 | 9 | 111.1 | 8 | 151.5 | 7 |
| 7 | 47.8 | 12 | 88.2 | 7 | 109.8 | 9 | 152.2 | 6 |
| 8 | 35.2 | 22 | 70.9 | 17 | 95.3 | 14 | 131.5 | 13 |
| 9 | 39.6 | 20 | 76.4 | 14 | 99.2 | 12 | 136.6 | 12 |
| 10 | 51.7 | 8 | 89.1 | 6 | 111.2 | 7 | 143.5 | 10 |
| 11 | 34.7 | 24 | 69.8 | 19 | 89.3 | 16 | 121.9 | 15 |
| 12 | 53.2 | 7 | 87.7 | 8 | 106.0 | 10 | 141.4 | 11 |
| 13 | 60.9 | 4 | 96.9 | 4 | 116.1 | 5 | 147.0 | 8 |
| 14 | 54.9 | 6 | 83.8 | 10 | 105.4 | 11 | 144.6 | 9 |
| 15 | 34.9 | 23 | 65.3 | 24 | 84.5 | 21 | 113.5 | 19 |
| 16 | 38.0 | 21 | 70.1 | 18 | 88.0 | 17 | 117.0 | 18 |
| 17 | 46.1 | 14 | 78.6 | 13 | 97.3 | 13 | 124.8 | 14 |
| 18 | 29.3 | 26 | 58.7 | 25 | 76.7 | 25 | 106.7 | 23 |
| 19 | 41.0 | 18 | 67.3 | 21 | 86.5 | 20 | 118.7 | 17 |
| 20 | 44.3 | 15 | 72.7 | 15 | 87.2 | 18 | 112.1 | 21 |
| 21 | 43.6 | 16 | 71.3 | 16 | 86.7 | 19 | 112.3 | 20 |
| 22 | 57.7 | 5 | 79.3 | 12 | 93.9 | 15 | 121.0 | 16 |
| 23 | 42.1 | 17 | 63.3 | 23 | 80.3 | 22 | 108.4 | 22 |
| 24 | 32.3 | 25 | 49.8 | 26 | 62.4 | 26 | 85.8 | 26 |
| 25 | 47.6 | 13 | 67.1 | 22 | 77.8 | 24 | 98.4 | 25 |
| 26 | 48.9 | 11 | 67.6 | 20 | 78.5 | 23 | 101.7 | 24 |
| 27 | 22.4 | 27 | 32.1 | 27 | 39.5 | 27 | 53.15 | 27 |
| Average | 45.7 | 77.1 | 96.7 | 129.2 | ||||
| Soil Loss (t ha−1 yr−1) | Soil Loss Severity | 1986 LULC | 2001 LULC | 2015 LULC | 2015 LULC & RCP2.6 | 2015 LULC & RCP4.5 | 2015 LULC & RCP8.5 |
|---|---|---|---|---|---|---|---|
| 0–20 | None to slight | 21.5 | 4.2 | 0.0 | 0.0 | 0.0 | 0.0 |
| 20–50 | Moderate | 78.5 | 79.7 | 58.4 | 10.4 | 8.0 | 0.0 |
| 50–100 | Moderately high | 0.0 | 16.1 | 41.6 | 76.2 | 44.8 | 12.9 |
| 100–200 | High | 0.0 | 0.0 | 0.0 | 13.4 | 47.1 | 87.0 |
| >200 | Very high | 0.0 | 0.0 | 0.0 | 0.0 | 0.0 | 0.0 |
© 2018 by the authors. Licensee MDPI, Basel, Switzerland. This article is an open access article distributed under the terms and conditions of the Creative Commons Attribution (CC BY) license (http://creativecommons.org/licenses/by/4.0/).
Share and Cite
Chimdessa, K.; Quraishi, S.; Kebede, A.; Alamirew, T. Effect of Land Use Land Cover and Climate Change on River Flow and Soil Loss in Didessa River Basin, South West Blue Nile, Ethiopia. Hydrology 2019, 6, 2. https://doi.org/10.3390/hydrology6010002
Chimdessa K, Quraishi S, Kebede A, Alamirew T. Effect of Land Use Land Cover and Climate Change on River Flow and Soil Loss in Didessa River Basin, South West Blue Nile, Ethiopia. Hydrology. 2019; 6(1):2. https://doi.org/10.3390/hydrology6010002
Chicago/Turabian StyleChimdessa, Kinati, Shoeb Quraishi, Asfaw Kebede, and Tena Alamirew. 2019. "Effect of Land Use Land Cover and Climate Change on River Flow and Soil Loss in Didessa River Basin, South West Blue Nile, Ethiopia" Hydrology 6, no. 1: 2. https://doi.org/10.3390/hydrology6010002