Modeling the Potential of Submarine Groundwater Discharge to Facilitate Growth of Vibrio cholerae Bacteria


1
Faculty of Geosciences, Universität Bremen, Bibliothekstraße 1, 28359 Bremen, Germany
2
Leibniz Center for Tropical Marine Research (ZMT), Fahrenheitstraße 6, 28359 Bremen, Germany
3
Helmholtz Centre for Environmental Research–UFZ, Department Environmental Informatics, Permoserstrasse 15, 04318 Leipzig, Germany
4
Faculty of Environmental Sciences, Department of Hydrosciences, Institute for Groundwater Management, Professorship Contaminant Hydrology, Technische Universität Dresden, Bergstrasse 66, 01069 Dresden, Germany
5
Institute of Geosciences, Kiel University (CAU), Ludewig-Meyn-Strasse 10, 24118 Kiel, Germany
*
Author to whom correspondence should be addressed.
Hydrology 2019, 6(2), 39; https://doi.org/10.3390/hydrology6020039
Submission received: 28 February 2019
/
Revised: 14 May 2019
/
Accepted: 16 May 2019
/
Published: 18 May 2019
(This article belongs to the Special Issue Submarine Groundwater Discharge and Its Effects)
Abstract
:Submarine groundwater discharge (SGD), the discharge of terrestrial groundwater to the ocean, can govern the coastal benthic environment. Bacteria such as Vibrio cholerae inhabit coastal waters and sediments, whose growth can be influenced by SGD. In particular, salinity changes introduced by SGD could have a positive effect on the abundance but also virulence of non-halophilic V. cholera bacteria dwelling in coastal waters and shallow marine sediments. Here we assess potential effects of SGD on the environmental properties that favor V. cholerae in a numerical modeling study representing multiple scenarios. Approaching natural systems, simulation results reveal a high sensitivity of non-halophilic Vibrio cholerae growth to SGD and its primary driving factors. This dependency leads to highest growth potential at high groundwater inflow and low hydraulic conductivity of the aquifer as well as for steep sea-side boundary slopes. Besides its minor impact on the extent of SGD in our model, dispersion is a crucial limiting factor for V. cholerae habitat. We conclude that there is a close connection between the driving factors of SGD and low salinity zones along a coastal slope, and recommend taking these into consideration for evaluating local V. cholerae outbreaks.
1. Introduction
Submarine groundwater discharge (SGD), here defined as terrestrial groundwater discharging directly to the coastal ocean (following [1,2]), may occur along coastal interfaces of permeable sediments. Significant amounts of SGD have been reported, such as from Florida [3] and Southern Brazil [4] (see [5] for a review on other available studies).
A seaward flow of fresh groundwater requires the hydraulic potential of the onshore aquifer to be above the sea level [6]. While groundwater flow in porous media is generally controlled by aquifer permeability and inflow and thus the hydraulic head [7,8,9,10,11] as well as dispersion effects [12,13], SGD is also influenced by drivers that are specific to the coastal situation, such as tides and waves [14].
Connections between SGD and algae blooms as well as marine biota were made in [15,16]. To assess the extent to which SGD can favor the growth of marine Vibrio bacteria, we focus on Vibrio cholerae, which finds ideal living conditions when salt concentrations reach values of <1% [17]. The native living environment of V. cholerae is often restricted to coastal marine areas and estuaries with constant nutrient supply and stable climate (temperature >18 °C) [18,19,20]; occurrence of non-halophilic Vibrio genera along SGD areas were recorded in a field study in Indonesia [21].
Vibrio cholerae bacteria have a high pathogenicity towards humans, causing cholera and consecutive symptoms such as muscle cramps, circulatory failure, and lethal dehydration due to severe watery diarrhea [17,22,23]. The leading causes of cholera infections are the consumption of raw or undercooked seafood and bathing in contaminated marine regions with open wounds [20,24,25], which is of growing concern regarding outbreaks due to increasing coastal population densities and marine fishing activities [26]. Latest outbreaks were documented in Ghana, Nigeria, and India [27,28,29], and particularly concern regions with poor water quality and sanitation.
Studies about Vibrio growth emphasize the significance of physiochemical parameters such as water temperature, salinity, and turbidity [17]. While SGD can alter these conditions, its effect on V. cholerae has not yet been researched. Regarding its potential effects on salinity [9,30,31,32], we present a theoretical modeling approach to provide a first theoretical framework for driving factors of the impact of SGD on V. cholerae. We assume that suitable salinity conditions at the groundwater-seawater interface create suitable habitats based on the assumption that other crucial life demands of V. cholerae, such as the abundance of phytoplankton and zooplankton, are met at SGD zones [33]. Salinities that we interpret as favorable for V. cholerae were reported from porous SGD sites in different field studies. In Eckernförde Bay [34] and along the French Mediterranean coastline close to the Nice Côte d’Azur airport [35], SGD reduced porewater salinity to levels below 1%.
2. Materials and Methods
Numerical modeling is widely used to investigate general hydrodynamic relations in coastal areas [12,36,37,38]. Here we run a series of models to understand the influence of SGD on V. cholerae. The models focus on the spatial distribution of salt concentration along the terrestrial–maritime interface by varying the considered controlling factors of SGD, such as groundwater inflow rates and hydraulic conductivity of an aquifer. In addition, dispersion effects as well as effects of changing the angle of the sea-side sloping boundary (Figure 1) were analyzed. In addition to the movements of intruding saltwater in a coastal aquifer [39,40,41,42], the model will evaluate the seaward outflow of groundwater and its proximal effects.
2.1. Setup
We considered a setup for a confined, homogeneous, isotropic aquifer that drains perpendicular to the coast. SGD is governed by a hydrostatic pressure distribution on the seaside and a constant groundwater inflow from the designated landside. We used FEFLOW (version 6.2 and 7.0, DHI-WASY, Hørsholm, Denmark) to create a series of vertical, two-dimensional models abstractly approaching natural systems [43]. The setup of the conceptual model as well as its constant values during the simulations and boundary conditions are shown in Figure 1.
The corresponding assignment of boundary conditions set second-type BCs (zero flux) for flow and solute transport on the top and bottom of the model, whereas the stationary sea-level was applied by a first-type BC. Varying groundwater inflows were defined by a second-type BC. Solute transport BCs determined initial salinity values of the fluids. In this case, the landside held a constant first-type BC, while the seaside boundary—experiencing groundwater discharge and subsequent salinity changes—was provided with a direction-dependent and adaptive concentration BC [12,44,45]. Simulation results on the seaside of the models (Figure 1, LS) were particularly in focus as gradient-driven exchanges and small-scaled variations of flow directions took place mainly in that area. To maximize the representation of the hydrodynamic and solute transport processes right at the coast, the spatial resolution of the mesh was increased in this area using the implemented triangle generator (Delaunay triangulation). Based on model setups in [12], the sea side boundary featured a small vertical part at its lower end to avoid highly acute angles leading to distorted mesh elements and potential numerical issues.
2.2. Governing Equations
For a confined aquifer, the 2D vertically-averaged flow and transport equations include the conservation equation:
where [m−1] is the specific storage coefficient of the fluid, h [m] is the hydraulic potential, t [T] is the time, v [L T−1] is the Darcy velocity vector, and q [L T−1] is the outflow/inflow rate (sink/source) of the model system [46].
The dissolved concentration of the solute must satisfy the law of mass conservation written in form of the advection-dispersion transport equation:
where is the porosity [–] and C [M L−3] is the mass concentration. D [L2 T−1] represents the hydrodynamic dispersion tensor including effects of molecular diffusion DD and longitudinal and transverse dispersivities (αL, αT), respectively [47].
Simulated density-coupled flow and transport processes consider the following equation to determine the fluid velocity (Darcy flux):
where K [L T−1] is the hydraulic conductivity tensor, fµ [–] is the fluid-specific viscosity ratio function, h [L] is the hydraulic potential, and relative density . and [M L−3] describe the fluid density and reference fluid density. e quantifies the gravitational unit vector with respect to global coordinates [48].
The hydrodynamic dispersion tensor is considered to be a function of the flow velocity v in a porous medium and is described by:
where DD is the effective molecular diffusion [L2 T−1], αL and αT are longitudinal and transverse dispersivities [L], and I [-] is the unit tensor [49].
2.3. Parametrization
The evaluation of the impact of different coastal slope angles β (Table 1) on SGD and V. cholerae habitats followed [12] denoting the sea-side boundary slope with tan(β), where the minimum value corresponds to a vertical sea-side boundary (βMin = 0°) and the maximum value (βMax = 76.1°) approached more natural (shallow) conditions. Besides six different slope angles (Table 1), model runs varied individual parameters to elucidate their impact on SGD and V. cholerae growth. Values of controlling factors of SGD were selected to represent a realistic spectrum based on literature (Table 1).
Simulations started with five variations of the groundwater inflow and hydraulic conductivity, respectively, to estimate the relevance of interactions between those parameters explicitly. Investigations of other parameters were made at a constant inflow (qX = 0.8 m d−1) and varying hydraulic conductivities (8 m d−1 ≤ K ≤ 85 m d−1).
2.4. Model Evaluation
Stationary model runs were repeated until a steady state was reached, i.e., relative changes in salt concentration over time were negligible (10−5 s−1). SGD zone lengths are determined by a digital measuring tool implemented in FEFLOW and represent the sea-side boundary part at which streamlines outflow from the aquifer (Figure 2a). Potentially optimal conditions for V. cholerae growth were measured likewise, as their requirements were met along a restricted part of the SGD zone—referred to as V. cholerae habitat zone, represented by local salinity values CS ≤ 1000 mg L−1 at the direct interface between sea and aquifer (Figure 2b).
3. Results
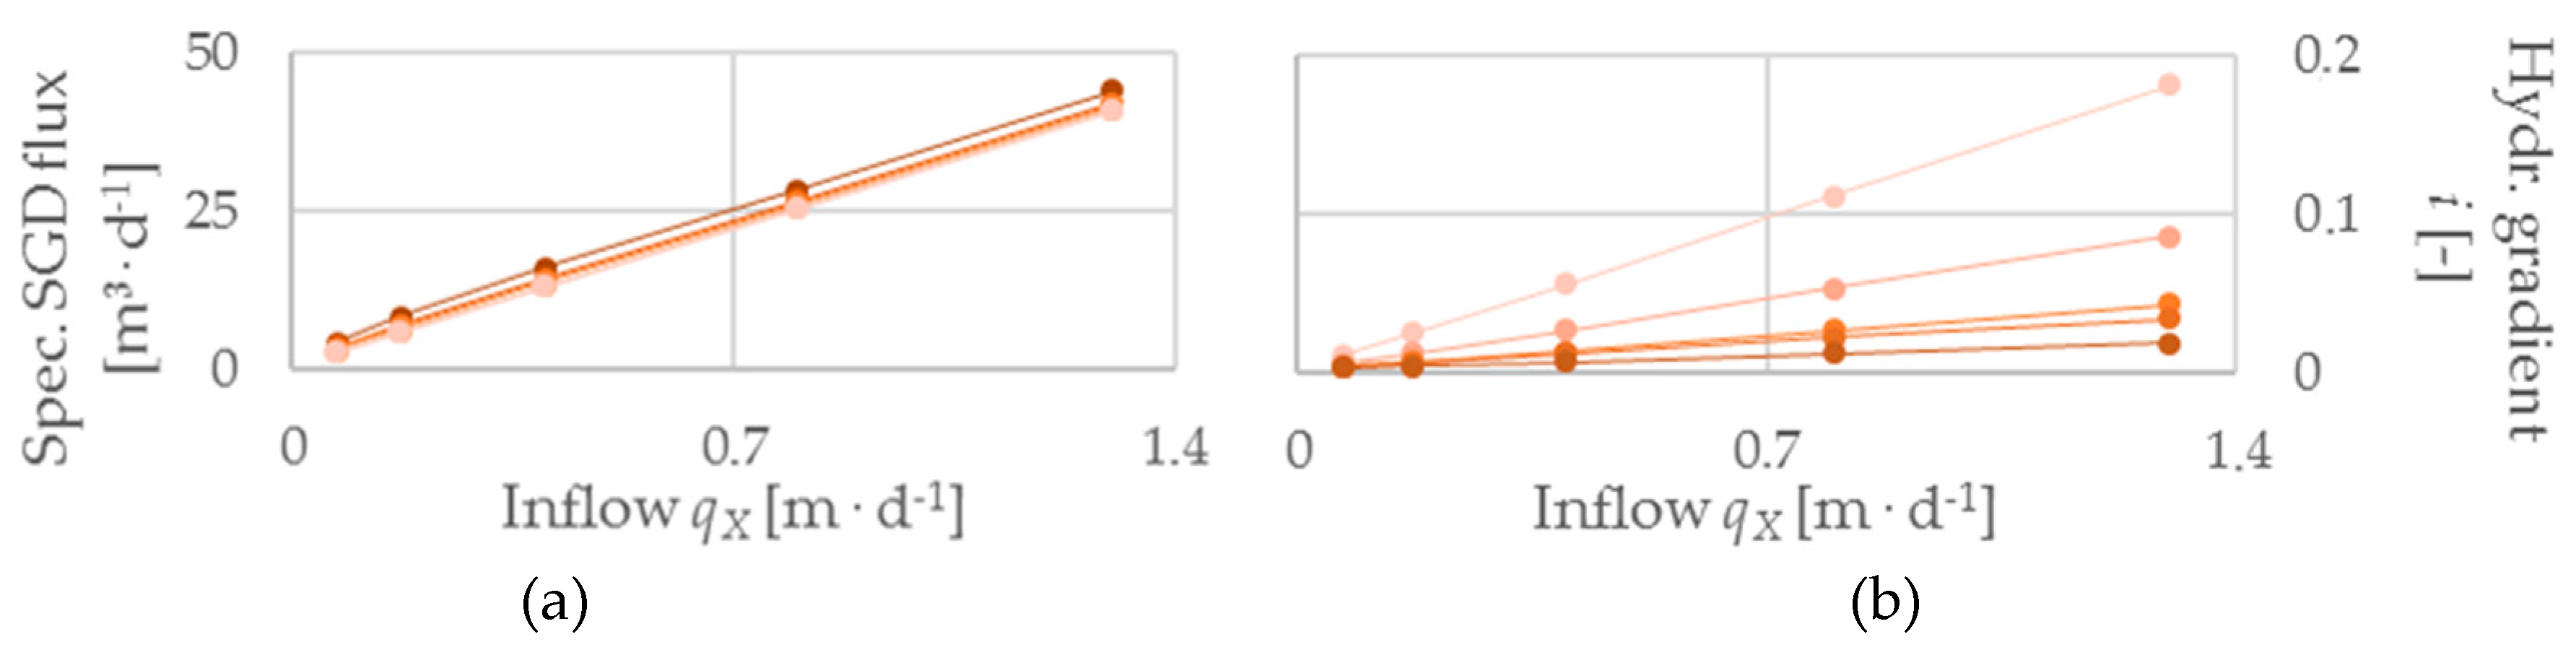
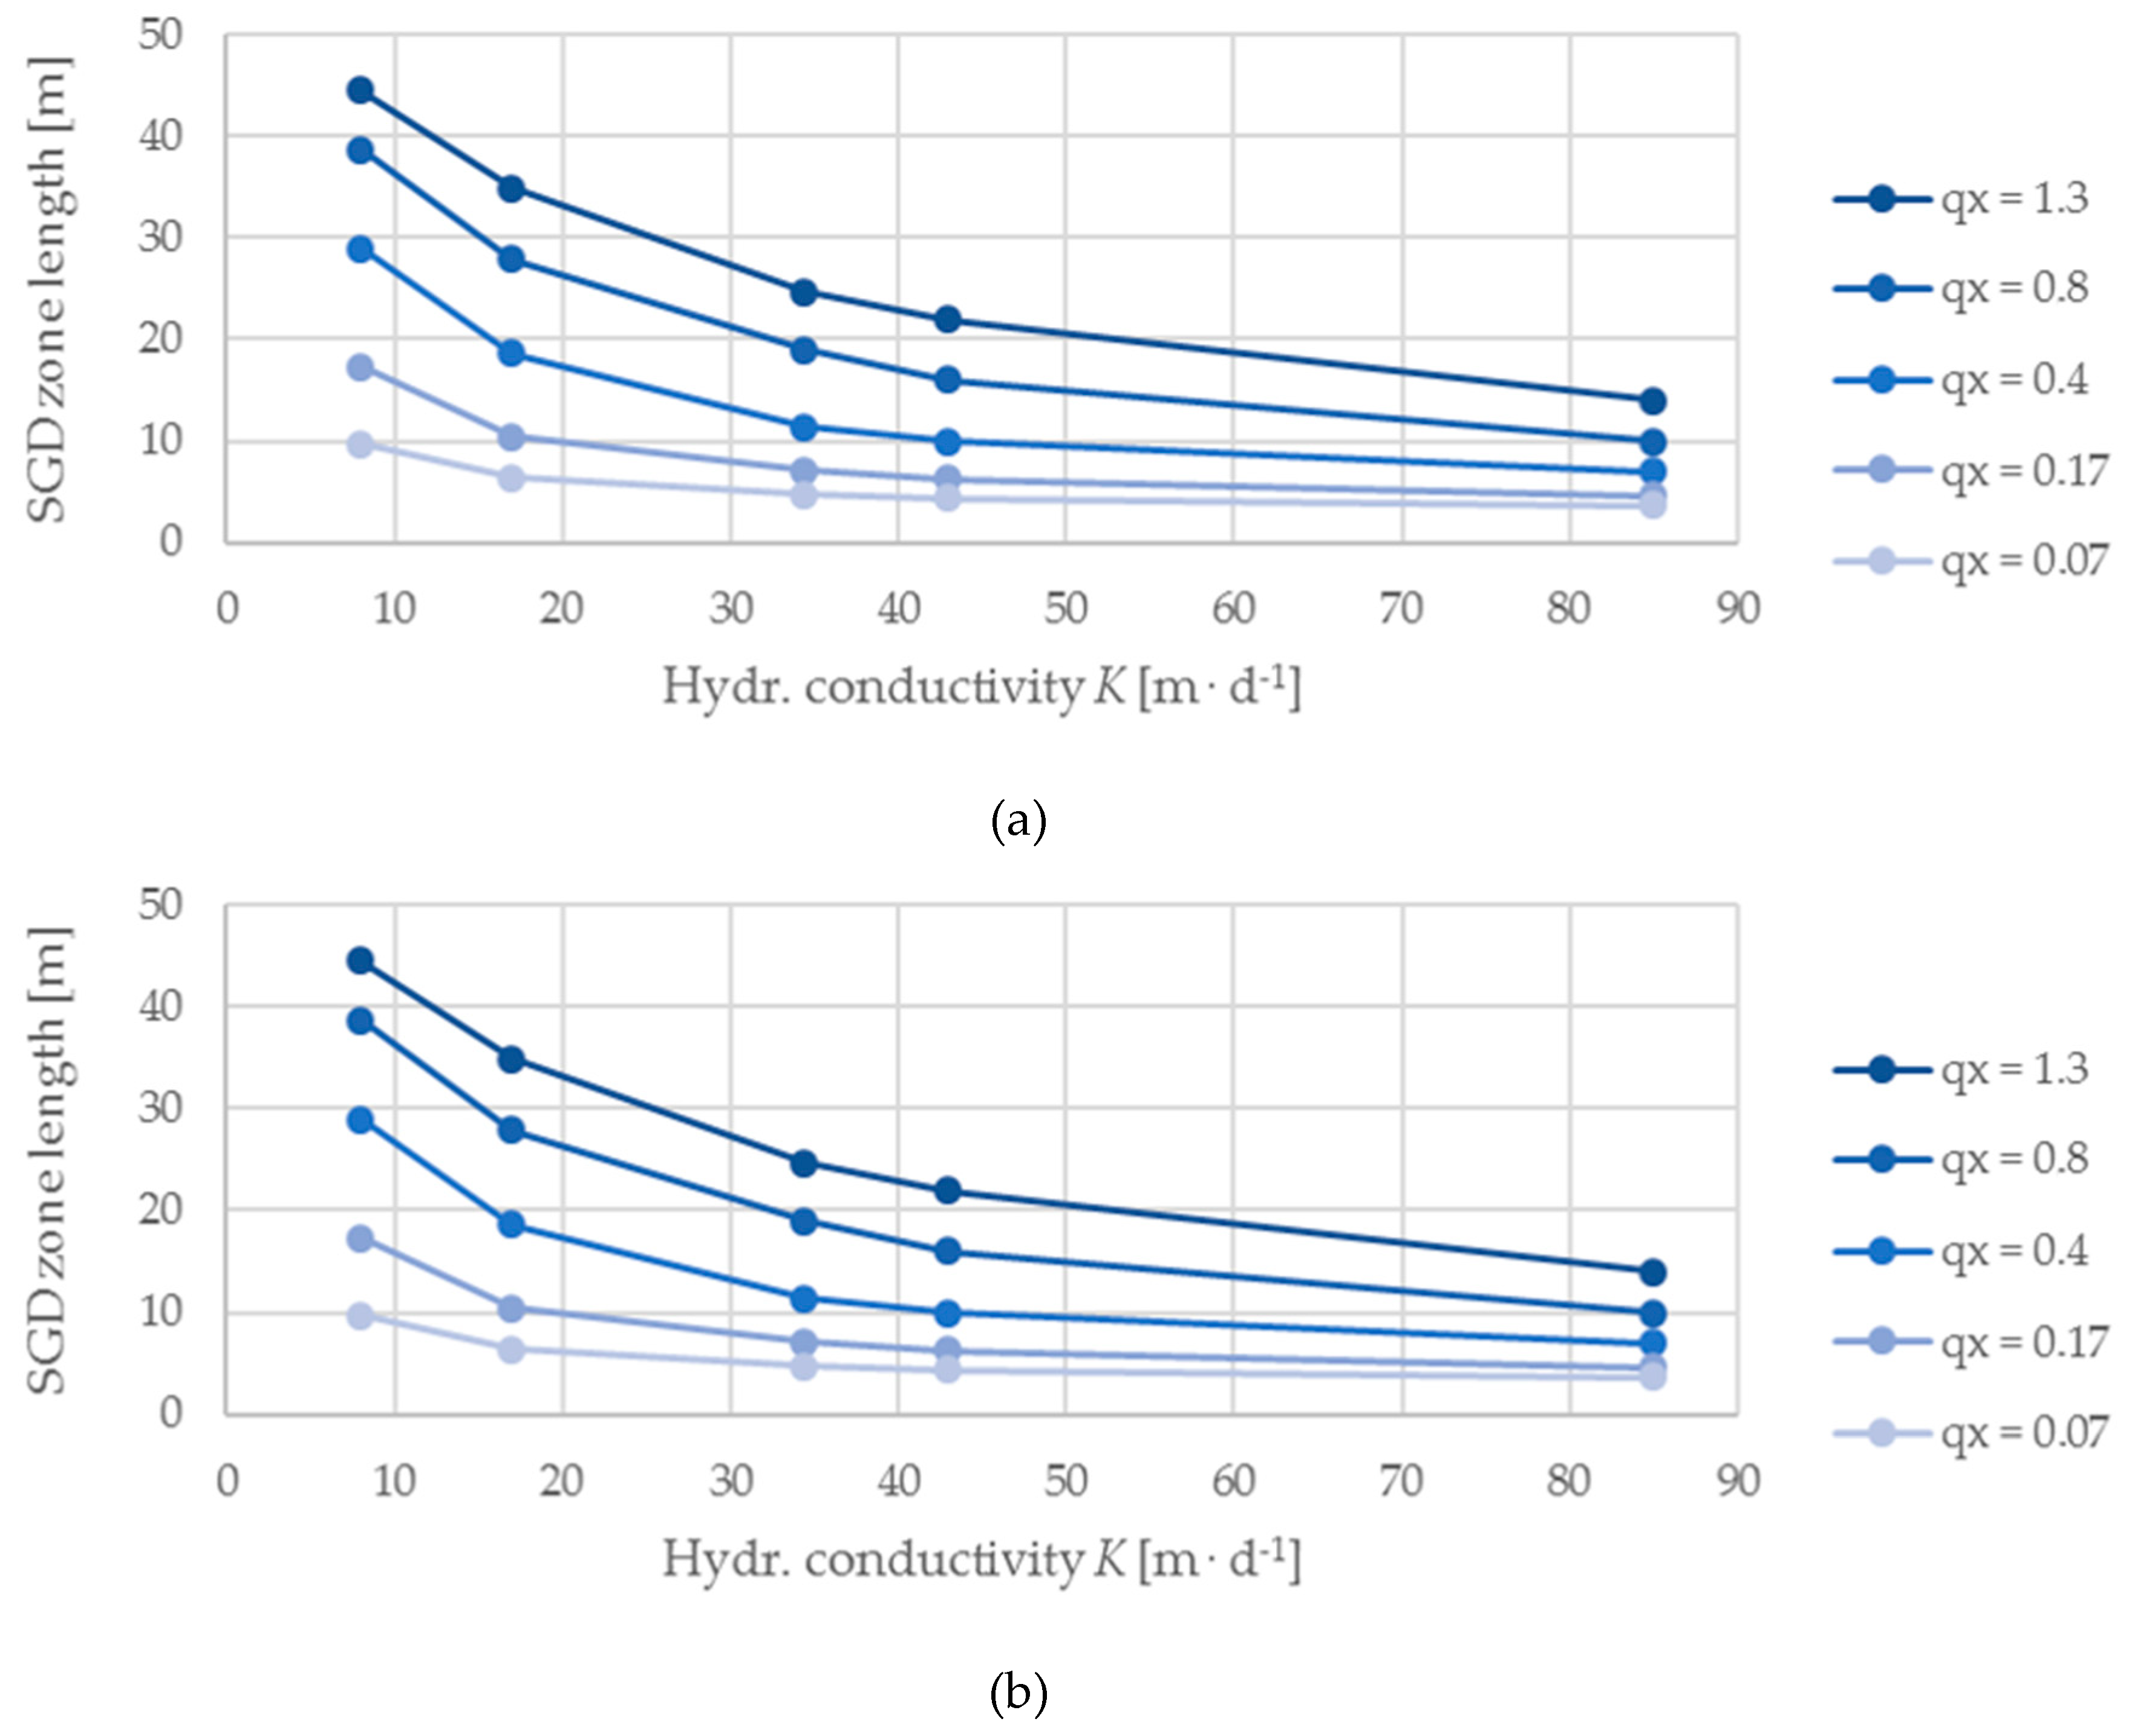
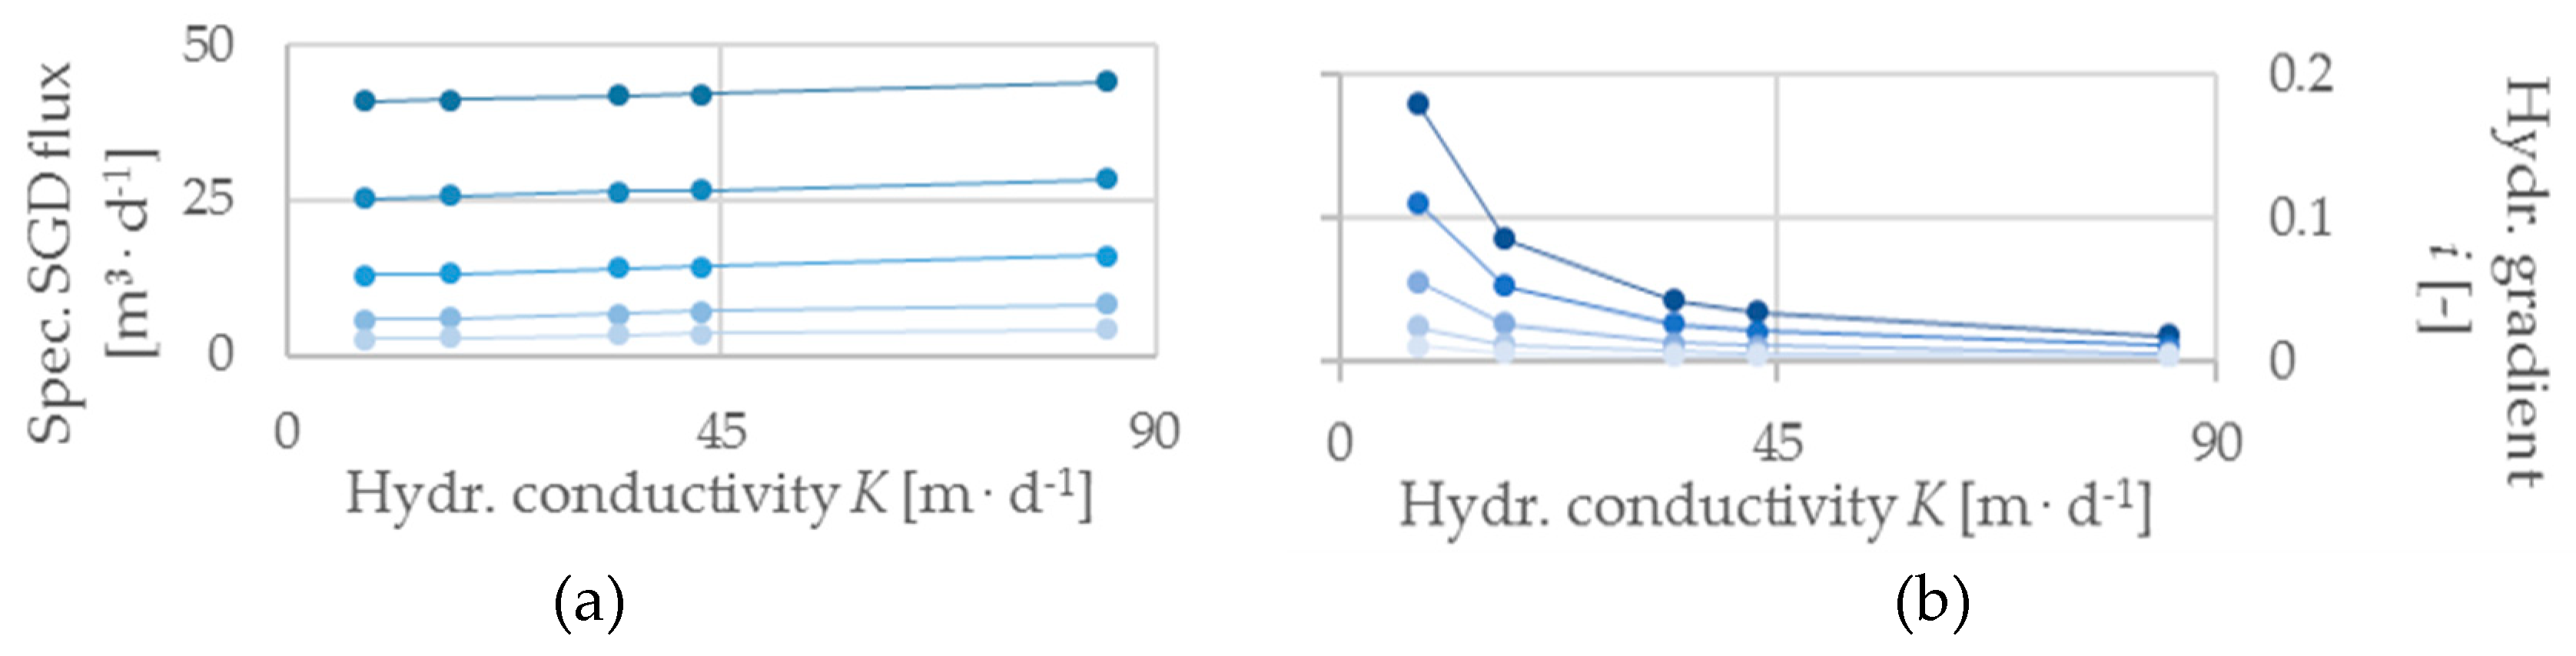
The models highlight a strong effect of groundwater inflow (qX) on both the SGD zone and the V. cholerae habitat zone. The habitat zones expand non-linearly with increasing inflow, while saltwater intrusion diminishes (Figure 3). V. cholerae habitat zones are generally smaller than the SGD area and disappear below qX = 0.07 m d−1. Also, specific SGD flux and hydraulic gradient correlate linearly with inflow (Figure 4). Altered hydraulic conductivities impact SGD and V. cholerae zones; the observed changes in SGD zone, V. cholerae habitat zone (Figure 5), and hydraulic gradient (Figure 6) decrease exponentially with increasing aquifer conductivity with higher rates of change at low K-values. Specific SGD fluxes show a weak positive correlation to changes of hydraulic conductivity (Figure 6).
Figure 3, Figure 4, Figure 5 and Figure 6 show the integration of varying hydraulic conductivities into models dealing with inflow changes and vice versa. Decreasing hydraulic conductivities weaken the effect of increasing SGD and V. cholerae zones at increasing inflow, whereas specific SGD fluxes slightly increase (Figure 3 and Figure 4). Adding different inflow rates (Table 1) to the analyses of hydraulic conductivities amplifies the exponential curvature of SGD and V. cholerae habitat zone growth especially at low K-values (Figure 5). Maximum habitat changes are recorded at highest qX and lowest K, respectively. For the considered K-values (Table 1), the V. cholerae habitats in this study range from 1 m to a maximum of 36 m, which corresponds to a possible habitat extension from 1.2% to 42.3% of the entire seaside boundary. With a constant inflow of qX = 1.3 m d−1 and 85 m d−1 ≥ K ≥ 8 m d−1 we note a range from 4 m to 36 m (4.7 % to 42.3 %). Furthermore, the model shows that there is no linear relation between V. cholerae habitat zones and volumes of SGD; while SGD rate increases with increasing permeability (Figure 6), habitat areas decrease (Figure 5).
Low impact of dispersive effects (αL, αT) on the hydraulic potential distribution in coastal aquifers is described in [13,44], which is in accordance with the results obtained here. Accordingly, SGD zones only show minor changes with varying dispersivity parameters (Figure 7). Different from previous results, V. cholerae habitats do not follow the SGD zone response. Higher mixing potential between groundwater and intruding seawater significantly decreases the preferred habitat of V. cholerae assuming a static concentration cap of Cmax = 1000 mg L−1 (Figure 7). The maximum expansion of V. cholerae habitat zones at different dispersivities (75 m ≥ αL ≥ 2.5 m) ranges between 15 m and 30 m (the difference corresponds to 17.6 % of the entire seaside boundary) for K = 8 m d−1.
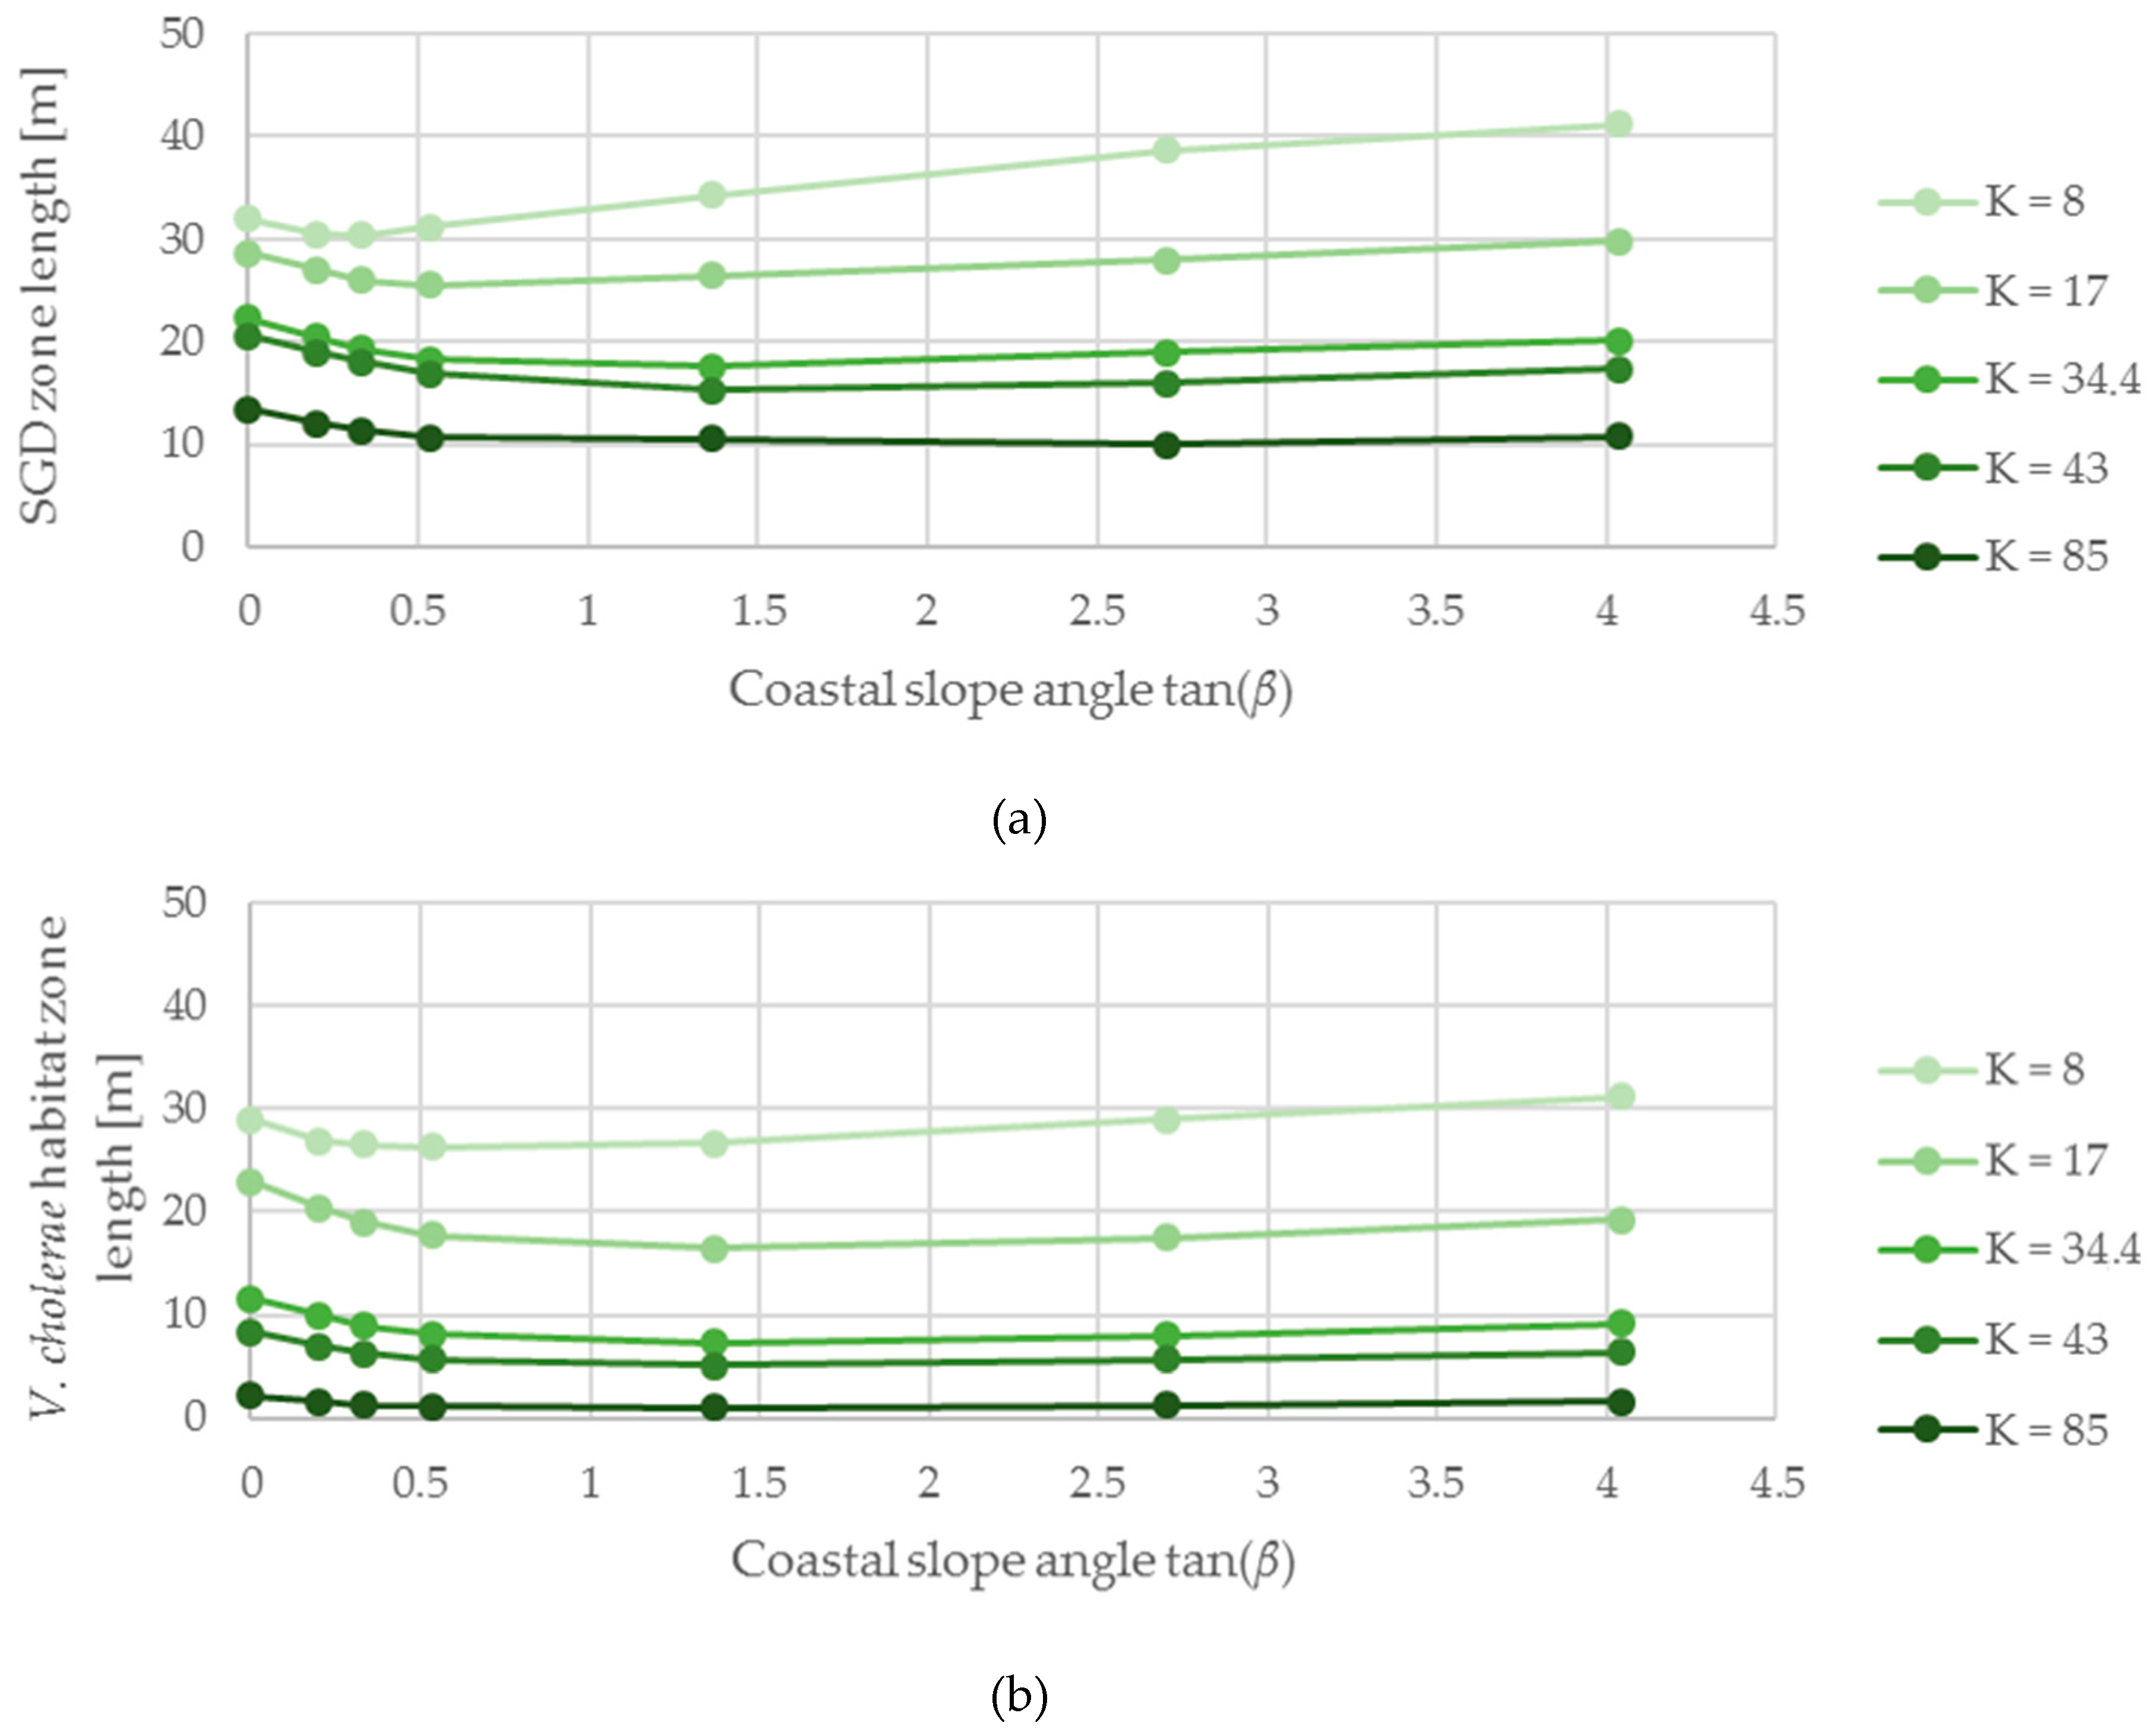
The inclination of the coastal slope affects the V. cholerae habitat zone lengths in a nonlinear way. In accordance with the more pronounced SGD zone lengths, we record an initial loss in habitat size as the slope starts to level off (Figure 8). Beyond moderately sloped coasts (tan(β) ≈ 0.5–1.5), habitat lengths increase consistently with an earlier turning point and generally more potential for change at lower hydraulic conductivities. [12] indicate similar trends for SGD zone lengths with increasing inflow. Furthermore, V. cholerae habitat lengths are considerably smaller than related SGD zone lengths at high K-values (e.g., 85 m d−1) but converge as the hydraulic conductivity decreases. Specific SGD fluxes correspond to the SGD zone growth behavior in much smaller dimensions (Figure 8). Highest potential changes in V. cholerae zone lengths caused by different coastal slope angles are 6.5 m at K = 17 m d−1.
4. Discussion
Numerous factors and coupled processes of hydrodynamic interactions in a coastal aquifer significantly impact salinity distribution patterns and SGD. Increasing inflow widens the area of groundwater discharge and consequently the brackish benthic zones as a more voluminous groundwater flow must find its way to the sea. Simultaneously increasing hydraulic potentials on the land push back opposed saltwater masses. The declining growth of SGD zones at increasing inflow (Figure 3) can be explained by a limited maximum extent of the SGD zone length, i.e., finally the full coastal interface length; therefore, the significance of freshwater inflow on SGD zone length will reduce with higher inflow fluxes. The positive linear correlation between specific SGD fluxes and inflow results from continuity conditions (Equation 1). SGD zone lengths are always larger than those of the V. cholerae habitats in our simulations because of the dispersion-dependent mixing zone of the ground- and saltwater wedge, which leads to increasing salt concentrations at the bottom part of an SGD zone.
Less permeable materials, i.e., lower hydraulic conductivity, lead to increased hydraulic gradients between hinterland and sea under constant influx qX. This is also true for different values of influx qX. The exponential growth of SGD and V. cholerae habitat zone lengths as only the hydraulic conductivity changes is attributed to the FEFLOW-implemented Darcy equation
enforcing a linear inverse proportionality between the hydraulic conductivity and hydraulic gradient. In a more permeable medium, SGD fluxes increase slightly with K. This could be explained by a growing saltwater intrusion as the result of increasingly flat hydraulic gradients (i.e., increasing hydraulic conductivity), thus reinforcing mixing effects which are strongest at high flow velocities and large contact surfaces between the variably-saturated fluids [12] and add more seawater to the SGD. This model series shows that there is no clear coherence between V. cholerae habitat zones and volumes of SGD, since their respective curve slopes are contrary (Figure 5 and Figure 6).
Increasing dispersion parameters cause weak solute concentration gradients, leading to a wider enrichment of groundwater with salt from the saline plume. Consequently, the SGD is less able to contribute low-salt contents into marine sediments. Similar to the effects on the hydraulic gradient, SGD zone lengths are barely affected by changes of αT and αL—slight positive correlations can be attributed to the fact that higher dispersivities reduce density contrasts which weakens the SWI and favors a larger discharge zone for groundwater [12,59]. The strong influence of groundwater and seawater mixing on V. cholerae habitats in this study originates in their assumed dependence solely on salinity. As high mixing potential spreads the transition zone between groundwater and SWI, more discharging groundwater is enriched with salt and higher mass concentrations arise along the SGD zones.
Simulations regarding changes in coastal slope angles affect the entrance angle of intruding saltwater and consequently domain-internal flow patterns. [12], suggesting that moderately-sloped coasts create nearly parallel flow between intruding seawater and outflowing freshwater, highlighting transverse dispersion as the main mixing factor for moderate-slope scenarios. For both lower- and higher inclined slopes intruding seawater is forced to change its flow direction to align with the domain-internal groundwater flow promoting stronger influence of longitudinal dispersion. Dispersivity positively correlates with SGD lengths (Figure 7), supporting this explanation, even though the extent of zone length change is likely overestimated in the present study (Figure 8).
Shifting of the relative importance of longitudinal and transverse solute transport initially fails to explain the similarity of V. cholerae habitat growth curves and SGD volumes (Figure 8) with changing coastal slopes. This seems contradictory to our results from varying dispersivity (Figure 7), which suggests an opposite effect of low-salt habitat dimensions as higher dispersion effects add more intrusive seawater to the SGD; a possible explanation may be that shifting dispersivities has less influence on the effective dispersion than a change in absolute αL and αT values.
The results indicate a complex interplay between flow and solute transport processes. We conclude that in case of varying coastal slope angles the SGD controls the extent of optimum V. cholerae habitats (CS ≤ 1000 mg L−1). Regarding the global frequency of coastal slope angles, most relevant simulation results range between 54° < β < 76° [60]; within these bounds SGD and V. cholerae habitats increase as the sea-side boundary inclines, which could be partially owed to an increasing hydraulic gradient to overcome a growing hydrostatic potential on an expanding slope.
For most cases, V. cholerae zone changes are on a similar scale to those of groundwater discharge, suggesting a positive SGD influence on bacterial habitat growth. Comparing the parameters for SGD and V. cholerae habitat zone expansion, we conclude that the most important factors are those controlling the hydraulic gradient such as hydraulic conductivity of the aquifer and groundwater inflow. For a blooming non-halophilic bacterial growth, high inflow rates and low hydraulic conductivity values within the range of highly conductive materials are ideal. Of second-most importance is the mixing strength of groundwater and SWI as an already salt-enriched SGD yields less potential than fresh SGD to lower the salinity in marine sediments.
The presented results are limited by the simplifications of the setup, compared to natural systems. Firstly, the implementation of a stationary environment when individual SGD parameters vary prevents dynamic interactions between factors controlling flow and transport processes as seen in natural aquifers. Assumed constant groundwater inflows during a simulation restrain oscillating recharge rates, e.g., due to seasonal changes [9]. As only density and convection-driven interplays between coastal sea and aquifer are assessed, the impact of waves and tides on SGD and V. cholerae growth is not taken into account. Thus, we cannot consider the effect of, e.g., a tidal recirculation cell or additional dispersion processes induced by waves [56,61] on the formation of potential V. cholerae habitats. By waiving these significant drivers of chemical/physical exchange and additional saline plumes in coastal subsurface sediments, our simulation results probably tend to overestimate low-salt habitat sizes. Beyond that, morphological changes of the model system (i.e., through erosional events) and marine currents affecting the fluid dynamics in near-surface areas [56,62] are neglected. Yet, such transient effects are only relevant on smaller spatial and temporal scales, and our results highlight the relevance of system parameters for long-term settings. Secondly, regarding the growth of V. cholerae bacteria, we limited our evaluation to focus solely on salinity, while nutrient supply and water temperature might be considered equally important [19] and should be addressed in future studies. Defined boundary conditions create a partially closed aquifer system (top and bottom) whereby salt input from rivers and further atmospheric input, evaporation, exchange between adjacent aquifers or salt plumes as well as vegetational effects [8,63] are inhibited. Thirdly, the homogeneous setup of our aquifer models does not resemble the natural variations in lithology and stratigraphy of natural coastal systems, in which typical forms of sediment (beaches, fans, tidal flats, and channels) with individual grain size distributions and hydraulic properties may occur [64]. These heterogeneities were shown to affect the specific SGD flux and likely salinity [65,66]. Variations of aquifer heterogeneity (e.g., through Monte-Carlo-based stochastic definitions) lead to a tremendous computation burden and add additional evaluation complexity; in this approach, we firstly wanted to understand the potential influence of the general features of SGD on non-halophilic bacteria dwelling in marine environments.
Our simulations therefore show a potentially ideal and homogeneous salinity distribution, which is likely to be disturbed and diffused in natural systems through temporal and spatial heterogeneities and various influences. For individual case/field studies, local measurements are needed to assess the exact conditions of a study site. Here, we provide a basic indication for which parameters should be investigated when it comes to classifying potential SGD induced salt-dependent V. cholerae growth.
5. Conclusions
Using numerical simulations, we evaluate the effect of submarine groundwater discharge (SGD) on the growth of non-halophilic V. cholerae bacteria with a particular view on salinity distributions on the interface between a coastal aquifer and the sea. SGD can potentially support V. cholerae growth in shallow marine sediments under common natural conditions.
- Sufficient fresh groundwater inflow and hydraulic conductivity of a coastal aquifer are the most important controls that govern V. cholerae growth. Demanding a high freshwater supply (CS ≤ 100 mg L−1) to the coastal slope and thus a high hydraulic gradient between the hinterland and sea to displace saltwater intrusion, a preferably high groundwater inflow and low hydraulic conductivity within the bounds of a highly conductive material (e.g., sand) create the most favorable conditions for V. cholerae growth, which is not necessarily linked to the specific SGD flux.
- Although not significantly affecting the SGD volume, dispersion facilitates non-halophilic bacterial expansion at decreasing values, keeping the fresh groundwater flow low in salt by preventing mixing processes between fresh and saline groundwaters.
- Coastal slope had substantially less impact on the estimated habitat areas than the other analyzed parameters.
In general, our findings clearly point towards the potential of SGD and the hydraulic properties to affect V. cholerae living conditions that should be evaluated at a regional basis to identify specific risks for individual locations.
Author Contributions
Conceptualization, F.V., M.W., A.G. and N.M.; Formal analysis, F.V.; Funding acquisition, N.M.; Methodology, F.V., M.W., and N.M.; Resources, N.M.; Supervision, M.W. and N.M.; Visualization, F.V.; Writing—original draft, F.V. and N.M.; Writing—review & editing, F.V., M.W., A.G., and N.M.
Funding
This research was funded through the German Ministry of Education and Research, BMBF, grant number [#01LN1307A] to Nils Moosdorf.
Acknowledgments
We thank DHI WASY for supporting the work with a FEFLOW 7.0 student license.
Conflicts of Interest
The authors declare no conflict of interest.
References
- Burnett, W.C.; Bokuniewicz, H.; Huettel, M.; Moore, W.S.; Taniguchi, M. Groundwater and pore water inputs to the coastal zone. Biogeochemistry 2003, 66, 3–33. [Google Scholar] [CrossRef]
- Moore, W.S. The effect of submarine groundwater discharge on the ocean. Annu. Rev. Mar. Sci. 2010, 2, 59–88. [Google Scholar] [CrossRef] [PubMed]
- Burnett, W.C.; Aggarwal, P.K.; Aureli, A.; Bokuniewicz, H.; Cable, J.E.; Charette, M.A.; Moore, W.S.; Krupa, S.; Kulkarni, K.M.; Loveless, A.; et al. Quantifying submarine groundwater discharge in the coastal zone via multiple methods. Sci. Total Environ. 2006, 367, 498–543. [Google Scholar] [CrossRef] [PubMed]
- da Rocha, C.M.; Barboza, E.G.; Niencheski, L.F.H. Radon activity and submarine groundwater discharge in different geological regions of a coastal barrier in Southern Brazil. Environ. Earth Sci. 2018, 77, 527. [Google Scholar] [CrossRef]
- Taniguchi, M.; Burnett, W.C.; Cable, J.E.; Turner, J.V. Investigation of submarine groundwater discharge. Hydrol. Process. 2002, 16, 2115–2129. [Google Scholar] [CrossRef]
- Johannes, R.E. Ecological significance of the submarine discharge of groundwater. Mar. Ecol. Prog. Ser. 1980, 3, 365–373. [Google Scholar] [CrossRef]
- Li, X.; Hu, B.X.; Burnett, W.C.; Santos, I.R.; Chanton, J.P. Submarine ground water discharge driven by tidal pumping in a heterogeneous aquifer. Groundwater 2009, 47, 558–568. [Google Scholar] [CrossRef]
- Antonellini, M.; Mollema, P.; Giambastiani, B.; Bishop, K.; Caruso, L.; Minchio, A.; Pellegrini, L.; Sabia, M.; Ulazzi, E.; Gabbianelli, G. Salt water intrusion in the coastal aquifer of the southern Po Plain, Italy. Hydrogeol. J. 2008, 16, 1541. [Google Scholar] [CrossRef]
- Michael, H.A.; Mulligan, A.E.; Harvey, C.F. Seasonal oscillations in water exchange between aquifers and the coastal ocean. Nature 2005, 436, 1145. [Google Scholar] [CrossRef]
- Mulligan, A.E.; Charette, M.A. Intercomparison of submarine groundwater discharge estimates from a sandy unconfined aquifer. J. Hydrol. 2006, 327, 411–425. [Google Scholar] [CrossRef]
- Cable, J.E.; Burnett, W.C.; Chanton, J.P.; Corbett, D.R.; Cable, P.H. Field evaluation of seepage meters in the coastal marine environment. Estuar. Coast. Shelf Sci. 1997, 45, 367–375. [Google Scholar] [CrossRef]
- Walther, M.; Graf, T.; Kolditz, O.; Liedl, R.; Post, V. How significant is the slope of the sea-side boundary for modelling seawater intrusion in coastal aquifers? J. Hydrol. 2017, 551, 648–659. [Google Scholar] [CrossRef]
- Wilson, A.M. Fresh and saline groundwater discharge to the ocean: A regional perspective. Water Resour. Res. 2005, 41. [Google Scholar] [CrossRef]
- Santos, I.R.; Eyre, B.D.; Huettel, M. The driving forces of porewater and groundwater flow in permeable coastal sediments: A review. Estuar. Coast. Shelf Sci. 2012, 98, 1–15. [Google Scholar] [CrossRef]
- Adolf, J.E.; Burns, J.; Walker, J.K.; Gamiao, S. Near shore distributions of phytoplankton and bacteria in relation to submarine groundwater discharge-fed fishponds, Kona coast, Hawai‘i, USA. Estuar. Coast. Shelf Sci. 2019, 219, 341–353. [Google Scholar] [CrossRef]
- Lecher, A.; Mackey, K. Synthesizing the effects of submarine groundwater discharge on marine biota. Hydrology 2018, 5, 60. [Google Scholar] [CrossRef]
- Kopprio, G.A.; Streitenberger, M.E.; Okuno, K.; Baldini, M.; Biancalana, F.; Fricke, A.; Martínez, A.; Neogi, S.B.; Koch, B.P.; Yamasaki, S.; et al. Biogeochemical and hydrological drivers of the dynamics of Vibrio species in two Patagonian estuaries. Sci. Total Environ. 2017, 579, 646–656. [Google Scholar] [CrossRef]
- Cook, D.W. Effect of time and temperature on multiplication of Vibrio vulnificus in postharvest Gulf Coast shellstock oysters. Appl. Environ. Microb. 1994, 60, 3483–3484. [Google Scholar]
- Blackwell, K.D.; Oliver, J.D. The ecology of Vibrio vulnificus, Vibrio cholerae, and Vibrio parahaemolyticus in North Carolina estuaries. J. Microb. 2008, 46, 146–153. [Google Scholar] [CrossRef]
- Esteves, K.; Mosser, T.; Aujoulat, F.; Hervio-Heath, D.; Monfort, P.; Jumas-Bilak, E. Highly diverse recombining populations of Vibrio cholerae and Vibrio parahaemolyticus in French Mediterranean coastal lagoons. Front. Microb. 2015, 6, 708. [Google Scholar] [CrossRef]
- Adyasari, D.; Hassenrück, C.; Oehler, T.; Sabdaningsih, A.; Moosdorf, N. Microbial community structure associated with submarine groundwater discharge in northern Java (Indonesia). Sci. Total Environ. 2019. under review. [Google Scholar] [CrossRef]
- Morris, J.J. Non-O group 1 Vibrio cholerae: A look at the epidemiology of an occasional pathogen. Epidemiol. Rev. 1990, 12, 179–191. [Google Scholar] [CrossRef] [PubMed]
- Johnston, M.D.; Brown, M.H. An investigation into the changed physiological state of Vibrio bacteria as a survival mechanism in response to cold temperatures and studies on their sensitivity to heating and freezing. J. Appl. Microbiol. 2002, 92, 1066–1077. [Google Scholar] [CrossRef] [PubMed]
- Oliver, J.D. Wound infections caused by Vibrio vulnificus and other marine bacteria. Epidemiol. Infect. 2005, 133, 383–391. [Google Scholar] [CrossRef] [PubMed]
- Howard, R.J.; Bennett, N.T. Infections caused by halophilic marine Vibrio bacteria. Ann. Surg. 1993, 217, 525. [Google Scholar] [CrossRef] [PubMed]
- Fleming, L.E.; Broad, K.; Clement, A.; Dewailly, E.; Elmir, S.; Knap, A.; Pomponi, S.A.; Smith, S.; Solo Gabriele, H.; Walsh, P. Oceans and human health: Emerging public health risks in the marine environment. Mar. Pollut. Bull. 2006, 53, 545–560. [Google Scholar] [CrossRef] [PubMed]
- Feglo, P.K.; Sewurah, M. Characterization of highly virulent multidrug resistant Vibrio cholerae isolated from a large cholera outbreak in Ghana. BMC Res. Notes 2018, 11, 45. [Google Scholar] [CrossRef] [PubMed]
- Dupke, S.; Akinsinde, K.A.; Grunow, R.; Iwalokun, B.A.; Olukoya, D.K.; Oluwadun, A.; Thirumalaisamy, P.V.; Jacob, D. Characterization of Vibrio cholerae strains isolated from the Nigerian cholera outbreak in 2010. J. Clin. Microbiol. 2016, 54.10, 2618–2621. [Google Scholar] [CrossRef] [PubMed]
- Chowdhury, G.; Bhadra, R.K.; Bag, S.; Pazhani, G.P.; Das, B.; Basu, P.; Nagamani, K.; Nandy, R.K.; Mukhopadhyay, A.K.; Ramamurthy, T. Rugose atypical Vibrio cholerae O1 El Tor responsible for 2009 cholera outbreak in India. J. Med.l Microbiol. 2016, 65, 1130–1136. [Google Scholar] [CrossRef]
- Kohout, F.A. Ground-water flow and the geothermal regime of the floridian plateau (1). GCAGS Trans. 1967, 17, 339–354. [Google Scholar]
- Bratton, J.F. The three scales of submarine groundwater flow and discharge across passive continental margins. J. Geol. 2010, 118, 565–575. [Google Scholar] [CrossRef]
- Kim, G.; Swarzenski, P.W. Submarine groundwater discharge (SGD) and associated nutrient fluxes to the coastal ocean. In Carbon and Nutrient Fluxes in Continental Margins: A Global Synthesis, Part III. Arising Issues and New Approaches; Liu, K.-K., Atkinson, L., Quinones, R., Talaue-McManus, L., Eds.; Springer: New York, NY, USA, 2010; pp. 529–538. [Google Scholar]
- Sugimoto, R.; Kitagawa, K.; Nishi, S.; Honda, H.; Yamada, M.; Kobayashi, S.; Shoji, J.; Ohsawa, S.; Taniguchi, M.; Tominaga, O. Phytoplankton primary productivity around submarine groundwater discharge in nearshore coasts. Mar. Ecol. Prog. Ser. 2017, 563, 25–33. [Google Scholar] [CrossRef]
- Schlüter, M.; Sauter, E.J.; Andersen, C.E.; Dahlgaard, H.; Dando, P.R. Spatial distribution and budget for submarine groundwater discharge in Eckernförde Bay (Western Baltic Sea). Limnol. Oceanogr. 2004, 49, 157–167. [Google Scholar] [CrossRef]
- Oehler, T.; Mogollón, J.M.; Moosdorf, N.; Winkler, A.; Kopf, A.; Pichler, T. Submarine groundwater discharge within a landslide scar at the French Mediterranean coast. Estuar. Coast. Shelf Sci. 2017, 198, 128–137. [Google Scholar] [CrossRef]
- Heiss, J.W.; Michael, H.A. Saltwater-freshwater mixing dynamics in a sandy beach aquifer over tidal, spring-neap, and seasonal cycles. Water Resour. Res. 2014, 50, 6747–6766. [Google Scholar] [CrossRef]
- Park, C.H.; Aral, M.M. Saltwater intrusion hydrodynamics in a tidal aquifer. J. Hydrol. Eng. 2008, 13, 863–872. [Google Scholar] [CrossRef]
- Righetti, C.; Gigliuto, A.; Chini, A.; Rossetto, R. Saltwater intrusion in a coastal contaminated aquifer density-dependent finite element model of flow and transport to assess remediation strategies and saltwater intrusion at a coastal gas plant site. In Proceedings of the 2nd International FEFLOW User Conference, Potsdam, Germany, 14–18 September 2009. [Google Scholar]
- Essink, G.H.O. Salt water intrusion in a three-dimensional groundwater system in the Netherlands: A numerical study. Transport Porous Med. 2001, 43.1, 137–158. [Google Scholar] [CrossRef]
- Giambastiani, B.M.; Antonellini, M.; Essink, G.H.O.; Stuurman, R.J. Saltwater intrusion in the unconfined coastal aquifer of Ravenna (Italy): A numerical model. J. Hydrol. 2007, 340, 91–104. [Google Scholar] [CrossRef]
- Bobba, A.G. Mathematical models for saltwater intrusion in coastal aquifers. Water Resour. Manag. 1993, 7, 3–37. [Google Scholar] [CrossRef]
- Ghassemi, F.; Jakeman, A.J.; Jacobson, G.; Howard, K.W.F. Simulation of seawater intrusion with 2D and 3D models: Nauru Island case study. Hydrogeol. J. 1996, 4.3, 4–22. [Google Scholar] [CrossRef]
- Diersch, H.J.G. FEFLOW-Finite Element Modeling of Flow, Mass and Heat Transport in Porous and Fractured Media; Springer: Berlin/Heidelberg, Germany, 2014. [Google Scholar]
- Smith, A.J. Mixed convection and density-dependent seawater circulation in coastal aquifers. Water Resour. Res. 2004, 40. [Google Scholar] [CrossRef]
- Kolditz, O.; Ratke, R.; Diersch, H.J.G.; Zielke, W. Coupled groundwater flow and transport: 1. Verification of variable density flow and transport models. Adv. Water Resour. 1998, 21, 27–46. [Google Scholar] [CrossRef]
- Diersch, H.J.G. Modeling variable-density problems in 2D horizontally schematized aquifers using projected gravity. White Pap. 2004, 3, 5–12. [Google Scholar]
- Diersch, H.J.G. An efficient method for computing groundwater residence times. White Pap. 2002, 1, 141–150. [Google Scholar]
- Diersch, H.J.G. Consistent velocity approximation in the finite-element simulation of density dependent mass and heat transport processes. White Pap. 2002, 1, 141–150. [Google Scholar]
- Diersch, H.J.G. Nonlinear dispersion in density-dependent mass transport. White Pap. 2002, 1, 277–282. [Google Scholar]
- Walther, M.; Delfs, J.O.; Grundmann, J.; Kolditz, O.; Liedl, R. Saltwater intrusion modeling: Verification and application to an agricultural coastal arid region in Oman. J. Comput. Appl. Math. 2012, 236, 4798–4809. [Google Scholar] [CrossRef]
- Huo, Z.L.; Feng, S.Y.; Kang, S.Z.; Cen, S.J.; Ma, Y. Simulation of effects of agricultural activities on groundwater level by combining FEFLOW and GIS. New Zeal. J. Agr. Res. 2007, 50, 839–846. [Google Scholar] [CrossRef]
- Lu, J. Identification of forensic information from existing conventional site-investigation data. Introduction to Environ. Forensics 2015, 3, 149–164. [Google Scholar]
- Grant, S.A. Hydraulic properties, temperature effects. In Encyclopedia of Soils in the Environment; Hillel, D., Ed.; Elesevier: Amsterdam, The Netherlands, 2005; Volume 2, pp. 207–211. [Google Scholar]
- Kaleris, V.; Lagas, G.; Marczinek, S.; Piotrowski, J.A. Modelling submarine groundwater discharge: An example from the western Baltic Sea. J. Hydrol. 2002, 265, 76–99. [Google Scholar] [CrossRef]
- Bear, J.; Verruijt, A. Modeling Groundwater Flow and Pollution, 2nd ed.; Reidel, D., Ed.; Springer: Dordrecht, the Netherlands, 1987. [Google Scholar]
- Datta, B.; Vennalakanti, H.; Dhar, A. Modeling and control of saltwater intrusion in a coastal aquifer of Andhra Pradesh, India. J. Hydro-Environ. Res. 2009, 3, 148–159. [Google Scholar] [CrossRef]
- Robinson, C.; Gibbes, B.; Li, L. Driving mechanisms for groundwater flow and salt transport in a subterranean estuary. Geophys. Res. Lett. 2006, 33. [Google Scholar] [CrossRef]
- Narayan, K.A.; Schleeberger, C.; Bristow, K.L. Modelling seawater intrusion in the Burdekin Delta irrigation area, North Queensland, Australia. Agr. Water Manag. 2007, 89, 217–228. [Google Scholar] [CrossRef]
- Abarca, E.; Carrera, J.; Sanchez-Vila, X.; Dentz, M. Anisotropic dispersive Henry problem. Adv. Water Resour. 2007, 30, 913–926. [Google Scholar] [CrossRef]
- Doran, K.S.; Long, J.W.; Overbeck, J.R. A method for determining average beach slope and beach slope variability for US sandy coastlines. USGS 2015, 2015-1053, 5. [Google Scholar] [CrossRef]
- Boufadel, M.C. A mechanistic study of nonlinear solute transport in a groundwater-surface water system under steady state and transient hydraulic conditions. Water Resour. Res. 2000, 36, 2549–2565. [Google Scholar] [CrossRef]
- Robinson, C.; Li, L.; Prommer, H. Tide-induced recirculation across the aquifer-ocean interface. Water Resour. Res. 2007, 43. [Google Scholar] [CrossRef]
- Ghabayen, S.M.; McKee, M.; Kemblowski, M. Ionic and isotopic ratios for identification of salinity sources and missing data in the Gaza aquifer. J. Hydrol. 2006, 318, 360–373. [Google Scholar] [CrossRef]
- Davis, R.A. The Evolving Coast; Scientific American Library: New York, NY, USA, 1997. [Google Scholar]
- Houben, G.J.; Stoeckl, L.; Mariner, K.E.; Choudhury, A.S. The influence of heterogeneity on coastal groundwater flow-physical and numerical modeling of fringing reefs, dykes and structured conductivity fields. Adv. Water Resour. 2018, 113, 155–166. [Google Scholar] [CrossRef]
- Weinstein, Y.; Burnett, W.C.; Swarzenski, P.W.; Shalem, Y.; Yechieli, Y.; Herut, B. Role of aquifer heterogeneity in fresh groundwater discharge and seawater recycling: An example from the Carmel coast, Israel. J. Geophys. Res. 2007, 112. [Google Scholar] [CrossRef]
Figure 1.
Sketch (not to scale) of the conceptual model build regarding geometrical and parametrical properties along the boundaries, where qX describes the horizontal and qY the vertical groundwater inflow, C the solute concentration of the fluids and h corresponds to the static hydraulic potential of the sea. The depth of the aquifer is z and β shows the coastal slope angle.

Figure 2.
(a) Typical flow pattern, solute distribution and Darcy velocities within homogeneous aquifer models. The submarine groundwater discharge (SGD) zone length extends across the area of seaward directed flow arrows along the seaside boundary. (b) Salinity distribution in the aquifer model and marine sediments (seaside BC), isolines indicate concentration limits such as optimized areas for V. cholerae growth (CS ≤ 1000 mg L−1).

Figure 3.
(a) Length of SGD zones and (b) length of V. cholerae zones plotted against the groundwater inflow qX. Each differently colored data series reflects a hydraulic conductivity value K [m d−1].
Figure 3.
(a) Length of SGD zones and (b) length of V. cholerae zones plotted against the groundwater inflow qX. Each differently colored data series reflects a hydraulic conductivity value K [m d−1].

Figure 4.
(a) Specific SGD flux and (b) hydraulic gradient plotted against the groundwater inflow qX. Each differently colored data series reflects a hydraulic conductivity value K [m d−1] as seen in Figure 3.
Figure 4.
(a) Specific SGD flux and (b) hydraulic gradient plotted against the groundwater inflow qX. Each differently colored data series reflects a hydraulic conductivity value K [m d−1] as seen in Figure 3.

Figure 5.
(a) Length of SGD zones and (b) length of V. cholerae zones plotted against the hydraulic conductivity K. Each differently colored data series reflects an inflow value qX [m d−1].
Figure 5.
(a) Length of SGD zones and (b) length of V. cholerae zones plotted against the hydraulic conductivity K. Each differently colored data series reflects an inflow value qX [m d−1].

Figure 6.
(a) Specific SGD flux and (b) hydraulic gradient plotted against the hydraulic conductivity K. Each differently colored data series reflects an inflow value qX [m d−1] as seen in Figure 5.
Figure 6.
(a) Specific SGD flux and (b) hydraulic gradient plotted against the hydraulic conductivity K. Each differently colored data series reflects an inflow value qX [m d−1] as seen in Figure 5.

Figure 7.
(a) Length of SGD zones and (b) V. cholerae zones plotted against the longitudinal dispersivity αL. Each differently colored data series reflects a hydraulic conductivity value K [m d−1].
Figure 7.
(a) Length of SGD zones and (b) V. cholerae zones plotted against the longitudinal dispersivity αL. Each differently colored data series reflects a hydraulic conductivity value K [m d−1].
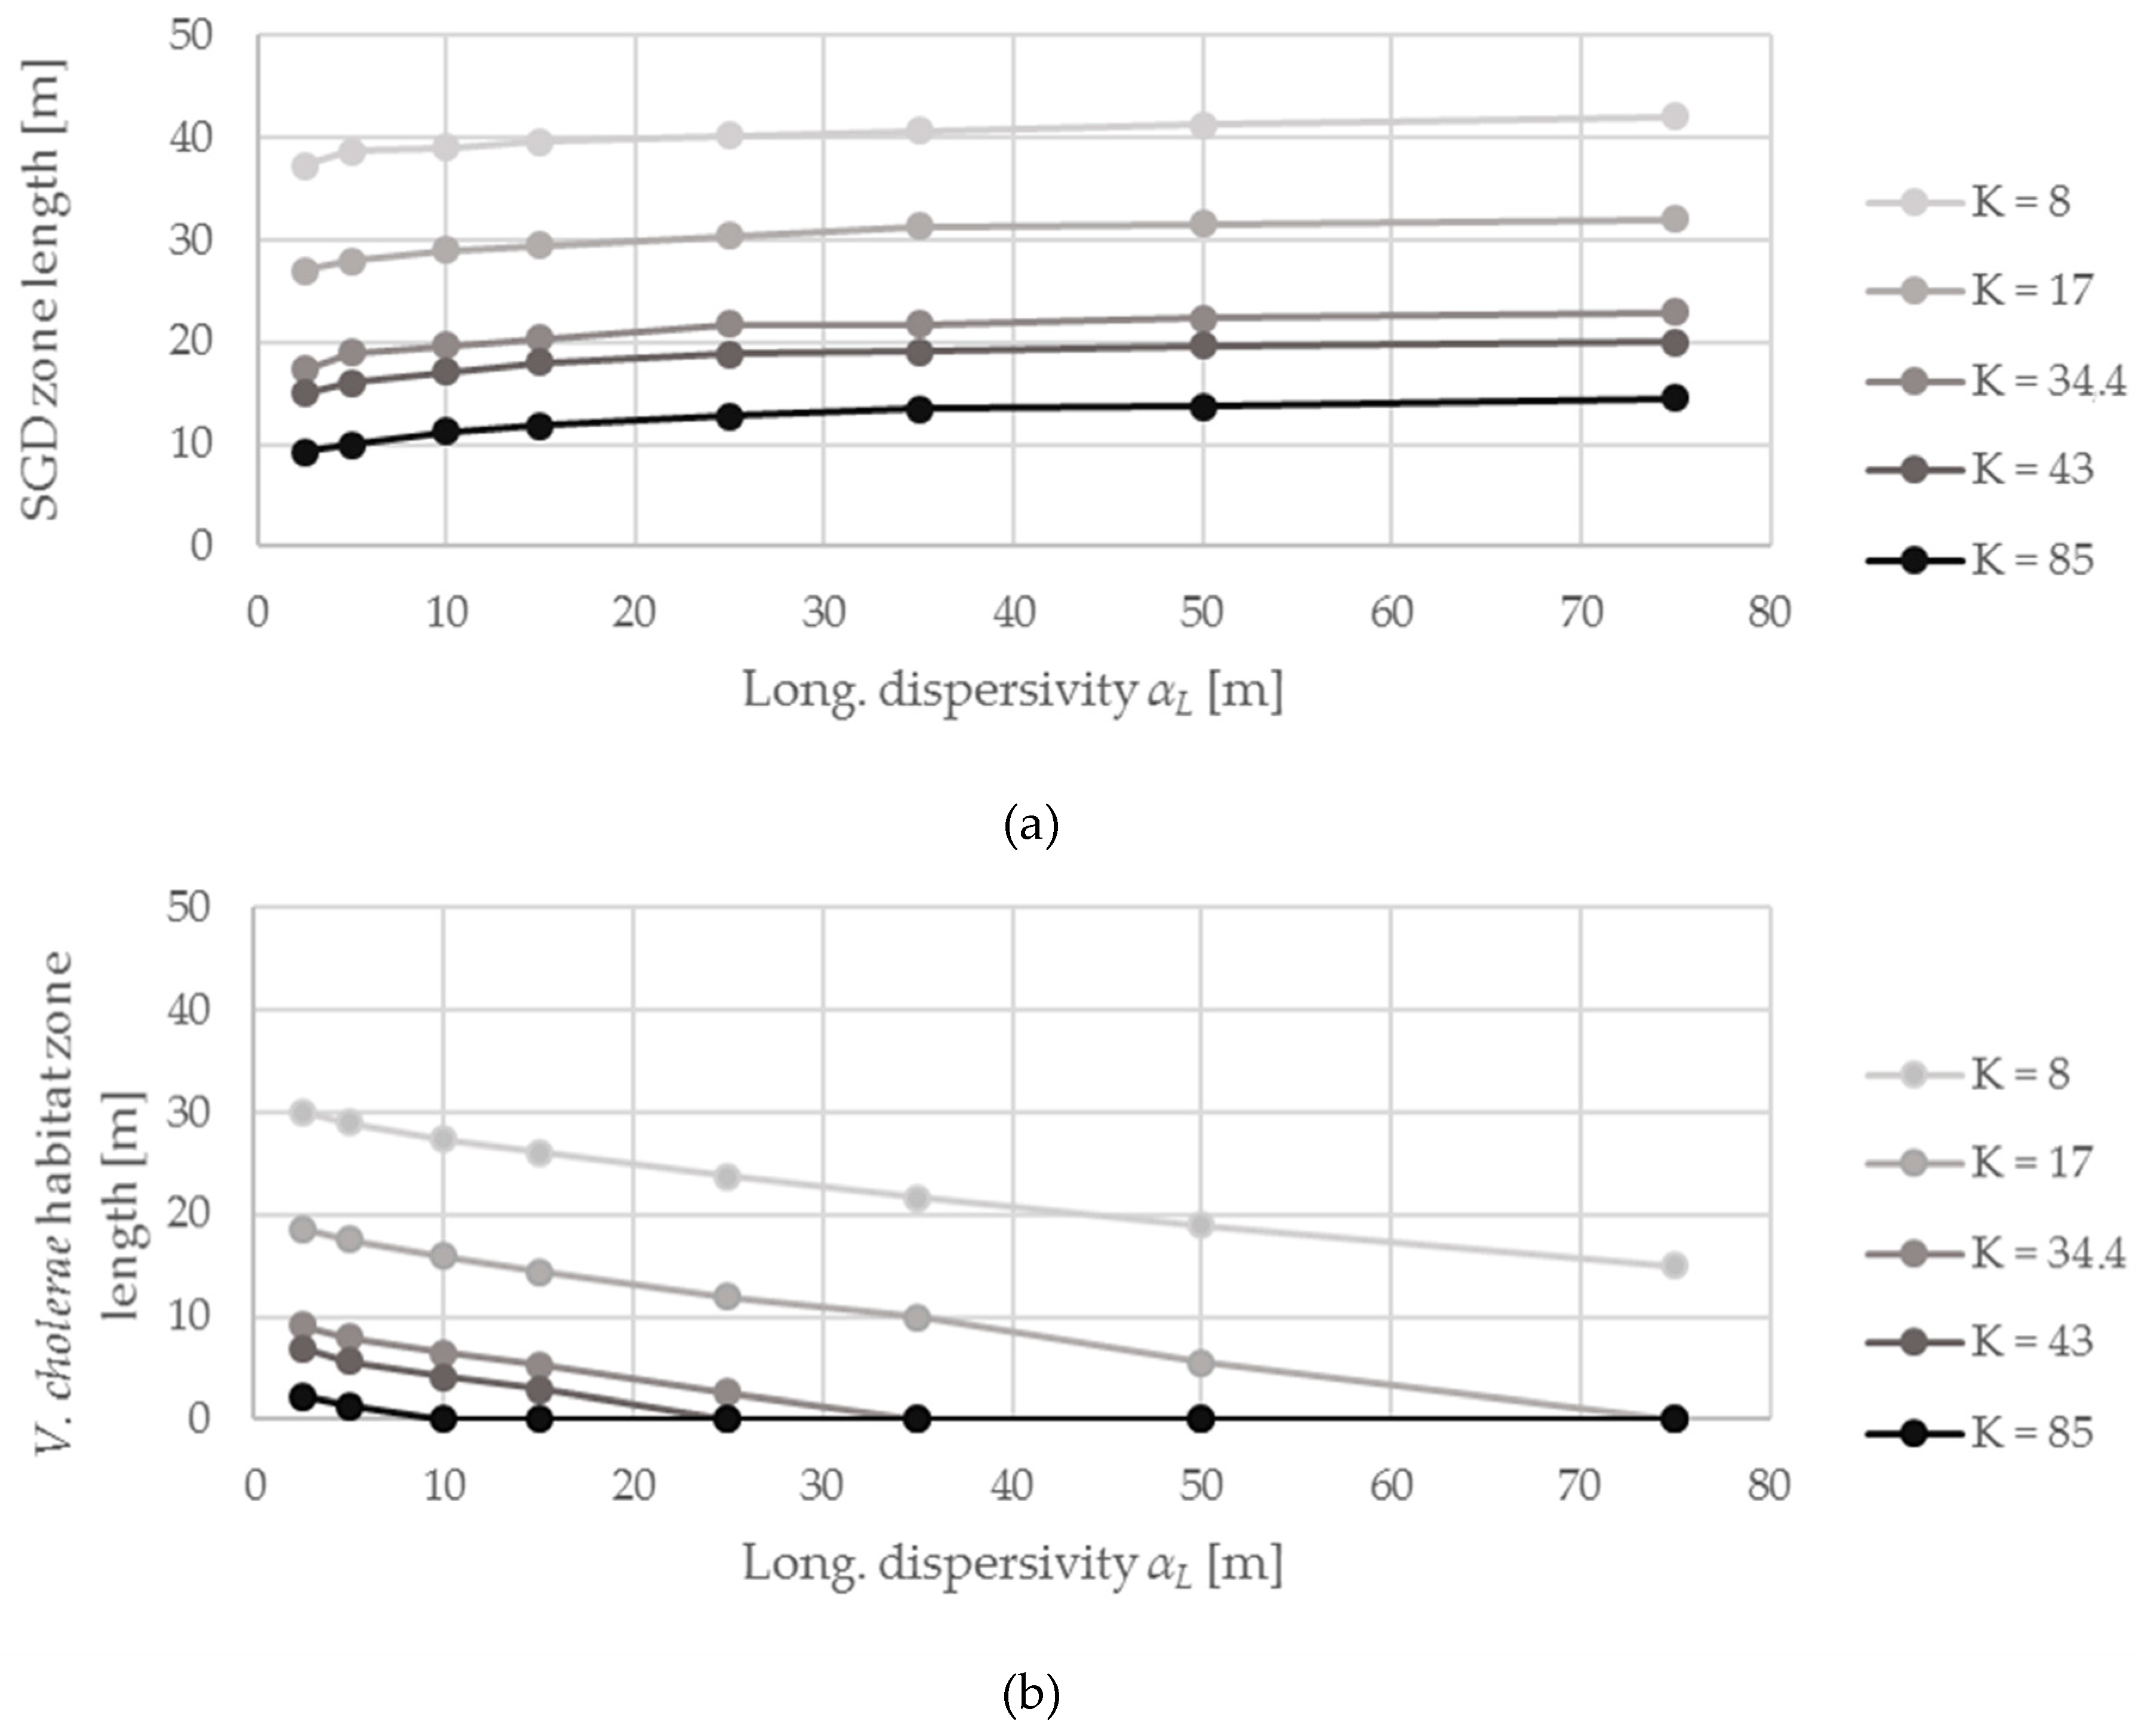
Figure 8.
(a) Length of SGD zones and (b) V. cholerae zones plotted against the coastal slope angle tan(β). Each differently colored data series reflects a hydraulic conductivity value K [m d−1].
Figure 8.
(a) Length of SGD zones and (b) V. cholerae zones plotted against the coastal slope angle tan(β). Each differently colored data series reflects a hydraulic conductivity value K [m d−1].


Table 1.
Parameters and related values that varied or remained constant throughout the simulations. The density ratio corresponds to assumptions made in [50].
Table 1.
Parameters and related values that varied or remained constant throughout the simulations. The density ratio corresponds to assumptions made in [50].
| Varying Parameter | Symbol | Unit | Value |
| Groundwater inflow | qX | m d−1 | 0.07; 0.17; 0.4; 0.8; 1.3 [12,51] |
| Hydr. conductivity | K | m d−1 | 8; 17; 34.4; 43; 85 [36,38,52,53,54] |
| Long. dispersivity | αL | m | 2.5; 5; 10; 15; 25; 35; 50; 75 [12,55] |
| Trans. dispersivity | αT | m | αL × 0.1 [12,55] |
| Coastal slope angle | β | ° | 0; 11.3; 28.1; 53.8; 69.7; 76.1 |
| Constant Parameter | Symbol | Unit | Value |
| Porosity aquifer | ϕS | – | 0.3 [56,57] |
| Salinity groundwater | CF | mg L−1 | 100 [44] |
| Salinity seawater | CS | mg L−1 | 35000 [44] |
| Density groundwater | ρF | kg m−3 | 1000 [58] |
| Density seawater | ρS | kg m−3 | 1026 [58] |
| Density ratio | d | – | 0.026 |
| Molecular diffusion coefficient | DM | m2 s−1 | 1 × 10⁻⁹ [58] |
© 2019 by the authors. Licensee MDPI, Basel, Switzerland. This article is an open access article distributed under the terms and conditions of the Creative Commons Attribution (CC BY) license (http://creativecommons.org/licenses/by/4.0/).
Share and Cite
MDPI and ACS Style
Vollberg, F.; Walther, M.; Gärdes, A.; Moosdorf, N. Modeling the Potential of Submarine Groundwater Discharge to Facilitate Growth of Vibrio cholerae Bacteria. Hydrology 2019, 6, 39. https://doi.org/10.3390/hydrology6020039
AMA Style
Vollberg F, Walther M, Gärdes A, Moosdorf N. Modeling the Potential of Submarine Groundwater Discharge to Facilitate Growth of Vibrio cholerae Bacteria. Hydrology. 2019; 6(2):39. https://doi.org/10.3390/hydrology6020039
Chicago/Turabian StyleVollberg, Felix, Marc Walther, Astrid Gärdes, and Nils Moosdorf. 2019. "Modeling the Potential of Submarine Groundwater Discharge to Facilitate Growth of Vibrio cholerae Bacteria" Hydrology 6, no. 2: 39. https://doi.org/10.3390/hydrology6020039
Note that from the first issue of 2016, this journal uses article numbers instead of page numbers. See further details here.