Article

How Surface Radiation on Forested Snowpack Changes across a Latitudinal Gradient

by
Bijan Seyednasrollah
1,2,3,* and
Mukesh Kumar
4
1
Department of Organismic and Evolutionary Biology, Harvard University, Cambridge, MA 02138, USA
2
School of Informatics, Computing, and Cyber Systems, Northern Arizona University, Flagstaff, AZ 86011, USA
3
Center for Ecosystem Science and Society, Northern Arizona University, Flagstaff, AZ 86011, USA
4
Department of Civil, Construction and Environmental Engineering, University of Alabama, Tuscaloosa, AL 35401, USA
*
Author to whom correspondence should be addressed.
Hydrology 2019, 6(3), 62; https://doi.org/10.3390/hydrology6030062
Submission received: 23 June 2019 / Revised: 16 July 2019 / Accepted: 19 July 2019 / Published: 22 July 2019
(This article belongs to the Special Issue Snow Hydrology: Monitoring and Modelling)

Abstract

:
Radiation is the major driver of snowmelt, and, hence, its estimation is critically important. Net radiation reaching the forest floor is influenced by vegetation density. Previous studies in mid-latitude conifer forests have confirmed that net radiation decreases and then subsequently increases with increasing vegetation density, for clear sky conditions. This leads to the existence of a net radiation minimum at an intermediate vegetation density. With increasing cloud cover, the minimum radiation shifts toward lower densities, sometimes resulting in a monotonically increasing radiation with vegetation density. The net radiation trend, however, is expected to change across sites, affecting the magnitude and timing of individual radiation components. This research explores the variability of net radiation on a snow-covered forest floor for different vegetation densities along a latitudinal gradient. We especially investigate how the magnitude of minimum/maximum radiation and the corresponding vegetation density change with the site geographical location. To evaluate these, the net radiation is evaluated using the Forest Radiation Model at six different locations in predominantly white spruce (Picea glauca) canopy cover across North America, ranging from 45 to 66° N latitudes. Results show that the variation of net radiation with vegetation density considerably varies with latitude. In higher latitude forests, the magnitude of net radiation is generally smaller, and the minimum radiation is exhibited at relatively sparser vegetation densities, under clear sky conditions. For interspersed cloudy sky conditions, net radiation non-monotonically varies with latitude across the sites, depending on the seasonal sky cloudiness and air temperature. The latitudinal sensitivity of net radiation is lower on north-facing hillslopes than on south-facing sites.

1. Introduction

Seasonal snow is an important natural water storage reservoir for most of the western United States and many other regions of the world. It supports majority of the western US water supply [1] and more than one-sixth of the Earth’s population [2]. In addition to providing water for municipal and agricultural needs, snowmelt streamflow is also crucial for supporting hydropower, recreation, and ecosystems [3,4]. Snow melt also influences a range of coupled hydrologic states and fluxes including the soil moisture, runoff, ground water recharge and the streamflow [5,6]. Given that a large fraction of snow falls in forested settings, it is important to estimate the net snowcover radiation on the forest floor ( NSRF ), as well as the primary control on the rate and timing of snowmelt in forested regions [7,8,9].
The estimation of the NSRF depends on the accurate evaluation of shortwave radiation, S Net , (direct, diffuse and reflected from snow and canopy) and longwave radiation, L Net , (from tree crown, trunk, sky and snow) components [10,11,12,13,14,15]. Both S Net and L Net radiation components are dependent on vegetation density. With increasing vegetation density, shading fraction on the forest floor increases, and, hence, S Net decreases. On the other hand, as vegetation density increases, the portion of incoming longwave radiation from tree crown and trunk increases, and consequently, L Net increases [16]. Because of the opposing trends in variation of S Net and L Net with vegetation density, a minimum NSRF ( NSRF min ) may be exhibited at moderate vegetation densities in coniferous forests at daily [17] and seasonal scales [16]. Similar behavior has been reported based on empirical model results in lodgepole pine forests at ~39 °N latitude [18]. The variation of the NSRF with vegetation density, however, is influenced by a swath of factors including the slope and aspect of the forest floor [16,19], climatological characteristics [20], and tree morphometric characteristics such as tree height and crown’s shape, radius, and depth [21]. For a wide range of vegetation densities, net radiation increases with an increasing hillslope angle, and the minimum radiation occurs at higher vegetation densities. On the other hand, both the NSRF and the density at which radiation is minimum decreases with the orientation of hillslope changing from south- to north-facing [16]. The effect of tree morphometry on the variability of the NSRF with vegetation density is also significant. Taller trees, larger and denser crowns, and cylindrical shaped crowns exhibit lower net snowcover radiation on the forest floor at intermediate vegetation densities and exhibit larger radiation at high vegetation densities. The optimum vegetation density at which the NSRF is minimum decreases with increasing tree height, crown radius and crown density. On the other hand, a larger crown depth leads to an increase in the vegetation density at which radiation is minimum [21].
The location-dependent variability of the NSRF with changing vegetation densities is still unknown. The location of forests is expected to influence the variability in the NSRF with vegetation density by influencing both shortwave and longwave radiation components. At higher latitudes, solar altitude angle decreases, causing the shortwave radiation to decrease. Additionally, both L Net and S Net are affected by site-specific climatological characteristics, e.g., air temperature [20], canopy temperature [22], relative humidity [23], and cloud cover. This paper quantifies the effects of location of forest on the magnitude of net radiation reaching the floor and its variations with changing vegetation density. To this end, simulations were performed for a wide range of vegetation densities using the Forest Radiation Model [16], at six mid to high latitude locations in white spruce (Picea glauca) forests in North America.

2. Materials and Methods

The physically-based Forest Radiation Model (FoRM; Seyednasrollah [24]) was used in this study to map the location-dependent variations in the NSRF with changing vegetation densities. The model has the ability to simulate the spatial and temporal gradients of the individual radiation components over a uniformly distributed infinite extent of trees. Though the model can calculate radiation for different tree shapes, the analysis here was restricted to cylindrically-shaped white spruce trees, a widely prevalent conifer in mid-latitudes of North America. White spruce trees are widespread across northern North America (Figure 1), extending from Alaska, Yukon, and British Columbia, and continuing eastward to Nova Scotia, Newfoundland, New Brunswick, Québec, and Maine and Vermont in the northeastern United States (see www.plantmaps.com and plants.usda.gov). White spruce can grow up to 27 m in height and 6 m in width [25]. While we acknowledge the intra-species differences in tree morphometry across locations, in this analysis, we considered a typical tree size (crown radius of 3 m and tree height of 24 m) to keep the focus on the role of exogenous variables such as vegetation density and location on the NSRF .

2.1. Radiation Calculations in FoRM
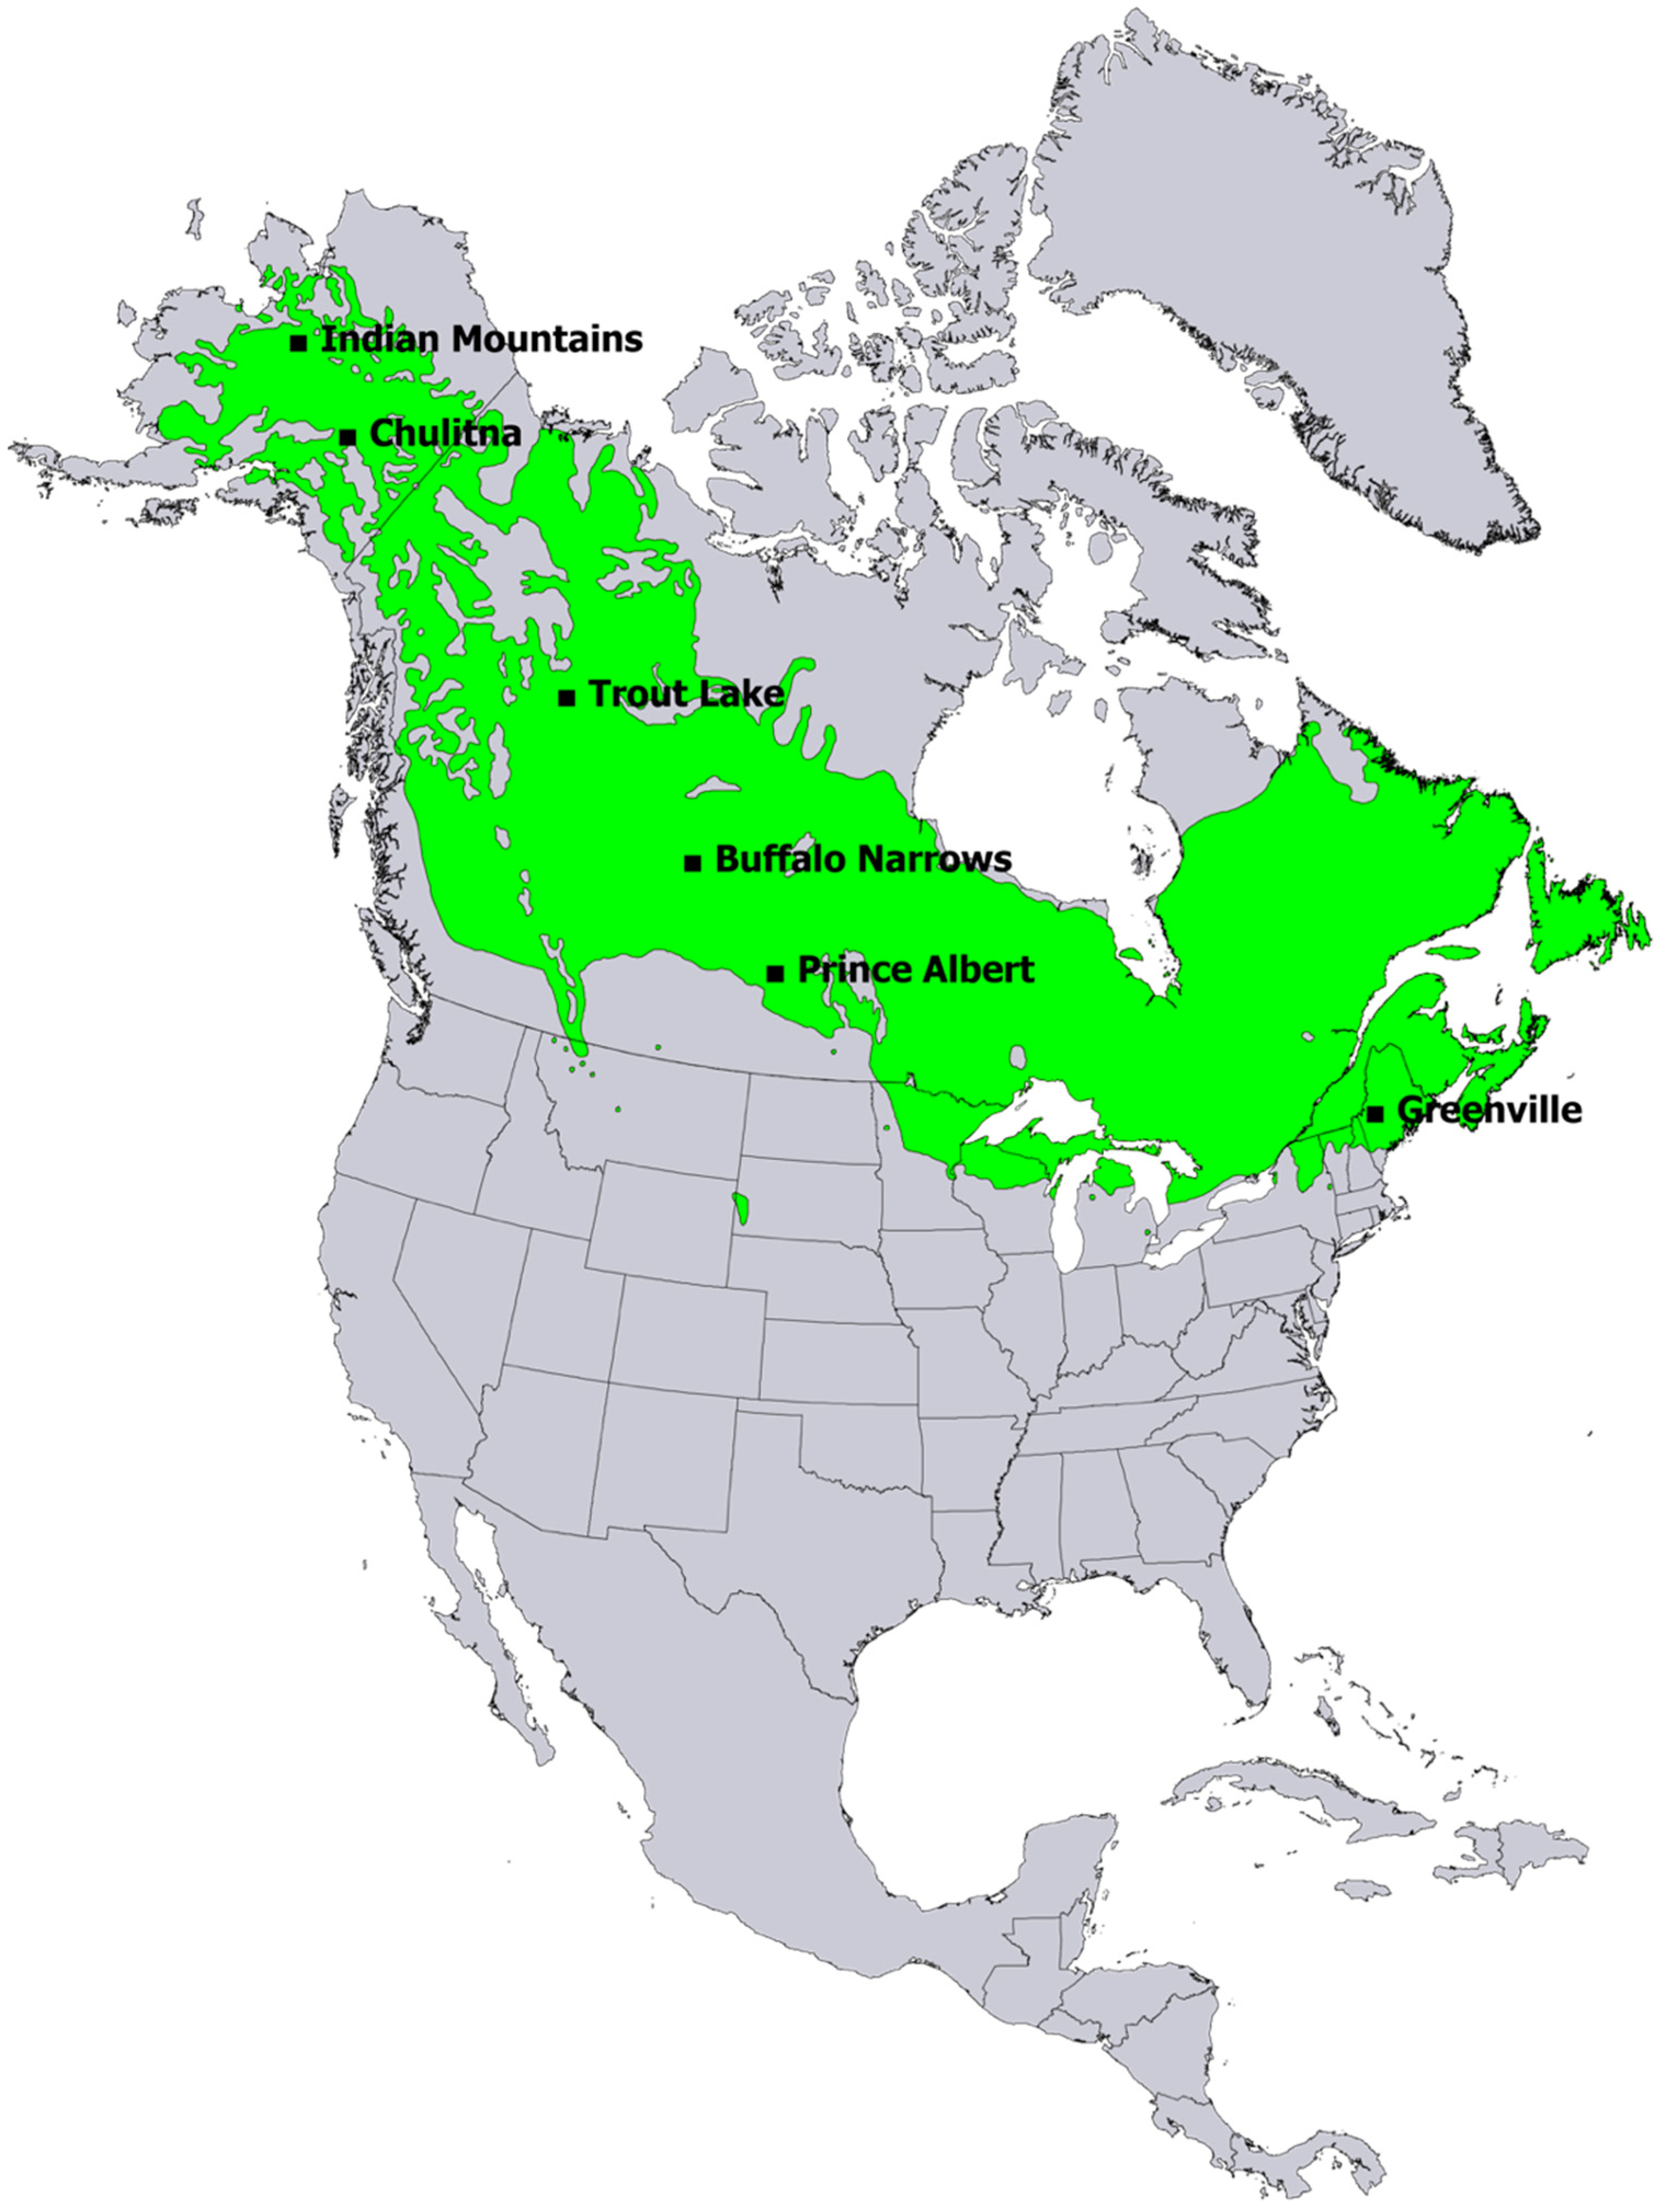
The NSRF was calculated from the beginning ( t 1 ) to the end ( t 2 ) of the snow season:
NSRF = t 1 t 2 A R Net   dA   dt ( t 2 t 1 ) A ,
where   A is area of forest floor control volume and R Net is net radiation flux on the forest floor. R Net was evaluated for a snow season that ranges from winter ( t 1 ) to summer ( t 2 ) solstices. The period conservatively overspreads the entire duration of a snow season in white spruce habitat. R Net was modeled as the sum of the net longwave ( L Net ) and net shortwave ( S Net ) energy components:
R Net = L Net + S Net
L Net was evaluated by calculating the sum of incoming longwave emissions from tree crown ( L crown ), trunk ( L trunk ), and sky ( L sky ) and the emitted longwave radiation from snow ( L snow ) as:
L Net = L sky + L trunk + L crown L snow = SVF   σ ε sky T sky 4 + TVF   σ ε can T trunk 4 + ( 1 SVF TVF ) σ ε can T crown 4 σ ε snow T snow 4
where σ is the Stefan–Boltzmann constant ( σ   = 5.67 × 10⁻⁸   Wm 2 K 4 ); ε sky , ε can , and ε snow are sky, canopy, and snow emissivity values (dimensionless), respectively; and T sky , T crown , T trunk , and T snow are sky, crown, trunk and snow temperatures (K). T sky was set to air temperature [26]. T sky for the simulated snow season was obtained by fitting a periodic function to long term air temperature data (Table 2) from the National Climatic Data Center (NCDC) (www.ncdc.noaa.gov) meteorological stations, such that both diurnal and seasonal variations were accounted for. Snow temperature was set to the dew point temperature ( T dp ), when T dp < 0 and zero otherwise [27]. Due to the absence of data from underneath the canopy, we used the dew point temperature from the weather stations that are located in open settings. Notably this could have been slightly different than the dew point temperature underneath the canopy, given the differences in micrometeorology [28,29]. In the absence of tree crown and trunk temperature data, respective temperatures were obtained by regressing the difference in observed air and crown/trunk temperatures that were presented in Pomeroy, Marks, Link, Ellis, Hardy, Rowlands and Granger [10] against simulated net incident solar radiation. This assumed that the difference in canopy (crown and trunk) and air temperature was mostly driven by incident solar radiation. The emissivity of the snow and canopy (both crown and trunk) were set to 1.0 [11,30,31] and 0.98 [10], respectively. Sky emissivity ( ε sky ) was evaluated using the Prata–Kimball model [32,33], which was suggested by Flerchinger, et al. [34] as one of the more reliable models for the evaluation of sky emissivity under clear and cloudy sky conditions. Average daily cloud cover, which was used for the evaluation of ε sky , was obtained from the National Renewable Energy Laboratory (www.nrel.gov) data for sites located in the United States and the Canadian Weather Energy and Engineering Datasets (climate.weather.gc.ca) for sites located in Canada. These datasets are also provided in the Supplementary Materials. Other relevant meteorological variables, such as relative humidity, were obtained from NCDC data (www.ncdc.noaa.gov). Net shortwave radiation, S Net , was evaluated by quantifying the incoming direct ( S dir ), diffuse ( S dif ), and multiple reflected shortwave radiation components between snow and canopy using [16]:
S Net = S extr ( P ( θ ,   Z )   ( 1 α dir ) τ b cos   θ 1 α dir α c ( 1 SVF ) + SVF   ( 1 α dif ) τ d   cos   ϕ   cos 2 ( β / 2 ) 1 α dif α c ( 1 SVF ) )
where S extr is extraterrestrial radiation; α dir , α dif and α c are direct, diffuse snow albedos and canopy albedo; τ b and τ d are atmospheric transmittance for beam and diffuse radiation, ϕ , θ and Z are solar zenith, incidence (the angle between the sun and normal to the surface) and azimuth angles, respectively; SVF is local sky view factor; and P is the probability that a ray is not blocked by forest. Snow albedo has a spectral variation from 0 to 0.8 depending on snow age, grain size, and wavelength [35,36]. An intermediate value of 0.4, representative of the seasonal albedo for direct shortwave radiation in forested settings [37], was used. Snow albedo for diffuse radiation, α dif , was set equal to 0.8 [38]. Canopy (crown and trunk) albedo was relatively smaller and was set to be 0.2 [8,39,40]. P was evaluated by a probabilistic ray tracing approach which accounted for the path length of the solar beam through individual canopy structures. Sky view factor, SVF , was estimated using the SkyMap algorithm. More details about the calculation of individual radiation components are available in [16,21].

2.2. Study Areas

Six white spruce forest sites distributed across the United States and Canada were selected to study the variability of net radiation for different vegetation densities along a latitudinal gradient (see Figure 1). The selection of sites was made based on three criteria: (a) Situated in white spruce forests, (b) located in mid to high latitudes (see Table 1), and (c) sites should have long-term temperature records (see Table 2). Model simulations were performed for two representative snow season scenarios at all the six study sites. The first scenario considered a snow season with hypothetical clear sky conditions. The second scenario was more realistic and accounted for interspersed cloudy conditions based on the observational data at the study sites.
Seasonal air temperature data suggested a decreasing trend in air temperature for higher latitudes. However, the Chulitna site did not follow this trend. The climatological characteristics of the study sites are presented in Table 2.

3. Results and Discussion

The variability of both S Net and L Net with vegetation density were simulated by the FoRM at all the six study sites for a range of slope angles and orientations. Vegetation density was quantified as d 1 , where d was the average distance between trees in an idealized uniform forest. It is to be emphasized that the model has been previously validated against the observed shortwave and longwave radiation data in a uniform lodgepole pine forest at the Local Scale Observation Site (LSOS, https://nsidc.org/data/clpx) in Fraser, CO, USA [16]. Additionally, the modeled above-canopy direct and diffuse shortwave radiation components were previously validated against observed radiation data at Millinocket, ME [16]. By using the same configuration of forest at different locations, the role of latitudinal location and associated meteorological characteristics on variation of the NSRF with changing vegetation density was isolated.

3.1. Effects of Latitudinal Location and Meteorological Characteristics on Net Shortwave Radiation Reaching the Forest Floor

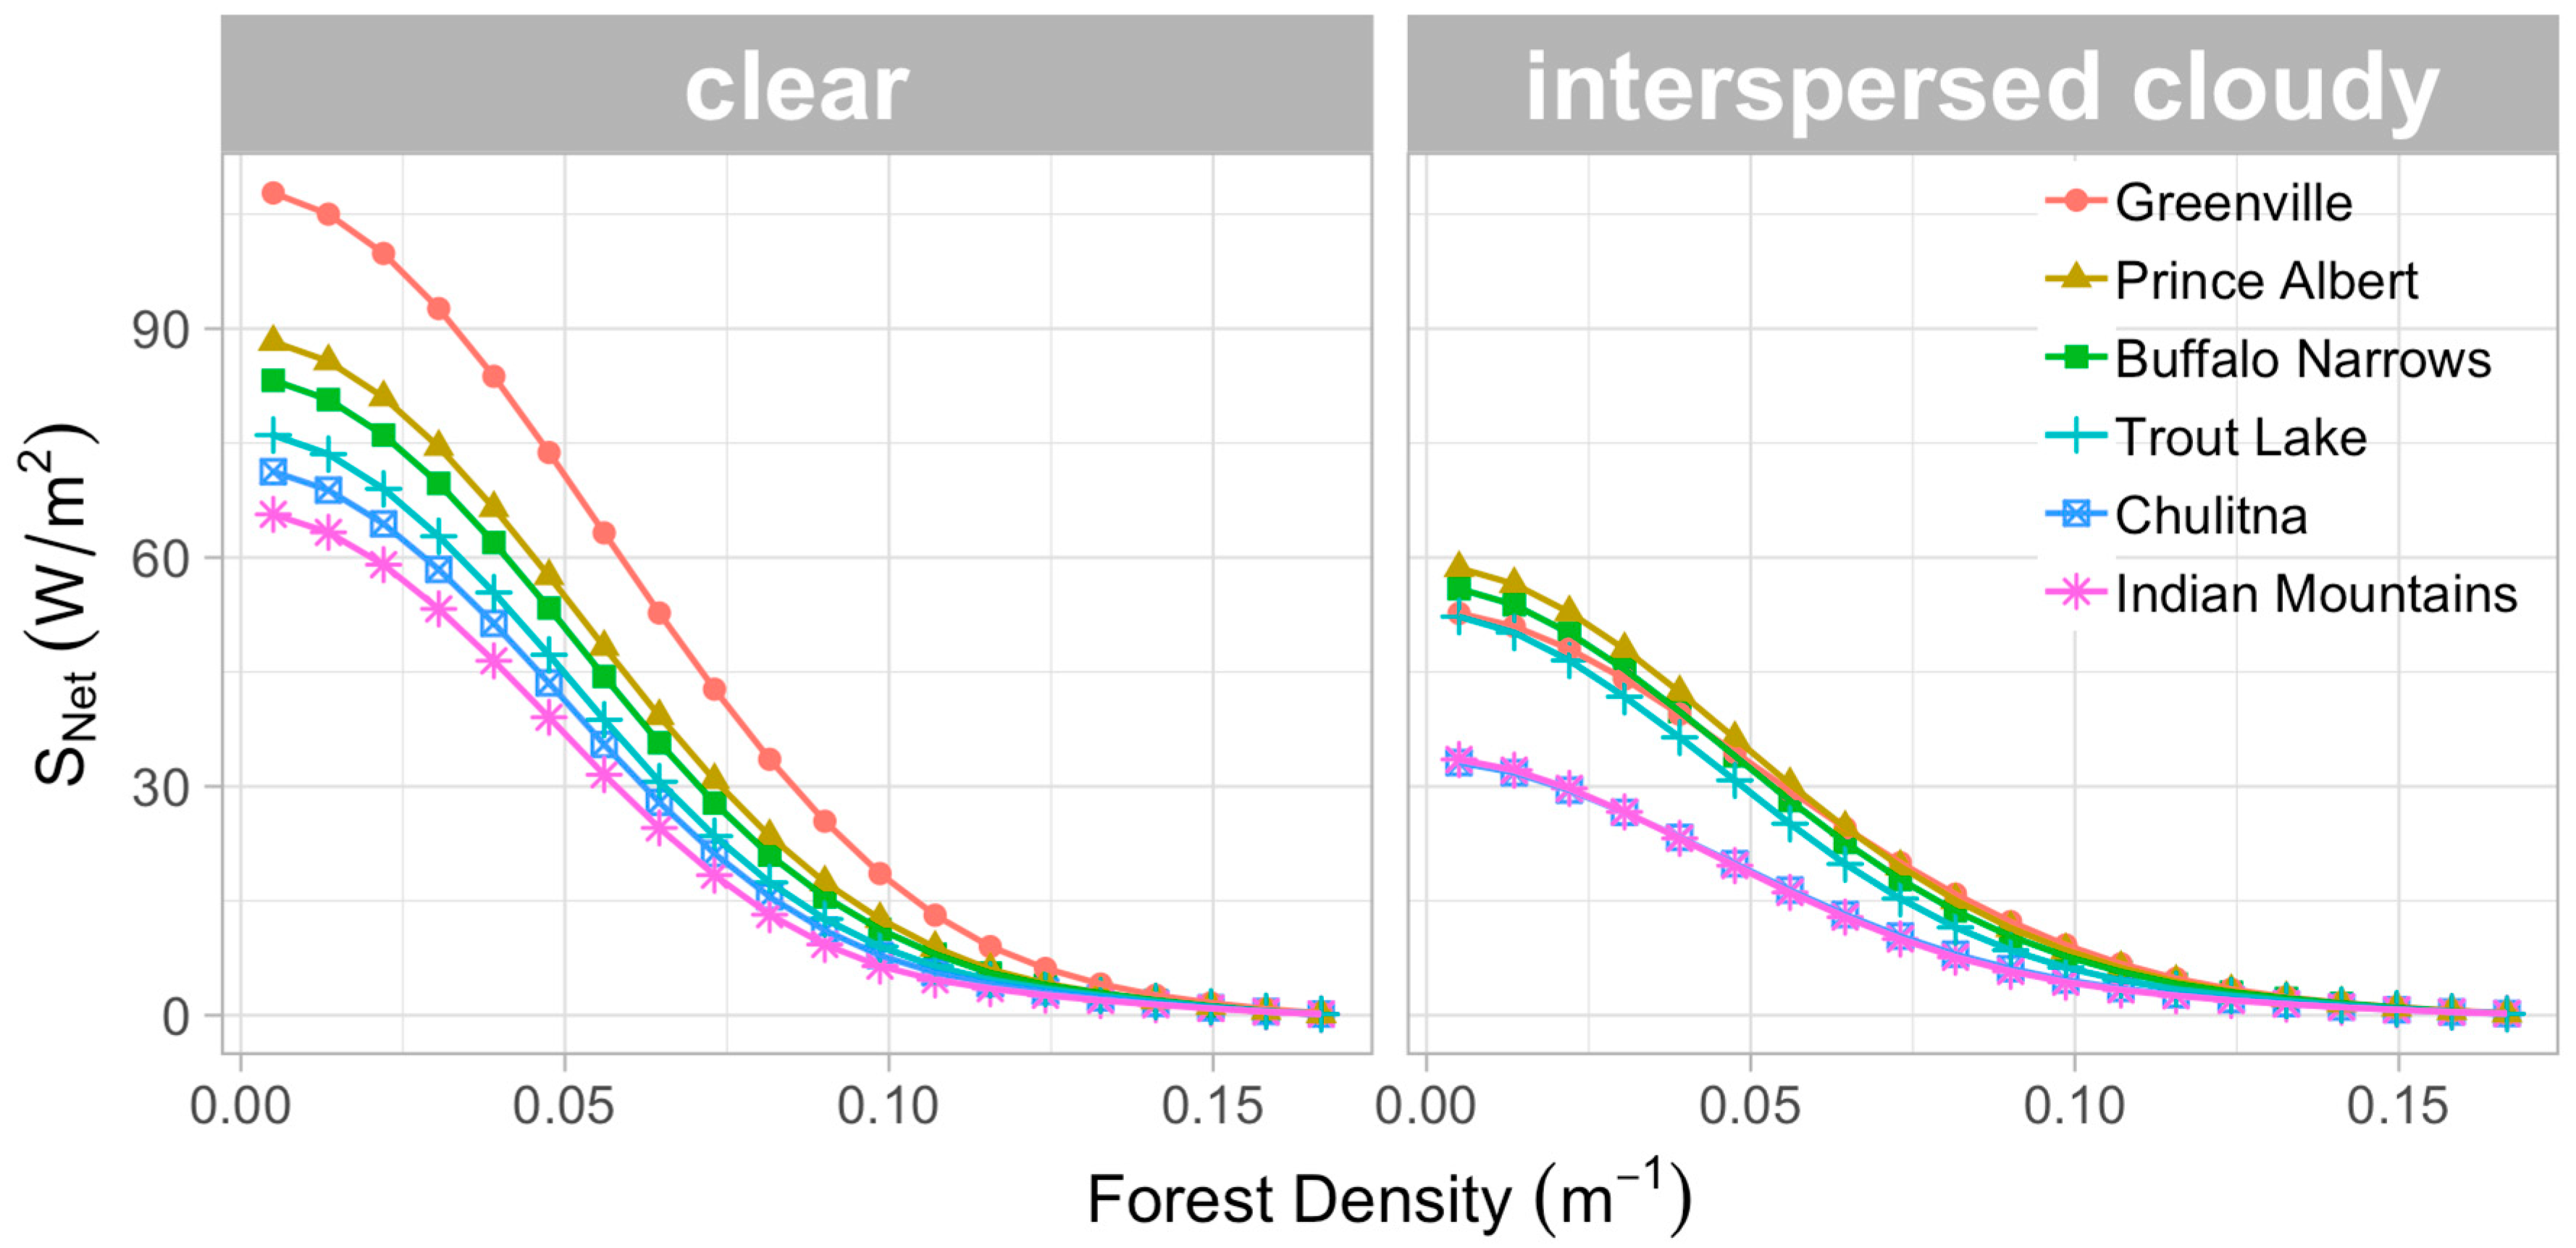
3.1.1. On a Level Forest Floor

In the northern hemisphere, solar altitude angle decreases in higher latitudes, resulted in the reduction of net shortwave radiation. This is evident in the monotonically decreasing trend in net shortwave radiation with an increase in latitude at all considered vegetation densities in clear sky conditions (Figure 2—left). On the other hand, for snow seasons with interspersed cloudy sky conditions, comparative differences in S Net between locations were also influenced by differences in sky cover and its seasonal variation at the study sites. With increasing sky cloudiness, the incoming direct shortwave radiation declines [41], whereas the diffuse portion of shortwave radiation increases because of enhanced scattering [42]. Since the decrease in direct radiation is generally much more than the increase in the diffuse component, S Net decreases with increase in cloud cover [43]. As a result, all study sites were found to receive less amounts of shortwave radiation in interspersed cloudy sky conditions than in clear sky conditions. The decrease in shortwave radiation was generally observed to be proportional to sky cloud fraction, which translated to larger decrease in S Net for sites with larger cloud fraction. However, the variation of S Net with sky cloudiness was not always linear, as the magnitude of decrease in S Net with sky cloudiness was also influenced by site elevation, local atmospheric turbidity, aerosols concentration, the temporal variation of sky cloudiness over the season, and uncertainties associated with the sources of data. This is consistent with the findings from small-scale observational studies investigating variability of solar radiation in high latitude sparse forests [44]. For instance, S Net at Greenville ( C ≈ 56%) declined to about 61% of its magnitude in clear sky conditions, while at Prince Albert ( C ≈ 53%), S Net reduced to about 80% of its magnitude in clear sky conditions. Additionally, because of the influence of multiple controls during interspersed cloudy sky conditions, S Net did not always show a monotonic trend with either latitude or sky cover fraction. For example, in open areas to low vegetation densities ( d 1 < 0.04 m 1 ) where direct shortwave radiation was the dominant shortwave component, the largest shortwave radiation was observed at Prince Albert ( C ≈ 53%) followed by Buffalo Narrows ( C ≈ 53%), the two locations that exist at relatively low latitudes and also where sky cover fraction was relatively small. Net shortwave radiation was observed to be less in Greenville ( C ≈ 56%) and Trout Lake ( C ≈ 51%) than in Buffalo Narrows. In contrast, the two high latitude sites, Indian Mountains and Chulitna, with high seasonal cloud cover ( C ≈ 68–69%) expressed the smallest net shortwave radiation for all considered vegetation densities (Figure 2—right).
For intermediate to high vegetation densities (0.04 m 1 < d 1 < 0.13 m 1 ) where the diffuse radiation gradually became the principal portion of net shortwave radiation reaching the forest floor, the decrease in S dir with sky cover across sites was balanced out by the increase in S dif . As a result, the trend of S Net with latitude at these vegetation densities followed the same trend that exist in snow seasons with completely clear sky conditions, with largest magnitude observed at Greenville, followed by Prince Albert, Buffalo Narrows, Trout Lake, and Chulitna and Indian Mountains, respectively. In very high vegetation densities ( d 1 > 0.13 m 1 ), S Net became very small at all study sites with no significant difference between locations.

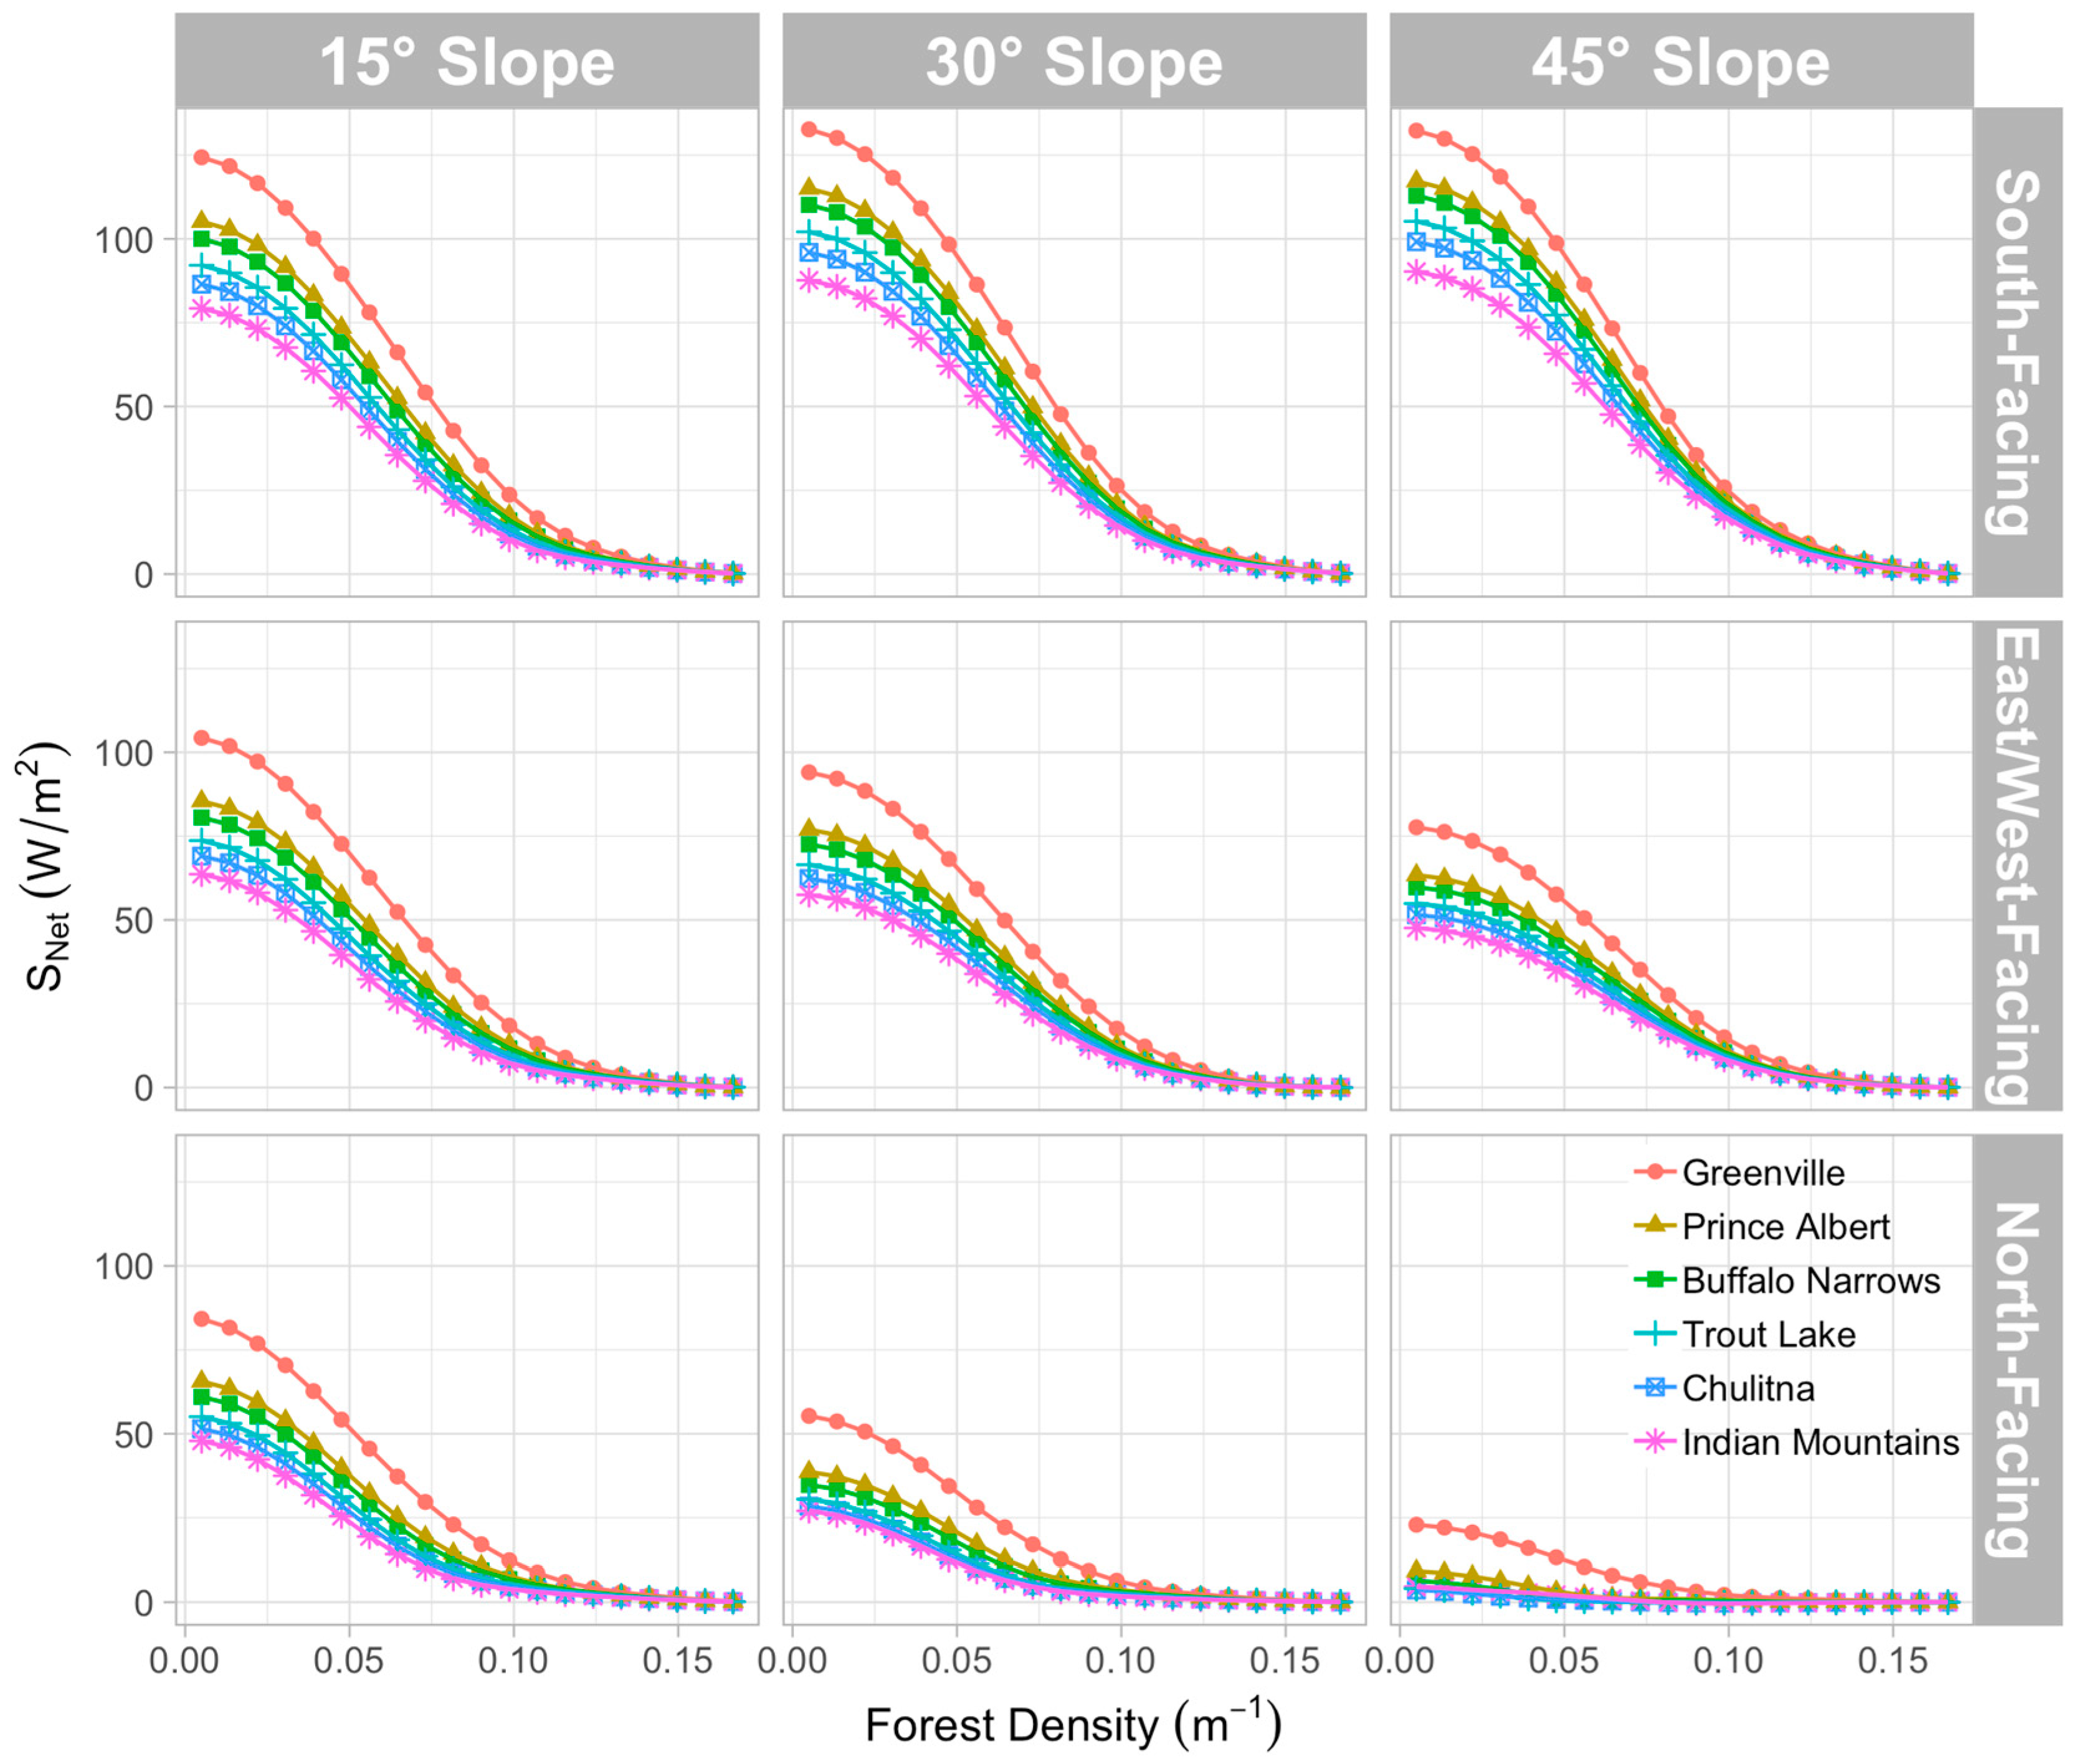
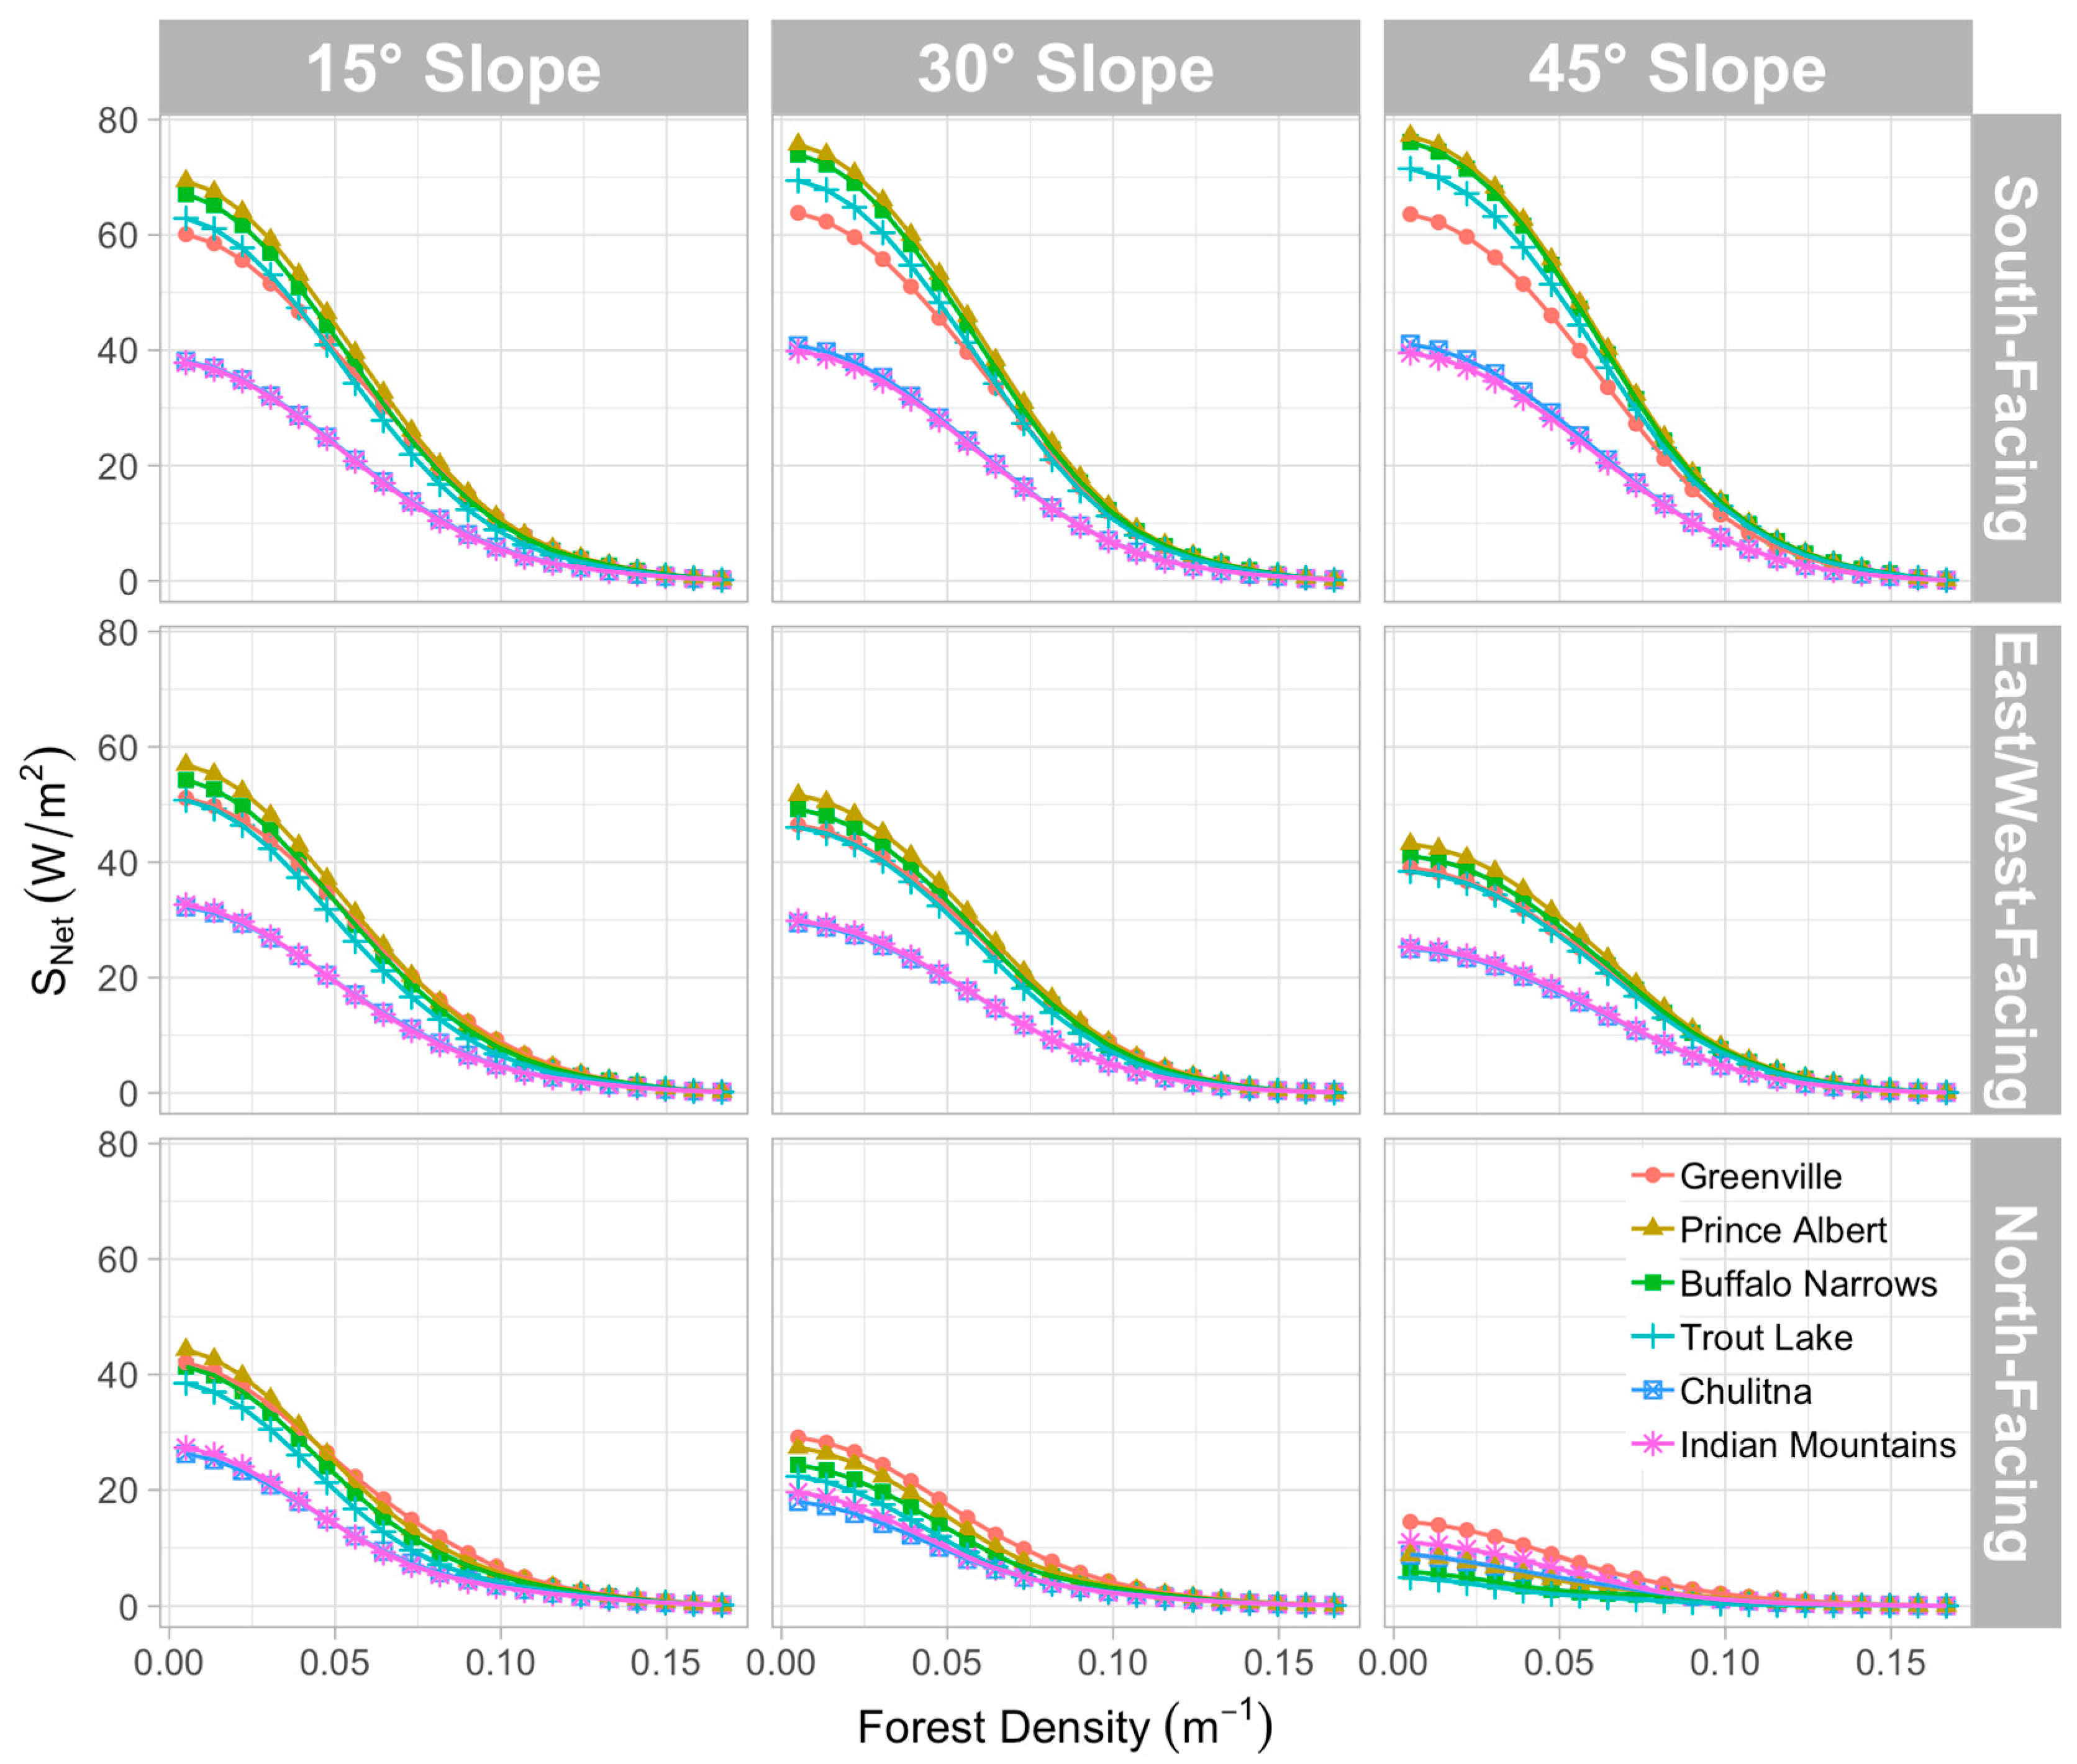
3.1.2. On a Sloping Forest Floor

Latitudinal influence on variation of net radiation with vegetation density changed with slope angle and aspect of the forested hillslope. For clear sky conditions, S Net on an inclined hillslope showed a similar trend in its variability across different locations as was expressed in level forests (see Figure 3). The only marked difference in the shortwave radiation regime on inclined slopes, with respect to level forests, was the increase in magnitude of direct shortwave radiation with slope angle for south-facing slopes, especially at lower vegetation densities. This was mainly due to: (a) The decrease in solar incidence angle (the angle between the sun and normal to the surface) and (b) the decrease in shading fraction for steeper hillslopes [16]. Along similar lines, changes in the orientation of the hillslope from south-facing to north-facing reduced S Net , because of a continuous increase in solar incidence angle and a shading fraction for north-ward slopes. The decrease in shortwave radiation was much more at lower vegetation densities, where direct shortwave radiation was relatively significant than at higher vegetation densities.
For the snow season with interspersed cloudy sky conditions (Figure 4), the increase in S Net with slope angle on south facing slopes was larger at sites with smaller seasonal sky cover. On north-facing hillslopes with interspersed cloudy sky conditions in the snow season, the decrease in S Net with slope angle was also larger at sites with smaller seasonal sky cover (Prince Albert, Buffalo Narrows and Trout Lake; see Figure 4). While the focus of this paper was restricted to quantification of snowmelt radiation, the variability in solar radiation with slope, aspect and latitude are likely to have implications on the energy and water cycle of the understory in mid to high latitude forests [45].

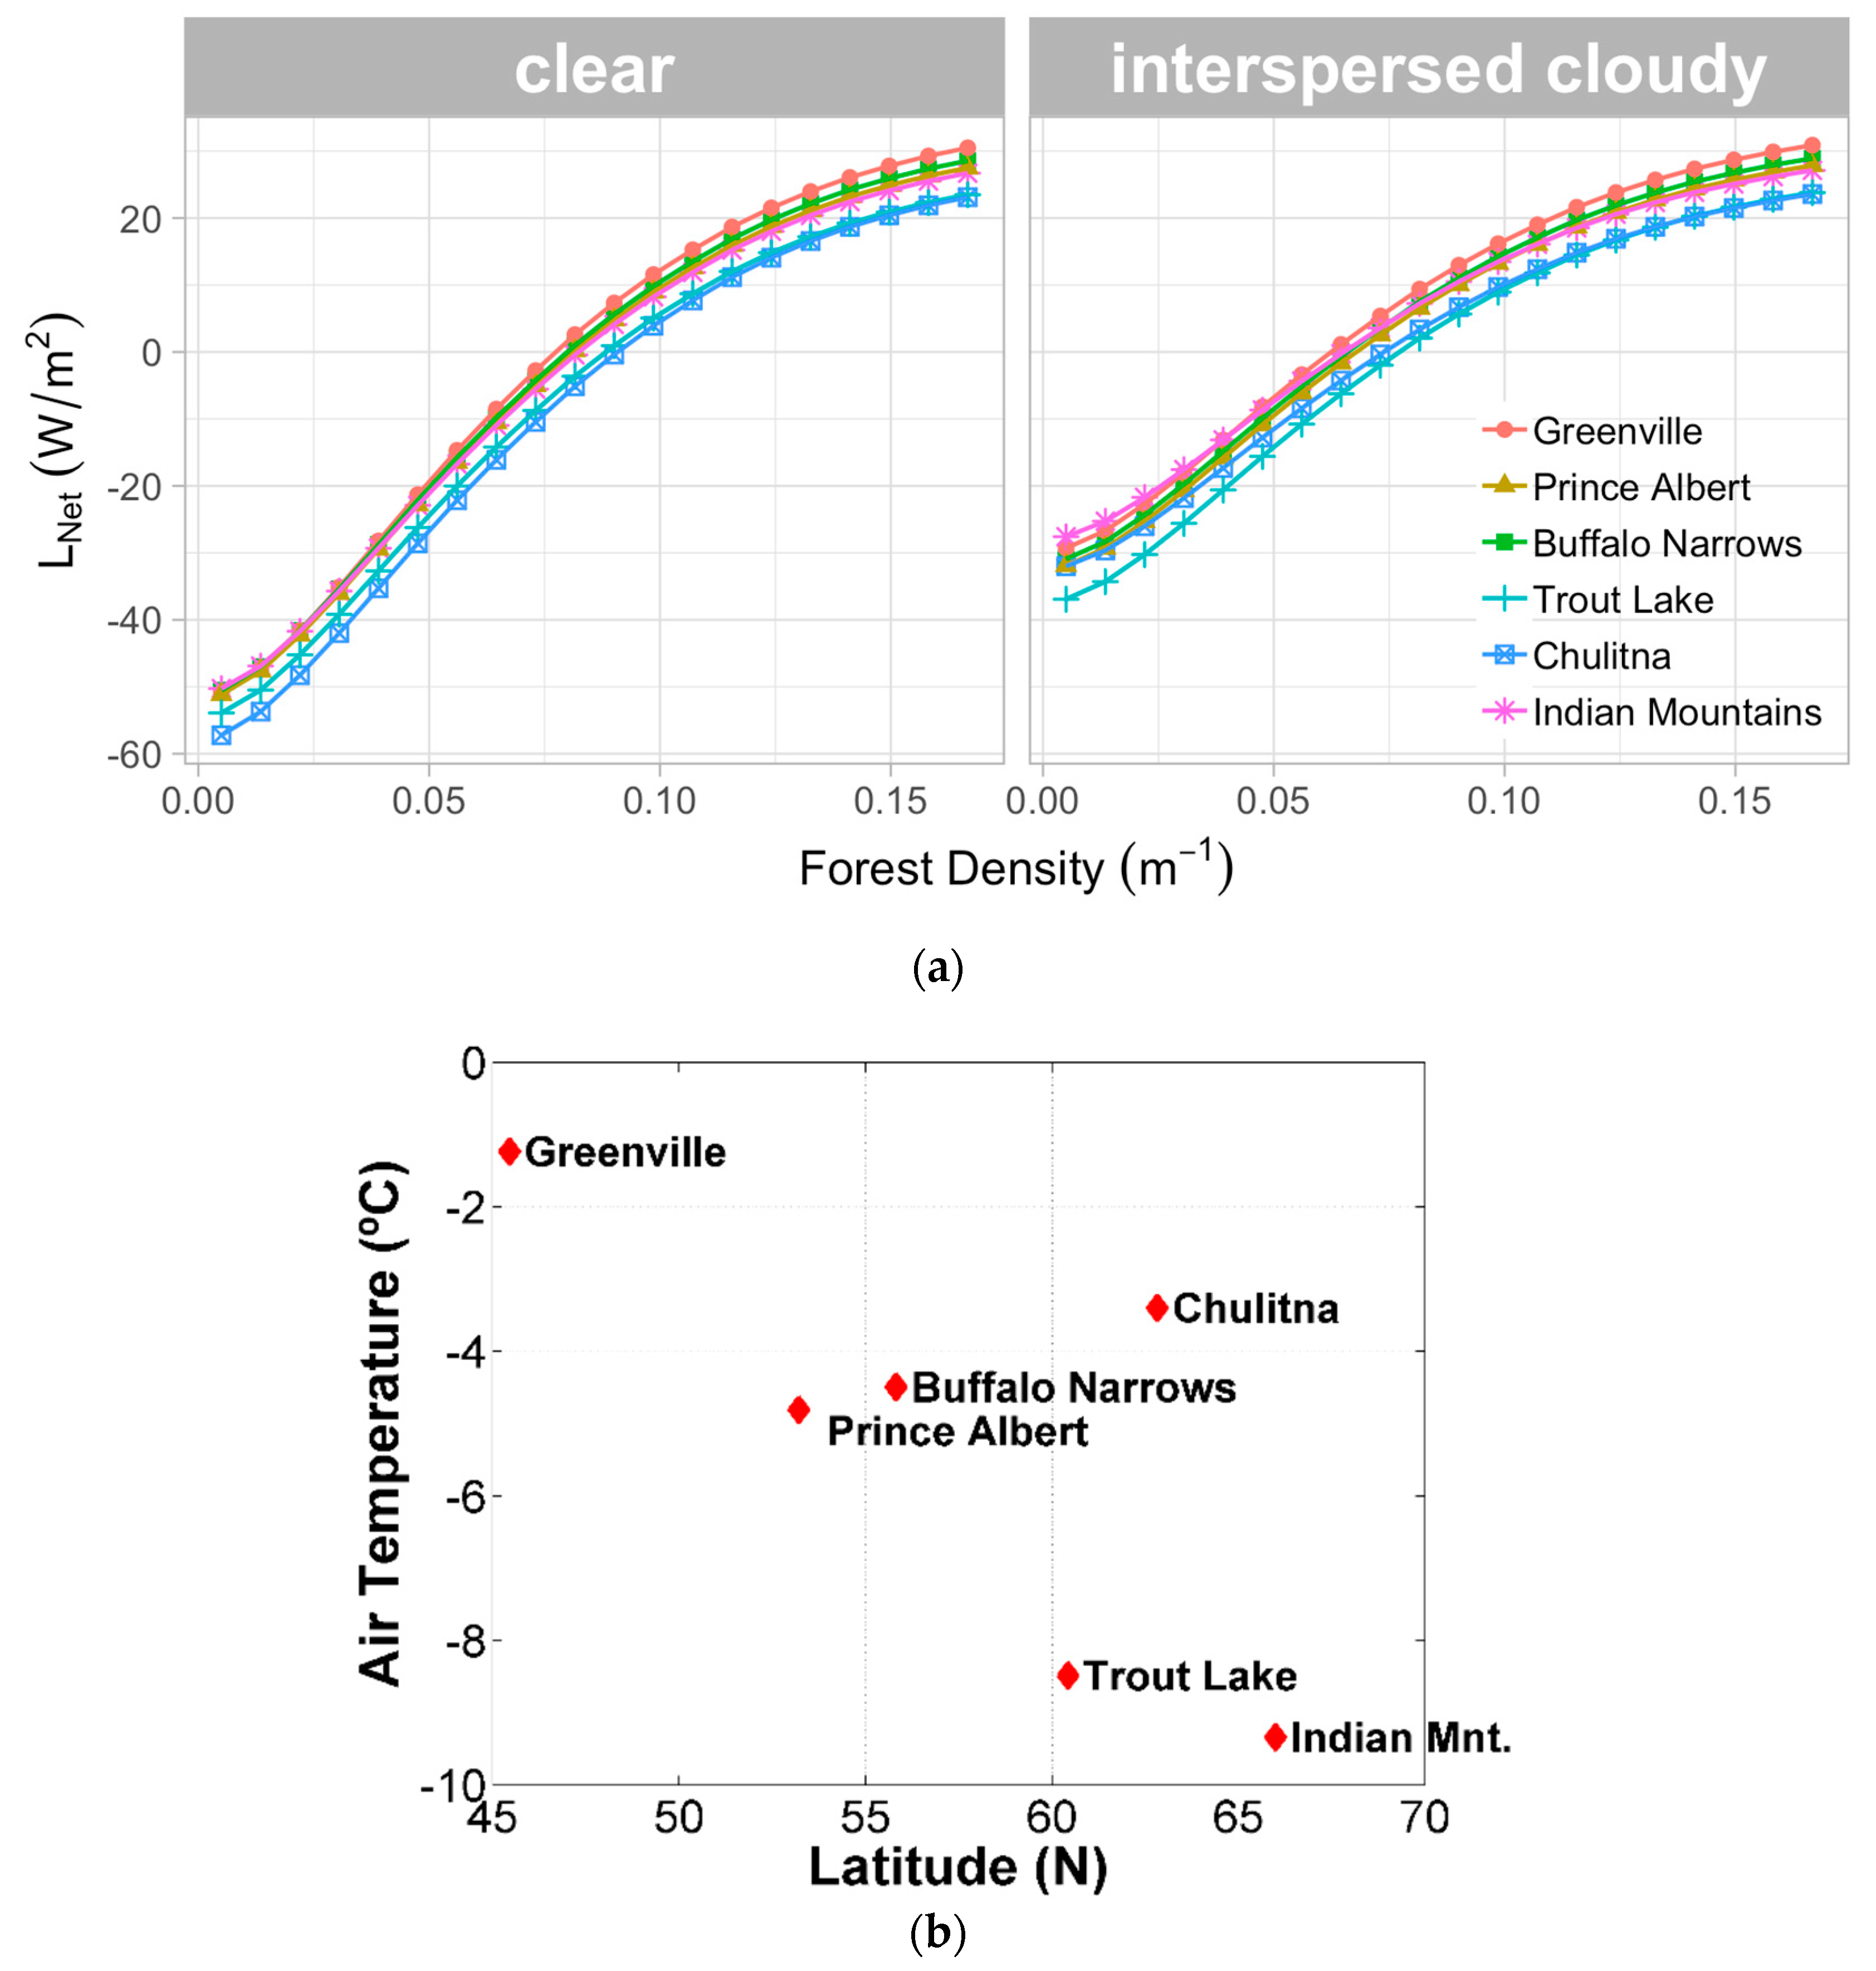
3.2. Effects of Latitudinal Location and Meteorological Characteristics on Net Longwave Radiation Reaching the Forest Floor

3.2.1. On a Level Forest Floor

Longwave radiation reaching the forest floor is affected by changes in vegetation density because of change in sky and trunk view factor. Of the four longwave radiation components, L snow was independent of sky view factor and vegetation density (Equation (3)). Canopy emissivity,   L can , which was evaluated as L crown + L trunk , was higher than clear sky emissivity, and, therefore, the variation of net longwave radiation with the changing sky view factor was dominated by L can . As a result, L Net varied conversely with SVF , and, hence, it increased with increasing vegetation density at all the six study sites (Figure 5). However, at any particular vegetation density, net longwave radiation did not show a monotonic variation with latitude, in part because of variations in cloud cover, relative humidity, and air, crown, trunk and snow temperatures, which influenced L Net directly or indirectly. Notably, a monotonic trend in L Net was not expressed even for clear sky conditions. This was also true for stations (e.g., Greenville, Prince Albert, Trout Lake and Indian Mountains) for which the mean snow-season air temperature varied inversely with latitude (Figure 5). The variation of L Net at different sites was highly nonlinear. At low vegetation densities ( SVF → 1), the trend in L Net was determined by σ ( ε sky T sky 4 ε snow T snow 4 ) based on Equation (3). Depending on the frequency of how often dew point temperatures are above zero degree Celsius and the magnitude of snow and clear sky emissivity, the difference between incoming sky longwave radiation and outgoing longwave radiation from snow changed from location to location, resulting in the expressed variations (Figure 5). As a result, for open areas ( SVF = 1) in clear sky conditions, L Net was the smallest for Chulitna and the largest for Indian Mountains. The other four sites in the order of increasing L Net were: Trout Lake, Prince Albert, Greenville and Buffalo Narrows. In contrast, for very dense forests ( SVF → 0), L Net , which became equal to σ ( ε can ( ( 1 TVF ) T crown 4 + TVF   T trunk 4 ) ε snow T snow 4 ) , increased from Chulitna to Trout Lake, Indian Mountains, Prince Albert, Buffalo Narrows and Greenville (Figure 5). At intermediate vegetation densities, the ordering of sites changed based on the site-specific sky emissivity values and the temperature data. Notably, the range of L Net for the vegetation densities considered here was only about 7 Wm 2 to 8 Wm 2 for the latitudinal range considered (~45° N to ~66° N).
In addition to air temperature, sky cover fraction also play an important role in variation of net longwave radiation component across the study sites. With increasing cloud cover, sky emissivity increased, resulting in an increase in L sky . On the contrary, shortwave radiation decreased with increasing sky cloudiness, leading to a decline in crown and trunk temperatures and, hence, a decrease in L crown and L trunk , particularly in low vegetation densities where well-exposed trunks exceeded ambient air temperature [10]. However, the effect of sky cloudiness on L crown and L trunk was smaller than that on longwave radiation from sky, resulting in an increase in L Net with an increase in cloud cover. Because of a larger role of L sky at sparse densities, the increase in L Net at these vegetation densities was more than in dense forests. As a result, L Net in open areas was more sensitive to sky cloudiness than in very dense forests. For interspersed cloudy sky conditions, net longwave radiation in open areas increased from Trout Lake to Prince Albert, Buffalo Narrows, Greenville and Indian Mountains (Figure 5) in direct proportion with seasonal average cloud cover. However due to the warm snow season, Chulitna was observed as an outlier between Prince Albert and Buffalo Narrows.

3.2.2. On a Sloping Forest Floor

Net longwave radiation did not change significantly with increasing slope angle. On south-facing hillslopes, as slope angle increased, the angles subtended by southern (and lower) and northern (and higher) trees increased and decreased, respectively. Since the rate of increase of subtended angle by southern trees was large, sky view factor decreased with increasing slope angle. Following the sky view factor trend, L Net increased a bit with increasing slope at the study locations, for both clear and interspersed cloudy sky conditions. Changes in the aspect of the hillslope toward the north reduced incoming solar radiation to the forests, causing a decrease in crown/trunk temperature and, hence, a minor decrease in L Net . The changes in L Net with aspect were even less in interspersed cloudy sky conditions than in clear sky conditions. It is to be noted that with changes in slope and aspect, the variation of S Net was far larger than in L Net [16]. Therefore, the variability of net radiation ( NSRF ) with aspect and slope was mainly influenced by changes in the shortwave component.
In addition to corroborating results from the previous studies (e.g., Ellis, et al. [46]) regarding the dominant role of longwave radiation in denser forests, these results highlight the additional influence of site-specific climatology on the variations of longwave component with forest density.

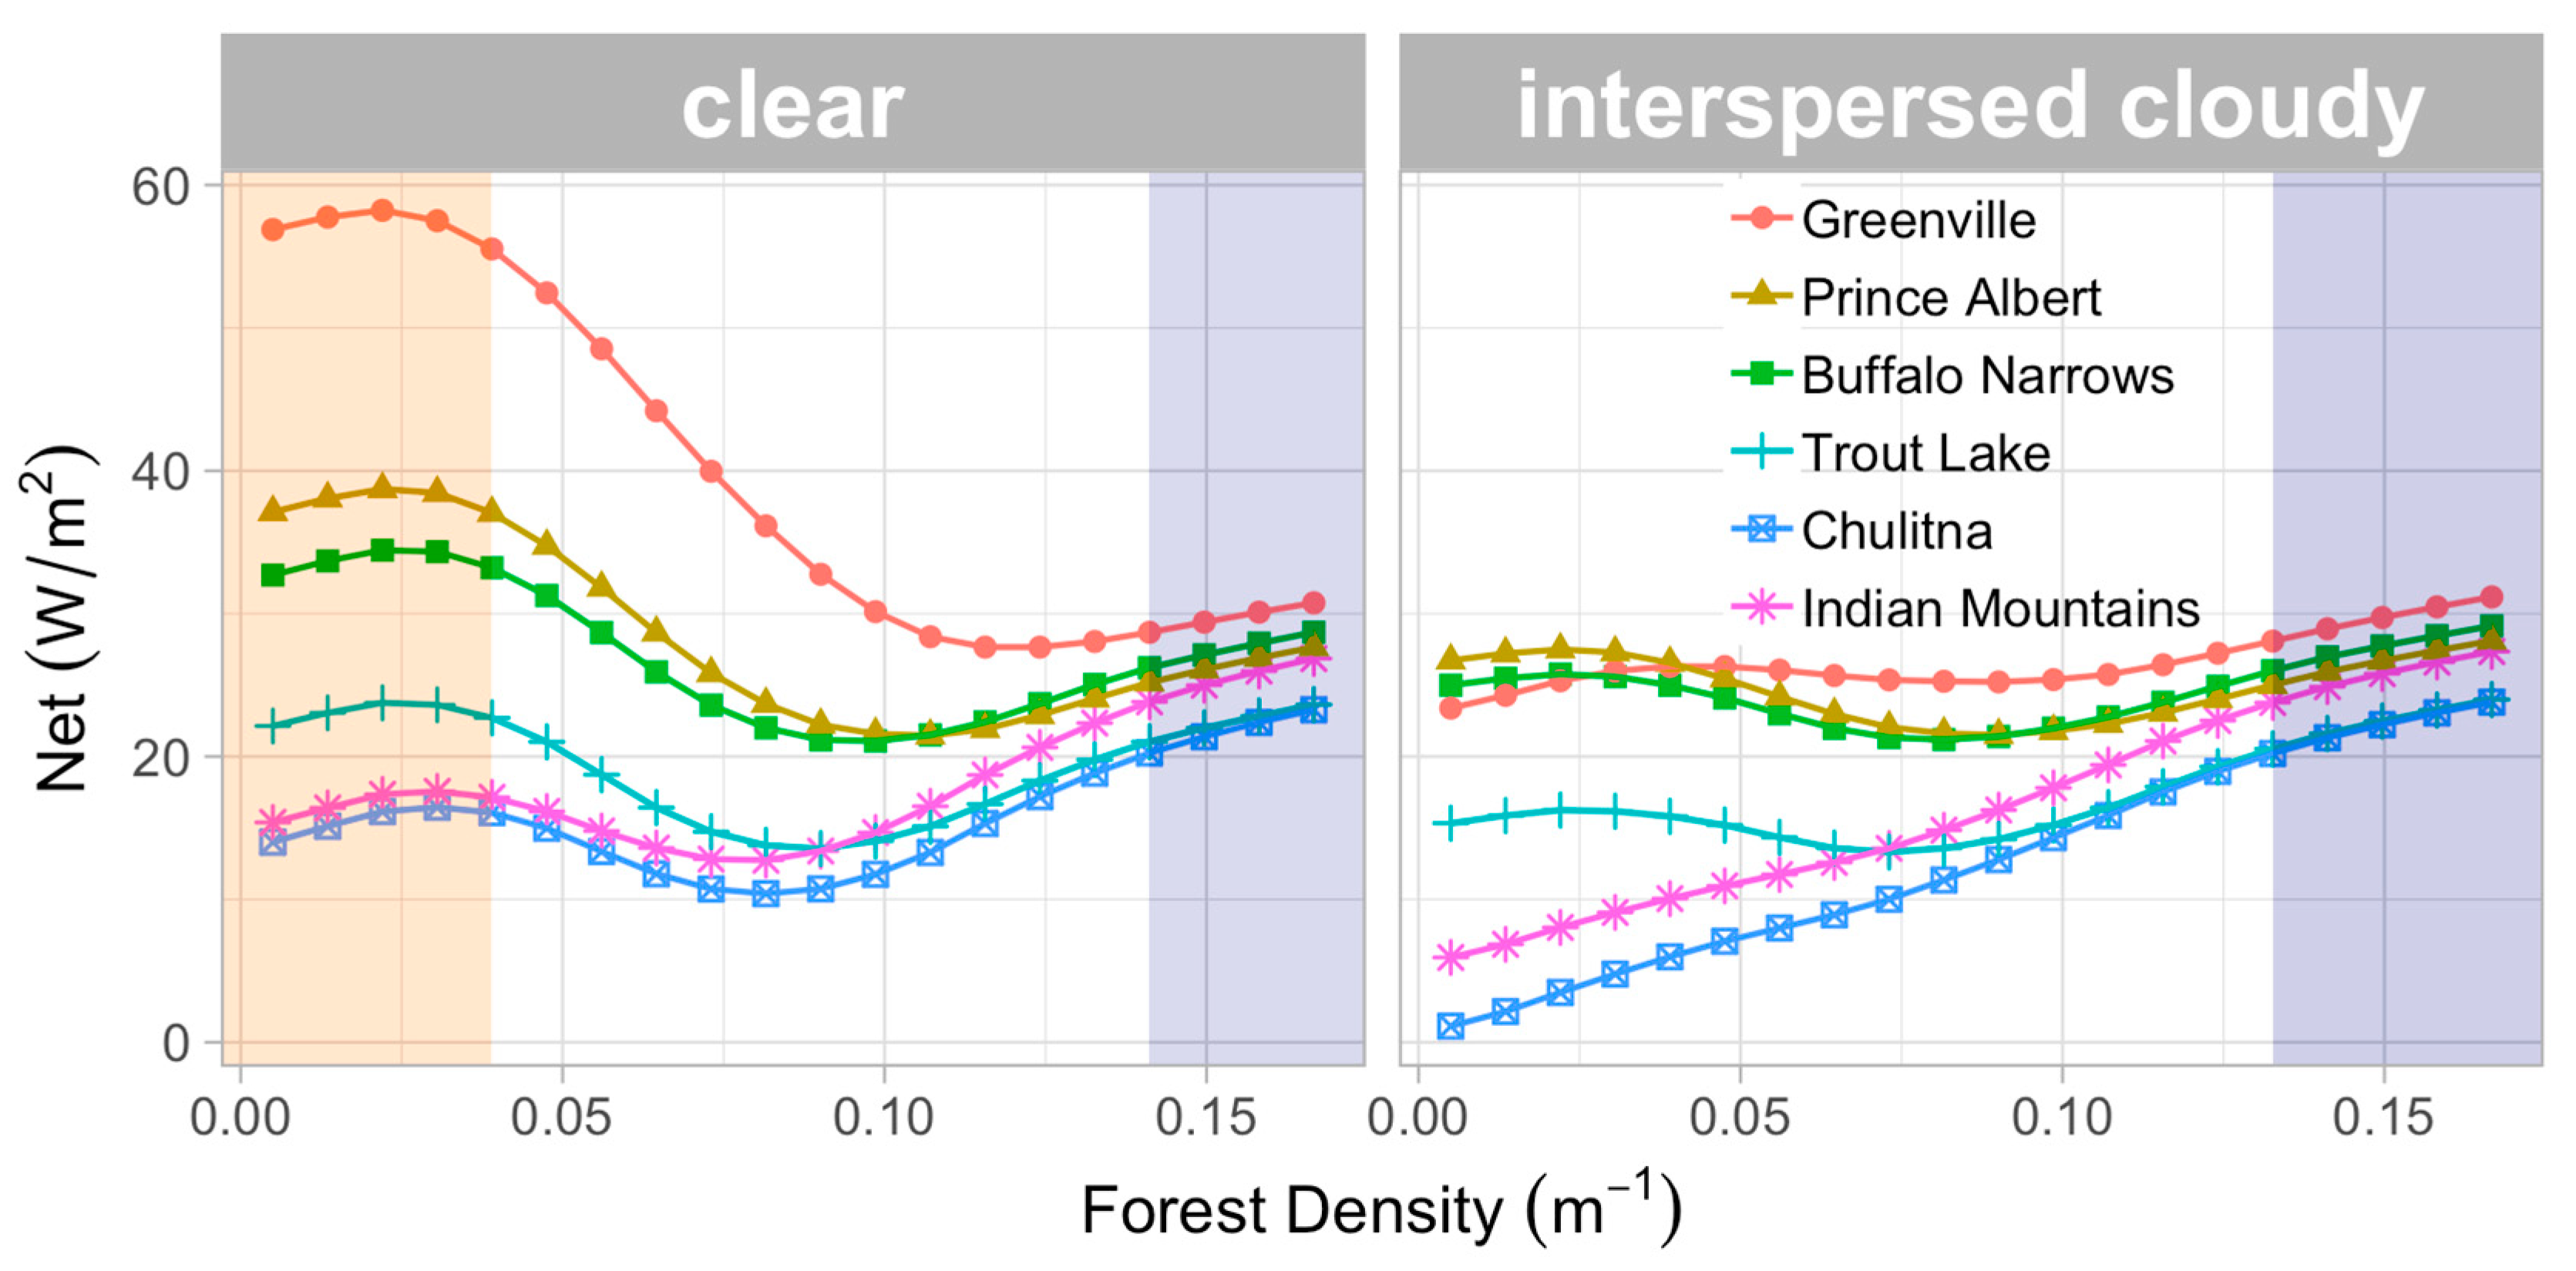
3.3. Net Radiation Variability

The variations of net radiation with vegetation density for clear and interspersed cloudy sky conditions in level forests are plotted in Figure 6.

3.3.1. On a Level Forest Floor

For clear sky conditions in sparse vegetation densities ( d 1 < 0.08 m 1 ), the magnitude of decrease in net shortwave radiation with increasing latitude was larger than the changes in net longwave radiation at five out of six study sites (Greenville, Prince Albert, Buffalo Narrows, Trout Lake and Indian Mountains). As a result, the NSRF followed the variation of S Net and decreased with increasing latitudes (Figure 6). However, the NSRF at Chulitna fell out of this sequence and had the smallest NSRF , even smaller than at Indian Mountains, which is located further north. This is because the difference in net longwave radiation between Indian Mountains and Chulitna was much more than the difference in shortwave radiation. In contrast, due to a relatively smaller contribution of shortwave radiation in dense forests ( d 1 > 0.12 m 1 ), the magnitude of the NSRF followed the trend of longwave radiation, as is expressed in Figure 5. As such, the NSRF was largest for Greenville and smallest for Chulitna in dense forests. The changing relative contributions of individual radiation components at different densities also resulted in differences in variability of the NSRF with vegetation density at different latitudes. For example, for lower latitude sites (e.g., Greenville, Prince Albert and Buffalo Narrows), where the net shortwave radiation component was larger than the net longwave component, the NSRF was generally larger for low vegetation densities or open areas with respect to dense forests. On the other hand, for higher latitude sites (e.g., Indian Mountains and Chulitna) where net longwave is dominant, the NSRF in very dense forests was larger than in open areas or sparse forests. The range of variation in the NSRF also varied across the sites. Notably, the standard deviation of net radiation ( σ NSRF ) across different vegetation densities first decreased with latitude from Greenville ( σ NSRF   = 12.3   Wm 2 ) to Prince Albert ( σ NSRF   = 6.4   Wm 2 ), Buffalo Narrows ( σ NSRF   = 4.7   Wm 2 ) and Trout Lake ( σ NSRF   = 3.7   Wm 2 ) and then increased with latitude for Chulitna ( σ NSRF = 3.9   Wm 2 ) and Indian Mountains ( σ NSRF = 4.5   Wm 2 ). This is because in lower latitudes, the difference in net radiation between open areas and very dense forests first decreased and then increased with increasing latitude. The vegetation density at which maximum net radiation was expressed was also found to vary across the six sites. The results show that in clear sky conditions, the maximum net radiation ( NSRF max ) for level forest occurred at sparser densities ( d max 1 ≈ 0.02 m 1 ) for lower latitudes areas (Greenville, Prince Albert, Buffalo Narrows and Trout Lake) and in very dense forests ( d max 1 ≈ 0.17 m 1 ) for higher latitude sites (Indian Mountains and Chulitna). THe NSRF max varied from 23.3 to 58.2 Wm 2 across the six locations. Moreover, the NSRF at different locations often expressed a local minimum for intermediate vegetation densities. The density at which the NSRF was minimum ( d min 1 ) decreased with increasing latitude from d min 1 ≈ 0.12   m 1 at Greenville (latitude = 45.5 °N) to d min 1 ≈ 0.08 m 1 at Indian Mountains (latitude = 66.0 °N). The NSRF min varied from 10.4 Wm 2 to 27.7 Wm 2 across the six locations.
For the scenario when interspersed cloudy sky conditions in the snow season were considered, the NSRF   monotonically increased with vegetation density for sites with higher cloud cover (e.g., Greenville, Indian Mountains and Chulitna; see Figure 6) as the shortwave component was small. Hence, the longwave radiation determined the trend at all vegetation densities. This variation became non-monotonic for sites with lower cloud cover (e.g., Prince Albert, Buffalo Narrows and Trout Lake; see Figure 6), as the shortwave radiation was not too small, especially in sparse forests. Unlike the scenario with completely clear sky conditions in the snow season, for interspersed cloudy sky conditions, due to differences in cloud cover fraction, the NSRF expressed a non-monotonic trend with latitude at most vegetation densities. In open areas and sparse forests, the NSRF   was the largest for Prince Albert, followed by Buffalo Narrows, Greenville, Trout Lake, Indian Mountains and Chulitna. However, in very dense forests, the contribution of the shortwave radiation and the incoming longwave radiation from sky were small, and, hence, the NSRF ’s trend with latitude in interspersed cloudy sky conditions was the same as in clear sky conditions. The range of variation in the NSRF was smaller at lower latitude sites (e.g., Greenville, Prince Albert and Buffalo Narrows) than at higher latitude sites (e.g., Chulitna and Indian Mountains). This is because at higher latitudes, the difference in net radiation between open areas and very dense forests was large due to smaller contribution from S N e t , especially at sparse densities. Because of the relatively modest contribution of S N e t on the NSRF , the NSRF was generally the largest in dense forests at five out of six considered sites. The NSRF m a x varied from 23.8 to 31.2 W m 2 across the six locations. The NSRF min showed a much wider variation across the six sites, with the maximum and minimum N S R F m i n being equal to 1.1 and 23.4 W m 2 , respectively. The density at which the NSRF was minimum ( d m i n 1 ) generally increased with decreasing latitude from d m i n 1 ≈ 0.01 m−1 at Indian Mountains (latitude = 66.0 °N) to d m i n 1 ≈ 0.085 m 1 at Prince Albert (latitude = 53.2 °N). Greenville (latitude = 45.5 °N) was the exception to this trend, as the NSRF min was again expressed in very sparser forests at the site.

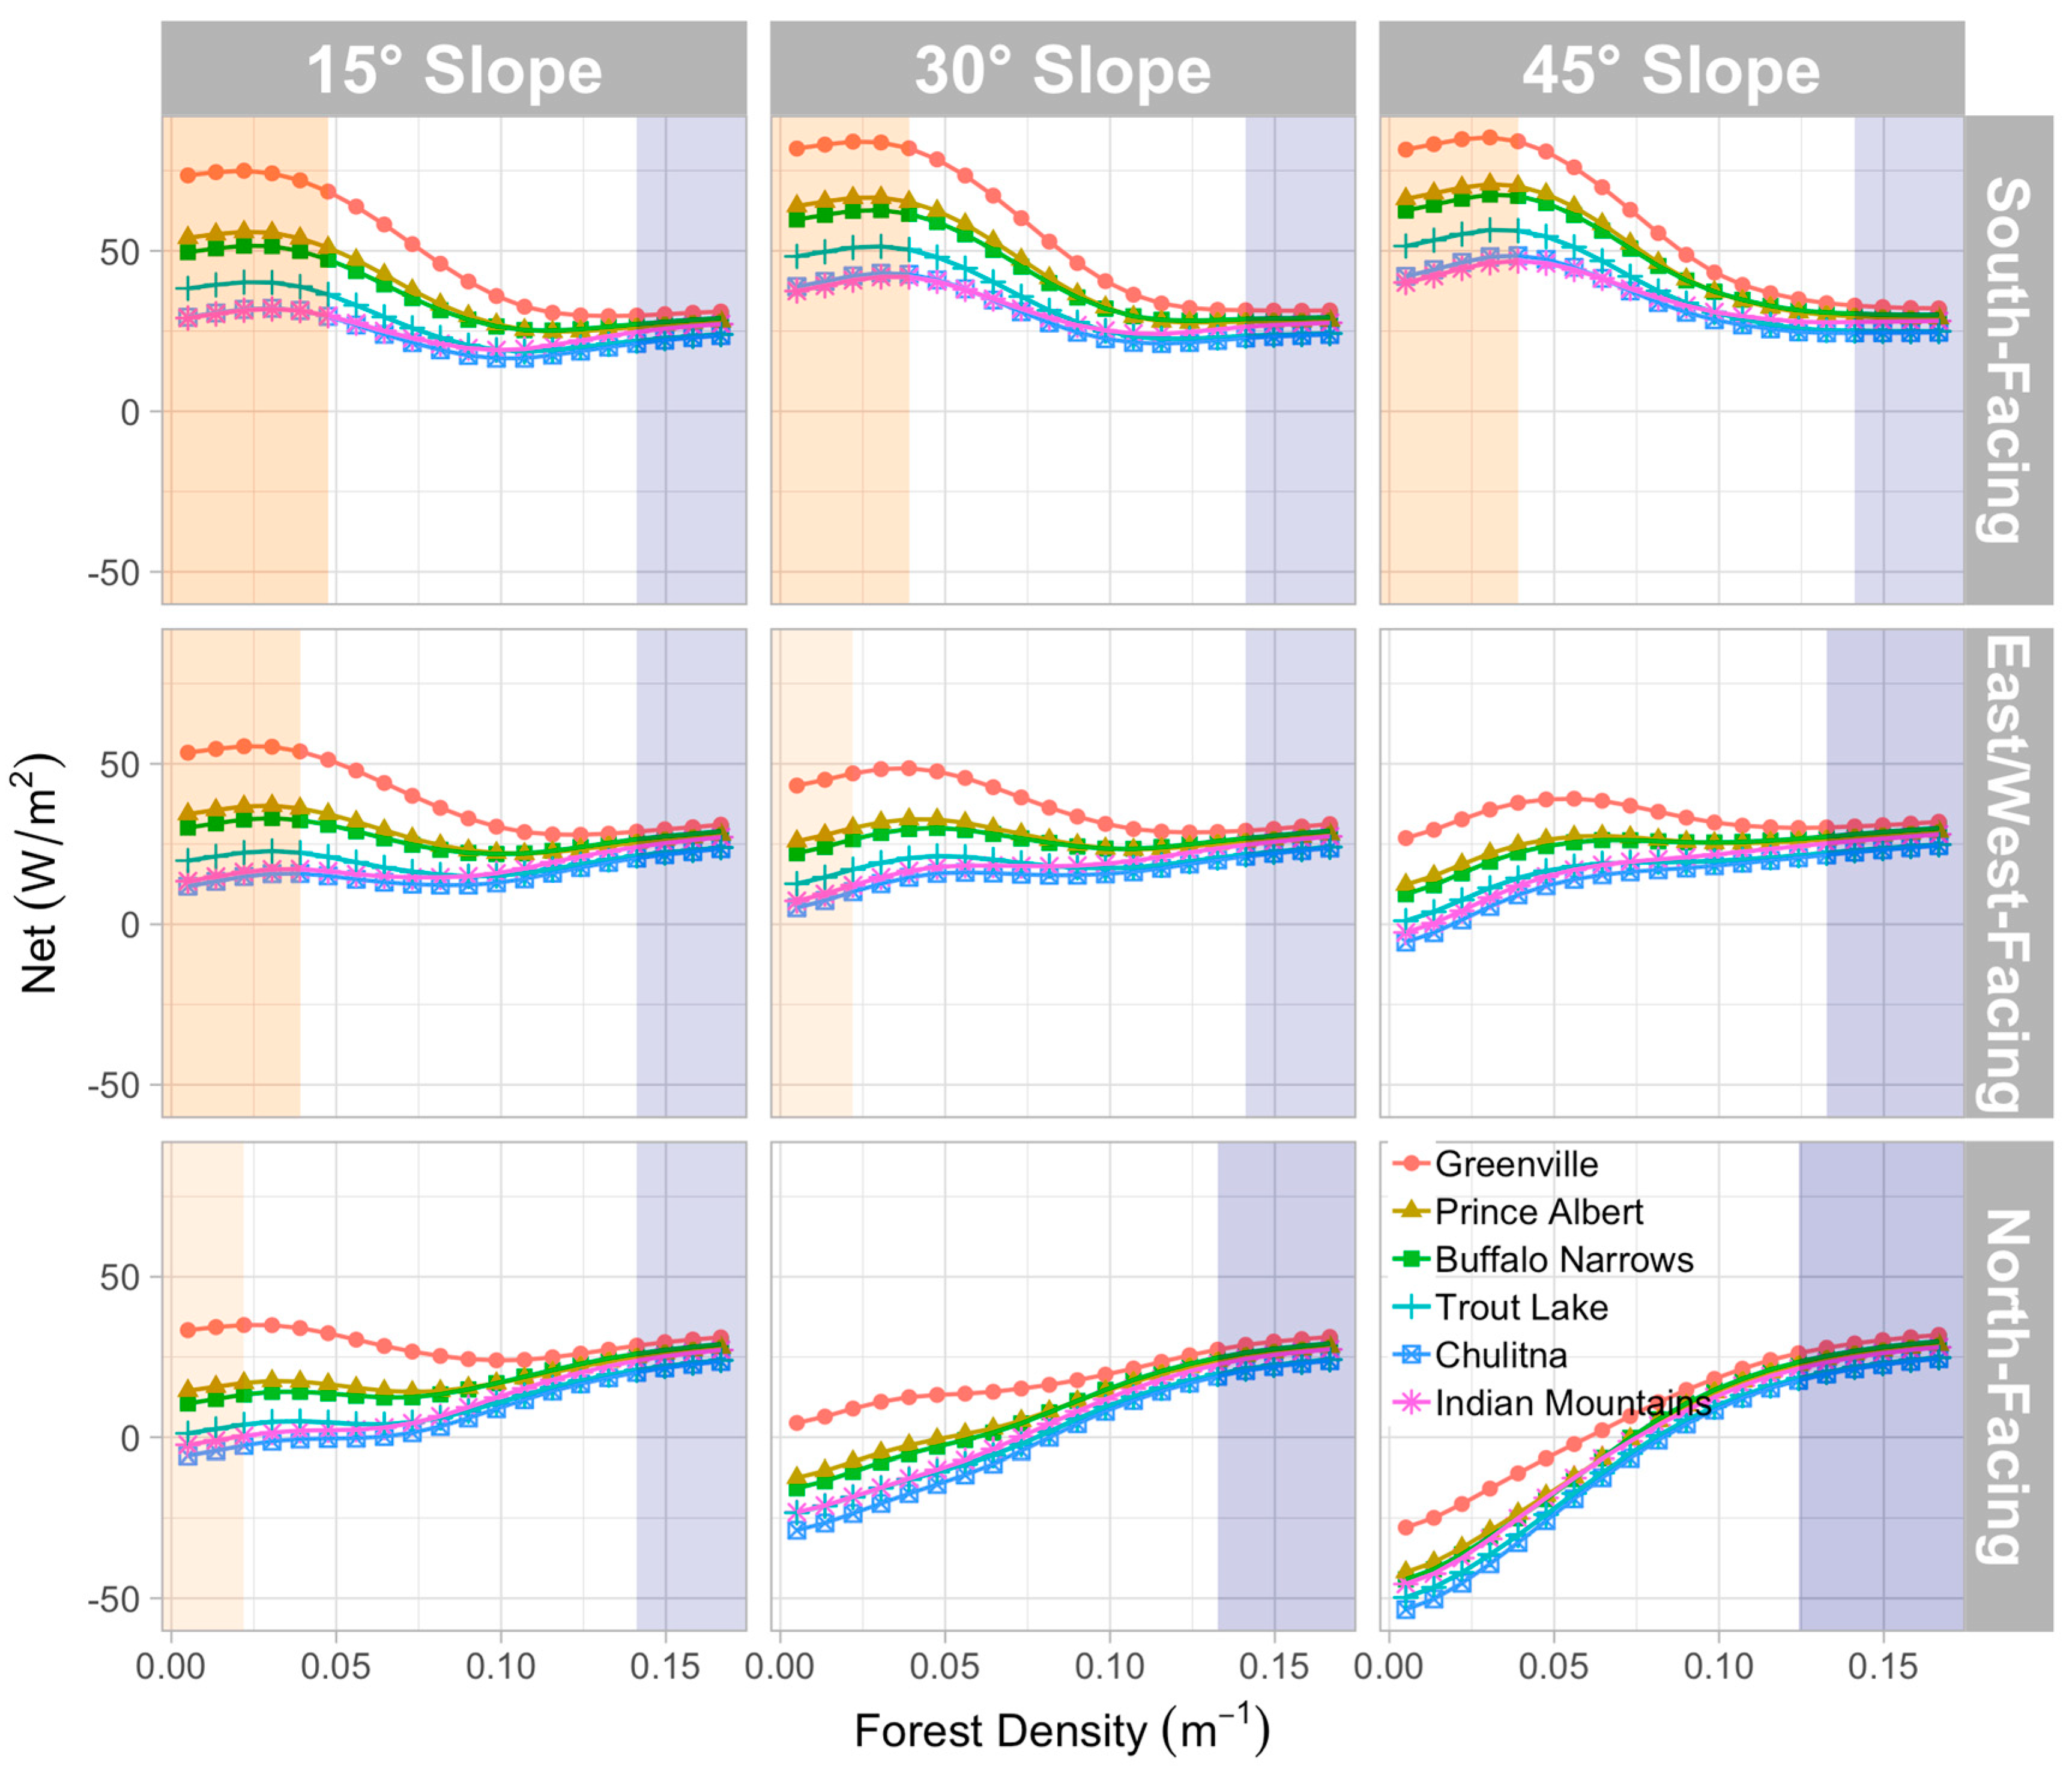
3.3.2. On a Sloping Forest Floor

The trend of the NSRF with vegetation density changed with both slope and aspect. For south-facing hillslopes in clear sky conditions, S N e t and hence the NSRF increased with increasing slope angle, resulting in an increase in d m i n 1 at all locations (Figure 7). The changes in the NSRF with slope angle were larger in sparse forests than in dense forests. In relatively dense forests ( d 1 > 0.12 m−1) the changes in net shortwave and longwave components cancelled each other out, and, hence, the NSRF became less sensitive to vegetation density, particularly for higher slopes where the rate of changes in longwave and shortwave components were equal (slope ≥ 30°). Similar to level forests, the maximum NSRF was observed in relatively sparse forests ( d m a x 1 ≈ 0.02–0.03 m−1) for all south-facing slopes.
Compared to level forests in mid- to high-latitude sites, for which the magnitude of the NSRF min to net radiation in open areas ( NSRF open ) increased with increasing site’s latitude (from 48% in Greenville to 82% in Indian Mountains, see Table 3), this fraction for south-facing hillslopes (slope = 15°) varied from 40% in Greenville to 65% in Indian Mountains (see Table 4). In contrast, the fraction of the NSRF min to net radiation in very dense forests ( NSRF dense ) at different sites showed a decreasing trend from 90% to 47% in level forests (Table 3) and 95% to 70% for a 15° south-facing hillslope (Table 4).
Differences in aspect of forested hillslopes also caused variability in the trend of the NSRF with vegetation density and latitude. With aspect of the hillslope changing from south to east/west and then to north in clear sky conditions, L N e t remained almost constant (a minor change was experienced due to changes in tree crown and trunk temperatures with changes in insolation) while S N e t decreased, resulting in a decrease in the NSRF . The rate of decrease in the NSRF with aspect was stronger in open areas with respect to dense forests. As a result, L N e t gradually became the dominant component for north-facing aspects; hence, the NSRF was more likely to follow an increasing trend with increasing vegetation density. For example, the non-monotonic variability of the NSRF with vegetation density at high latitude sites became strictly monotonically increasing for north facing slopes (Figure 7, leftmost column). Aspect also affected the influence of variation of the NSRF with vegetation density. Since an increase in slope angle led to an increase/decrease in S N e t on south/north facing slopes, especially at lower vegetation densities, the NSRF showed a stronger decreasing/increasing trend for south/north facing hillslopes at larger slope angles. This was distinctly apparent on north facing slopes for which the NSRF was monotonically increasing for two out of six location on a 15° slope but increased monotonically at all six locations on a 45° slope. Similarly, on south facing hillslopes with slope = 15°, the minimum radiation occurred at intermediate densities for five out of six study locations (Prince Albert, Buffalo Narrows, Trout Lake, Chulitna, Indian Mountains). However, the minimum radiation for slopes = 45° occurred in very dense forests at all six considered sites because of a decreasing trend in the NSRF (see Figure 7). Since L N e t showed only mild variations with latitude, forests with steeper slopes on north-facing aspects were less sensitive to changes in latitudinal location with respect to forests with south-facing aspects and on lower slopes.
For scenarios with interspersed cloudy sky conditions in the snow season, in very sparse vegetation densities on south-facing slopes (e.g., slope = 15° in Figure 8), Prince Albert and Buffalo Narrows showed largest the NSRF s among the study locations due to large shortwave contribution. The   NSRF decreased from Greenville to Trout Lake, Indian Mountains and Chulitna. For south-facing slopes, the existence of a minimum net radiation at intermediate densities was observed at four out of six study locations (Greenville, Prince Albert, Buffalo Narrows and Trout Lake). Because of the increase in S N e t , the minimum shifted toward dense forests with increasing slope angle at these sites. Since longwave radiation dominantly controlled the NSRF at high latitude sites (e.g., Chulitna and Indian Mountains; see Figure 8), the NSRF showe a steady increasing trend with vegetation density for all slopes and aspects at high latitudes. With changing aspect of the sites towards north, shortwave radiation contribution became marginal (see Figure 7). Hence, the variability of the NSRF with vegetation density became monotonically increasing with little sensitivity to site location. As a result, for northern aspects, the NSRF was maximum in dense forests.
By considering a range of forest densities across a latitudinal gradient, our experiments and results highlight the changes in the relative dominance of shortwave and longwave radiation components vis-à-vis forest density, topographic aspects and slope, and site-specific climatology. These results provide additional perspective to the previous observational and modeling studies (e.g., [13,14,15,21,26,47,48,49,50,51,52,53]), which reported radiation components on forested snowpack at selected vegetation densities and sites.

4. Conclusions

The study illustrates the role of latitudinal location of the forest and associated meteorological conditions on the magnitude and variability of net radiation on a snow-covered forest floor for a range of vegetation densities, slopes and aspects. The results in level forests for clear sky conditions showed that the rate of decrease in net shortwave radiation with increasing latitude was greater than changes in net longwave radiation caused by a temperature drop. As a result, the variability of net radiation with latitude at locations with vegetation density less than 0.04   m 1 were controlled by shortwave radiation, while in denser forests (density ≥ 0.14   m 1 ) the variation was dominated by longwave radiation trend, which in turn was dominantly influenced by site temperature. The variation of net radiation with latitude in forests with intermediate densities (0.04   m 1   < d 1   < 0.14   m 1 ) were controlled by both shortwave and longwave radiation components (see Figure 6). Minimum net radiation was more likely to occur at lower vegetation densities for higher latitude sites. For the considered sites, the minimum net radiation occurred at intermediate densities from 0.08 to 0.12   m 1 . The range of variation in net radiation between open areas and very dense forests, however, first decreased and then increased with increasing latitude. Sky cloudiness affected the variations in net radiation with vegetation at all locations by markedly reducing shortwave radiation, especially in sparse forests. As a result, for snow seasons with interspersed cloudy sky conditions, shortwave radiation was no longer the dominant energy component (even in very sparse forests) and longwave radiation became the dominant component for a wider range of vegetation densities ( d 1   > 0.13   m 1 ) than in clear sky conditions (Figure 6). Since the variability of longwave radiation across different locations was small, net radiation was only mildly sensitive to site location in very dense forests ( d 1   > 0.14   m 1 ) for both clear and interspersed cloudy sky conditions. In these regions, site temperature data (temperature magnitude and its temporality) played the main role in the magnitude of net radiation reaching the forest floor. In spite of aforementioned changes in radiation contributions due to interspersed sky cover, the density at which radiation was minimum still generally increased with decreasing latitude. Notably, the range of net radiation across the six sites was relatively small for a wide range of vegetation densities in the interspersed cloudy snow season.
The obtained results also explain how net radiation and its variability with vegetation density vary with changes in site topographical characteristics (slope and aspect) in mid- to high- latitude forests. On south-facing forested hillslopes, the shortwave radiation remained the primary radiation component in regions with vegetation density less than 0.05   m 1 , while the longwave component was the dominant control in areas with a vegetation density larger than 0.13   m 1 . As the aspect of forested hillslope changed from south-facing to north-facing, the shortwave-dominant region became narrower, with a vegetation density less than 0.02   m 1 for clear sky conditions. Longwave radiation, on the other hand, became dominant for a wider range of vegetation densities ( d 1 > 0.12   m 1 ), particularly in higher slopes (see Figure 7). The changing contribution of radiation components on south facing hillslopes resulted in vegetation densities at which radiation was minimum ( d m i n 1 ) to increase with slope angle at all locations. However, the trend was opposite for north facing aspects where, with the increase in slope angle, minimum radiation was obtained at smaller densities. In interspersed cloudy sky conditions, longwave radiation and, hence, site climatological characteristics became the main contributing components for a wider range of vegetation densities ( d 1 > 0.11   m 1 ) with a changing slope and aspect toward the north. Notably, only south-facing mid-latitude sites with relatively low cloud cover exhibited a non-monotonic NSRF with changing vegetation density. Other site conditions resulted in a monotonically increasing radiation with increasing vegetation density. The range of net radiation across the six sites in the interspersed cloudy snow season was relatively smaller than in clear sky conditions for all slope angles and aspects. In spite of these changes in radiation contributions due to interspersed sky cover, the density at which radiation was minimum still generally increased with decreasing latitude on south facing slopes. On north facing slopes however, because of longwave dominance at all densities, net radiation was minimum in open areas and very sparse forests.
These results suggest that occurrence of a radiation minimum, the density at which it happens, the range of variation in radiation with vegetation density, and the dominance of individual radiation components depends on the location, climate, slope and aspect of the site. The location-based dependencies on net snow cover radiation have implications on the prioritization of observation resources, parameterizations of water and energy fluxes, and in forest management [53]. Based on the latitudinal, topographic and meteorological configurations, one can decide on which radiation component between longwave or shortwave measurements should be prioritized first. The presented results, especially the role of density of vegetation in determining net snow cover radiation vis-à-vis latitudinal controls and associated meteorological characteristics, may guide future work to include a vegetation density dependent water balance and energy parameterization in coarse scale models (e.g., the Community Earth System Model, CESM).
It is to be acknowledged that this study does not account for impacts of intra-species differences in tree morphometry [54,55], landscape and vegetation configuration heterogeneity [56], and terrain complexity [57] on radiation vs. density relation. Our study also does not account for the spectral variability of snow albedo, albedo heterogeneity or differences in albedo regimes across sites and by time. Still, the study clearly highlights the role of meteorological forcing and location on the variation of radiation vis-à-vis vegetation density across sites. A comprehensive sensitivity analysis of the model to snow albedo, air temperature, canopy temperature, and snow temperature is presented in Seyednasrollah, Kumar and Link [16]. The findings will support design of optimal forest management practices for obtaining the desired net radiation and, consequently, melt regime on the forest floor by altering vegetation densities. At locations where the stocking/thinning of trees has to be undertaken, density could be managed to achieve the minimum radiation, which, as the results show, will happen at sparser densities in high-latitude forests. The monotonically increasing trend of net radiation with vegetation density at all six study sites on north-facing hillslopes indicates that the thinning of trees can be performed to minimize the snowmelt rate for a wide range of locations. In contrast, the planting of trees in large gaps to increase the density of trees could also be used as an effective strategy to reduce net radiation and, hence, the melt rate on south-facing hillslopes in mid-latitude areas. The results also suggest that the largest potential for reduction in energy through forest management is on south facing hillslopes at lower latitudes. Nonetheless, the reduction in energy is expected to be relatively muted with increasing cloud cover.

5. Data and Code Availability

Data sets used in the paper are freely available to public from National Climatic Data Center (www.ncdc.noaa.gov), National Renewable Energy Laboratory (www.nrel.gov), and Canadian Weather Energy and Engineering Datasets (weather.gc.ca). The development version of the Forest Radiation Model (FoRM) is available from https://github.com/bnasr/FoRM. We have also developed the solrad R package for estimation of direct and diffuse solar radiation [58]. The stable release of solrad R package is maintained on The Comprehensive R Archive Network (CRAN) at: https://cran.r-project.org/package=solrad. The development version is available from https://github.com/bnasr/solrad.

Supplementary Materials

Supplementary Materials are available online at https://www.mdpi.com/2306-5338/6/3/62/s1.

Author Contributions

Conceptualization, B.S. and M.K.; methodology, B.S. and M.K.; software, B.S.; validation, B.S. and M.K.; data curation, B.S.; writing—original draft preparation, B.S.; writing—review and editing, B.S. and M.K.; funding acquisition, M.K.

Funding

This research was funded by National Science Foundation, grant number EAR-1454983.

Conflicts of Interest

The authors declare no conflict of interest.

References

  1. Bales, R.C.; Molotch, N.P.; Painter, T.H.; Dettinger, M.D.; Rice, R.; Dozier, J. Mountain hydrology of the western United States. Water Resour. Res. 2006, 42. [Google Scholar] [CrossRef]
  2. Barnett, T.P.; Adam, J.C.; Lettenmaier, D.P. Potential impacts of a warming climate on water availability in snow-dominated regions. Nature 2005, 438, 303. [Google Scholar] [CrossRef] [PubMed]
  3. Trujillo, E.; Molotch, N.P.; Goulden, M.L.; Kelly, A.E.; Bales, R.C. Elevation-dependent influence of snow accumulation on forest greening. Nat. Geosci. 2012, 5, 705. [Google Scholar] [CrossRef]
  4. Madani, K.; Lund, J.R. Estimated impacts of climate warming on California’s high-elevation hydropower. Clim. Chang. 2010, 102, 521–538. [Google Scholar] [CrossRef]
  5. Kumar, M.; Marks, D.; Dozier, J.; Reba, M.; Winstral, A. Evaluation of distributed hydrologic impacts of temperature-index and energy-based snow models. Adv. Water Resour. 2013, 56, 77–89. [Google Scholar] [CrossRef]
  6. Wang, R.; Kumar, M.; Marks, D. Anomalous trend in soil evaporation in a semi-arid, snow-dominated watershed. Adv. Water Resour. 2013, 57, 32–40. [Google Scholar] [CrossRef]
  7. Aguado, E. Radiation Balances of Melting Snow Covers at an Open Site in the Central Sierra-Nevada, California. Water Resour. Res. 1985, 21, 1649–1654. [Google Scholar] [CrossRef]
  8. Bohren, C.F.; Thorud, D.B. 2 Theoretical Models of Radiation Heat-Transfer between Forest Trees and Snowpacks. Agric. Meteorol. 1973, 11, 3–16. [Google Scholar] [CrossRef]
  9. Elder, K.; Dozier, J.; Michaelsen, J. Snow Accumulation and Distribution in an Alpine Watershed. Water Resour. Res. 1991, 27, 1541–1552. [Google Scholar] [CrossRef]
  10. Pomeroy, J.W.; Marks, D.; Link, T.; Ellis, C.; Hardy, J.; Rowlands, A.; Granger, R. The impact of coniferous forest temperature on incoming longwave radiation to melting snow. Hydrol. Process. 2009, 23, 2513–2525. [Google Scholar] [CrossRef]
  11. Sicart, J.E.; Pomeroy, J.W.; Essery, R.L.H.; Bewley, D. Incoming longwave radiation to melting snow: observations, sensitivity and estimation in northern environments. Hydrol. Process. 2006, 20, 3697–3708. [Google Scholar] [CrossRef]
  12. Price, A.G. Prediction of Snowmelt Rates in a Deciduous Forest. J. Hydrol. 1988, 101, 145–157. [Google Scholar] [CrossRef]
  13. Webster, C.; Rutter, N.; Zahner, F.; Jonas, T. Modeling subcanopy incoming longwave radiation to seasonal snow using air and tree trunk temperatures. J. Geophys. Res. Atmos. 2016, 121, 1220–1235. [Google Scholar] [CrossRef]
  14. Musselman, K.N.; Pomeroy, J.W.; Link, T.E. Variability in shortwave irradiance caused by forest gaps: Measurements, modelling, and implications for snow energetics. Agric. For. Meteorol. 2015, 207, 69–82. [Google Scholar] [CrossRef]
  15. Malle, J.; Rutter, N.; Mazzotti, G.; Jonas, T. Shading by trees and fractional snow cover control the sub-canopy radiation budget. J. Geophys. Res. Atmos. 2019, 124, 3195–3207. [Google Scholar] [CrossRef]
  16. Seyednasrollah, B.; Kumar, M.; Link, T.E. On the role of vegetation density on net snow cover radiation at the forest floor. J. Geophys. Res. Atmos. 2013, 118, 8359–8374. [Google Scholar] [CrossRef]
  17. Reifsnyder, W.E.; Lull, H.W. Radiant Energy in Relation to Forests; U.S. Department of Agriculture, Forest Service; U.S. Government Publishing Office: Washington, DC, USA, 1965; 111p.
  18. USACE. Snow Hydrology: Summary Report of the Snow Investigations; North Pacific Division, Corps of Engineers, U.S. Army: Portland, OR, USA, 1956; 437p.
  19. Seyednasrollah, B.; Kumar, M. Net radiation in a snow-covered discontinuous forest gap for a range of gap sizes and topographic configurations. J. Geophys. Res. Atmos. 2014, 119, 10323–10342. [Google Scholar] [CrossRef]
  20. Lundquist, J.D.; Dickerson-Lange, S.E.; Lutz, J.A.; Cristea, N.C. Lower forest density enhances snow retention in regions with warmer winters: A global framework developed from plot-scale observations and modeling. Water Resour. Res. 2013, 49, 6356–6370. [Google Scholar] [CrossRef]
  21. Seyednasrollah, B.; Kumar, M. Effects of tree morphometry on net snow cover radiation on forest floor for varying vegetation densities. J. Geophys. Res. Atmos. 2013, 118, 12508–12521. [Google Scholar] [CrossRef]
  22. Webster, C.; Rutter, N.; Jonas, T. Improving representation of canopy temperatures for modeling subcanopy incoming longwave radiation to the snow surface. J. Geophys. Res. Atmos. 2017, 122, 9154–9172. [Google Scholar] [CrossRef] [Green Version]
  23. Marthews, T.R.; Malhi, Y.; Iwata, H. Calculating downward longwave radiation under clear and cloudy conditions over a tropical lowland forest site: an evaluation of model schemes for hourly data. Theor. Appl. Climatol. 2012, 107, 461–477. [Google Scholar] [CrossRef]
  24. Seyednasrollah, B. FoRM: A physically based forest radiation model. Zenodo 2014. [Google Scholar] [CrossRef]
  25. Arbor Day Foundation (ADF). Tree Details—The Tree Guide at arborday.org. Available online: http://www.arborday.org/trees/treeGuide/TreeDetail.cfm?ID=39 (accessed on 7 January 2012).
  26. Lawler, R.R.; Link, T.E. Quantification of incoming all-wave radiation in discontinuous forest canopies with application to snowmelt prediction. Hydrol. Process. 2011, 25, 3322–3331. [Google Scholar] [CrossRef]
  27. Andreas, E.L. A New Method of Measuring the Snow-Surface Temperature. Cold Reg. Sci. Technol. 1986, 12, 139–156. [Google Scholar] [CrossRef]
  28. Baldocchi, D.D.; Vogel, C.A.; Hall, B. Seasonal variation of energy and water vapor exchange rates above and below a boreal jack pine forest canopy. J. Geophys. Res. Atmos. 1997, 102, 28939–28951. [Google Scholar] [CrossRef]
  29. Saugier, B.; Granier, A.; Pontailler, J.; Dufrene, E.; Baldocchi, D. Transpiration of a boreal pine forest measured by branch bag, sap flow and micrometeorological methods. Tree Physiol. 1997, 17, 511–519. [Google Scholar] [CrossRef]
  30. Warren, S.G. Optical-Properties of Snow. Rev. Geophys. 1982, 20, 67–89. [Google Scholar] [CrossRef]
  31. Dozier, J.; Warren, S.G. Effect of Viewing Angle on the Infrared Brightness Temperature of Snow. Water Resour. Res. 1982, 18, 1424–1434. [Google Scholar] [CrossRef]
  32. Prata, A.J. A new long-wave formula for estimating downward clear-sky radiation at the surface. Q. J. R. Meteor. Soc. 1996, 122, 1127–1151. [Google Scholar] [CrossRef]
  33. Kimball, B.A.; Idso, S.B.; Aase, J.K. A Model of Thermal-Radiation from Partly Cloudy and Overcast Skies. Water Resour. Res. 1982, 18, 931–936. [Google Scholar] [CrossRef]
  34. Flerchinger, G.; Xaio, W.; Marks, D.; Sauer, T.; Yu, Q. Comparison of algorithms for incoming atmospheric long-wave radiation. Water Resour. Res. 2009, 45. [Google Scholar] [CrossRef] [Green Version]
  35. Warren, S.G.; Wiscombe, W.J. A Model for the Spectral Albedo of Snow. II: Snow Containing Atmospheric Aerosols. J. Atmos. Sci. 1980, 37, 2734–2745. [Google Scholar] [CrossRef]
  36. Wiscombe, W.J.; Warren, S.G. A Model for the Spectral Albedo of Snow. I: Pure Snow. J. Atmos. Sci. 1980, 37, 2712–2733. [Google Scholar] [CrossRef] [Green Version]
  37. Melloh, R.A.; Hardy, J.P.; Bailey, R.N.; Hall, T.J. An efficient snow albedo model for the open and sub-canopy. Hydrol. Process. 2002, 16, 3571–3584. [Google Scholar] [CrossRef]
  38. Wang, Z.; Zeng, X.B. Evaluation of Snow Albedo in Land Models for Weather and Climate Studies. J. Appl. Meteorol. Clim. 2010, 49, 363–380. [Google Scholar] [CrossRef]
  39. Eck, T.F.; Deering, D.W. Canopy Albedo and Transmittance in a Boreal Forest. Remote Sens. Sci. Nineties 1990, 1–3, 883–886. [Google Scholar]
  40. Eck, T.F.; Deering, D.W. Canopy Albedo and Transmittance in a Spruce-Hemlock Forest in Mid-September. Agric. For. Meteorol. 1992, 59, 237–248. [Google Scholar] [CrossRef]
  41. Liu, B.Y.H.; Jordan, R.C. The Interrelationship and Characteristic Distribution of Direct, Diffuse and Total Solar Radiation. Sol. Energy 1960, 4, 1–19. [Google Scholar] [CrossRef]
  42. Monteith, J.L.; Unsworth, M.H. Principles of Environmental Physics, 3rd ed.; Elsevier: Amsterdam, The Netherlands; Boston, MA, USA, 2008; 418p. [Google Scholar]
  43. Campbell, G.S. Soil Physics with BASIC: Transport Models for Soil-Plant Systems; Elsevier: Amsterdam, The Netherlands; New York, NY, USA, 1985; 150p. [Google Scholar]
  44. Gryning, S.-E.; Batchvarova, E.; De Bruin, H. Energy balance of a sparse coniferous high-latitude forest under winter conditions. Bound Lay Meteorol. 2001, 99, 465–488. [Google Scholar] [CrossRef]
  45. Strong, W. Tree canopy effects on understory species abundance in high-latitude Populus tremuloides stands, Yukon, Canada. Community Ecol. 2011, 12, 89–98. [Google Scholar] [CrossRef]
  46. Ellis, C.; Pomeroy, J.; Essery, R.; Link, T. Effects of needleleaf forest cover on radiation and snowmelt dynamics in the Canadian Rocky Mountains. Can. J. For. Res. 2011, 41, 608–620. [Google Scholar] [CrossRef]
  47. Hardy, J.; Davis, R.; Jordan, R.; Li, X.; Woodcock, C.; Ni, W.; McKenzie, J. Snow ablation modeling at the stand scale in a boreal jack pine forest. J. Geophys. Res. Atmos. 1997, 102, 29397–29405. [Google Scholar] [CrossRef]
  48. Pomeroy, J.W.; Dion, K. Winter radiation extinction and reflection in a boreal pine canopy: Measurements and modelling. Hydrol. Process. 1996, 10, 1591–1608. [Google Scholar] [CrossRef]
  49. Koivusalo, H.; Kokkonen, T. Snow processes in a forest clearing and in a coniferous forest. J. Hydrol. 2002, 262, 145–164. [Google Scholar] [CrossRef]
  50. Hedstrom, N.; Pomeroy, J. Measurements and modelling of snow interception in the boreal forest. Hydrol. Process. 1998, 12, 1611–1625. [Google Scholar] [CrossRef]
  51. Essery, R.; Pomeroy, J.; Ellis, C.; Link, T. Modelling longwave radiation to snow beneath forest canopies using hemispherical photography or linear regression. Hydrol. Process. Int. J. 2008, 22, 2788–2800. [Google Scholar] [CrossRef] [Green Version]
  52. Molotch, N.P.; Barnard, D.M.; Burns, S.P.; Painter, T.H. Measuring spatiotemporal variation in snow optical grain size under a subalpine forest canopy using contact spectroscopy. Water Resour. Res. 2016, 52, 7513–7522. [Google Scholar] [CrossRef] [PubMed]
  53. Webster, C.; Rutter, N.; Zahner, F.; Jonas, T. Measurement of incoming radiation below forest canopies: A comparison of different radiometer configurations. J. Hydrometeorol. 2016, 17, 853–864. [Google Scholar] [CrossRef]
  54. Pretzsch, H. Canopy space filling and tree crown morphology in mixed-species stands compared with monocultures. For. Ecol. Manag. 2014, 327, 251–264. [Google Scholar] [CrossRef] [Green Version]
  55. Gratzer, G.; Darabant, A.; Chhetri, P.B.; Rai, P.B.; Eckmüllner, O. Interspecific variation in the response of growth, crown morphology, and survivorship to light of six tree species in the conifer belt of the Bhutan Himalayas. Can. J. For. Res. 2004, 34, 1093–1107. [Google Scholar] [CrossRef]
  56. Ford, K.R.; Ettinger, A.K.; Lundquist, J.D.; Raleigh, M.S.; Lambers, J.H.R. Spatial heterogeneity in ecologically important climate variables at coarse and fine scales in a high-snow mountain landscape. PLoS ONE 2013, 8, e65008. [Google Scholar] [CrossRef] [PubMed]
  57. Turnipseed, A.; Blanken, P.; Anderson, D.; Monson, R.K. Energy budget above a high-elevation subalpine forest in complex topography. Agric. For. Meteorol. 2002, 110, 177–201. [Google Scholar] [CrossRef]
  58. Seyednasrollah, B. solrad: To calculate solar radiation and related variables based on location, time and topographical conditions. Zenodo 2018. [Google Scholar] [CrossRef]
Figure 1. Spatial distribution of white spruce in North America. The six locations considered for analyses (see Table 1) are also identified (image has been modified based on the original map from www.usgs.gov).
Hydrology 06 00062 g001
Figure 2. Variations of net shortwave radiation on level forests with vegetation density at different sites under clear and interspersed cloudy sky conditions. Legend lists the sites in increasing order of latitude from top to bottom.
Hydrology 06 00062 g002
Figure 3. Variations of net shortwave radiation with vegetation density at different sites for different slope angles and aspect of the forested hillslope under clear sky conditions. Legend lists the sites in increasing order of latitude from top to bottom.
Hydrology 06 00062 g003
Figure 4. Variations of net shortwave radiation with vegetation density at different sites for different slope angles and aspects of the forested hillslope under interspersed cloudy sky conditions. Legend lists the sites in increasing order of latitude from top to bottom.
Hydrology 06 00062 g004
Figure 5. Variations of net longwave radiation on level forests with vegetation density at different sites under clear and interspersed cloudy sky conditions (a) and seasonal average air temperature. (b) Legend lists the sites in increasing order of latitude from top to bottom.
Hydrology 06 00062 g005
Figure 6. Variations of net radiation on level forests with vegetation density at different sites under clear and interspersed cloudy sky conditions. Sites are listed in increasing order of latitude. The orange and purple bands indicate the vegetation densities for which shortwave (ΔSNet/ΔLNet > 5) and longwave (ΔLNet/ΔSNet > 5) radiation components dominantly control the variation with latitude, respectively. Δ denotes the range of respective energy component for each site.
Hydrology 06 00062 g006
Figure 7. Variations of net radiation with vegetation density at different sites for different slope angles and aspects of the forested hillslope under clear sky conditions. Sites are listed in increasing order of latitude. The orange and purple bands indicate the vegetation densities for which shortwave ( Δ S N e t / Δ L N e t   > 5) and longwave ( Δ L N e t / Δ S N e t   > 5) radiation components dominantly control the variation with latitude, respectively. Δ denotes the range of respective energy component for each site.
Hydrology 06 00062 g007
Figure 8. Variations of net radiation with vegetation density at different sites for different slope angles and aspects of the forested hillslope under interspersed cloudy sky conditions. Sites are listed in increasing order of latitude. The purple band indicates the vegetation densities for which longwave (ΔLNet/ΔSNet > 5) radiation components dominantly control the variation with latitude. Δ denotes the range of respective energy component for each site.
Hydrology 06 00062 g008
Table 1. Geography of the study sites.
SiteNCDC CodeLatitude (°N)Longitude (°W)Elevation (m)
Greenville, ME, USAKGNR45.569.6423
Prince Albert, SK, CanadaCYPA53.2105.7428
Buffalo Narrows, SK, CanadaCYVT55.8108.4440
Trout Lake, BC, CanadaCWTE60.4121.2498
Chulitna, AK, USAPAEC62.8149.9411.5
Indian Mountains, AK, USAPAIM66.0153.7388.9
Table 2. Climatological characteristics of the study sites.
SiteObservation PeriodSeasonal Average Air Temperature (°C)Seasonal Cloud Cover (%)
Greenville1982–2012−1.256
Prince Albert1955–2012−4.853
Buffalo Narrows1979–2012−4.553
Trout Lake1994–2012−8.551
Chulitna2006–2012−3.468
Indian Mountains2005–2012−9.369
Table 3. Minimum and maximum net radiation compared to radiation in open ( NSRF open ) and very dense ( NSRF dense ) areas for level forests at different locations.
Sky ConditionSite d m i n 1   ( m 1 ) N S R F m i n ( W m 2 ) d m a x 1   ( m 1 ) N S R F m a x ( W m 2 ) N S R F o p e n ( W m 2 ) N S R F d e n s e ( W m 2 )
Clear skyGreenville0.1227.70.0258.256.930.8
Prince Albert0.1121.50.0238.737.127.6
Buffalo Narrows0.121.10.0234.432.728.7
Trout Lake0.0913.60.0223.822.123.6
Chulitna0.0810.40.1723.31423.3
Indian Mountains0.0812.70.1726.915.426.9
Interspersed cloudy skyGreenville0.0123.40.1731.223.431.2
Prince Albert0.0921.50.1728.126.728.1
Buffalo Narrows0.0821.20.1729.12529.1
Trout Lake0.0713.30.172415.324
Chulitna0.011.10.1723.81.123.8
Indian Mountains0.015.90.1727.35.927.3
Table 4. Minimum and maximum net radiation compared to radiation in open ( NSRF open ) and very dense ( NSRF dense ) areas for south-facing forests with slope = 15° at different locations.
Sky ConditionSite d m i n 1   ( m 1 ) N S R F m i n     ( W m 2 ) d m a x 1   ( m 1 ) N S R F m a x     ( W m 2 ) N S R F o p e n     ( W m 2 ) N S R F d e n s e     ( W m 2 )
Clear skyGreenville0.1329.70.027573.531.1
Prince Albert0.1224.80.0255.954.128.1
Buffalo Narrows0.1225.20.0251.649.629.1
Trout Lake0.1118.60.0240.238.324
Chulitna0.1116.50.0332.129.323.6
Indian Mountains0.119.10.0331.929.127.2
Interspersed cloudy skyGreenville0.1127.40.0433.630.931.4
Prince Albert0.1124.50.0238.737.528.4
Buffalo Narrows0.1124.90.0237.436.229.4
Trout Lake0.118.20.0327.52624.2
Chulitna0.016.10.17246.124
Indian Mountains0.0110.30.1727.510.327.5

