

Emotional State Classification from MUSIC-Based Features of Multichannel EEG Signals
 ,
,  , ,
, ,
Abstract
: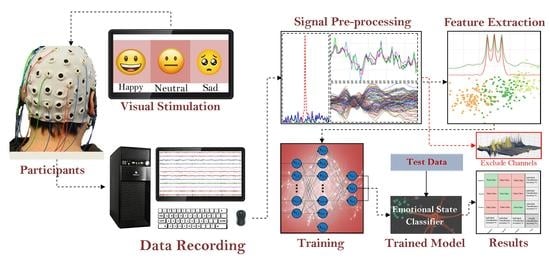
1. Introduction
- Finding technical flaws in the SEED dataset that have not been previously discussed by any research work;
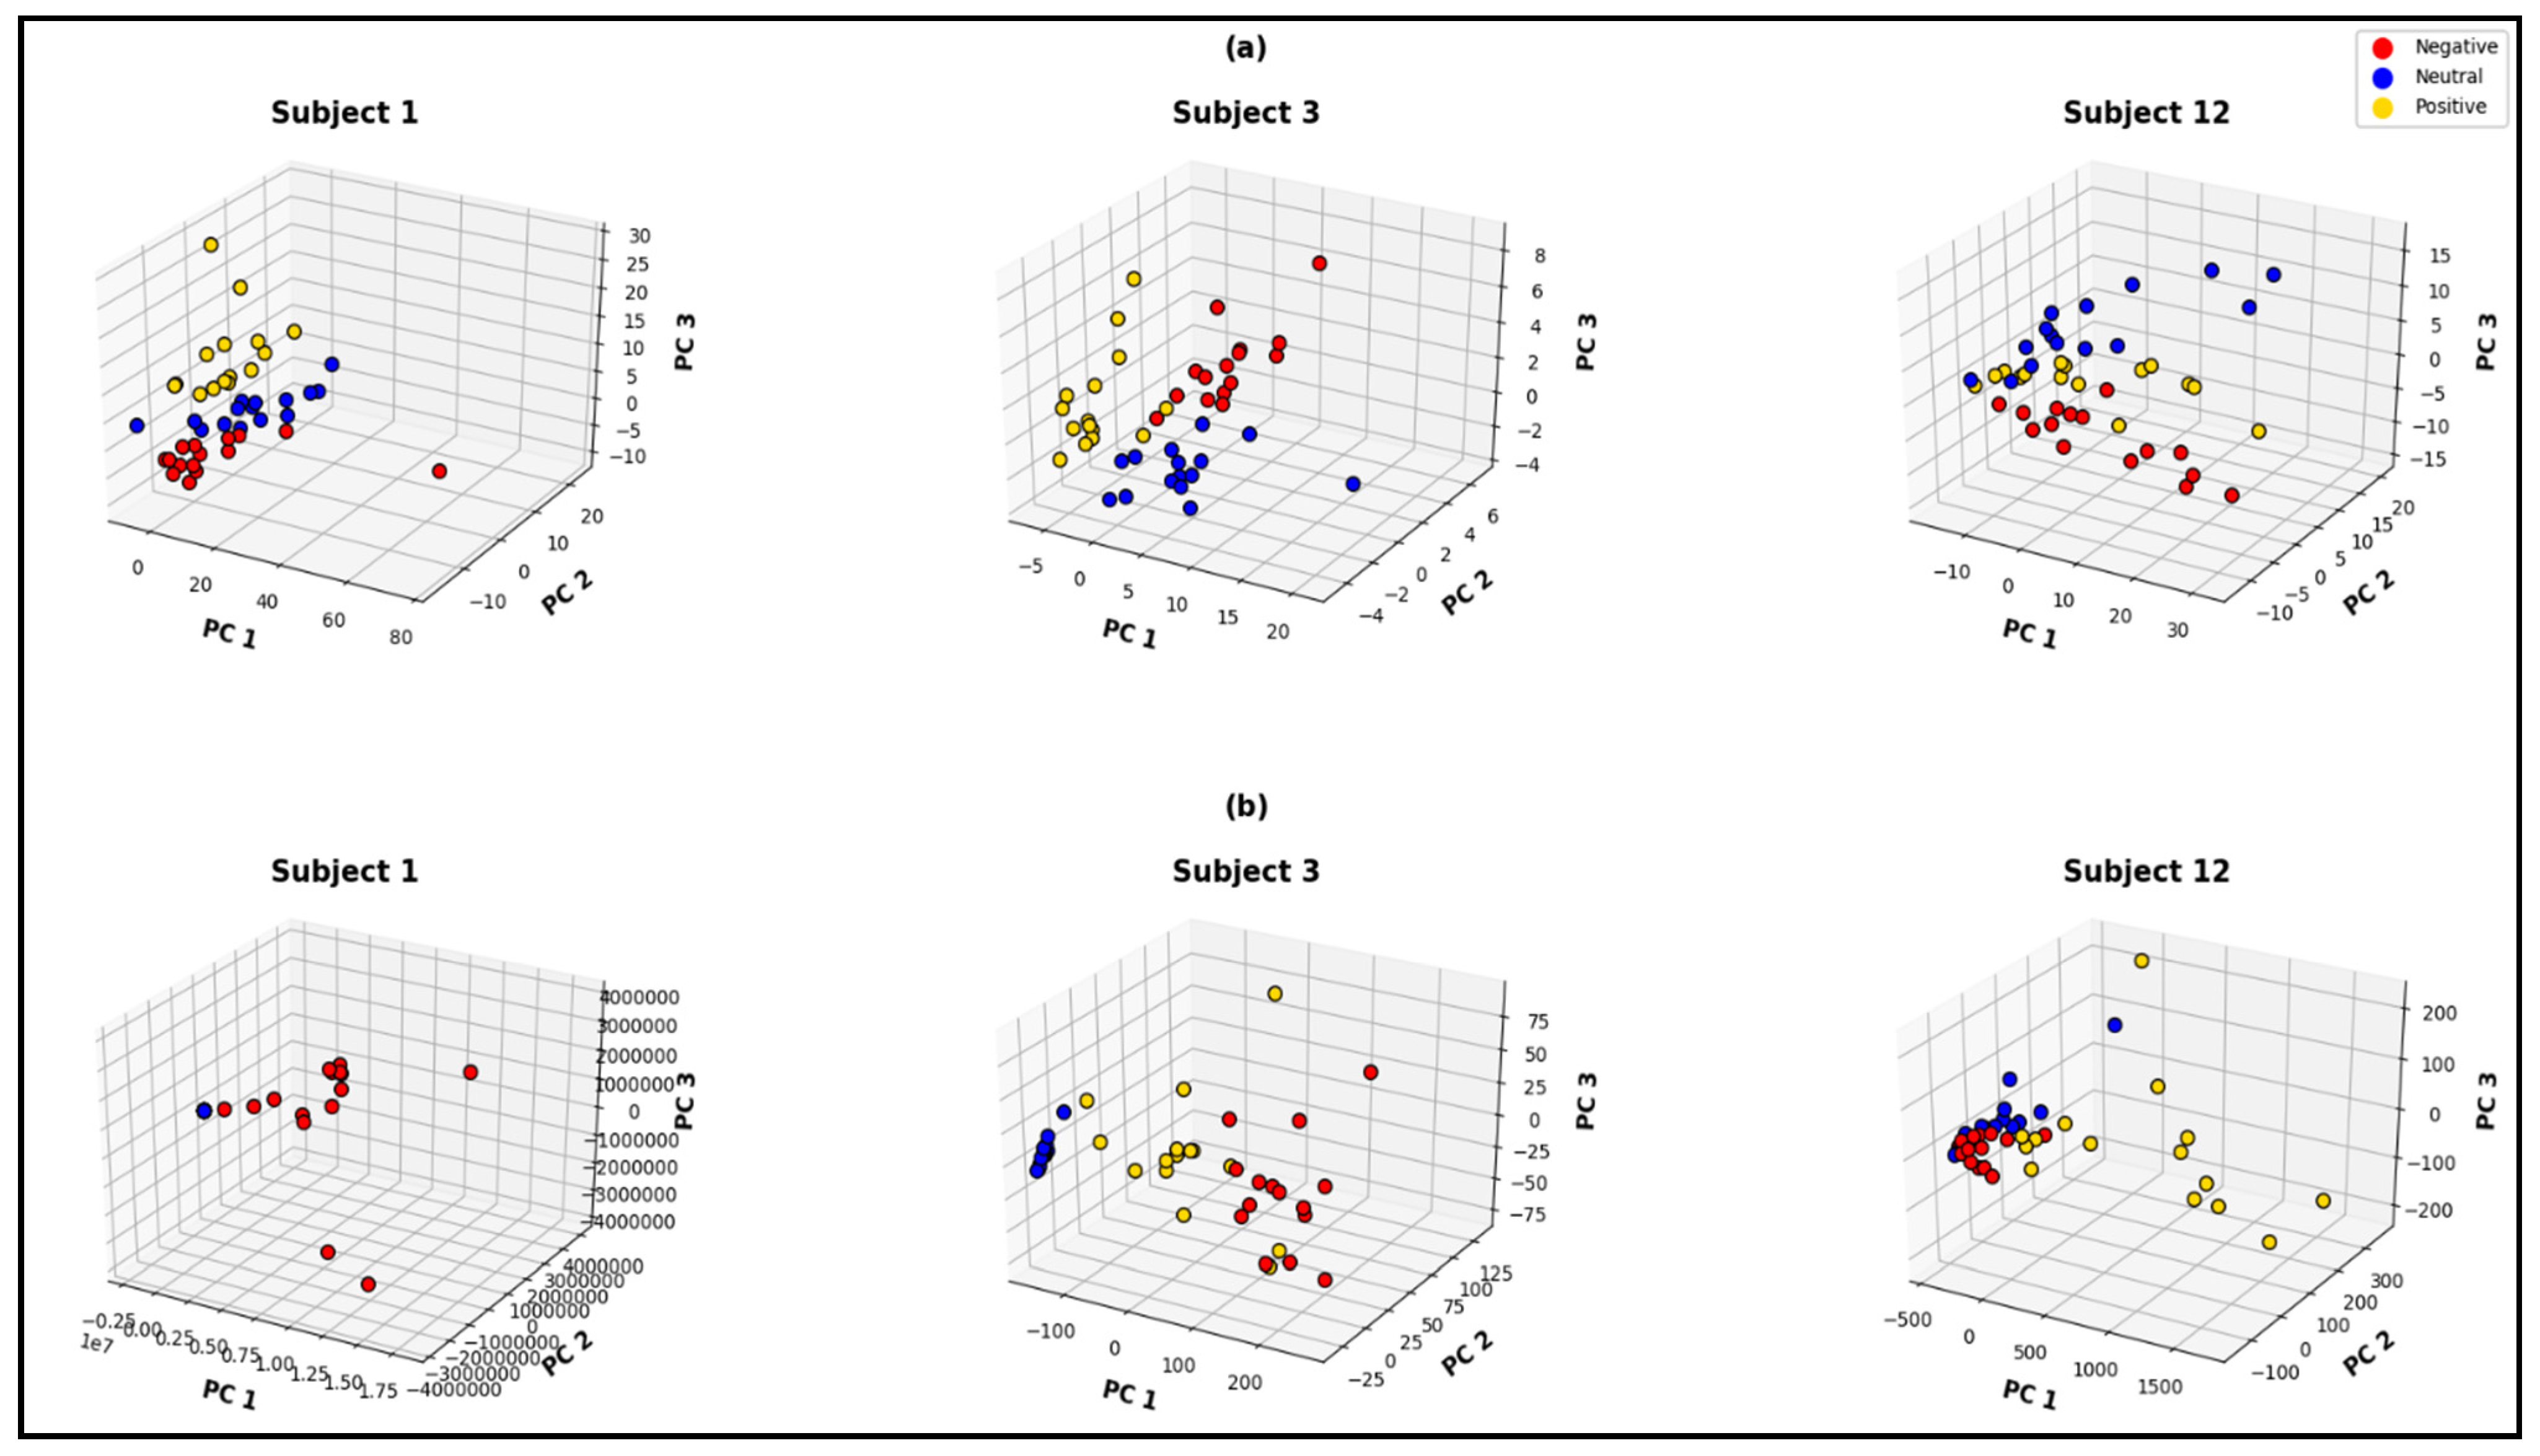
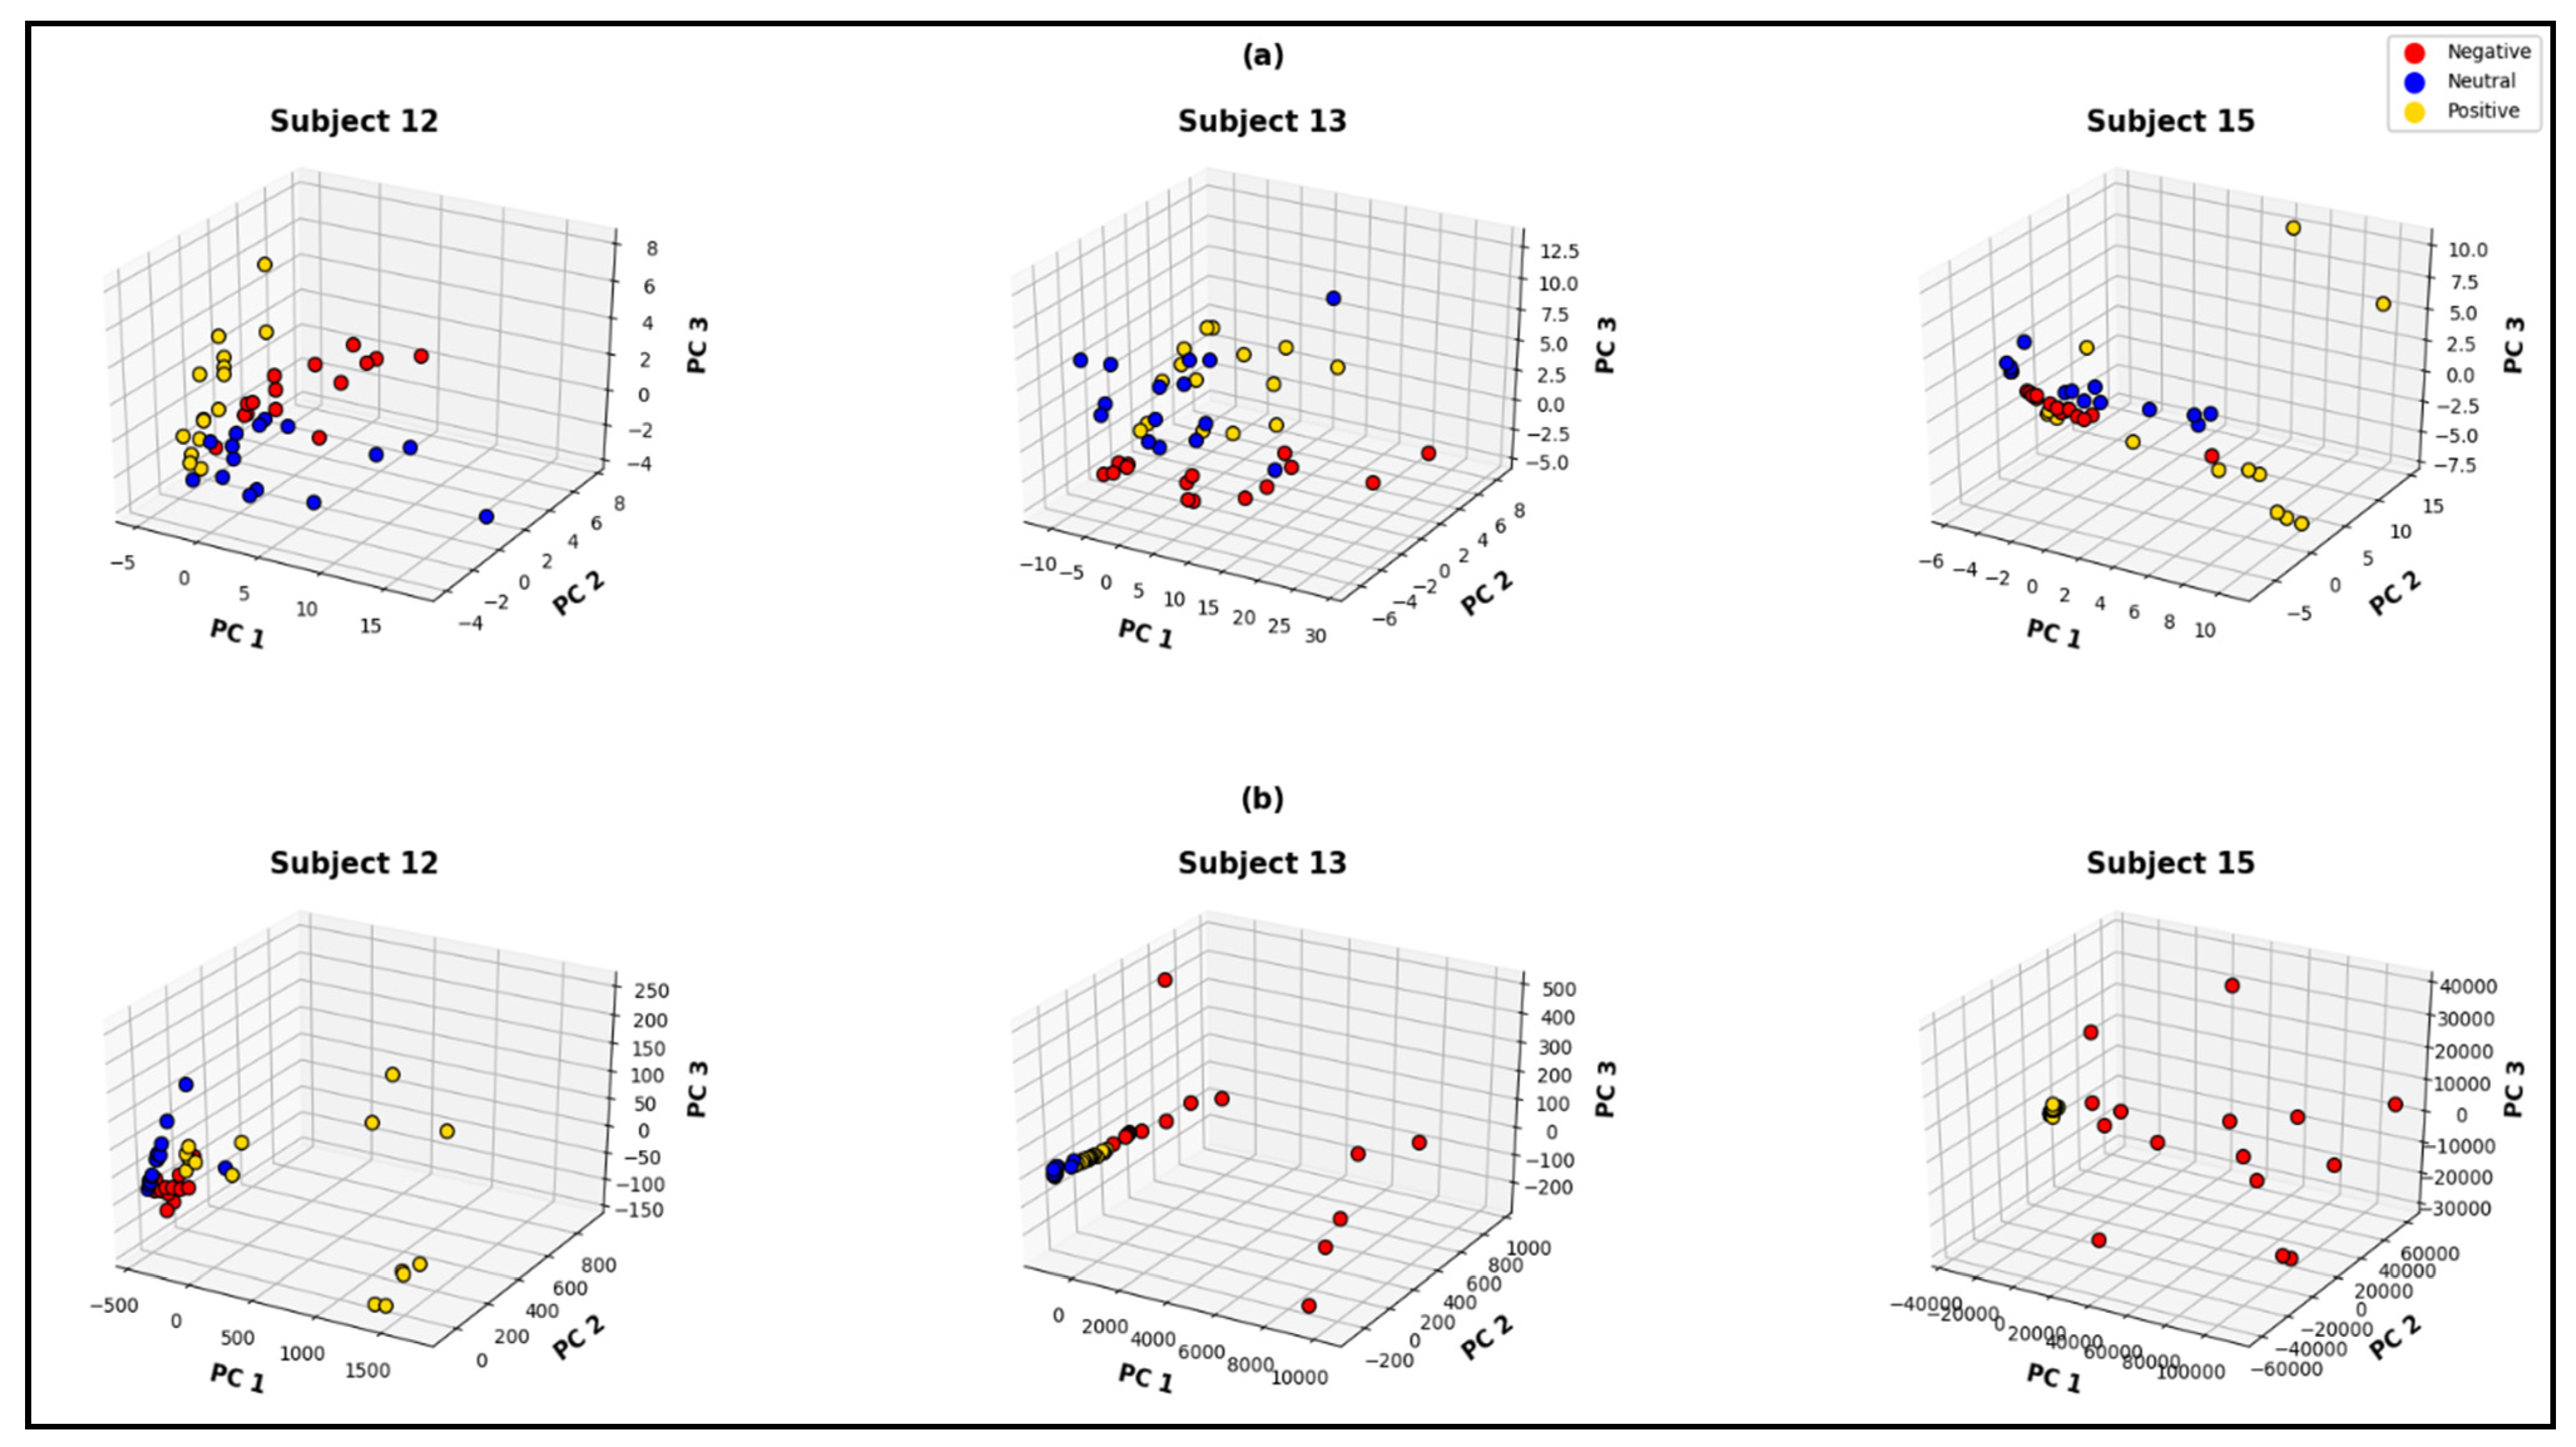
- Implementing an Eigen decomposition-based parametric feature-extraction model in EEG signal;
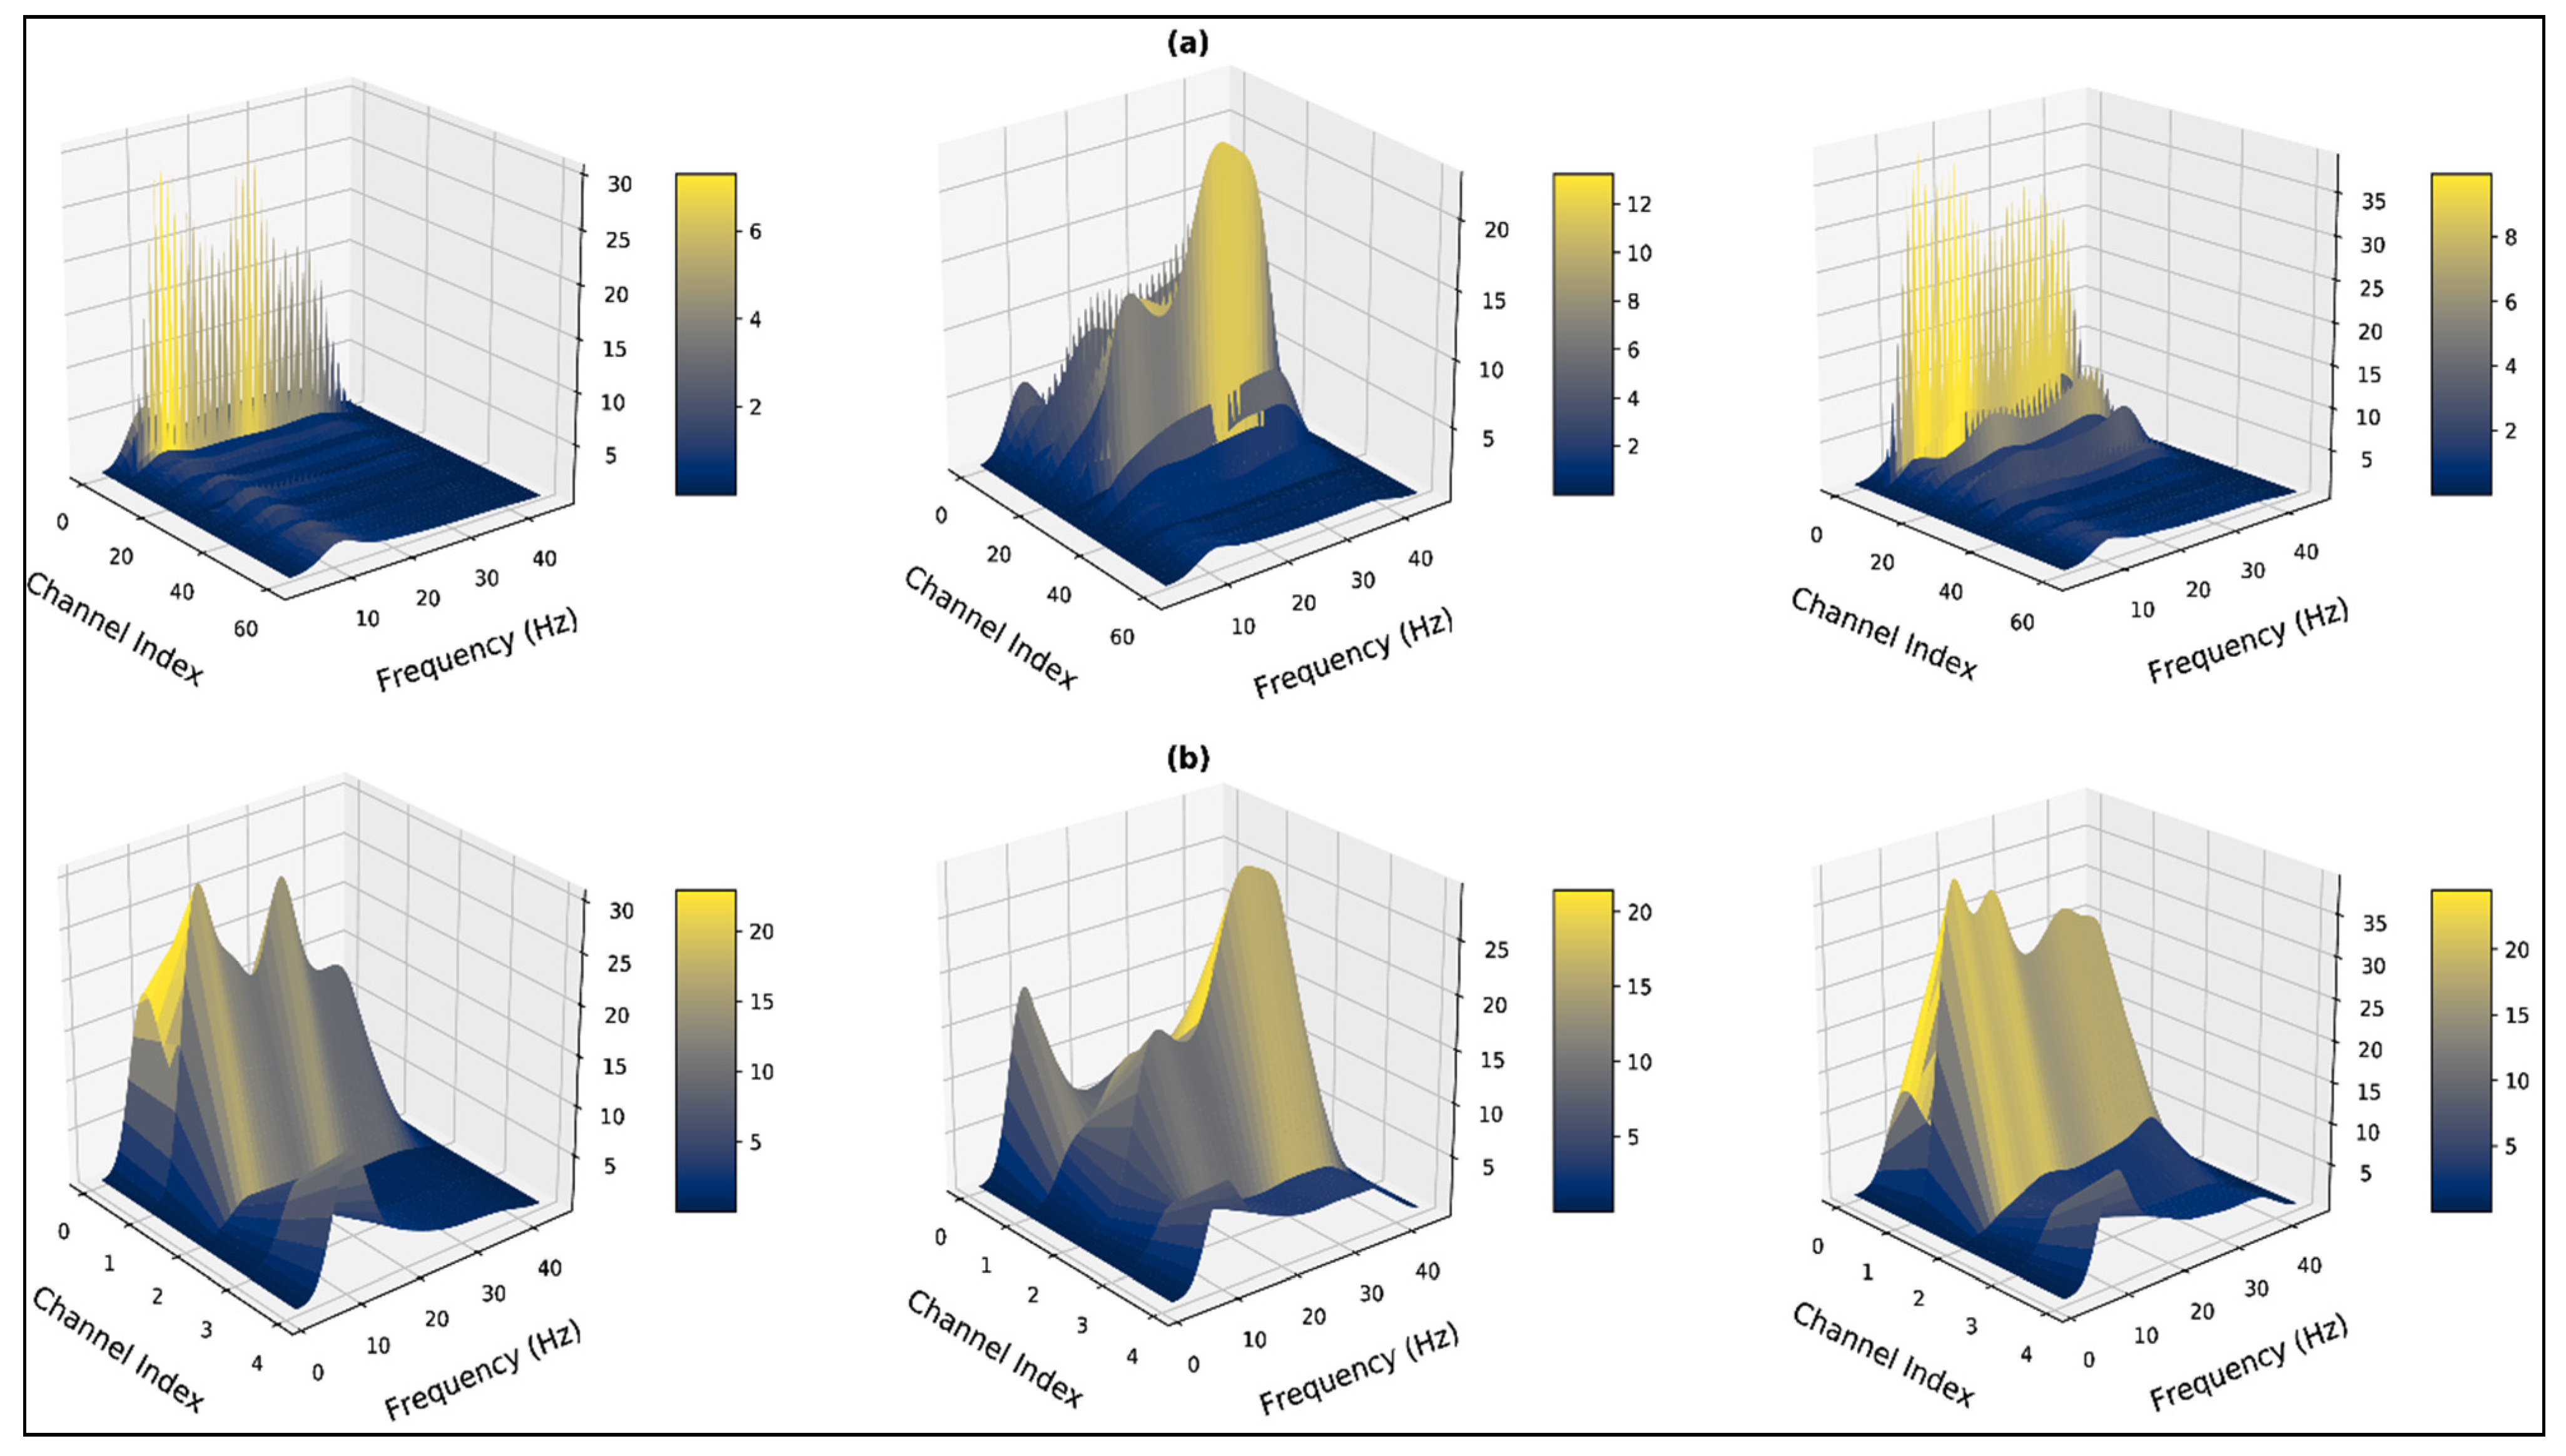
- Proposal of utilizing the MUSIC model for PSD calculation from EEG signals;
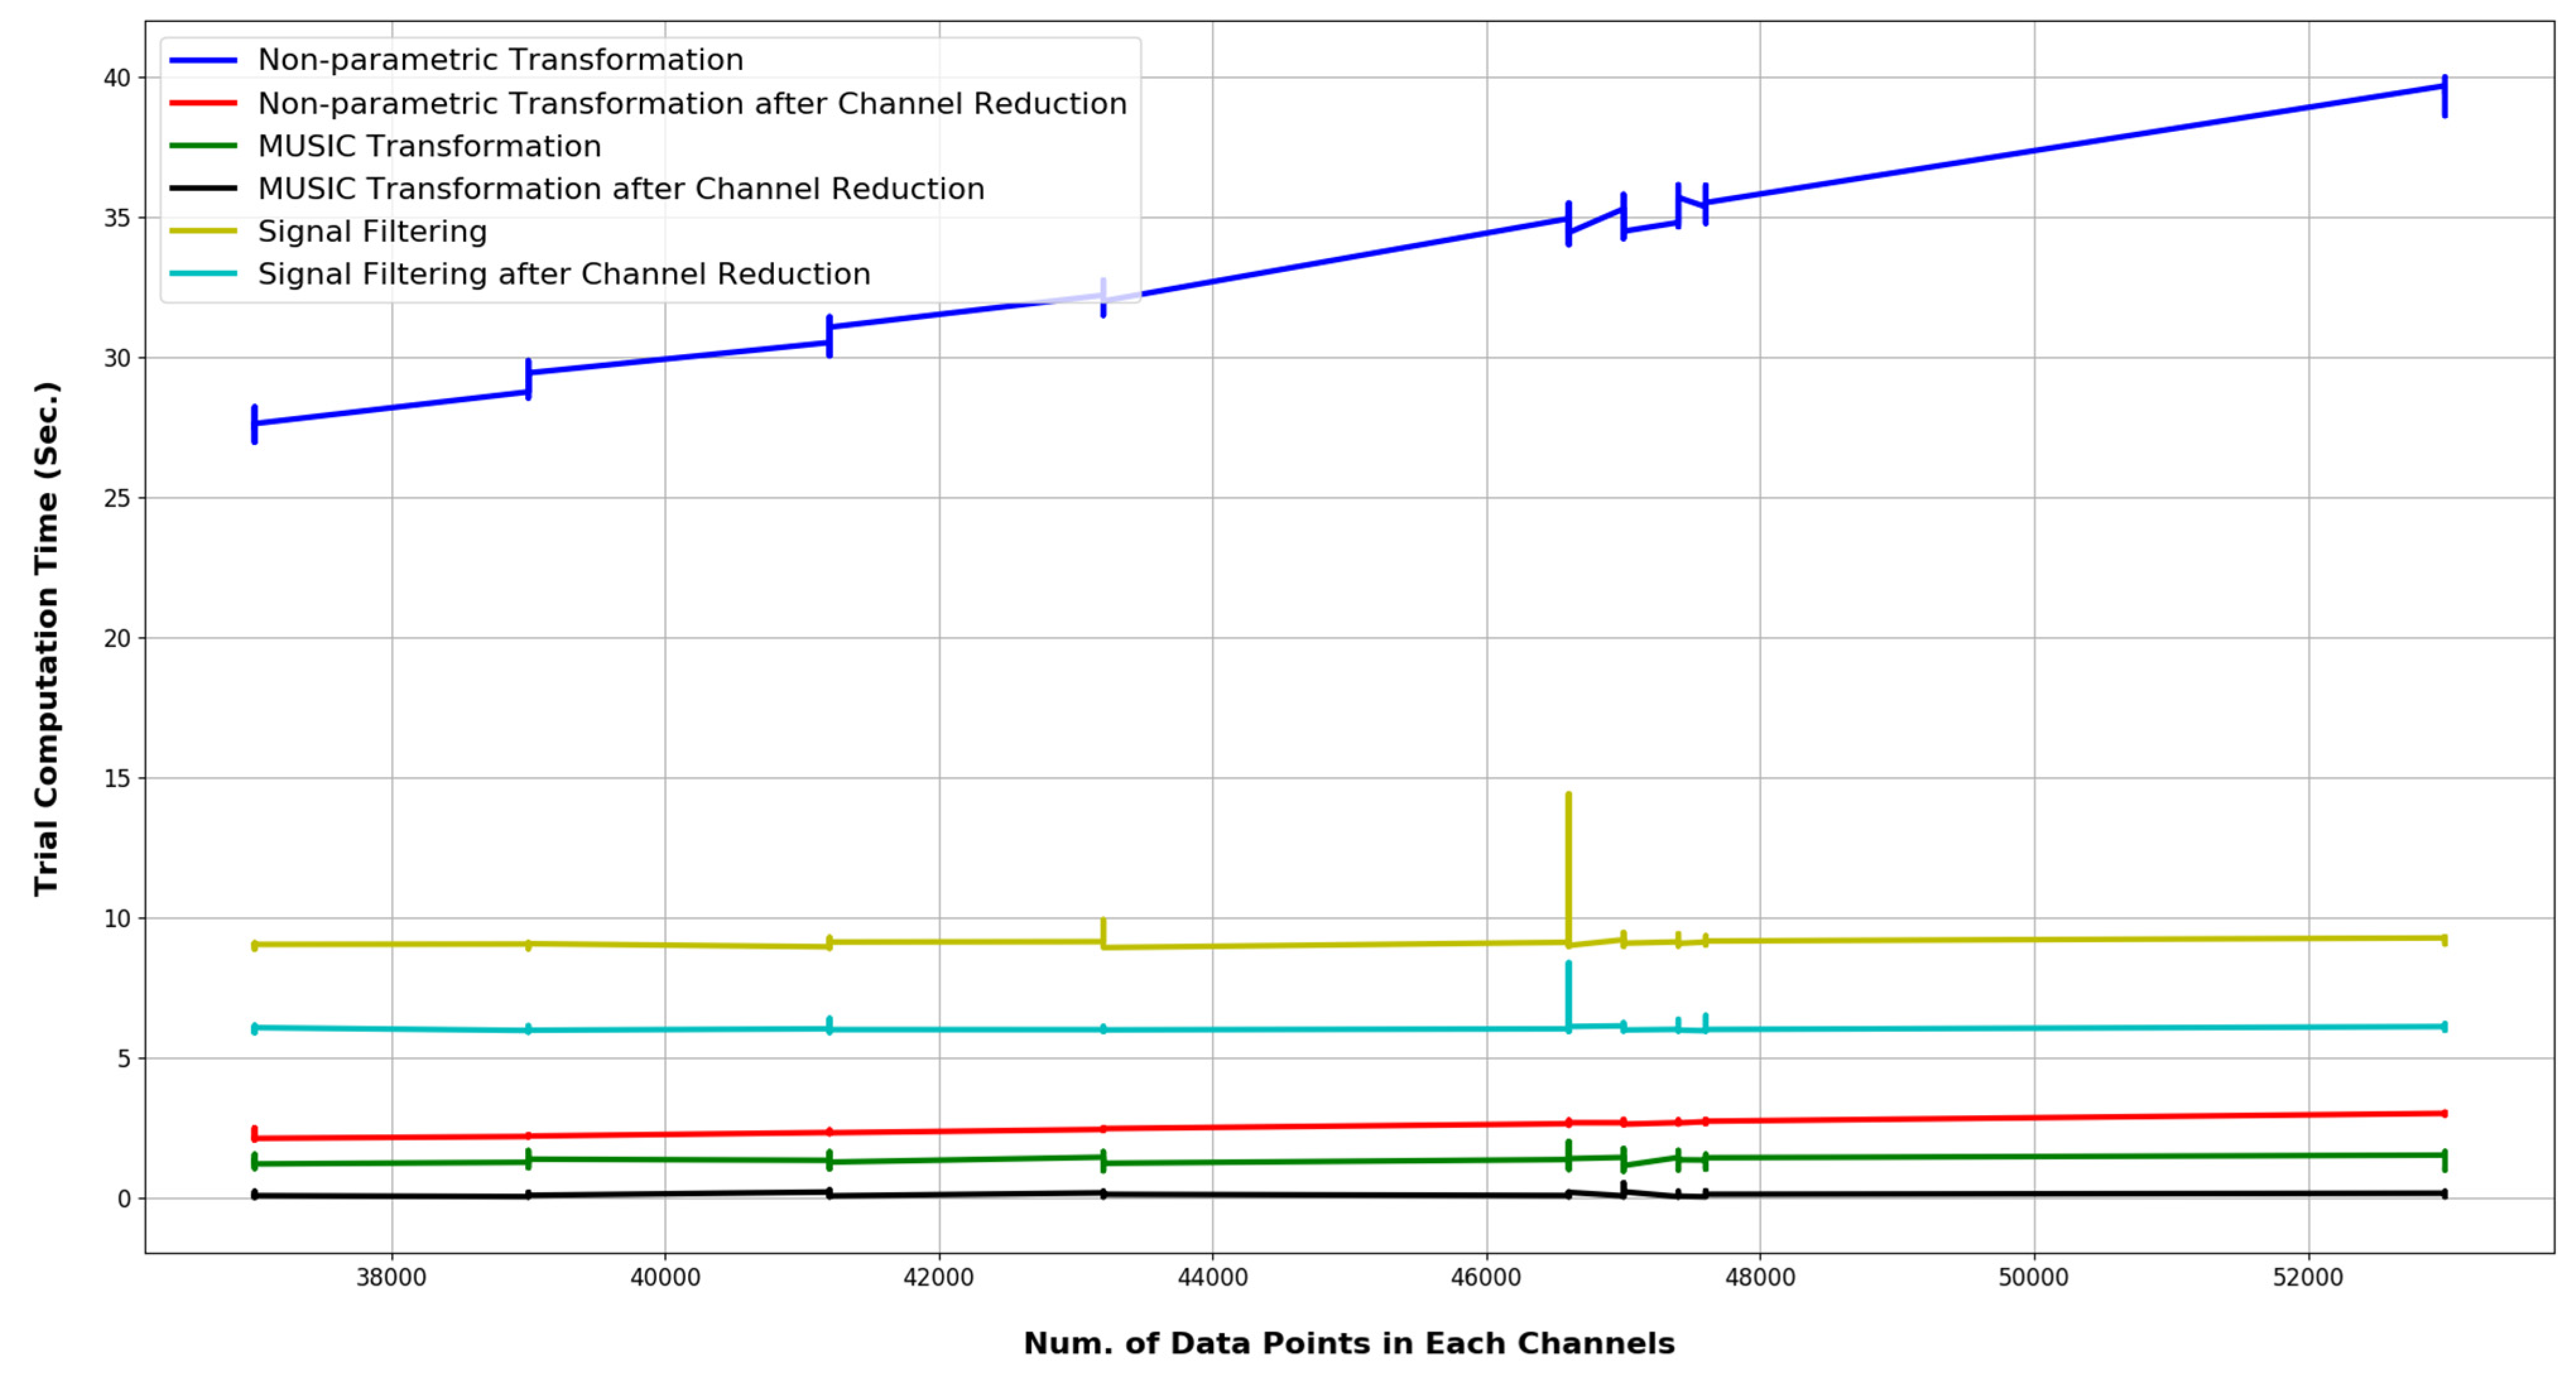
- Run-time comparison between the proposed and conventional PSD estimation;
- Comparison of the emotional state classifications with other works in the same dataset.
2. Dataset
2.1. Dataset Description
2.2. Dataset Examination
3. Material and Methods
3.1. Signal Filtering
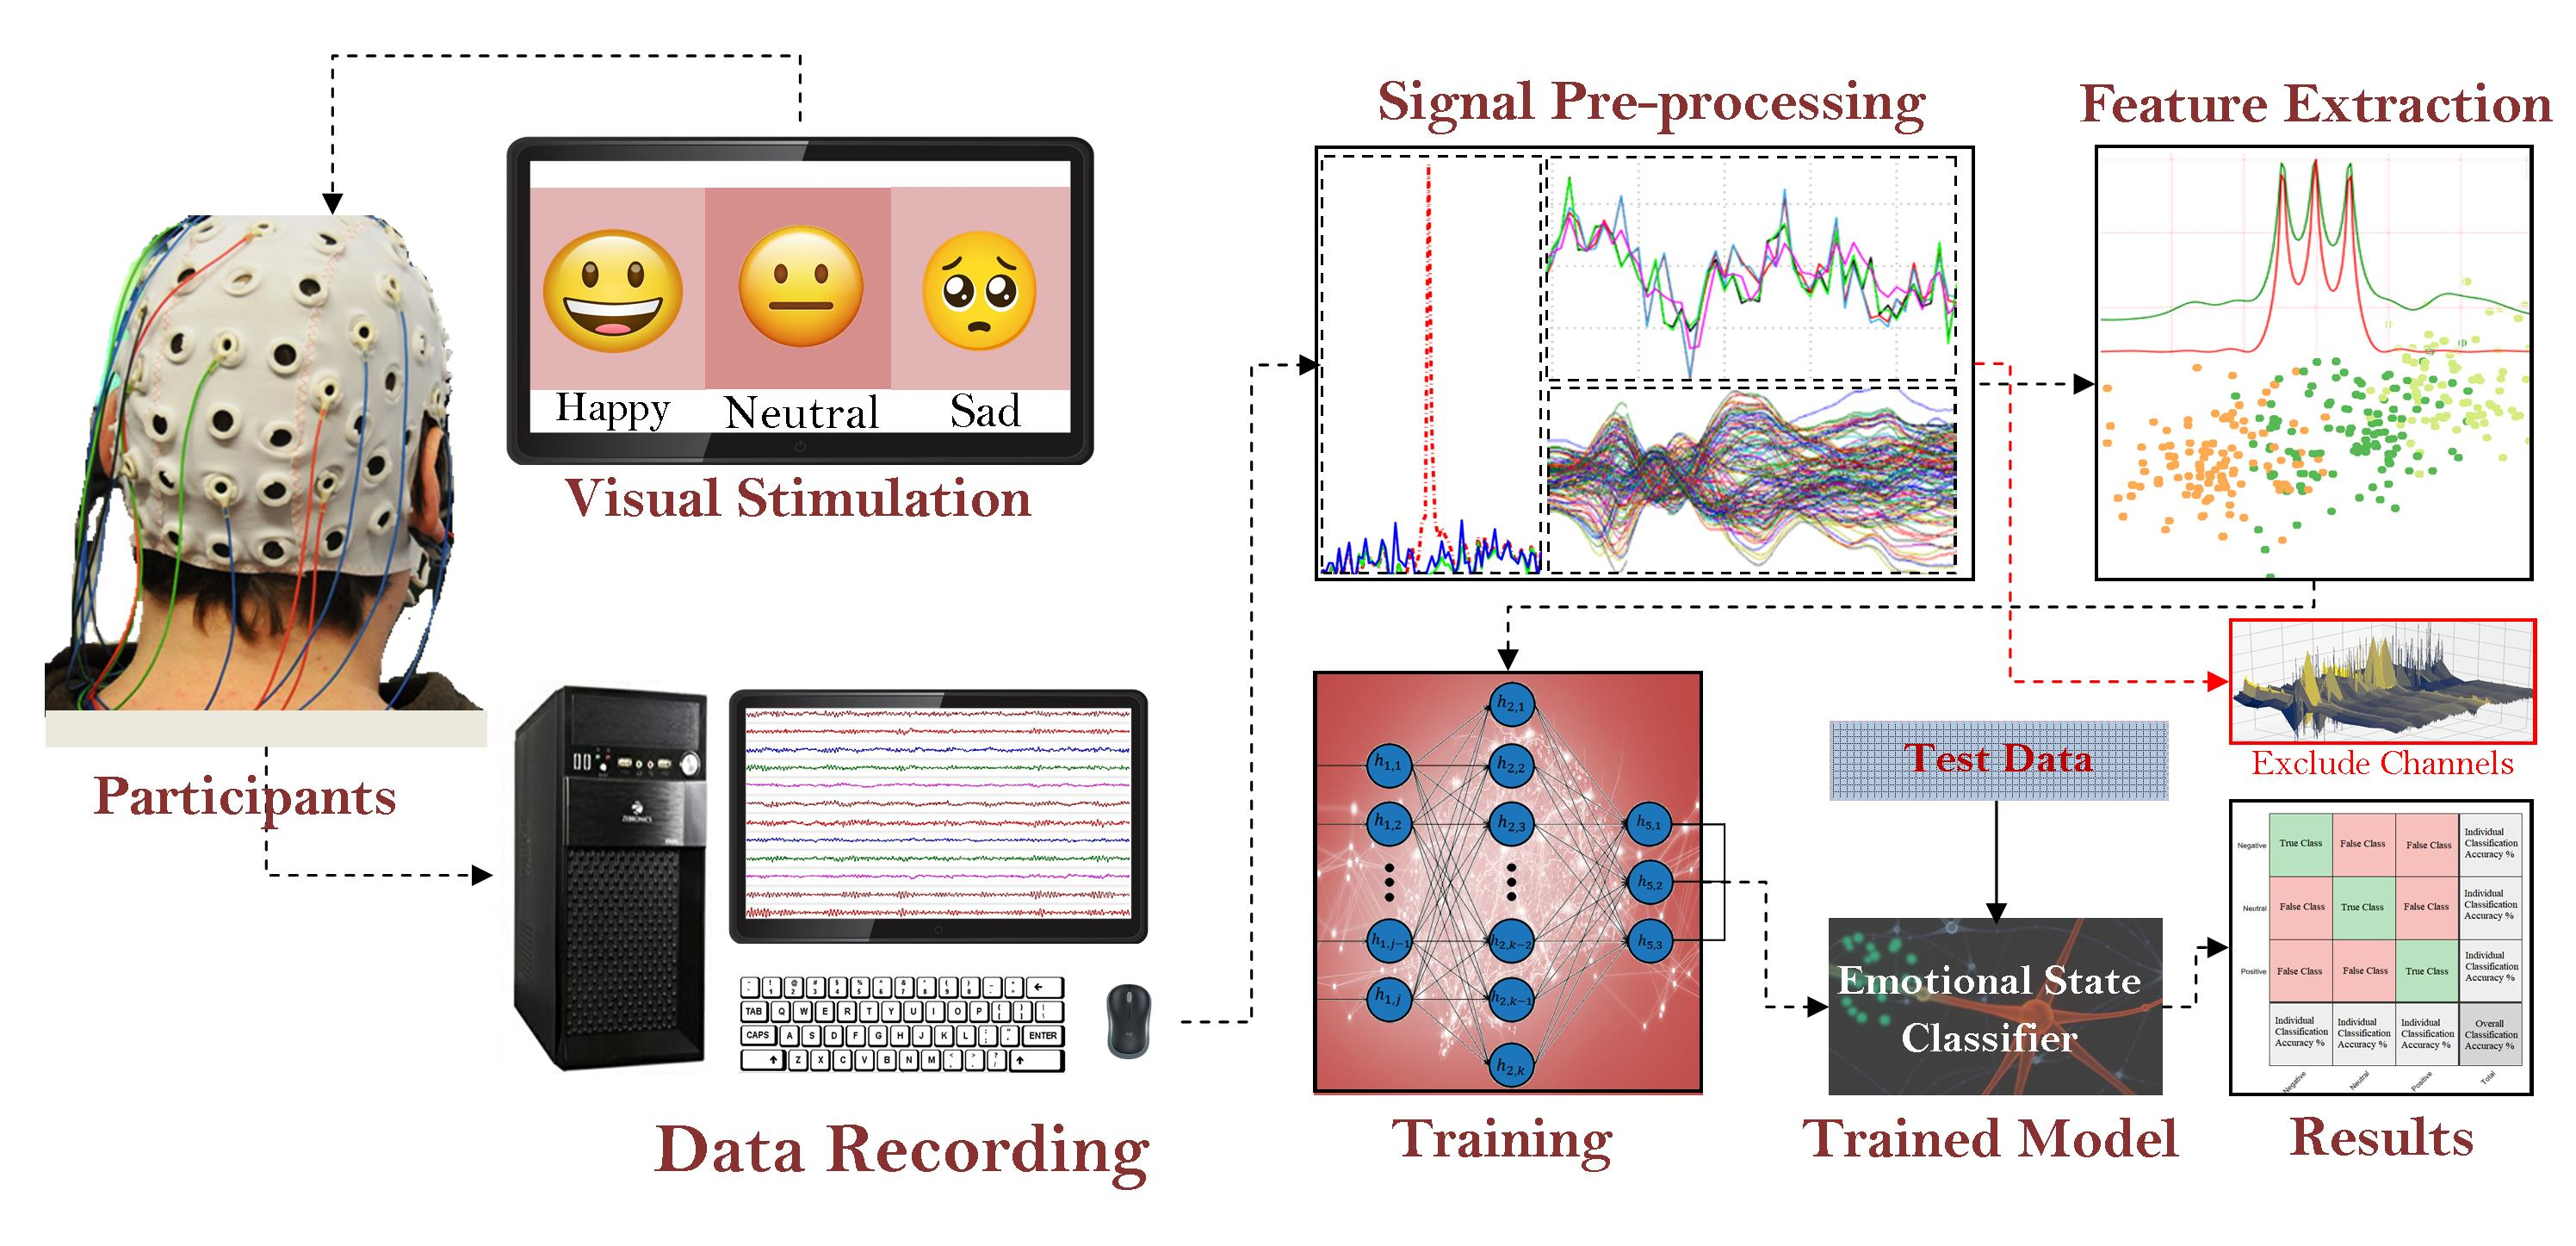
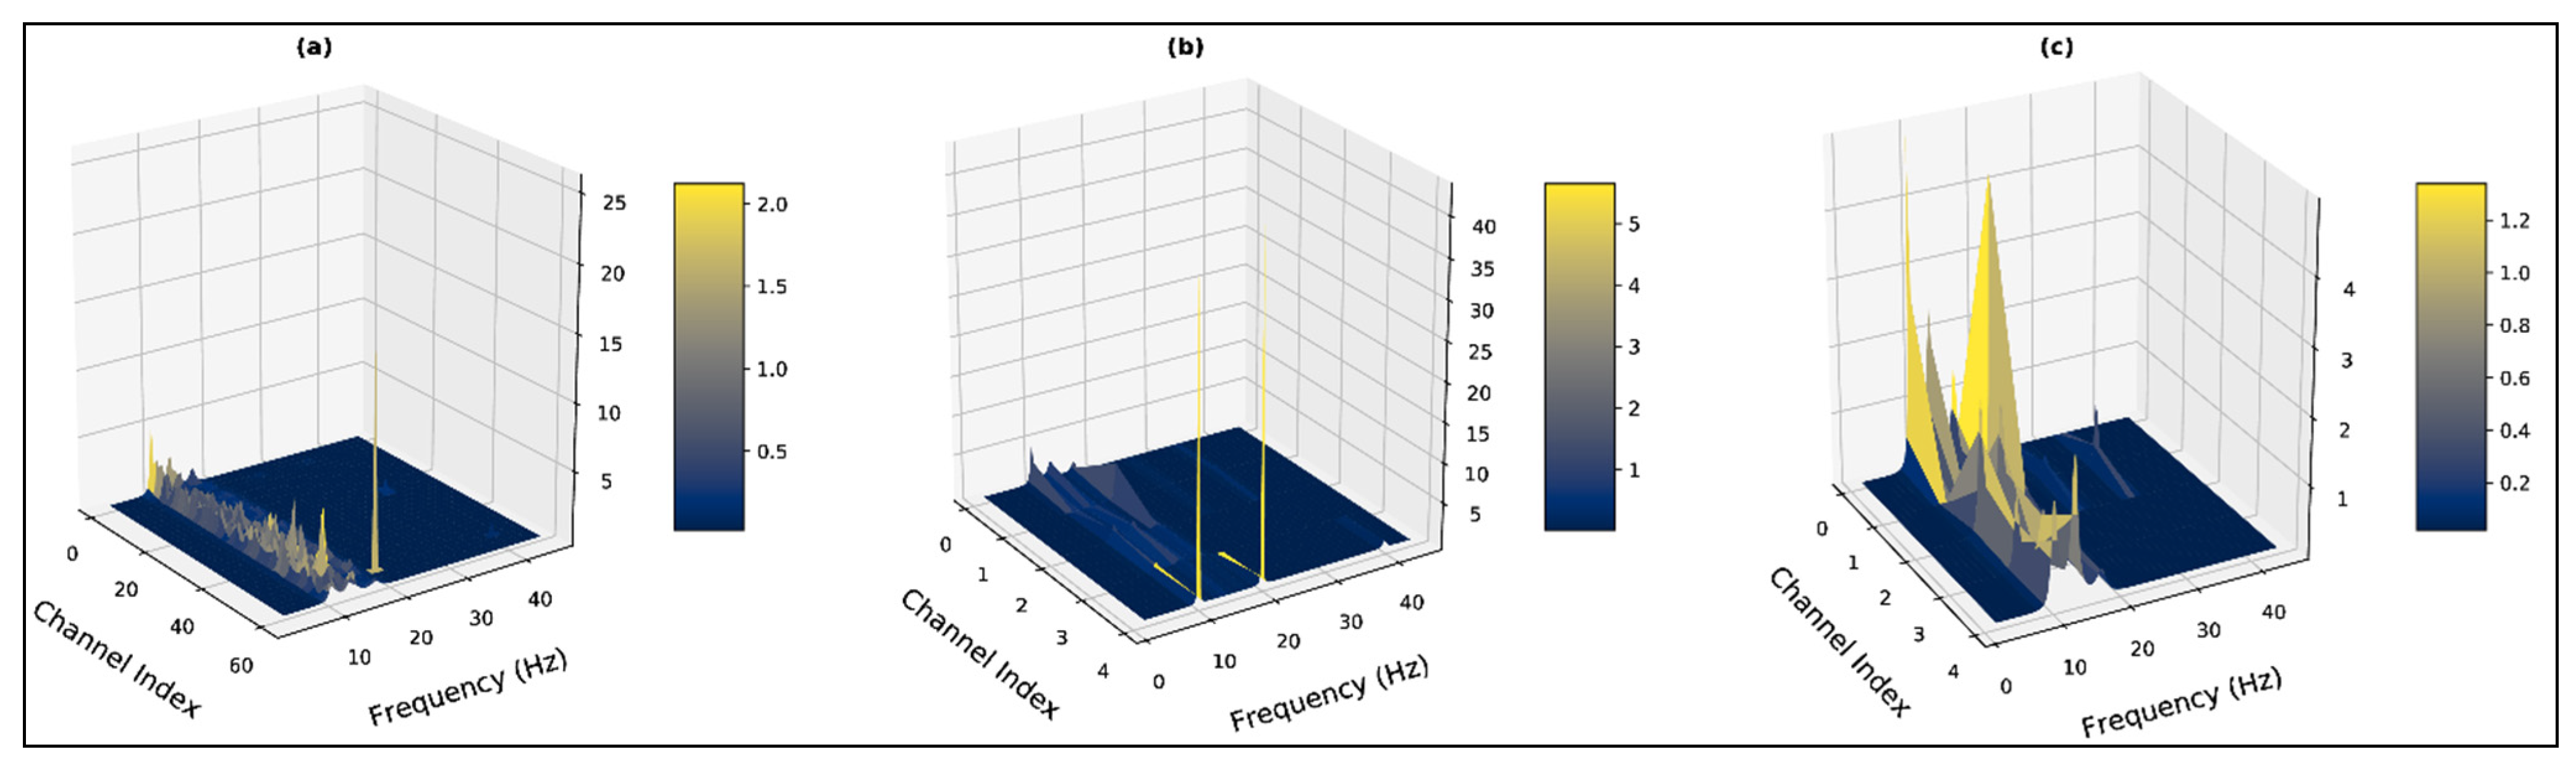
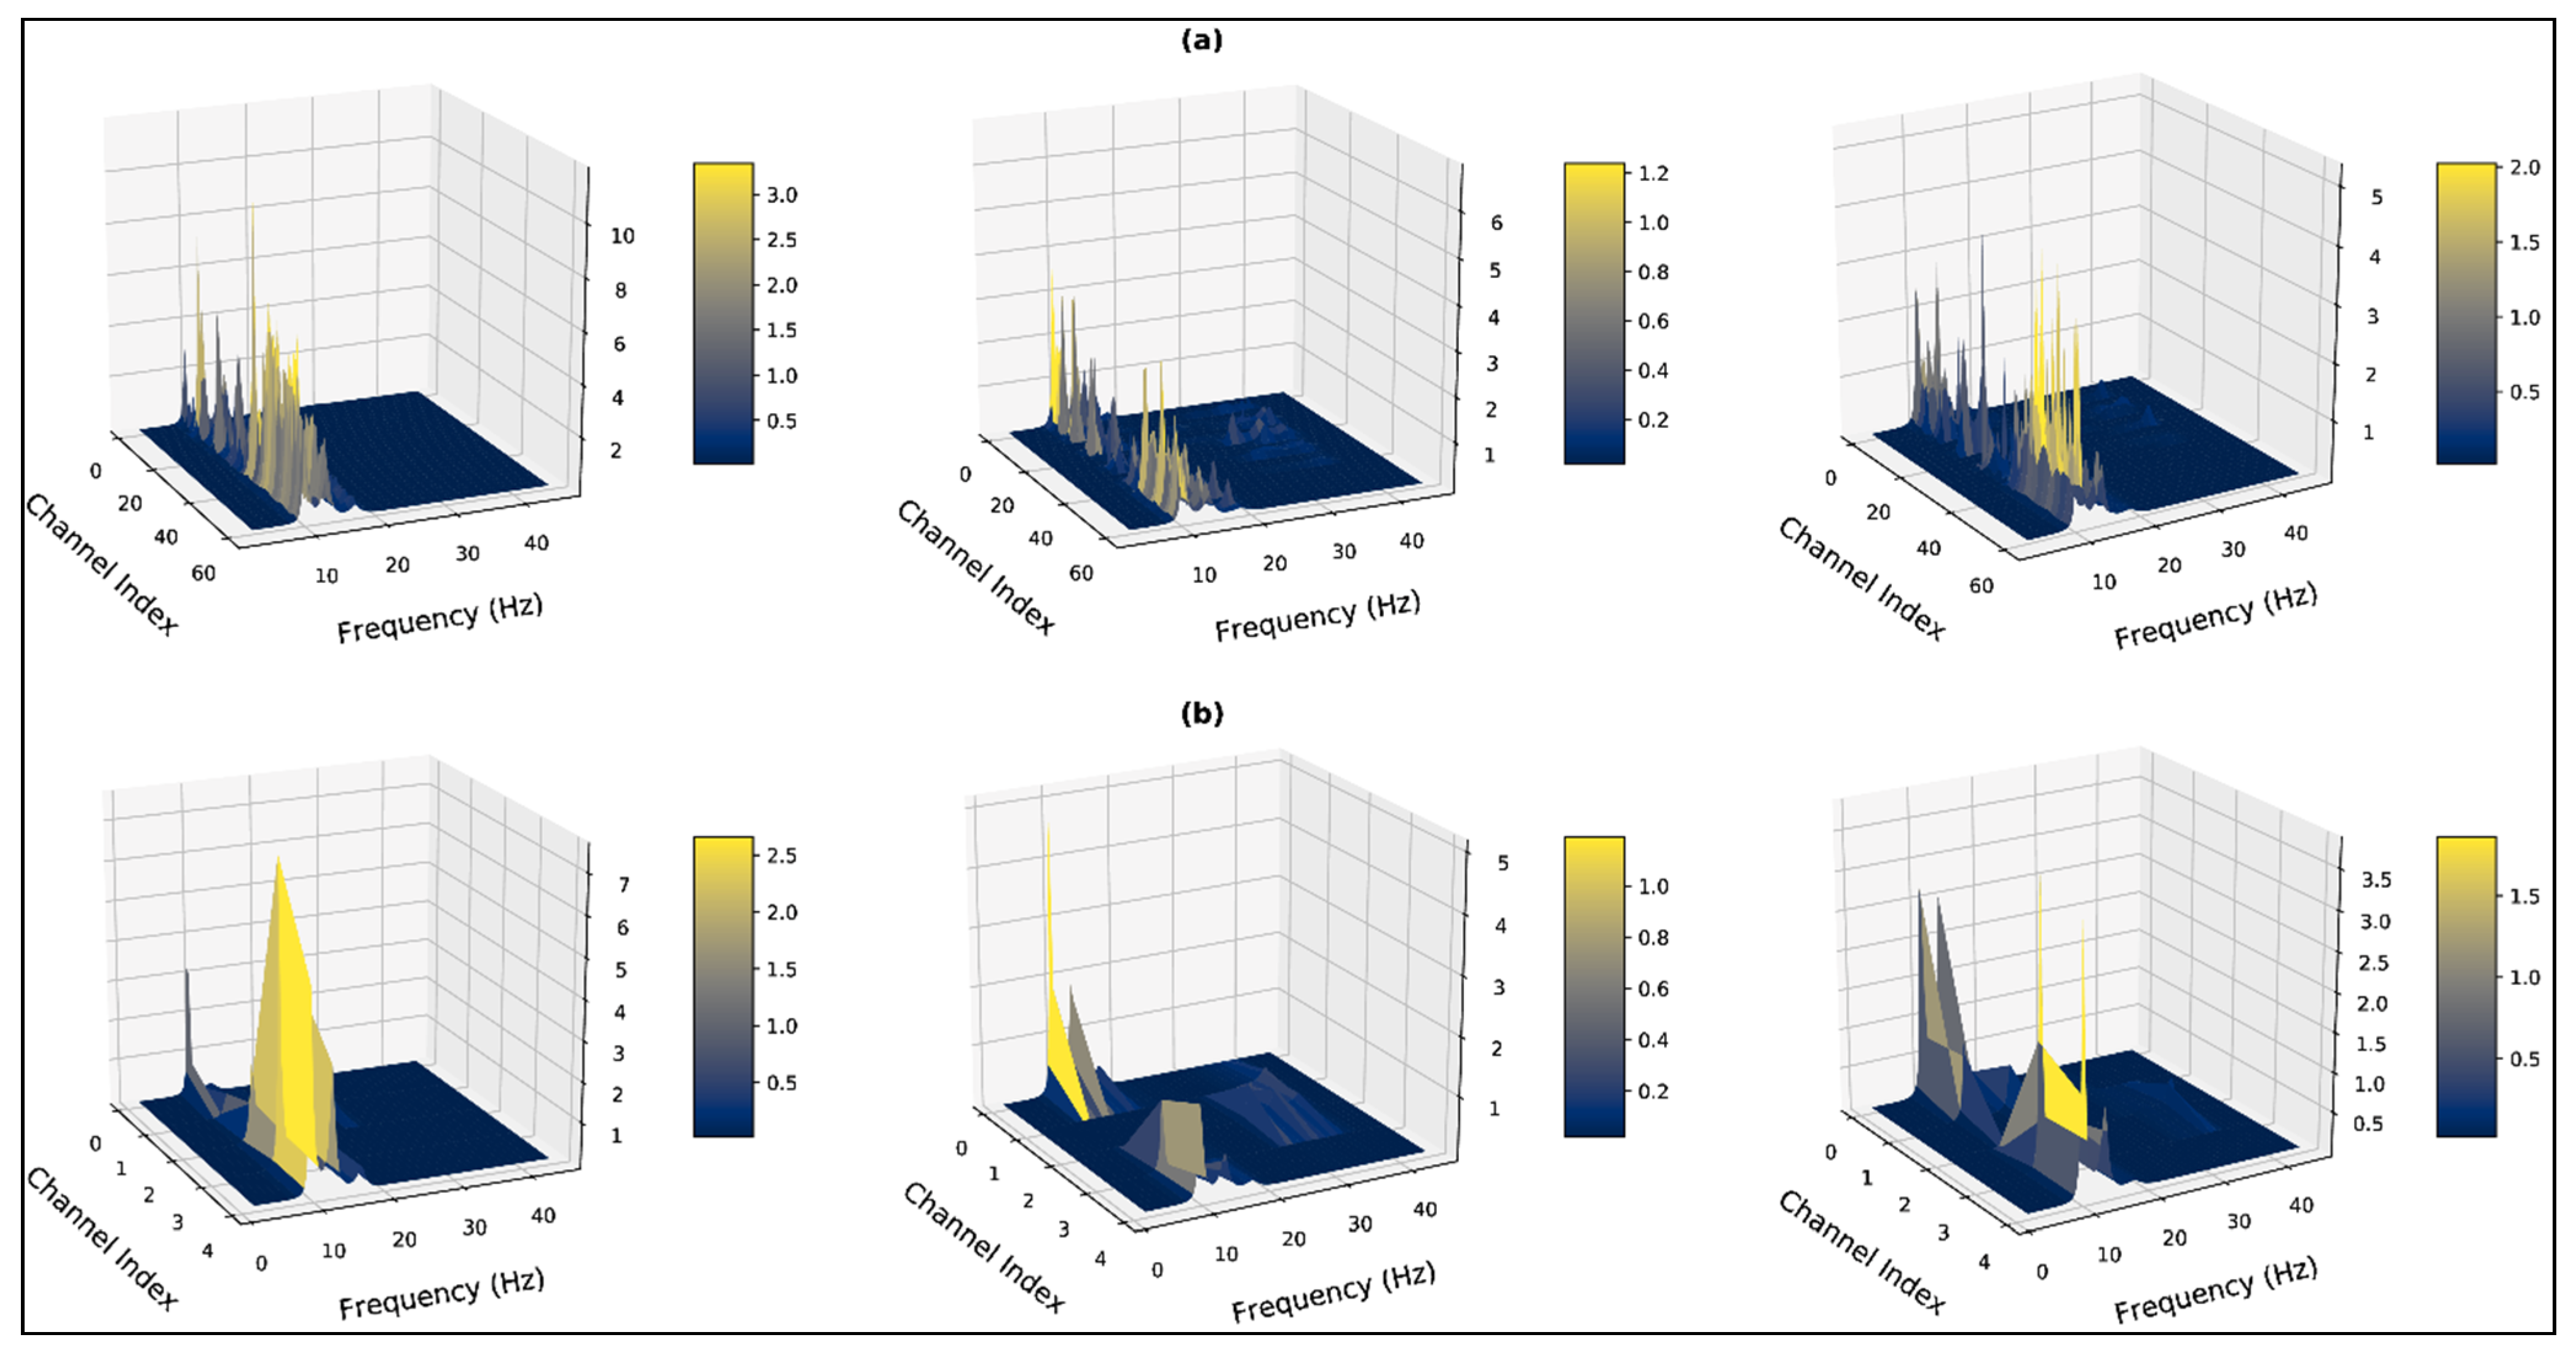
3.2. MUSIC Model
3.3. Pre-Processing and Feature Extraction
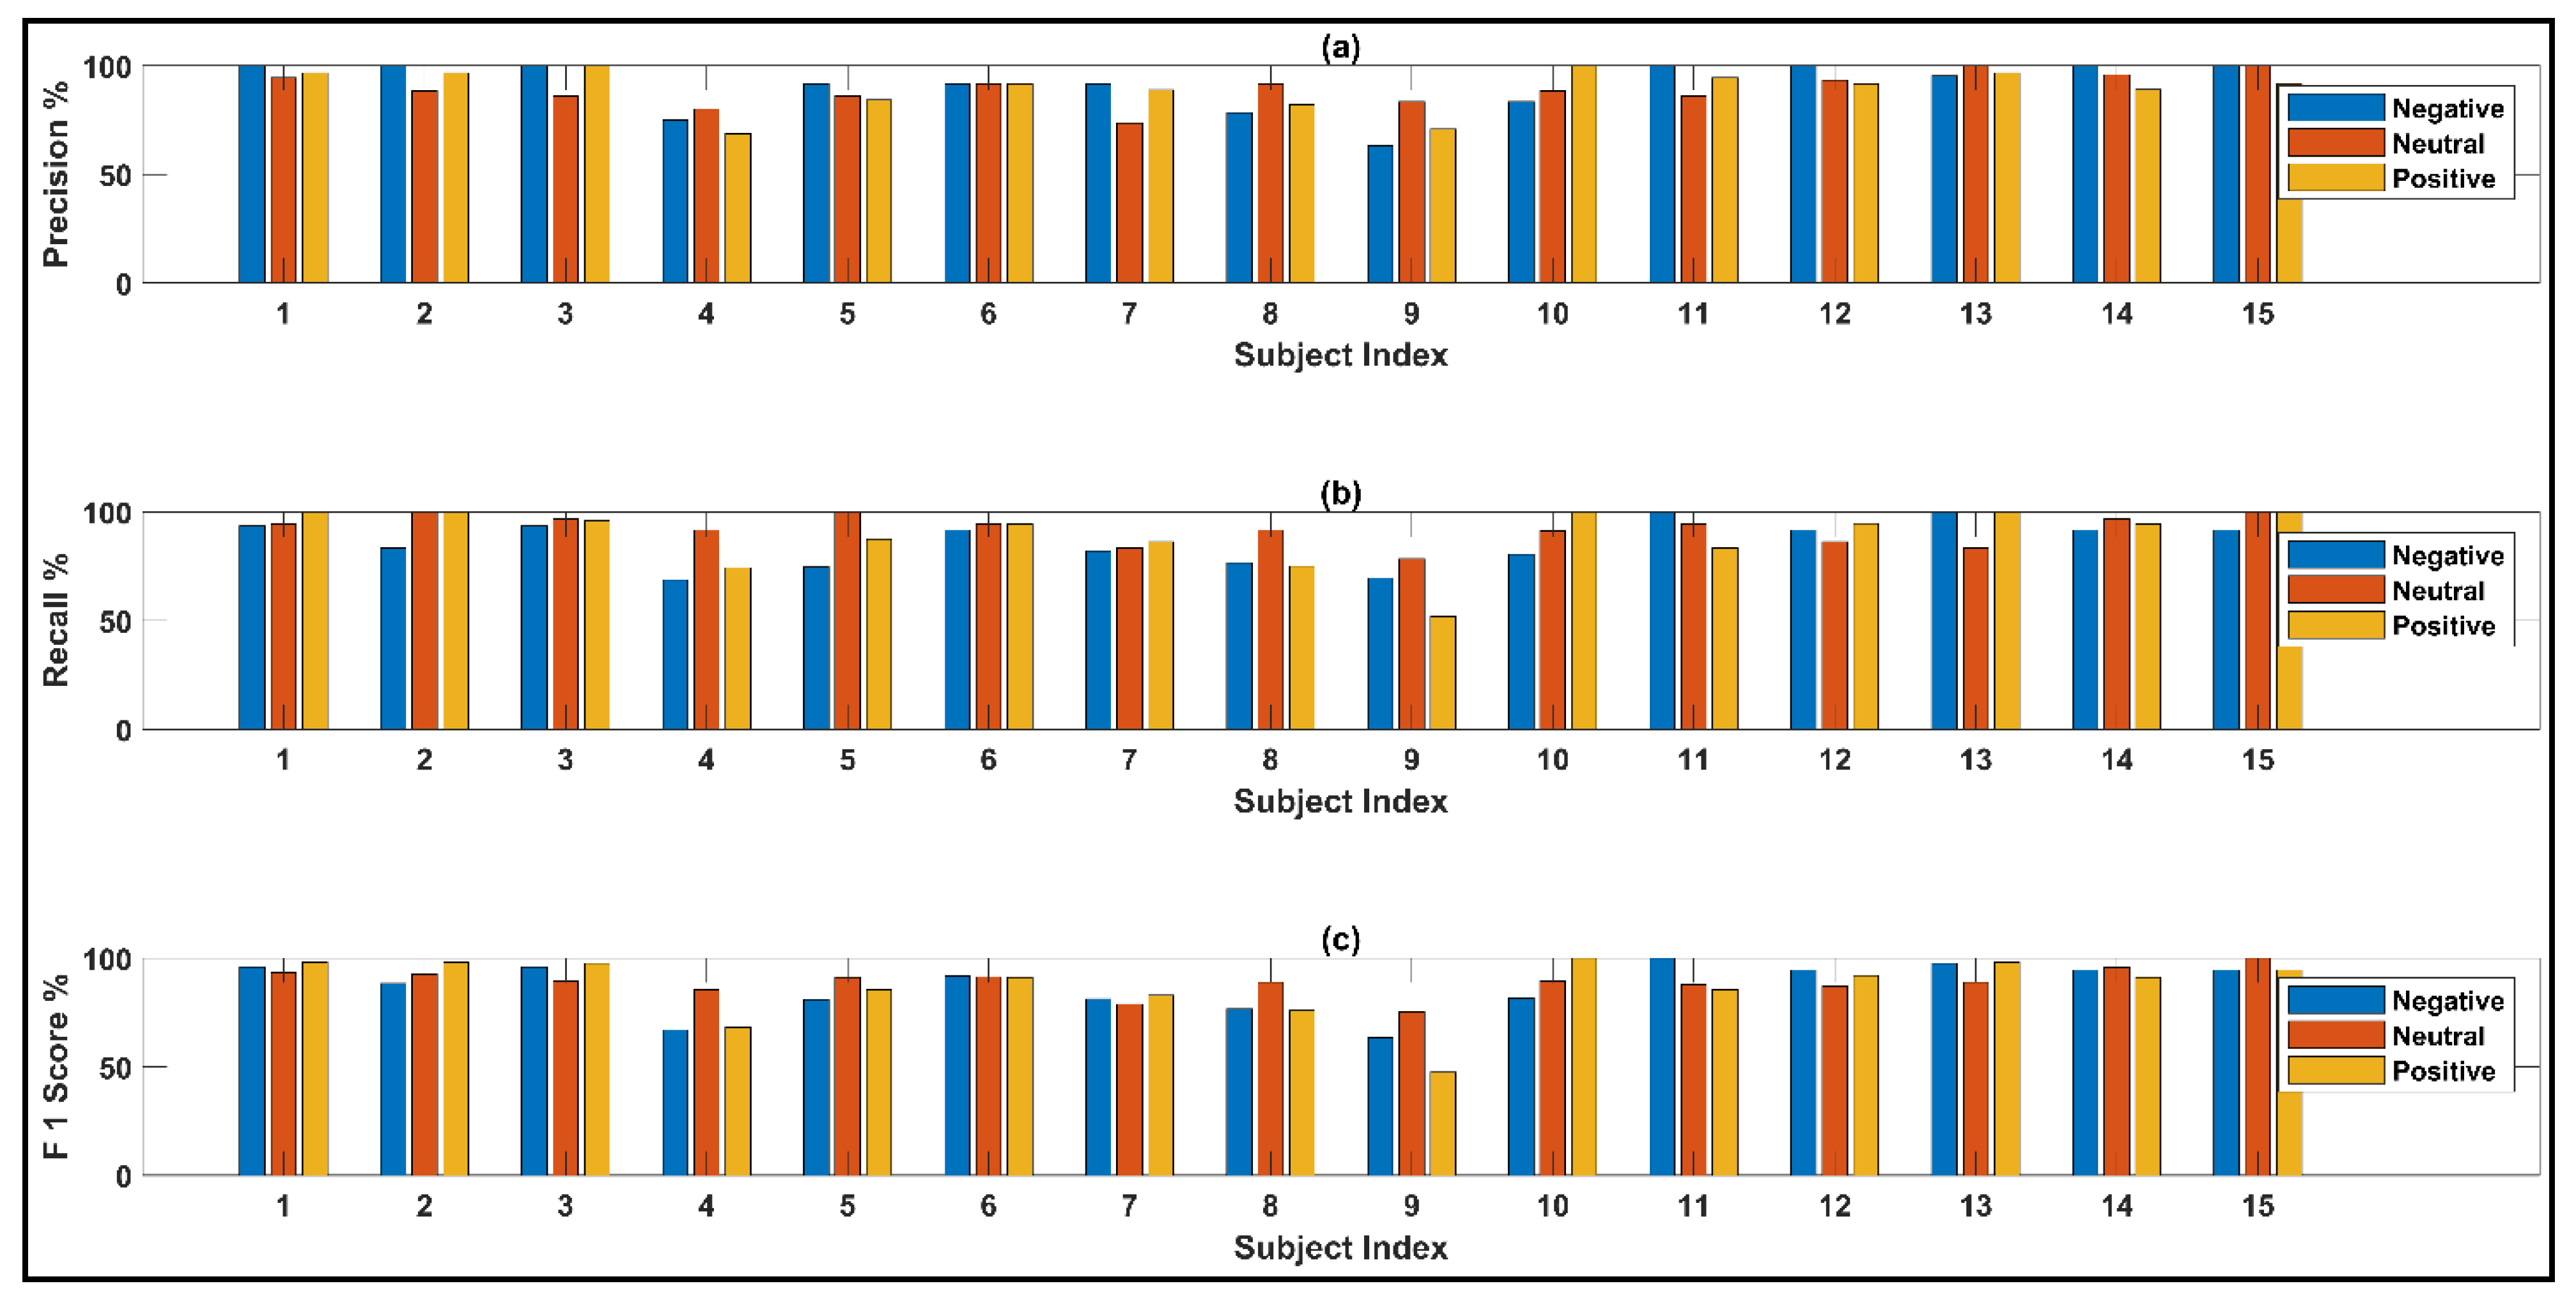
3.4. Training and Method Evaluation
4. Results and Discussion
5. Conclusions
Author Contributions
Funding
Institutional Review Board Statement
Informed Consent Statement
Data Availability Statement
Acknowledgments
Conflicts of Interest
References
- Damasio, A. The Strange Order of Things: Life, Feeling, and the Making of Cultures; Knopf Doubleday Publishing Group: New York, NY, USA, 2018. [Google Scholar]
- Tsuchiya, N.; Adolphs, R. Emotion and consciousness. Trends Cogn. Sci. 2007, 11, 158–167. [Google Scholar] [CrossRef]
- Bhattacharyya, S.; Khasnobish, A.; Ghosh, P.; Mazumder, A.; Tibarewala, D.N. A review on brain imaging tech- niques for BCI applications. In Medical Imaging: Concepts, in Methodologies, Tools, and Applications; IGI Global: Hershey, PA, USA, 2016; pp. 300–331. [Google Scholar] [CrossRef] [Green Version]
- Morin, C. Neuromarketing: The New Science of Consumer Behavior. Society 2011, 48, 131–135. [Google Scholar] [CrossRef] [Green Version]
- Ni, D.; Wang, S.; Liu, G. The EEG-Based Attention Analysis in Multimedia m-Learning. Comput. Math. Methods Med. 2020, 2020, 4837291. [Google Scholar] [CrossRef]
- Tenório, K.; Pereira, E.; Remigio, S.; Costa, D.; Oliveira, W.; Dermeval, D.; da Silva, A.P.; Bittencourt, I.I.; Marques, L.B. Brain-imaging techniques in educational technologies: A systematic literature review. Educ. Inf. Technol. 2021, 27, 1183–1212. [Google Scholar] [CrossRef]
- Katsis, C.D.; Katertsidis, N.; Ganiatsas, G.; Fotiadis, D.I. Toward Emotion Recognition in Car-Racing Drivers: A Biosignal Processing Approach. IEEE Trans. Syst. Man Cybern.-Part A Syst. Hum. 2008, 38, 502–512. [Google Scholar] [CrossRef]
- Ramirez, R.; Planas, J.; Escude, N.; Mercade, J.; Farriols, C. EEG-Based Analysis of the Emotional Effect of Music Therapy on Palliative Care Cancer Patients. Front. Psychol. 2018, 9, 254. [Google Scholar] [CrossRef] [Green Version]
- Golnar-Nik, P.; Farashi, S.; Safari, M.-S. The application of EEG power for the prediction and interpretation of consumer decision-making: A neuromarketing study. Physiol. Behav. 2019, 207, 90–98. [Google Scholar] [CrossRef]
- Zheng, W.-L.; Zhu, J.-Y.; Peng, Y.; Lu, B.-L. EEG-based emotion classification using deep belief networks. In Proceedings of the 2014 IEEE International Conference on Multimedia and Expo (ICME), Chengdu, China, 14–18 July 2014; pp. 1–6. [Google Scholar] [CrossRef]
- Duan, R.-N.; Zhu, J.-Y.; Lu, B.-L. Differential entropy feature for EEG-based emotion classification. In Proceedings of the 2013 6th International IEEE/EMBS Conference on Neural Engineering (NER), SannDiego, CA, USA, 6–8 November 2013; Institute of Electrical and Electronics Engineers (IEEE): New York, NY, USA, 2013; pp. 81–84. [Google Scholar] [CrossRef]
- Zhao, G.; Ge, Y.; Shen, B.; Wei, X.; Wang, H. Emotion Analysis for Personality Inference from EEG Signals. IEEE Trans. Affect. Comput. 2017, 9, 362–371. [Google Scholar] [CrossRef] [Green Version]
- Gao, Q.; Wang, C.-H.; Wang, Z.; Song, X.-L.; Dong, E.-Z.; Song, Y. EEG based emotion recognition using fusion feature extraction method. Multimedia Tools Appl. 2020, 79, 27057–27074. [Google Scholar] [CrossRef]
- Pane, E.S.; Wibawa, A.D.; Purnomo, M.H. Improving the accuracy of EEG emotion recognition by combining valence lateralization and ensemble learning with tuning parameters. Cogn. Process. 2019, 20, 405–417. [Google Scholar] [CrossRef]
- Yin, Z.; Liu, L.; Chen, J.; Zhao, B.; Wang, Y. Locally robust EEG feature selection for individual-independent emotion recognition. Expert Syst. Appl. 2020, 162, 113768. [Google Scholar] [CrossRef]
- Rahman, A.; Hossain, F.; Hossain, M.; Ahmmed, R. Employing PCA and t-statistical approach for feature extraction and classification of emotion from multichannel EEG signal. Egypt. Inform. J. 2019, 21, 23–35. [Google Scholar] [CrossRef]
- Proakis, J.G.; Manolakis, D.G. Digital Signal Processing: Principles, Algorithms, and Applications, 3rd ed.; Prentice-Hall, Inc.: Hoboken, NJ, USA, 1996. [Google Scholar]
- Rahman, A.; Uddin, M.S.; Ahmad, M. Modeling and classification of voluntary and imagery movements for brain–computer interface from fNIR and EEG signals through convolutional neural network. Health Inf. Sci. Syst. 2019, 7, 22. [Google Scholar] [CrossRef]
- Jenke, R.; Peer, A.; Buss, M. Feature Extraction and Selection for Emotion Recognition from EEG. IEEE Trans. Affect. Comput. 2014, 5, 327–339. [Google Scholar] [CrossRef]
- Rahman, A.; Khanam, F.; Ahmad, M.; Uddin, M.S. Multiclass EEG signal classification utilizing Rényi min-entropy-based feature selection from wavelet packet transformation. Brain Inform. 2020, 7, 3. [Google Scholar] [CrossRef] [PubMed]
- Zheng, W.-L.; Lu, B.-L. Investigating Critical Frequency Bands and Channels for EEG-Based Emotion Recognition with Deep Neural Networks. IEEE Trans. Auton. Ment. Dev. 2015, 7, 162–175. [Google Scholar] [CrossRef]
- Zhang, X.; Xu, L.; Xu, L.; Xu, D. Direction of Departure (DOD) and Direction of Arrival (DOA) Estimation in MIMO Radar with Reduced-Dimension MUSIC. IEEE Commun. Lett. 2010, 14, 1161–1163. [Google Scholar] [CrossRef]
- Chen, Q.; Xu, K.; Ta, D. High-resolution Lamb waves dispersion curves estimation and elastic property inversion. Ultrasonics 2021, 115, 106427. [Google Scholar] [CrossRef]
- Beniczky, S.; Oturai, P.S.; Alving, J.; Sabers, A.; Herning, M.; Fabricius, M. Source analysis of epileptic discharges using multiple signal classification analysis. Neuroreport 2006, 17, 1283–1287. [Google Scholar] [CrossRef]
- Mosher, J.C.; Baillet, S.; Leahy, R.M. EEG Source Localization and Imaging Using Multiple Signal Classification Approaches. J. Clin. Neurophysiol. 1999, 16, 225–238. [Google Scholar] [CrossRef]
- Aydın, S. Comparison of Power Spectrum Predictors in Computing Coherence Functions for Intracortical EEG Signals. Ann. Biomed. Eng. 2008, 37, 192–200. [Google Scholar] [CrossRef] [PubMed]
- Siuly, S.; Li, Y. Designing a robust feature extraction method based on optimum allocation and principal component analysis for epileptic EEG signal classification. Comput. Methods Programs Biomed. 2015, 119, 29–42. [Google Scholar] [CrossRef] [PubMed]
- Subasi, A. Practical Guide for Biomedical Signals Analysis Using Machine Learning Techniques; Academic Press: Cambridge, MA, USA, 2019; pp. 27–87. [Google Scholar]
- Mammone, N.; Morabito, F.C. Enhanced Automatic Wavelet Independent Component Analysis for Electroencephalographic Artifact Removal. Entropy 2014, 16, 6553–6572. [Google Scholar] [CrossRef] [Green Version]
- Mammone, N.; La Foresta, F.; Morabito, F.C. Automatic Artifact Rejection From Multichannel Scalp EEG by Wavelet ICA. IEEE Sens. J. 2011, 12, 533–542. [Google Scholar] [CrossRef]
- Wen, F.; Wan, Q.; Fan, R.; Wei, H. Improved MUSIC Algorithm for Multiple Noncoherent Subarrays. IEEE Signal Process. Lett. 2014, 21, 527–530. [Google Scholar] [CrossRef]
- Vergallo, P.; Lay-Ekuakille, A. Brain source localization: A new method based on MUltiple SIgnal Classification algorithm and spatial sparsity of the field signal for electroencephalogram measurements. Rev. Sci. Instrum. 2013, 84, 085117. [Google Scholar] [CrossRef] [PubMed]
- Bhattacharyya, A.; Tripathy, R.K.; Garg, L.; Pachori, R.B. A Novel Multivariate-Multiscale Approach for Computing EEG Spectral and Temporal Complexity for Human Emotion Recognition. IEEE Sens. J. 2020, 21, 3579–3591. [Google Scholar] [CrossRef]
- Zheng, W. Multichannel EEG-Based Emotion Recognition via Group Sparse Canonical Correlation Analysis. IEEE Trans. Cogn. Dev. Syst. 2016, 9, 281–290. [Google Scholar] [CrossRef]
- Wang, F.; Wu, S.; Zhang, W.; Xu, Z.; Zhang, Y.; Wu, C.; Coleman, S. Emotion recognition with convolutional neural network and EEG-based EFDMs. Neuropsychologia 2020, 146, 107506. [Google Scholar] [CrossRef]
- Jin, Y.-M.; Luo, Y.-D.; Zheng, W.-L.; Lu, B.-L. EEG-based emotion recognition using domain adaptation network. In Proceedings of the 2017 International Conference on Orange Technologies (ICOT), Singapore, 8–10 December 2017; pp. 222–225. [Google Scholar] [CrossRef]
- Chen, D.-W.; Miao, R.; Yang, W.-Q.; Liang, Y.; Chen, H.-H.; Huang, L.; Deng, C.-J.; Han, N. A Feature Extraction Method Based on Differential Entropy and Linear Discriminant Analysis for Emotion Recognition. Sensors 2019, 19, 1631. [Google Scholar] [CrossRef] [Green Version]
- Yang, Y.; Wu, Q.M.J.; Zheng, W.-L.; Lu, B.-L. EEG-Based Emotion Recognition Using Hierarchical Network With Subnetwork Nodes. IEEE Trans. Cogn. Dev. Syst. 2017, 10, 408–419. [Google Scholar] [CrossRef]
- Luo, Y.; Lu, B.-L. EEG Data Augmentation for Emotion Recognition Using a Conditional Wasserstein GAN. In Proceedings of the 2018 40th Annual International Conference of the IEEE Engineering in Medicine and Biology Society (EMBC), Honolulu, HI, USA, 18–21 July 2018; pp. 2535–2538. [Google Scholar] [CrossRef]
- Wu, X.; Zheng, W.-L.; Lu, B.-L. Identifying Functional Brain Connectivity Patterns for EEG-Based Emotion Recognition. In Proceedings of the 2019 9th International IEEE/EMBS Conference on Neural Engineering (NER), San Francisco, CA, USA, 20–23 March 2019; pp. 235–238. [Google Scholar] [CrossRef]
- Yang, F.; Zhao, X.; Jiang, W.; Gao, P.; Liu, G. Multi-method Fusion of Cross-Subject Emotion Recognition Based on High-Dimensional EEG Features. Front. Comput. Neurosci. 2019, 13, 53. [Google Scholar] [CrossRef] [PubMed] [Green Version]
- Zheng, W.-L.; Zhu, J.-Y.; Lu, B.-L. Identifying Stable Patterns over Time for Emotion Recognition from EEG. IEEE Trans. Affect. Comput. 2017, 10, 417–429. [Google Scholar] [CrossRef] [Green Version]
- Rahman, A.; Anjum, A.; Milu, M.H.; Khanam, F.; Uddin, M.S.; Mollah, N. Emotion recognition from EEG-based relative power spectral topography using convolutional neural network. Array 2021, 11, 100072. [Google Scholar] [CrossRef]


| State | Sub 1 | Sub 2 | Sub 3 | Sub 4 | Sub 5 | Sub 6 | Sub 7 | Sub 8 | Sub 9 | Sub 10 | Sub 11 | Sub 12 | Sub 13 | Sub 14 | Sub 15 |
|---|---|---|---|---|---|---|---|---|---|---|---|---|---|---|---|
| Negative | 15 | 2 | 1 | 1 | 6 | 12 | 0 | 0 | 0 | 1 | 0 | 0 | 8 | 3 | 15 |
| Neutral | 9 | 0 | 0 | 0 | 0 | 2 | 2 | 0 | 0 | 2 | 0 | 3 | 0 | 1 | 2 |
| Positive | 10 | 4 | 1 | 0 | 2 | 2 | 0 | 2 | 0 | 3 | 0 | 3 | 0 | 2 | 3 |
| Author and Research | Feature Extraction Method | Classification Method | Average Accuracy |
|---|---|---|---|
| Y. Jin et al. [36] | Differential Entropy | Domain Adaptive Network | 79.19% |
| D. W. Chen et al. [37] | Differential Entropy | Linear Discriminant Analysis | 82.5% |
| W. L. Zheng et al. [21] | Critical Frequency Band Investigation | Deep Belief Network | 86.08% |
| Y. Yang [38] | Differential Entropy | Hierarchical Network | 86.42% |
| M. A. Rahman et al. [16] | PCA and non-parametric Welch model | ANN | 86.57% |
| W. Zheng et al. [34] | Parametric Model | Group Sparse Canonical Correlation Analysis | 86.65% |
| Y. Luo et al. [39] | Data augmentation approach | Generative adversarial network | 87% |
| X. Wu et al. [40] | Connectivity Network | SVM | 87% |
| F. Yang et al. [41] | High dimensional features | ST-SBSSVM | 89% |
| F. Wang et al. [35] | STFT | CNN | 90.59% |
| W. Zheng et al. [42] | Differential Entropy | Discriminative graph regularized | 91% |
| A. Bhattacharyya et al. [33] | Wavelet-based decomposition | Random Forest (Autoencoder based) | 94.4% |
| M. A. Rahman et al. [43] | Welch topographic map | CNN | 94.63% |
| Proposed Method | MUSIC model (Includes all 62 channels) | Bilayer ANN | 97% |
| Trial Dimension | Channel Length | Computation Time (s) | Optimization % | |
|---|---|---|---|---|
| Welch Based Model | MUSIC Based Model | |||
| 62 × N | Below 40,000 | 28.30 s | 1.32 s | 95.33% |
| 40,000 to 45,000 | 31.09 s | 1.35 s | 95.65% | |
| 45,000 to 50,000 | 35.05 s | 1.38 s | 96.07% | |
| 50,000 to 55,000 | 39.36 s | 1.39 s | 96.47% | |
| 5 × N | Below 40,000 | 2.37 s | 0.12 s | 94.94% |
| 40,000 to 45,000 | 2.46 s | 0.14 s | 94.31% | |
| 45,000 to 50,000 | 2.64 s | 0.13 s | 95.07% | |
| 50,000 to 55,000 | 2.79 s | 0.13 s | 95.34% | |
Disclaimer/Publisher’s Note: The statements, opinions and data contained in all publications are solely those of the individual author(s) and contributor(s) and not of MDPI and/or the editor(s). MDPI and/or the editor(s) disclaim responsibility for any injury to people or property resulting from any ideas, methods, instructions or products referred to in the content. |
© 2023 by the authors. Licensee MDPI, Basel, Switzerland. This article is an open access article distributed under the terms and conditions of the Creative Commons Attribution (CC BY) license (https://creativecommons.org/licenses/by/4.0/).
Share and Cite
Hossain, S.A.; Rahman, M.A.; Chakrabarty, A.; Rashid, M.A.; Kuwana, A.; Kobayashi, H. Emotional State Classification from MUSIC-Based Features of Multichannel EEG Signals. Bioengineering 2023, 10, 99. https://doi.org/10.3390/bioengineering10010099
Hossain SA, Rahman MA, Chakrabarty A, Rashid MA, Kuwana A, Kobayashi H. Emotional State Classification from MUSIC-Based Features of Multichannel EEG Signals. Bioengineering. 2023; 10(1):99. https://doi.org/10.3390/bioengineering10010099
Chicago/Turabian StyleHossain, Sakib Abrar, Md. Asadur Rahman, Amitabha Chakrabarty, Mohd Abdur Rashid, Anna Kuwana, and Haruo Kobayashi. 2023. "Emotional State Classification from MUSIC-Based Features of Multichannel EEG Signals" Bioengineering 10, no. 1: 99. https://doi.org/10.3390/bioengineering10010099